prams health indicator report - drinking alcohol last...
TRANSCRIPT
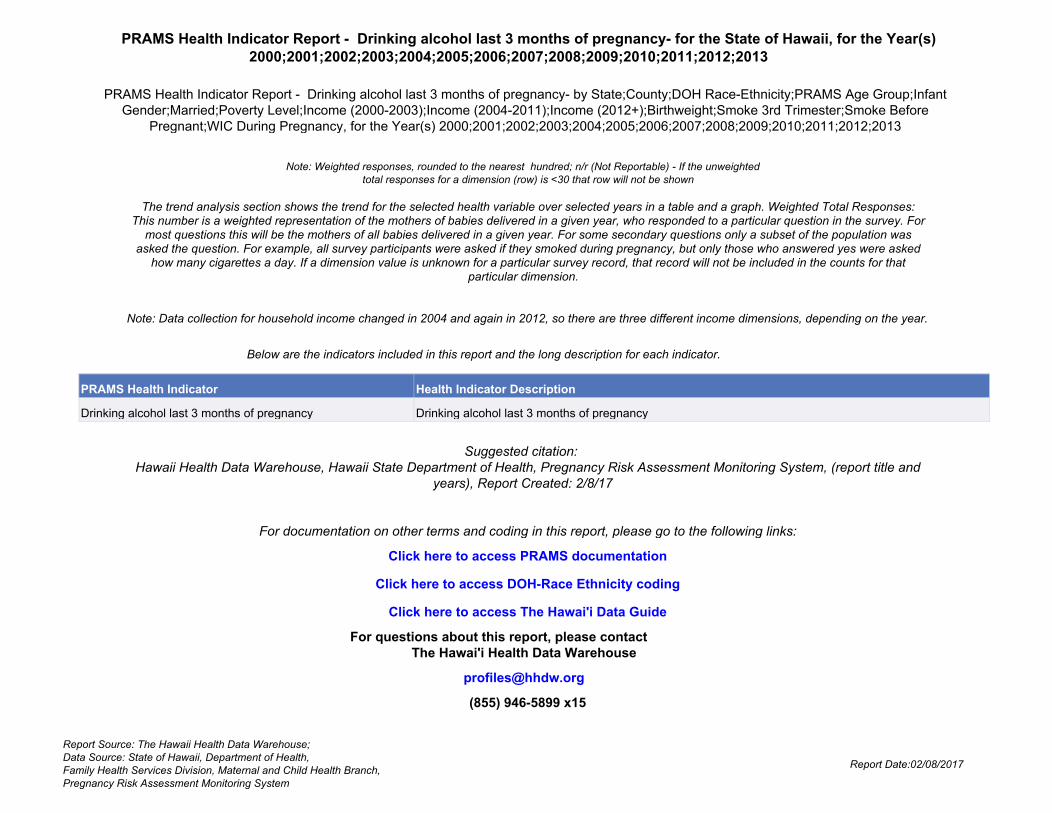
Note: Weighted responses, rounded to the nearest hundred; n/r (Not Reportable) - If the unweighted total responses for a dimension (row) is <30 that row will not be shown
The trend analysis section shows the trend for the selected health variable over selected years in a table and a graph. Weighted Total Responses:This number is a weighted representation of the mothers of babies delivered in a given year, who responded to a particular question in the survey. For
most questions this will be the mothers of all babies delivered in a given year. For some secondary questions only a subset of the population wasasked the question. For example, all survey participants were asked if they smoked during pregnancy, but only those who answered yes were asked
how many cigarettes a day. If a dimension value is unknown for a particular survey record, that record will not be included in the counts for thatparticular dimension.
Suggested citation: Hawaii Health Data Warehouse, Hawaii State Department of Health, Pregnancy Risk Assessment Monitoring System, (report title and
years), Report Created: 2/8/17
For documentation on other terms and coding in this report, please go to the following links:
Click here to access DOH-Race Ethnicity coding
Click here to access PRAMS documentation
Click here to access The Hawai'i Data Guide
For questions about this report, please contact The Hawai'i Health Data Warehouse
(855) 946-5899 x15
PRAMS Health Indicator Report - Drinking alcohol last 3 months of pregnancy- for the State of Hawaii, for the Year(s)2000;2001;2002;2003;2004;2005;2006;2007;2008;2009;2010;2011;2012;2013
Note: Data collection for household income changed in 2004 and again in 2012, so there are three different income dimensions, depending on the year.
Below are the indicators included in this report and the long description for each indicator.
PRAMS Health Indicator Health Indicator Description
Drinking alcohol last 3 months of pregnancy Drinking alcohol last 3 months of pregnancy
PRAMS Health Indicator Report - Drinking alcohol last 3 months of pregnancy- by State;County;DOH Race-Ethnicity;PRAMS Age Group;InfantGender;Married;Poverty Level;Income (2000-2003);Income (2004-2011);Income (2012+);Birthweight;Smoke 3rd Trimester;Smoke Before
Pregnant;WIC During Pregnancy, for the Year(s) 2000;2001;2002;2003;2004;2005;2006;2007;2008;2009;2010;2011;2012;2013
Report Source: The Hawaii Health Data Warehouse; Data Source: State of Hawaii, Department of Health, Family Health Services Division, Maternal and Child Health Branch, Pregnancy Risk Assessment Monitoring System
Report Date:02/08/2017
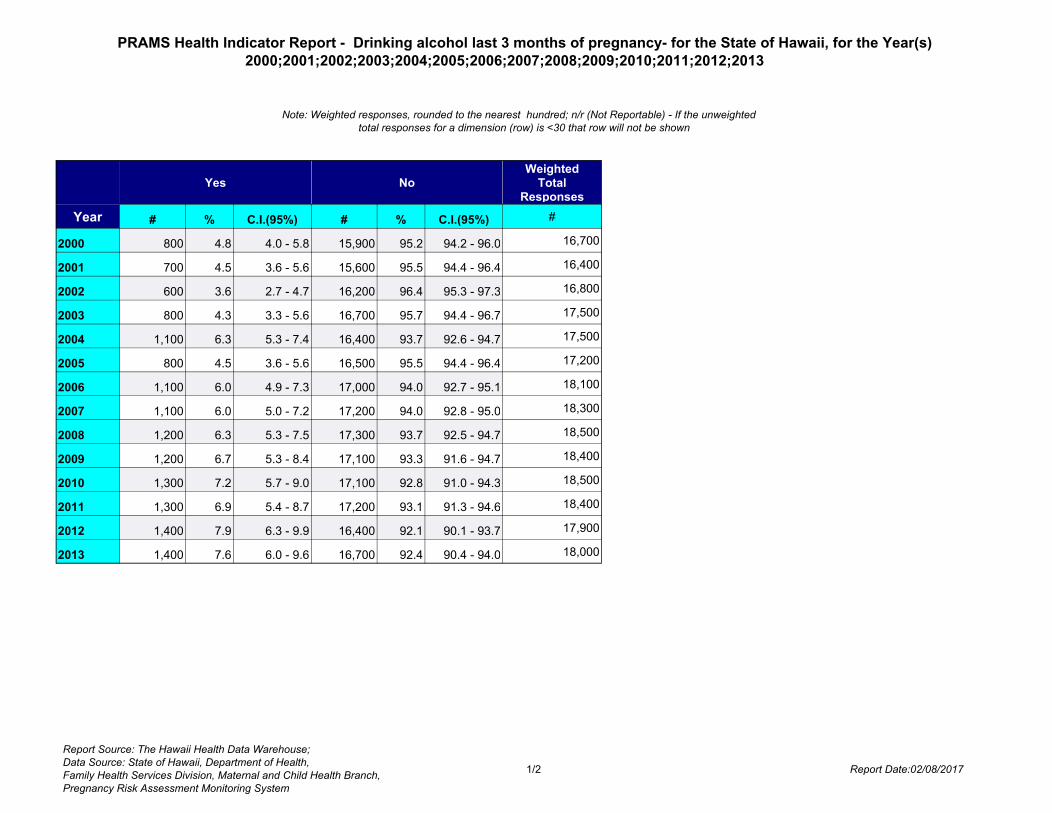
PRAMS Health Indicator Report - Drinking alcohol last 3 months of pregnancy- for the State of Hawaii, for the Year(s)2000;2001;2002;2003;2004;2005;2006;2007;2008;2009;2010;2011;2012;2013
Note: Weighted responses, rounded to the nearest hundred; n/r (Not Reportable) - If the unweighted total responses for a dimension (row) is <30 that row will not be shown
Yes NoWeighted
TotalResponses
Year # % C.I.(95%) # % C.I.(95%) #
2000 800 4.8 4.0 - 5.8 15,900 95.2 94.2 - 96.0 16,700
2001 700 4.5 3.6 - 5.6 15,600 95.5 94.4 - 96.4 16,400
2002 600 3.6 2.7 - 4.7 16,200 96.4 95.3 - 97.3 16,800
2003 800 4.3 3.3 - 5.6 16,700 95.7 94.4 - 96.7 17,500
2004 1,100 6.3 5.3 - 7.4 16,400 93.7 92.6 - 94.7 17,500
2005 800 4.5 3.6 - 5.6 16,500 95.5 94.4 - 96.4 17,200
2006 1,100 6.0 4.9 - 7.3 17,000 94.0 92.7 - 95.1 18,100
2007 1,100 6.0 5.0 - 7.2 17,200 94.0 92.8 - 95.0 18,300
2008 1,200 6.3 5.3 - 7.5 17,300 93.7 92.5 - 94.7 18,500
2009 1,200 6.7 5.3 - 8.4 17,100 93.3 91.6 - 94.7 18,400
2010 1,300 7.2 5.7 - 9.0 17,100 92.8 91.0 - 94.3 18,500
2011 1,300 6.9 5.4 - 8.7 17,200 93.1 91.3 - 94.6 18,400
2012 1,400 7.9 6.3 - 9.9 16,400 92.1 90.1 - 93.7 17,900
2013 1,400 7.6 6.0 - 9.6 16,700 92.4 90.4 - 94.0 18,000
Report Source: The Hawaii Health Data Warehouse; Data Source: State of Hawaii, Department of Health, Family Health Services Division, Maternal and Child Health Branch, Pregnancy Risk Assessment Monitoring System
Report Date:02/08/20171/2

PRAMS Health Indicator Report - Drinking alcohol last 3 months of pregnancy- for the State of Hawaii, for the Year(s) 2000;2001;2002;2003;2004;2005;2006;2007;2008;2009;2010;2011;2012;2013
Note: Weighted responses, rounded to the nearest hundred; n/r (Not Reportable) - If the unweighted total responses for a dimension (row) is <30 that row will not be shown
Report Source: The Hawaii Health Data Warehouse; Data Source: State of Hawaii, Department of Health, Family Health Services Division, Maternal and Child Health Branch, Pregnancy Risk Assessment Monitoring System
Report Date:02/08/20172/2

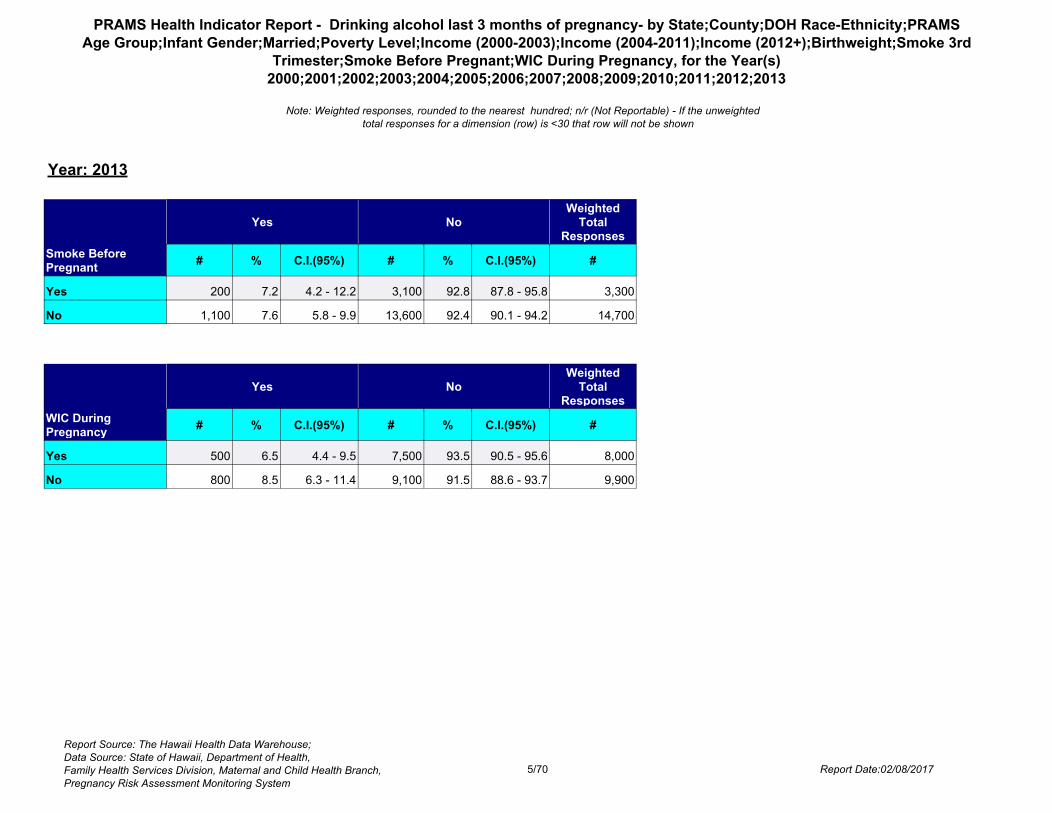
PRAMS Health Indicator Report - Drinking alcohol last 3 months of pregnancy- by State;County;DOH Race-Ethnicity;PRAMSAge Group;Infant Gender;Married;Poverty Level;Income (2000-2003);Income (2004-2011);Income (2012+);Birthweight;Smoke 3rd
Trimester;Smoke Before Pregnant;WIC During Pregnancy, for the Year(s)2000;2001;2002;2003;2004;2005;2006;2007;2008;2009;2010;2011;2012;2013
Note: Weighted responses, rounded to the nearest hundred; n/r (Not Reportable) - If the unweighted total responses for a dimension (row) is <30 that row will not be shown
Year: 2013
State
Yes NoWeighted
TotalResponses
# % C.I.(95%) # % C.I.(95%) #
Totals 1,400 7.6 6.0 - 9.6 16,700 92.4 90.4 - 94.0 18,000
County
Yes NoWeighted
TotalResponses
# % C.I.(95%) # % C.I.(95%) #
Hawaii 200 8.3 5.8 - 11.9 2,100 91.7 88.1 - 94.2 2,300
Honolulu 900 7.0 5.0 - 9.8 12,000 93.0 90.2 - 95.0 12,900
Kauai 100 10.2 7.4 - 14.0 700 89.8 86.0 - 92.6 800
Maui 200 9.4 6.6 - 13.2 1,800 90.6 86.8 - 93.4 2,000
Report Source: The Hawaii Health Data Warehouse; Data Source: State of Hawaii, Department of Health, Family Health Services Division, Maternal and Child Health Branch, Pregnancy Risk Assessment Monitoring System
Report Date:02/08/20171/70

PRAMS Health Indicator Report - Drinking alcohol last 3 months of pregnancy- by State;County;DOH Race-Ethnicity;PRAMSAge Group;Infant Gender;Married;Poverty Level;Income (2000-2003);Income (2004-2011);Income (2012+);Birthweight;Smoke 3rd
Trimester;Smoke Before Pregnant;WIC During Pregnancy, for the Year(s)2000;2001;2002;2003;2004;2005;2006;2007;2008;2009;2010;2011;2012;2013
Note: Weighted responses, rounded to the nearest hundred; n/r (Not Reportable) - If the unweighted total responses for a dimension (row) is <30 that row will not be shown
Year: 2013
DOH Race-Ethnicity
Yes NoWeighted
TotalResponses
# % C.I.(95%) # % C.I.(95%) #
Caucasian 500 10.1 6.8 - 14.7 4,200 89.9 85.3 - 93.2 4,700
Native Hawaiian 400 7.3 4.8 - 11.1 5,000 92.7 88.9 - 95.2 5,400
Chinese 100 12.4 4.6 - 29.4 800 87.6 70.6 - 95.4 900
Filipino 100 3.9 1.8 - 8.3 2,800 96.1 91.7 - 98.2 2,900
Japanese 100 4.5 1.6 - 11.9 1,700 95.5 88.1 - 98.4 1,800
Other 200 8.3 4.3 - 15.6 2,100 91.7 84.4 - 95.7 2,300
PRAMS AgeGroup
Yes NoWeighted
TotalResponses
# % C.I.(95%) # % C.I.(95%) #
<20 <50 1.2 0.3 - 4.8 900 98.8 95.2 - 99.7 900
20-24 300 6.5 3.5 - 12.0 3,800 93.5 88.0 - 96.5 4,000
25-34 700 7.4 5.4 - 10.1 9,000 92.6 89.9 - 94.6 9,700
35+ 400 10.9 7.1 - 16.4 3,000 89.1 83.6 - 92.9 3,400
Report Source: The Hawaii Health Data Warehouse; Data Source: State of Hawaii, Department of Health, Family Health Services Division, Maternal and Child Health Branch, Pregnancy Risk Assessment Monitoring System
Report Date:02/08/20172/70

PRAMS Health Indicator Report - Drinking alcohol last 3 months of pregnancy- by State;County;DOH Race-Ethnicity;PRAMSAge Group;Infant Gender;Married;Poverty Level;Income (2000-2003);Income (2004-2011);Income (2012+);Birthweight;Smoke 3rd
Trimester;Smoke Before Pregnant;WIC During Pregnancy, for the Year(s)2000;2001;2002;2003;2004;2005;2006;2007;2008;2009;2010;2011;2012;2013
Note: Weighted responses, rounded to the nearest hundred; n/r (Not Reportable) - If the unweighted total responses for a dimension (row) is <30 that row will not be shown
Year: 2013
Infant Gender
Yes NoWeighted
TotalResponses
# % C.I.(95%) # % C.I.(95%) #
Male 800 8.7 6.3 - 11.9 8,100 91.3 88.1 - 93.7 8,900
Female 600 6.5 4.6 - 9.2 8,600 93.5 90.8 - 95.4 9,200
Married
Yes NoWeighted
TotalResponses
# % C.I.(95%) # % C.I.(95%) #
Yes 900 7.7 5.7 - 10.3 10,600 92.3 89.7 - 94.3 11,400
No 500 7.4 5.1 - 10.7 6,100 92.6 89.3 - 94.9 6,600
Poverty Level
Yes NoWeighted
TotalResponses
# % C.I.(95%) # % C.I.(95%) #
0-130% 500 7.0 4.6 - 10.6 6,200 93.0 89.4 - 95.4 6,700
131-185% 100 3.9 1.8 - 8.5 2,300 96.1 91.5 - 98.2 2,400
186+% 700 9.9 7.1 - 13.6 6,500 90.1 86.4 - 92.9 7,200
Report Source: The Hawaii Health Data Warehouse; Data Source: State of Hawaii, Department of Health, Family Health Services Division, Maternal and Child Health Branch, Pregnancy Risk Assessment Monitoring System
Report Date:02/08/20173/70

PRAMS Health Indicator Report - Drinking alcohol last 3 months of pregnancy- by State;County;DOH Race-Ethnicity;PRAMSAge Group;Infant Gender;Married;Poverty Level;Income (2000-2003);Income (2004-2011);Income (2012+);Birthweight;Smoke 3rd
Trimester;Smoke Before Pregnant;WIC During Pregnancy, for the Year(s)2000;2001;2002;2003;2004;2005;2006;2007;2008;2009;2010;2011;2012;2013
Note: Weighted responses, rounded to the nearest hundred; n/r (Not Reportable) - If the unweighted total responses for a dimension (row) is <30 that row will not be shown
Year: 2013
Income (2012+)
Yes NoWeighted
TotalResponses
# % C.I.(95%) # % C.I.(95%) #
<=$17,000 300 6.8 3.9 - 11.4 3,900 93.2 88.6 - 96.1 4,200
$17,001-$26,000 200 6.8 3.5 - 12.7 2,200 93.2 87.3 - 96.5 2,400
$26,001-$51,000 200 6.1 3.4 - 10.9 3,700 93.9 89.1 - 96.6 3,900
>=$51,001 600 9.7 6.8 - 13.7 5,500 90.3 86.3 - 93.2 6,100
Birthweight
Yes NoWeighted
TotalResponses
# % C.I.(95%) # % C.I.(95%) #
Low birth weight 100 8.7 6.2 - 11.9 1,200 91.3 88.1 - 93.8 1,300
Normal birth weight 1,300 7.5 5.8 - 9.7 15,400 92.5 90.3 - 94.2 16,700
Smoke 3rdTrimester
Yes NoWeighted
TotalResponses
# % C.I.(95%) # % C.I.(95%) #
Yes 100 11.4 5.3 - 22.6 900 88.6 77.4 - 94.7 1,000
No 1,300 7.4 5.7 - 9.4 15,700 92.6 90.6 - 94.3 17,000
Report Source: The Hawaii Health Data Warehouse; Data Source: State of Hawaii, Department of Health, Family Health Services Division, Maternal and Child Health Branch, Pregnancy Risk Assessment Monitoring System
Report Date:02/08/20174/70
PRAMS Health Indicator Report - Drinking alcohol last 3 months of pregnancy- by State;County;DOH Race-Ethnicity;PRAMSAge Group;Infant Gender;Married;Poverty Level;Income (2000-2003);Income (2004-2011);Income (2012+);Birthweight;Smoke 3rd
Trimester;Smoke Before Pregnant;WIC During Pregnancy, for the Year(s)2000;2001;2002;2003;2004;2005;2006;2007;2008;2009;2010;2011;2012;2013
Note: Weighted responses, rounded to the nearest hundred; n/r (Not Reportable) - If the unweighted total responses for a dimension (row) is <30 that row will not be shown
Year: 2013
Smoke BeforePregnant
Yes NoWeighted
TotalResponses
# % C.I.(95%) # % C.I.(95%) #
Yes 200 7.2 4.2 - 12.2 3,100 92.8 87.8 - 95.8 3,300
No 1,100 7.6 5.8 - 9.9 13,600 92.4 90.1 - 94.2 14,700
WIC DuringPregnancy
Yes NoWeighted
TotalResponses
# % C.I.(95%) # % C.I.(95%) #
Yes 500 6.5 4.4 - 9.5 7,500 93.5 90.5 - 95.6 8,000
No 800 8.5 6.3 - 11.4 9,100 91.5 88.6 - 93.7 9,900
Report Source: The Hawaii Health Data Warehouse; Data Source: State of Hawaii, Department of Health, Family Health Services Division, Maternal and Child Health Branch, Pregnancy Risk Assessment Monitoring System
Report Date:02/08/20175/70

PRAMS Health Indicator Report - Drinking alcohol last 3 months of pregnancy- by State;County;DOH Race-Ethnicity;PRAMSAge Group;Infant Gender;Married;Poverty Level;Income (2000-2003);Income (2004-2011);Income (2012+);Birthweight;Smoke 3rd
Trimester;Smoke Before Pregnant;WIC During Pregnancy, for the Year(s)2000;2001;2002;2003;2004;2005;2006;2007;2008;2009;2010;2011;2012;2013
Note: Weighted responses, rounded to the nearest hundred; n/r (Not Reportable) - If the unweighted total responses for a dimension (row) is <30 that row will not be shown
Year: 2012
State
Yes NoWeighted
TotalResponses
# % C.I.(95%) # % C.I.(95%) #
Totals 1,400 7.9 6.3 - 9.9 16,400 92.1 90.1 - 93.7 17,900
County
Yes NoWeighted
TotalResponses
# % C.I.(95%) # % C.I.(95%) #
Hawaii 100 6.7 4.4 - 9.9 2,100 93.3 90.1 - 95.6 2,200
Honolulu 1,000 7.6 5.6 - 10.3 11,900 92.4 89.7 - 94.4 12,900
Kauai 100 13.6 9.8 - 18.7 700 86.4 81.3 - 90.2 800
Maui 200 9.0 6.6 - 12.2 1,700 91.0 87.8 - 93.4 1,900
Report Source: The Hawaii Health Data Warehouse; Data Source: State of Hawaii, Department of Health, Family Health Services Division, Maternal and Child Health Branch, Pregnancy Risk Assessment Monitoring System
Report Date:02/08/20176/70

PRAMS Health Indicator Report - Drinking alcohol last 3 months of pregnancy- by State;County;DOH Race-Ethnicity;PRAMSAge Group;Infant Gender;Married;Poverty Level;Income (2000-2003);Income (2004-2011);Income (2012+);Birthweight;Smoke 3rd
Trimester;Smoke Before Pregnant;WIC During Pregnancy, for the Year(s)2000;2001;2002;2003;2004;2005;2006;2007;2008;2009;2010;2011;2012;2013
Note: Weighted responses, rounded to the nearest hundred; n/r (Not Reportable) - If the unweighted total responses for a dimension (row) is <30 that row will not be shown
Year: 2012
DOH Race-Ethnicity
Yes NoWeighted
TotalResponses
# % C.I.(95%) # % C.I.(95%) #
Caucasian 500 12.4 8.7 - 17.4 3,600 87.6 82.6 - 91.3 4,100
Native Hawaiian 400 7.1 4.6 - 10.9 4,600 92.9 89.1 - 95.4 5,000
Chinese 100 6.5 2.0 - 19.1 1,000 93.5 80.9 - 98.0 1,000
Filipino 300 8.2 4.7 - 13.9 2,900 91.8 86.1 - 95.3 3,200
Japanese 100 6.5 2.7 - 14.9 1,400 93.5 85.1 - 97.3 1,500
Other 100 3.9 1.6 - 9.2 2,800 96.1 90.8 - 98.4 3,000
PRAMS AgeGroup
Yes NoWeighted
TotalResponses
# % C.I.(95%) # % C.I.(95%) #
<20 100 6.7 1.9 - 20.8 1,000 93.3 79.2 - 98.1 1,000
20-24 300 8.3 5.0 - 13.5 3,300 91.7 86.5 - 95.0 3,600
25-34 700 7.1 5.2 - 9.5 9,300 92.9 90.5 - 94.8 10,000
35+ 300 10.6 6.6 - 16.4 2,900 89.4 83.6 - 93.4 3,200
Report Source: The Hawaii Health Data Warehouse; Data Source: State of Hawaii, Department of Health, Family Health Services Division, Maternal and Child Health Branch, Pregnancy Risk Assessment Monitoring System
Report Date:02/08/20177/70

PRAMS Health Indicator Report - Drinking alcohol last 3 months of pregnancy- by State;County;DOH Race-Ethnicity;PRAMSAge Group;Infant Gender;Married;Poverty Level;Income (2000-2003);Income (2004-2011);Income (2012+);Birthweight;Smoke 3rd
Trimester;Smoke Before Pregnant;WIC During Pregnancy, for the Year(s)2000;2001;2002;2003;2004;2005;2006;2007;2008;2009;2010;2011;2012;2013
Note: Weighted responses, rounded to the nearest hundred; n/r (Not Reportable) - If the unweighted total responses for a dimension (row) is <30 that row will not be shown
Year: 2012
Infant Gender
Yes NoWeighted
TotalResponses
# % C.I.(95%) # % C.I.(95%) #
Male 800 9.1 6.7 - 12.3 8,000 90.9 87.7 - 93.3 8,800
Female 600 6.7 4.8 - 9.3 8,400 93.3 90.7 - 95.2 9,000
Married
Yes NoWeighted
TotalResponses
# % C.I.(95%) # % C.I.(95%) #
Yes 900 8.1 6.1 - 10.8 10,100 91.9 89.2 - 93.9 11,000
No 500 7.6 5.3 - 10.8 6,400 92.4 89.2 - 94.7 6,900
Poverty Level
Yes NoWeighted
TotalResponses
# % C.I.(95%) # % C.I.(95%) #
0-130% 400 6.6 4.4 - 9.7 6,000 93.4 90.3 - 95.6 6,400
131-185% 200 5.4 2.6 - 11.0 2,800 94.6 89.0 - 97.4 3,000
186+% 700 10.5 7.7 - 14.2 6,000 89.5 85.8 - 92.3 6,700
Report Source: The Hawaii Health Data Warehouse; Data Source: State of Hawaii, Department of Health, Family Health Services Division, Maternal and Child Health Branch, Pregnancy Risk Assessment Monitoring System
Report Date:02/08/20178/70

PRAMS Health Indicator Report - Drinking alcohol last 3 months of pregnancy- by State;County;DOH Race-Ethnicity;PRAMSAge Group;Infant Gender;Married;Poverty Level;Income (2000-2003);Income (2004-2011);Income (2012+);Birthweight;Smoke 3rd
Trimester;Smoke Before Pregnant;WIC During Pregnancy, for the Year(s)2000;2001;2002;2003;2004;2005;2006;2007;2008;2009;2010;2011;2012;2013
Note: Weighted responses, rounded to the nearest hundred; n/r (Not Reportable) - If the unweighted total responses for a dimension (row) is <30 that row will not be shown
Year: 2012
Income (2012+)
Yes NoWeighted
TotalResponses
# % C.I.(95%) # % C.I.(95%) #
<=$17,000 200 4.7 2.6 - 8.4 3,900 95.3 91.6 - 97.4 4,100
$17,001-$26,000 200 8.7 4.9 - 15.0 2,000 91.3 85.0 - 95.1 2,200
$26,001-$51,000 300 6.9 4.1 - 11.4 4,000 93.1 88.6 - 95.9 4,300
>=$51,001 600 10.5 7.5 - 14.7 5,200 89.5 85.3 - 92.5 5,800
Birthweight
Yes NoWeighted
TotalResponses
# % C.I.(95%) # % C.I.(95%) #
Low birth weight 100 6.6 4.2 - 10.1 1,100 93.4 89.9 - 95.8 1,200
Normal birth weight 1,300 8.0 6.3 - 10.1 15,300 92.0 89.9 - 93.7 16,600
Smoke 3rdTrimester
Yes NoWeighted
TotalResponses
# % C.I.(95%) # % C.I.(95%) #
Yes 100 9.8 4.0 - 22.3 700 90.2 77.7 - 96.0 700
No 1,300 7.9 6.2 - 9.9 15,700 92.1 90.1 - 93.8 17,000
Report Source: The Hawaii Health Data Warehouse; Data Source: State of Hawaii, Department of Health, Family Health Services Division, Maternal and Child Health Branch, Pregnancy Risk Assessment Monitoring System
Report Date:02/08/20179/70

PRAMS Health Indicator Report - Drinking alcohol last 3 months of pregnancy- by State;County;DOH Race-Ethnicity;PRAMSAge Group;Infant Gender;Married;Poverty Level;Income (2000-2003);Income (2004-2011);Income (2012+);Birthweight;Smoke 3rd
Trimester;Smoke Before Pregnant;WIC During Pregnancy, for the Year(s)2000;2001;2002;2003;2004;2005;2006;2007;2008;2009;2010;2011;2012;2013
Note: Weighted responses, rounded to the nearest hundred; n/r (Not Reportable) - If the unweighted total responses for a dimension (row) is <30 that row will not be shown
Year: 2012
Smoke BeforePregnant
Yes NoWeighted
TotalResponses
# % C.I.(95%) # % C.I.(95%) #
Yes 200 7.6 4.4 - 12.8 2,600 92.4 87.2 - 95.6 2,900
No 1,200 8.0 6.3 - 10.2 13,700 92.0 89.8 - 93.7 14,900
WIC DuringPregnancy
Yes NoWeighted
TotalResponses
# % C.I.(95%) # % C.I.(95%) #
Yes 500 5.9 4.1 - 8.6 7,600 94.1 91.4 - 95.9 8,100
No 900 9.6 7.2 - 12.6 8,700 90.4 87.4 - 92.8 9,700
Report Source: The Hawaii Health Data Warehouse; Data Source: State of Hawaii, Department of Health, Family Health Services Division, Maternal and Child Health Branch, Pregnancy Risk Assessment Monitoring System
Report Date:02/08/201710/70

PRAMS Health Indicator Report - Drinking alcohol last 3 months of pregnancy- by State;County;DOH Race-Ethnicity;PRAMSAge Group;Infant Gender;Married;Poverty Level;Income (2000-2003);Income (2004-2011);Income (2012+);Birthweight;Smoke 3rd
Trimester;Smoke Before Pregnant;WIC During Pregnancy, for the Year(s)2000;2001;2002;2003;2004;2005;2006;2007;2008;2009;2010;2011;2012;2013
Note: Weighted responses, rounded to the nearest hundred; n/r (Not Reportable) - If the unweighted total responses for a dimension (row) is <30 that row will not be shown
Year: 2011
State
Yes NoWeighted
TotalResponses
# % C.I.(95%) # % C.I.(95%) #
Totals 1,300 6.9 5.4 - 8.7 17,200 93.1 91.3 - 94.6 18,400
County
Yes NoWeighted
TotalResponses
# % C.I.(95%) # % C.I.(95%) #
Hawaii 100 4.5 2.8 - 7.1 2,300 95.5 92.9 - 97.2 2,400
Honolulu 900 7.0 5.1 - 9.5 12,300 93.0 90.5 - 94.9 13,200
Kauai 100 11.0 7.7 - 15.4 800 89.0 84.6 - 92.3 900
Maui 100 7.4 5.3 - 10.1 1,800 92.6 89.9 - 94.7 2,000
Report Source: The Hawaii Health Data Warehouse; Data Source: State of Hawaii, Department of Health, Family Health Services Division, Maternal and Child Health Branch, Pregnancy Risk Assessment Monitoring System
Report Date:02/08/201711/70

PRAMS Health Indicator Report - Drinking alcohol last 3 months of pregnancy- by State;County;DOH Race-Ethnicity;PRAMSAge Group;Infant Gender;Married;Poverty Level;Income (2000-2003);Income (2004-2011);Income (2012+);Birthweight;Smoke 3rd
Trimester;Smoke Before Pregnant;WIC During Pregnancy, for the Year(s)2000;2001;2002;2003;2004;2005;2006;2007;2008;2009;2010;2011;2012;2013
Note: Weighted responses, rounded to the nearest hundred; n/r (Not Reportable) - If the unweighted total responses for a dimension (row) is <30 that row will not be shown
Year: 2011
DOH Race-Ethnicity
Yes NoWeighted
TotalResponses
# % C.I.(95%) # % C.I.(95%) #
Caucasian 600 13.2 9.3 - 18.3 3,900 86.8 81.7 - 90.7 4,500
Native Hawaiian 200 3.6 2.1 - 6.1 5,000 96.4 93.9 - 97.9 5,200
Chinese <50 6.3 1.8 - 19.7 700 93.7 80.3 - 98.2 700
Filipino 200 6.5 3.5 - 11.8 3,100 93.5 88.2 - 96.5 3,300
Japanese 100 5.9 2.8 - 12.2 1,800 94.1 87.8 - 97.2 1,900
Other 100 4.2 1.9 - 9.1 2,700 95.8 90.9 - 98.1 2,800
PRAMS AgeGroup
Yes NoWeighted
TotalResponses
# % C.I.(95%) # % C.I.(95%) #
<20 <50 2.4 1.0 - 5.9 1,000 97.6 94.1 - 99.0 1,000
20-24 200 4.8 2.7 - 8.5 4,200 95.2 91.5 - 97.3 4,400
25-34 800 7.7 5.7 - 10.4 9,100 92.3 89.6 - 94.3 9,900
35+ 300 8.6 5.2 - 14.0 2,900 91.4 86.0 - 94.8 3,200
Report Source: The Hawaii Health Data Warehouse; Data Source: State of Hawaii, Department of Health, Family Health Services Division, Maternal and Child Health Branch, Pregnancy Risk Assessment Monitoring System
Report Date:02/08/201712/70

PRAMS Health Indicator Report - Drinking alcohol last 3 months of pregnancy- by State;County;DOH Race-Ethnicity;PRAMSAge Group;Infant Gender;Married;Poverty Level;Income (2000-2003);Income (2004-2011);Income (2012+);Birthweight;Smoke 3rd
Trimester;Smoke Before Pregnant;WIC During Pregnancy, for the Year(s)2000;2001;2002;2003;2004;2005;2006;2007;2008;2009;2010;2011;2012;2013
Note: Weighted responses, rounded to the nearest hundred; n/r (Not Reportable) - If the unweighted total responses for a dimension (row) is <30 that row will not be shown
Year: 2011
Infant Gender
Yes NoWeighted
TotalResponses
# % C.I.(95%) # % C.I.(95%) #
Male 700 7.4 5.4 - 10.1 8,700 92.6 89.9 - 94.6 9,400
Female 600 6.3 4.4 - 9.0 8,500 93.7 91.0 - 95.6 9,000
Married
Yes NoWeighted
TotalResponses
# % C.I.(95%) # % C.I.(95%) #
Yes 800 7.3 5.4 - 9.8 10,600 92.7 90.2 - 94.6 11,500
No 400 6.1 4.1 - 8.9 6,500 93.9 91.1 - 95.9 6,900
Poverty Level
Yes NoWeighted
TotalResponses
# % C.I.(95%) # % C.I.(95%) #
0-130% 300 4.4 2.8 - 7.1 6,300 95.6 92.9 - 97.2 6,600
131-185% 200 7.7 4.1 - 14.0 2,600 92.3 86.0 - 95.9 2,800
186+% 700 9.0 6.6 - 12.2 7,300 91.0 87.8 - 93.4 8,100
Report Source: The Hawaii Health Data Warehouse; Data Source: State of Hawaii, Department of Health, Family Health Services Division, Maternal and Child Health Branch, Pregnancy Risk Assessment Monitoring System
Report Date:02/08/201713/70

PRAMS Health Indicator Report - Drinking alcohol last 3 months of pregnancy- by State;County;DOH Race-Ethnicity;PRAMSAge Group;Infant Gender;Married;Poverty Level;Income (2000-2003);Income (2004-2011);Income (2012+);Birthweight;Smoke 3rd
Trimester;Smoke Before Pregnant;WIC During Pregnancy, for the Year(s)2000;2001;2002;2003;2004;2005;2006;2007;2008;2009;2010;2011;2012;2013
Note: Weighted responses, rounded to the nearest hundred; n/r (Not Reportable) - If the unweighted total responses for a dimension (row) is <30 that row will not be shown
Year: 2011
Income(2004-2011)
Yes NoWeighted
TotalResponses
# % C.I.(95%) # % C.I.(95%) #
<$10,000 200 4.7 2.5 - 8.7 3,200 95.3 91.3 - 97.5 3,300
$10,000-$24,999 200 5.5 2.9 - 10.1 3,200 94.5 89.9 - 97.1 3,400
$25,000-$49,999 300 7.3 4.6 - 11.5 4,300 92.7 88.5 - 95.4 4,600
>=$50,000 600 9.1 6.3 - 12.9 5,600 90.9 87.1 - 93.7 6,200
Birthweight
Yes NoWeighted
TotalResponses
# % C.I.(95%) # % C.I.(95%) #
Low birth weight 100 5.4 3.5 - 8.3 1,300 94.6 91.7 - 96.5 1,300
Normal birth weight 1,200 7.0 5.5 - 8.9 15,900 93.0 91.1 - 94.5 17,100
Smoke 3rdTrimester
Yes NoWeighted
TotalResponses
# % C.I.(95%) # % C.I.(95%) #
Yes 100 10.7 5.0 - 21.6 800 89.3 78.4 - 95.0 900
No 1,100 6.5 5.0 - 8.3 16,200 93.5 91.7 - 95.0 17,300
Report Source: The Hawaii Health Data Warehouse; Data Source: State of Hawaii, Department of Health, Family Health Services Division, Maternal and Child Health Branch, Pregnancy Risk Assessment Monitoring System
Report Date:02/08/201714/70

PRAMS Health Indicator Report - Drinking alcohol last 3 months of pregnancy- by State;County;DOH Race-Ethnicity;PRAMSAge Group;Infant Gender;Married;Poverty Level;Income (2000-2003);Income (2004-2011);Income (2012+);Birthweight;Smoke 3rd
Trimester;Smoke Before Pregnant;WIC During Pregnancy, for the Year(s)2000;2001;2002;2003;2004;2005;2006;2007;2008;2009;2010;2011;2012;2013
Note: Weighted responses, rounded to the nearest hundred; n/r (Not Reportable) - If the unweighted total responses for a dimension (row) is <30 that row will not be shown
Year: 2011
Smoke BeforePregnant
Yes NoWeighted
TotalResponses
# % C.I.(95%) # % C.I.(95%) #
Yes 100 4.1 2.2 - 7.7 3,400 95.9 92.3 - 97.8 3,500
No 1,100 7.3 5.6 - 9.4 13,700 92.7 90.6 - 94.4 14,700
WIC DuringPregnancy
Yes NoWeighted
TotalResponses
# % C.I.(95%) # % C.I.(95%) #
Yes 400 4.6 3.0 - 6.8 8,000 95.4 93.2 - 97.0 8,300
No 800 8.5 6.3 - 11.3 9,100 91.5 88.7 - 93.7 10,000
Report Source: The Hawaii Health Data Warehouse; Data Source: State of Hawaii, Department of Health, Family Health Services Division, Maternal and Child Health Branch, Pregnancy Risk Assessment Monitoring System
Report Date:02/08/201715/70

PRAMS Health Indicator Report - Drinking alcohol last 3 months of pregnancy- by State;County;DOH Race-Ethnicity;PRAMSAge Group;Infant Gender;Married;Poverty Level;Income (2000-2003);Income (2004-2011);Income (2012+);Birthweight;Smoke 3rd
Trimester;Smoke Before Pregnant;WIC During Pregnancy, for the Year(s)2000;2001;2002;2003;2004;2005;2006;2007;2008;2009;2010;2011;2012;2013
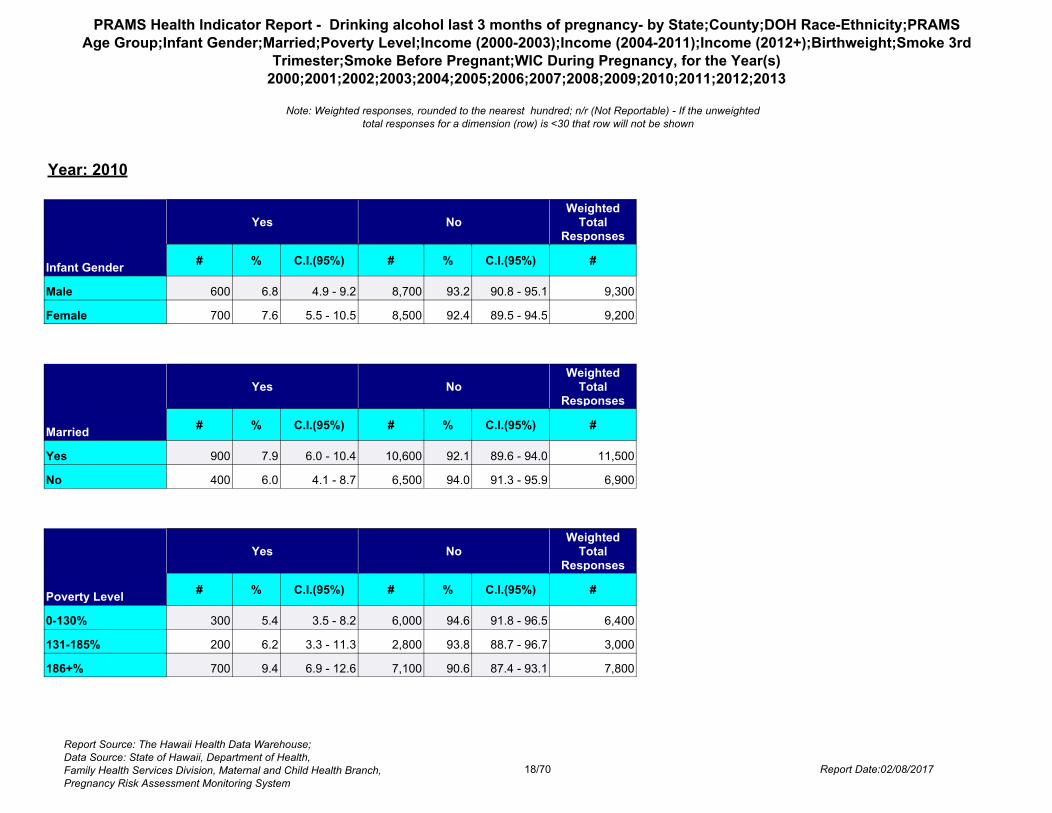
Note: Weighted responses, rounded to the nearest hundred; n/r (Not Reportable) - If the unweighted total responses for a dimension (row) is <30 that row will not be shown
Year: 2010
State
Yes NoWeighted
TotalResponses
# % C.I.(95%) # % C.I.(95%) #
Totals 1,300 7.2 5.7 - 9.0 17,100 92.8 91.0 - 94.3 18,500
County
Yes NoWeighted
TotalResponses
# % C.I.(95%) # % C.I.(95%) #
Hawaii 100 5.4 3.6 - 8.2 2,200 94.6 91.8 - 96.4 2,300
Honolulu 900 6.9 5.1 - 9.4 12,400 93.1 90.6 - 94.9 13,400
Kauai 100 11.3 8.1 - 15.7 700 88.7 84.3 - 91.9 800
Maui 200 9.3 6.9 - 12.5 1,800 90.7 87.5 - 93.1 2,000
Report Source: The Hawaii Health Data Warehouse; Data Source: State of Hawaii, Department of Health, Family Health Services Division, Maternal and Child Health Branch, Pregnancy Risk Assessment Monitoring System
Report Date:02/08/201716/70

PRAMS Health Indicator Report - Drinking alcohol last 3 months of pregnancy- by State;County;DOH Race-Ethnicity;PRAMSAge Group;Infant Gender;Married;Poverty Level;Income (2000-2003);Income (2004-2011);Income (2012+);Birthweight;Smoke 3rd
Trimester;Smoke Before Pregnant;WIC During Pregnancy, for the Year(s)2000;2001;2002;2003;2004;2005;2006;2007;2008;2009;2010;2011;2012;2013
Note: Weighted responses, rounded to the nearest hundred; n/r (Not Reportable) - If the unweighted total responses for a dimension (row) is <30 that row will not be shown
Year: 2010
DOH Race-Ethnicity
Yes NoWeighted
TotalResponses
# % C.I.(95%) # % C.I.(95%) #
Caucasian 500 11.2 7.9 - 15.7 4,000 88.8 84.3 - 92.1 4,500
Native Hawaiian 400 6.8 4.4 - 10.5 5,200 93.2 89.5 - 95.6 5,500
Chinese <50 0.5 0.1 - 2.8 800 99.5 97.2 - 99.9 800
Filipino 200 7.5 4.4 - 12.5 3,000 92.5 87.5 - 95.6 3,300
Japanese 100 5.4 2.1 - 13.2 1,600 94.6 86.8 - 97.9 1,700
Other 100 4.0 1.9 - 8.1 2,600 96.0 91.9 - 98.1 2,700
PRAMS AgeGroup
Yes NoWeighted
TotalResponses
# % C.I.(95%) # % C.I.(95%) #
<20 0 0.0 - 1,100 100.0 - 1,100
20-24 200 3.6 2.1 - 6.0 4,300 96.4 94.0 - 97.9 4,500
25-34 900 9.3 7.0 - 12.2 8,600 90.7 87.8 - 93.0 9,500
35+ 300 8.5 5.2 - 13.8 3,000 91.5 86.2 - 94.8 3,300
Report Source: The Hawaii Health Data Warehouse; Data Source: State of Hawaii, Department of Health, Family Health Services Division, Maternal and Child Health Branch, Pregnancy Risk Assessment Monitoring System
Report Date:02/08/201717/70
PRAMS Health Indicator Report - Drinking alcohol last 3 months of pregnancy- by State;County;DOH Race-Ethnicity;PRAMSAge Group;Infant Gender;Married;Poverty Level;Income (2000-2003);Income (2004-2011);Income (2012+);Birthweight;Smoke 3rd
Trimester;Smoke Before Pregnant;WIC During Pregnancy, for the Year(s)2000;2001;2002;2003;2004;2005;2006;2007;2008;2009;2010;2011;2012;2013
Note: Weighted responses, rounded to the nearest hundred; n/r (Not Reportable) - If the unweighted total responses for a dimension (row) is <30 that row will not be shown
Year: 2010
Infant Gender
Yes NoWeighted
TotalResponses
# % C.I.(95%) # % C.I.(95%) #
Male 600 6.8 4.9 - 9.2 8,700 93.2 90.8 - 95.1 9,300
Female 700 7.6 5.5 - 10.5 8,500 92.4 89.5 - 94.5 9,200
Married
Yes NoWeighted
TotalResponses
# % C.I.(95%) # % C.I.(95%) #
Yes 900 7.9 6.0 - 10.4 10,600 92.1 89.6 - 94.0 11,500
No 400 6.0 4.1 - 8.7 6,500 94.0 91.3 - 95.9 6,900
Poverty Level
Yes NoWeighted
TotalResponses
# % C.I.(95%) # % C.I.(95%) #
0-130% 300 5.4 3.5 - 8.2 6,000 94.6 91.8 - 96.5 6,400
131-185% 200 6.2 3.3 - 11.3 2,800 93.8 88.7 - 96.7 3,000
186+% 700 9.4 6.9 - 12.6 7,100 90.6 87.4 - 93.1 7,800
Report Source: The Hawaii Health Data Warehouse; Data Source: State of Hawaii, Department of Health, Family Health Services Division, Maternal and Child Health Branch, Pregnancy Risk Assessment Monitoring System
Report Date:02/08/201718/70

PRAMS Health Indicator Report - Drinking alcohol last 3 months of pregnancy- by State;County;DOH Race-Ethnicity;PRAMSAge Group;Infant Gender;Married;Poverty Level;Income (2000-2003);Income (2004-2011);Income (2012+);Birthweight;Smoke 3rd
Trimester;Smoke Before Pregnant;WIC During Pregnancy, for the Year(s)2000;2001;2002;2003;2004;2005;2006;2007;2008;2009;2010;2011;2012;2013
Note: Weighted responses, rounded to the nearest hundred; n/r (Not Reportable) - If the unweighted total responses for a dimension (row) is <30 that row will not be shown
Year: 2010
Income(2004-2011)
Yes NoWeighted
TotalResponses
# % C.I.(95%) # % C.I.(95%) #
<$10,000 100 2.9 1.5 - 5.6 3,300 97.1 94.4 - 98.5 3,400
$10,000-$24,999 200 5.8 3.4 - 9.7 3,000 94.2 90.3 - 96.6 3,200
$25,000-$49,999 300 7.3 4.5 - 11.4 4,300 92.7 88.6 - 95.5 4,600
>=$50,000 700 10.5 7.6 - 14.4 5,600 89.5 85.6 - 92.4 6,200
Birthweight
Yes NoWeighted
TotalResponses
# % C.I.(95%) # % C.I.(95%) #
Low birth weight 100 4.6 2.9 - 7.2 1,300 95.4 92.8 - 97.1 1,300
Normal birth weight 1,300 7.4 5.9 - 9.3 15,800 92.6 90.7 - 94.1 17,100
Smoke 3rdTrimester
Yes NoWeighted
TotalResponses
# % C.I.(95%) # % C.I.(95%) #
Yes 100 6.3 2.6 - 14.2 1,300 93.7 85.8 - 97.4 1,400
No 1,200 7.4 5.8 - 9.3 15,600 92.6 90.7 - 94.2 16,800
Report Source: The Hawaii Health Data Warehouse; Data Source: State of Hawaii, Department of Health, Family Health Services Division, Maternal and Child Health Branch, Pregnancy Risk Assessment Monitoring System
Report Date:02/08/201719/70

PRAMS Health Indicator Report - Drinking alcohol last 3 months of pregnancy- by State;County;DOH Race-Ethnicity;PRAMSAge Group;Infant Gender;Married;Poverty Level;Income (2000-2003);Income (2004-2011);Income (2012+);Birthweight;Smoke 3rd
Trimester;Smoke Before Pregnant;WIC During Pregnancy, for the Year(s)2000;2001;2002;2003;2004;2005;2006;2007;2008;2009;2010;2011;2012;2013
Note: Weighted responses, rounded to the nearest hundred; n/r (Not Reportable) - If the unweighted total responses for a dimension (row) is <30 that row will not be shown
Year: 2010
Smoke BeforePregnant
Yes NoWeighted
TotalResponses
# % C.I.(95%) # % C.I.(95%) #
Yes 200 6.2 3.8 - 10.1 3,600 93.8 89.9 - 96.2 3,800
No 1,100 7.6 5.9 - 9.7 13,300 92.4 90.3 - 94.1 14,400
WIC DuringPregnancy
Yes NoWeighted
TotalResponses
# % C.I.(95%) # % C.I.(95%) #
Yes 500 6.0 4.2 - 8.6 7,600 94.0 91.4 - 95.8 8,100
No 800 8.1 6.1 - 10.8 9,400 91.9 89.2 - 93.9 10,200
Report Source: The Hawaii Health Data Warehouse; Data Source: State of Hawaii, Department of Health, Family Health Services Division, Maternal and Child Health Branch, Pregnancy Risk Assessment Monitoring System
Report Date:02/08/201720/70
PRAMS Health Indicator Report - Drinking alcohol last 3 months of pregnancy- by State;County;DOH Race-Ethnicity;PRAMSAge Group;Infant Gender;Married;Poverty Level;Income (2000-2003);Income (2004-2011);Income (2012+);Birthweight;Smoke 3rd
Trimester;Smoke Before Pregnant;WIC During Pregnancy, for the Year(s)2000;2001;2002;2003;2004;2005;2006;2007;2008;2009;2010;2011;2012;2013
Note: Weighted responses, rounded to the nearest hundred; n/r (Not Reportable) - If the unweighted total responses for a dimension (row) is <30 that row will not be shown
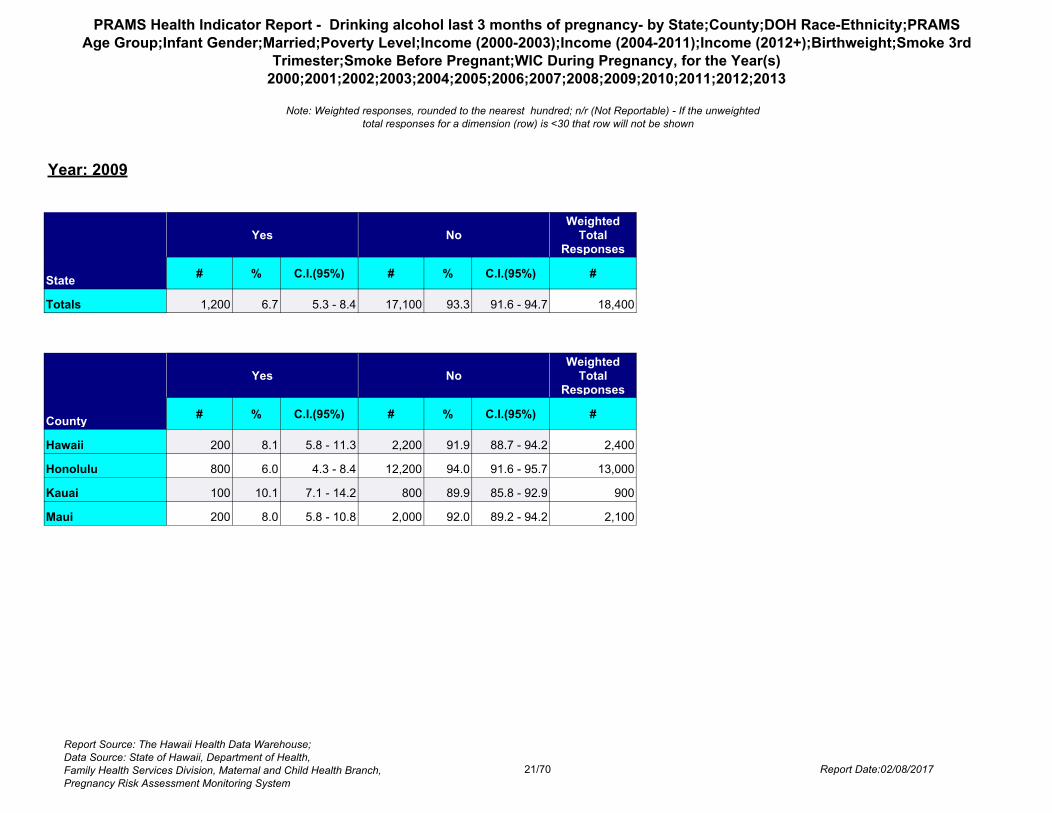
Year: 2009
State
Yes NoWeighted
TotalResponses
# % C.I.(95%) # % C.I.(95%) #
Totals 1,200 6.7 5.3 - 8.4 17,100 93.3 91.6 - 94.7 18,400
County
Yes NoWeighted
TotalResponses
# % C.I.(95%) # % C.I.(95%) #
Hawaii 200 8.1 5.8 - 11.3 2,200 91.9 88.7 - 94.2 2,400
Honolulu 800 6.0 4.3 - 8.4 12,200 94.0 91.6 - 95.7 13,000
Kauai 100 10.1 7.1 - 14.2 800 89.9 85.8 - 92.9 900
Maui 200 8.0 5.8 - 10.8 2,000 92.0 89.2 - 94.2 2,100
Report Source: The Hawaii Health Data Warehouse; Data Source: State of Hawaii, Department of Health, Family Health Services Division, Maternal and Child Health Branch, Pregnancy Risk Assessment Monitoring System
Report Date:02/08/201721/70

PRAMS Health Indicator Report - Drinking alcohol last 3 months of pregnancy- by State;County;DOH Race-Ethnicity;PRAMSAge Group;Infant Gender;Married;Poverty Level;Income (2000-2003);Income (2004-2011);Income (2012+);Birthweight;Smoke 3rd
Trimester;Smoke Before Pregnant;WIC During Pregnancy, for the Year(s)2000;2001;2002;2003;2004;2005;2006;2007;2008;2009;2010;2011;2012;2013
Note: Weighted responses, rounded to the nearest hundred; n/r (Not Reportable) - If the unweighted total responses for a dimension (row) is <30 that row will not be shown
Year: 2009
DOH Race-Ethnicity
Yes NoWeighted
TotalResponses
# % C.I.(95%) # % C.I.(95%) #
Caucasian 400 10.4 7.3 - 14.6 3,900 89.6 85.4 - 92.7 4,300
Native Hawaiian 300 5.8 3.7 - 8.9 5,500 94.2 91.1 - 96.3 5,900
Chinese <50 4.4 1.2 - 14.9 800 95.6 85.1 - 98.8 800
Filipino 100 2.7 1.7 - 4.3 3,100 97.3 95.7 - 98.3 3,200
Japanese 200 9.5 4.7 - 18.2 1,500 90.5 81.8 - 95.3 1,600
Other 200 6.6 3.2 - 13.2 2,400 93.4 86.8 - 96.8 2,500
PRAMS AgeGroup
Yes NoWeighted
TotalResponses
# % C.I.(95%) # % C.I.(95%) #
<20 100 3.0 0.9 - 9.2 1,800 97.0 90.8 - 99.1 1,800
20-24 200 5.3 3.1 - 9.0 4,000 94.7 91.0 - 96.9 4,200
25-34 700 7.4 5.5 - 10.0 8,600 92.6 90.0 - 94.5 9,200
35+ 300 8.5 5.3 - 13.5 2,800 91.5 86.5 - 94.7 3,100
Report Source: The Hawaii Health Data Warehouse; Data Source: State of Hawaii, Department of Health, Family Health Services Division, Maternal and Child Health Branch, Pregnancy Risk Assessment Monitoring System
Report Date:02/08/201722/70
PRAMS Health Indicator Report - Drinking alcohol last 3 months of pregnancy- by State;County;DOH Race-Ethnicity;PRAMSAge Group;Infant Gender;Married;Poverty Level;Income (2000-2003);Income (2004-2011);Income (2012+);Birthweight;Smoke 3rd
Trimester;Smoke Before Pregnant;WIC During Pregnancy, for the Year(s)2000;2001;2002;2003;2004;2005;2006;2007;2008;2009;2010;2011;2012;2013
Note: Weighted responses, rounded to the nearest hundred; n/r (Not Reportable) - If the unweighted total responses for a dimension (row) is <30 that row will not be shown
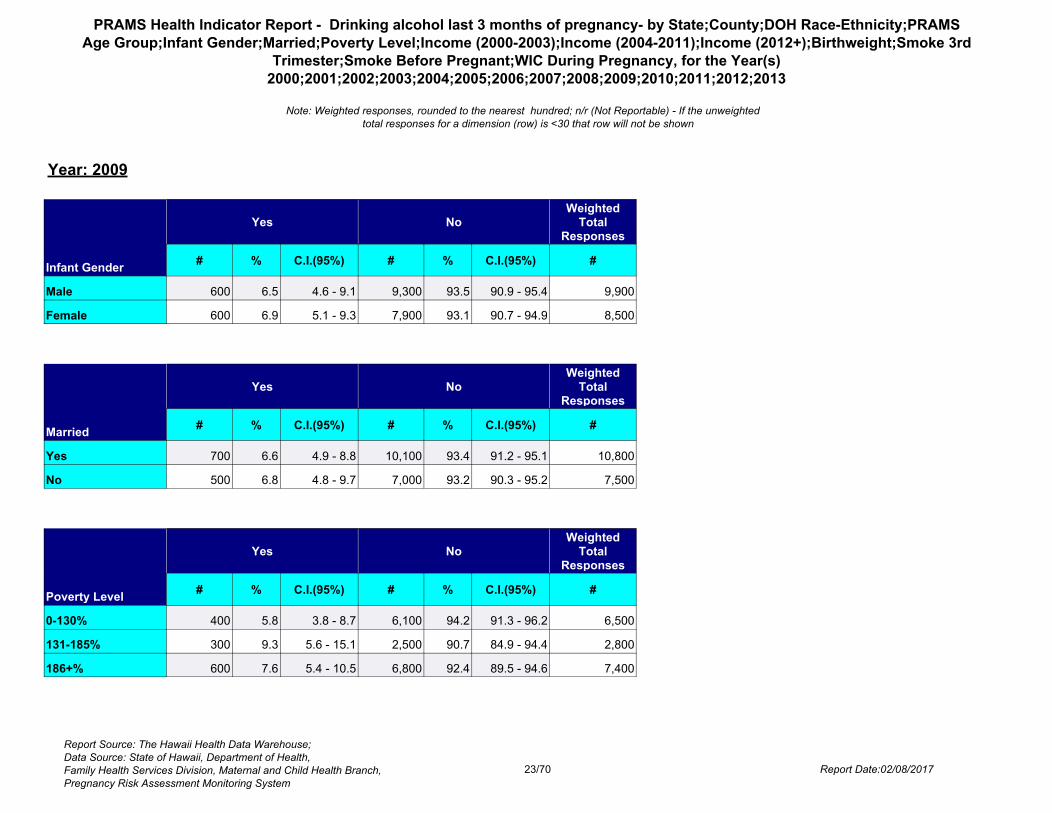
Year: 2009
Infant Gender
Yes NoWeighted
TotalResponses
# % C.I.(95%) # % C.I.(95%) #
Male 600 6.5 4.6 - 9.1 9,300 93.5 90.9 - 95.4 9,900
Female 600 6.9 5.1 - 9.3 7,900 93.1 90.7 - 94.9 8,500
Married
Yes NoWeighted
TotalResponses
# % C.I.(95%) # % C.I.(95%) #
Yes 700 6.6 4.9 - 8.8 10,100 93.4 91.2 - 95.1 10,800
No 500 6.8 4.8 - 9.7 7,000 93.2 90.3 - 95.2 7,500
Poverty Level
Yes NoWeighted
TotalResponses
# % C.I.(95%) # % C.I.(95%) #
0-130% 400 5.8 3.8 - 8.7 6,100 94.2 91.3 - 96.2 6,500
131-185% 300 9.3 5.6 - 15.1 2,500 90.7 84.9 - 94.4 2,800
186+% 600 7.6 5.4 - 10.5 6,800 92.4 89.5 - 94.6 7,400
Report Source: The Hawaii Health Data Warehouse; Data Source: State of Hawaii, Department of Health, Family Health Services Division, Maternal and Child Health Branch, Pregnancy Risk Assessment Monitoring System
Report Date:02/08/201723/70

PRAMS Health Indicator Report - Drinking alcohol last 3 months of pregnancy- by State;County;DOH Race-Ethnicity;PRAMSAge Group;Infant Gender;Married;Poverty Level;Income (2000-2003);Income (2004-2011);Income (2012+);Birthweight;Smoke 3rd
Trimester;Smoke Before Pregnant;WIC During Pregnancy, for the Year(s)2000;2001;2002;2003;2004;2005;2006;2007;2008;2009;2010;2011;2012;2013
Note: Weighted responses, rounded to the nearest hundred; n/r (Not Reportable) - If the unweighted total responses for a dimension (row) is <30 that row will not be shown
Year: 2009
Income(2004-2011)
Yes NoWeighted
TotalResponses
# % C.I.(95%) # % C.I.(95%) #
<$10,000 200 5.7 2.9 - 10.9 3,000 94.3 89.1 - 97.1 3,100
$10,000-$24,999 300 6.5 4.1 - 10.1 3,700 93.5 89.9 - 95.9 3,900
$25,000-$49,999 300 9.4 6.1 - 14.2 3,300 90.6 85.8 - 93.9 3,700
>=$50,000 400 6.8 4.6 - 10.0 5,700 93.2 90.0 - 95.4 6,100
Birthweight
Yes NoWeighted
TotalResponses
# % C.I.(95%) # % C.I.(95%) #
Low birth weight 100 5.3 3.4 - 8.1 1,300 94.7 91.9 - 96.6 1,300
Normal birth weight 1,100 6.6 5.2 - 8.4 15,800 93.4 91.6 - 94.8 17,000
Smoke 3rdTrimester
Yes NoWeighted
TotalResponses
# % C.I.(95%) # % C.I.(95%) #
Yes 200 13.9 8.0 - 23.2 1,500 86.1 76.8 - 92.0 1,700
No 1,000 6.0 4.6 - 7.7 15,200 94.0 92.3 - 95.4 16,200
Report Source: The Hawaii Health Data Warehouse; Data Source: State of Hawaii, Department of Health, Family Health Services Division, Maternal and Child Health Branch, Pregnancy Risk Assessment Monitoring System
Report Date:02/08/201724/70

PRAMS Health Indicator Report - Drinking alcohol last 3 months of pregnancy- by State;County;DOH Race-Ethnicity;PRAMSAge Group;Infant Gender;Married;Poverty Level;Income (2000-2003);Income (2004-2011);Income (2012+);Birthweight;Smoke 3rd
Trimester;Smoke Before Pregnant;WIC During Pregnancy, for the Year(s)2000;2001;2002;2003;2004;2005;2006;2007;2008;2009;2010;2011;2012;2013
Note: Weighted responses, rounded to the nearest hundred; n/r (Not Reportable) - If the unweighted total responses for a dimension (row) is <30 that row will not be shown
Year: 2009
Smoke BeforePregnant
Yes NoWeighted
TotalResponses
# % C.I.(95%) # % C.I.(95%) #
Yes 400 9.0 5.9 - 13.6 3,700 91.0 86.4 - 94.1 4,000
No 800 6.1 4.6 - 8.0 13,100 93.9 92.0 - 95.4 13,900
WIC DuringPregnancy
Yes NoWeighted
TotalResponses
# % C.I.(95%) # % C.I.(95%) #
Yes 500 6.1 4.2 - 8.9 7,000 93.9 91.1 - 95.8 7,400
No 700 7.2 5.3 - 9.6 9,600 92.8 90.4 - 94.7 10,400
Report Source: The Hawaii Health Data Warehouse; Data Source: State of Hawaii, Department of Health, Family Health Services Division, Maternal and Child Health Branch, Pregnancy Risk Assessment Monitoring System
Report Date:02/08/201725/70

PRAMS Health Indicator Report - Drinking alcohol last 3 months of pregnancy- by State;County;DOH Race-Ethnicity;PRAMSAge Group;Infant Gender;Married;Poverty Level;Income (2000-2003);Income (2004-2011);Income (2012+);Birthweight;Smoke 3rd
Trimester;Smoke Before Pregnant;WIC During Pregnancy, for the Year(s)2000;2001;2002;2003;2004;2005;2006;2007;2008;2009;2010;2011;2012;2013
Note: Weighted responses, rounded to the nearest hundred; n/r (Not Reportable) - If the unweighted total responses for a dimension (row) is <30 that row will not be shown
Year: 2008
State
Yes NoWeighted
TotalResponses
# % C.I.(95%) # % C.I.(95%) #
Totals 1,200 6.3 5.3 - 7.5 17,300 93.7 92.5 - 94.7 18,500
County
Yes NoWeighted
TotalResponses
# % C.I.(95%) # % C.I.(95%) #
Hawaii 200 7.2 4.4 - 11.5 2,300 92.8 88.5 - 95.6 2,400
Honolulu 700 5.7 4.6 - 7.1 12,300 94.3 92.9 - 95.4 13,000
Kauai 100 11.6 6.2 - 20.8 800 88.4 79.2 - 93.8 900
Maui 100 6.8 4.1 - 11.1 2,000 93.2 88.9 - 95.9 2,100
Report Source: The Hawaii Health Data Warehouse; Data Source: State of Hawaii, Department of Health, Family Health Services Division, Maternal and Child Health Branch, Pregnancy Risk Assessment Monitoring System
Report Date:02/08/201726/70

PRAMS Health Indicator Report - Drinking alcohol last 3 months of pregnancy- by State;County;DOH Race-Ethnicity;PRAMSAge Group;Infant Gender;Married;Poverty Level;Income (2000-2003);Income (2004-2011);Income (2012+);Birthweight;Smoke 3rd
Trimester;Smoke Before Pregnant;WIC During Pregnancy, for the Year(s)2000;2001;2002;2003;2004;2005;2006;2007;2008;2009;2010;2011;2012;2013
Note: Weighted responses, rounded to the nearest hundred; n/r (Not Reportable) - If the unweighted total responses for a dimension (row) is <30 that row will not be shown
Year: 2008
DOH Race-Ethnicity
Yes NoWeighted
TotalResponses
# % C.I.(95%) # % C.I.(95%) #
Caucasian 500 12.0 9.2 - 15.5 3,800 88.0 84.5 - 90.8 4,400
Native Hawaiian 200 3.5 2.1 - 5.9 4,900 96.5 94.1 - 97.9 5,100
Chinese <50 7.3 4.5 - 11.7 600 92.7 88.3 - 95.5 600
Filipino 200 4.6 2.8 - 7.3 3,300 95.4 92.7 - 97.2 3,500
Japanese 200 7.7 4.7 - 12.5 1,800 92.3 87.5 - 95.3 2,000
Other 100 3.6 2.0 - 6.2 2,800 96.4 93.8 - 98.0 2,900
PRAMS AgeGroup
Yes NoWeighted
TotalResponses
# % C.I.(95%) # % C.I.(95%) #
<20 <50 3.1 1.1 - 8.9 1,400 96.9 91.1 - 98.9 1,400
20-24 200 4.9 3.1 - 7.7 3,800 95.1 92.3 - 96.9 4,000
25-34 600 6.4 5.0 - 8.2 9,000 93.6 91.8 - 95.0 9,600
35+ 300 9.1 6.5 - 12.4 3,100 90.9 87.6 - 93.5 3,400
Report Source: The Hawaii Health Data Warehouse; Data Source: State of Hawaii, Department of Health, Family Health Services Division, Maternal and Child Health Branch, Pregnancy Risk Assessment Monitoring System
Report Date:02/08/201727/70

PRAMS Health Indicator Report - Drinking alcohol last 3 months of pregnancy- by State;County;DOH Race-Ethnicity;PRAMSAge Group;Infant Gender;Married;Poverty Level;Income (2000-2003);Income (2004-2011);Income (2012+);Birthweight;Smoke 3rd
Trimester;Smoke Before Pregnant;WIC During Pregnancy, for the Year(s)2000;2001;2002;2003;2004;2005;2006;2007;2008;2009;2010;2011;2012;2013
Note: Weighted responses, rounded to the nearest hundred; n/r (Not Reportable) - If the unweighted total responses for a dimension (row) is <30 that row will not be shown
Year: 2008
Infant Gender
Yes NoWeighted
TotalResponses
# % C.I.(95%) # % C.I.(95%) #
Male 600 6.0 4.7 - 7.7 9,100 94.0 92.3 - 95.3 9,700
Female 600 6.7 5.2 - 8.6 8,200 93.3 91.4 - 94.8 8,800
Married
Yes NoWeighted
TotalResponses
# % C.I.(95%) # % C.I.(95%) #
Yes 800 6.7 5.4 - 8.2 10,800 93.3 91.8 - 94.6 11,600
No 400 5.7 4.2 - 7.9 6,500 94.3 92.1 - 95.8 6,900
Poverty Level
Yes NoWeighted
TotalResponses
# % C.I.(95%) # % C.I.(95%) #
0-130% 300 5.0 3.5 - 7.1 6,600 95.0 92.9 - 96.5 6,900
131-185% 100 4.7 2.8 - 8.0 2,500 95.3 92.0 - 97.2 2,600
186+% 600 8.4 6.6 - 10.5 7,100 91.6 89.5 - 93.4 7,800
Report Source: The Hawaii Health Data Warehouse; Data Source: State of Hawaii, Department of Health, Family Health Services Division, Maternal and Child Health Branch, Pregnancy Risk Assessment Monitoring System
Report Date:02/08/201728/70

PRAMS Health Indicator Report - Drinking alcohol last 3 months of pregnancy- by State;County;DOH Race-Ethnicity;PRAMSAge Group;Infant Gender;Married;Poverty Level;Income (2000-2003);Income (2004-2011);Income (2012+);Birthweight;Smoke 3rd
Trimester;Smoke Before Pregnant;WIC During Pregnancy, for the Year(s)2000;2001;2002;2003;2004;2005;2006;2007;2008;2009;2010;2011;2012;2013
Note: Weighted responses, rounded to the nearest hundred; n/r (Not Reportable) - If the unweighted total responses for a dimension (row) is <30 that row will not be shown
Year: 2008
Income(2004-2011)
Yes NoWeighted
TotalResponses
# % C.I.(95%) # % C.I.(95%) #
<$10,000 100 4.2 2.4 - 7.4 3,000 95.8 92.6 - 97.6 3,100
$10,000-$24,999 200 5.9 3.9 - 9.0 3,700 94.1 91.0 - 96.1 4,000
$25,000-$49,999 300 6.1 4.2 - 8.7 3,900 93.9 91.3 - 95.8 4,200
>=$50,000 500 8.3 6.4 - 10.7 5,700 91.7 89.3 - 93.6 6,200
Birthweight
Yes NoWeighted
TotalResponses
# % C.I.(95%) # % C.I.(95%) #
Low birth weight 100 6.6 3.2 - 12.8 1,200 93.4 87.2 - 96.8 1,200
Normal birth weight 1,100 6.3 5.3 - 7.6 16,100 93.7 92.4 - 94.7 17,200
Smoke 3rdTrimester
Yes NoWeighted
TotalResponses
# % C.I.(95%) # % C.I.(95%) #
Yes 100 7.2 4.1 - 12.4 1,400 92.8 87.6 - 95.9 1,500
No 1,100 6.2 5.2 - 7.5 15,800 93.8 92.5 - 94.8 16,900
Report Source: The Hawaii Health Data Warehouse; Data Source: State of Hawaii, Department of Health, Family Health Services Division, Maternal and Child Health Branch, Pregnancy Risk Assessment Monitoring System
Report Date:02/08/201729/70

PRAMS Health Indicator Report - Drinking alcohol last 3 months of pregnancy- by State;County;DOH Race-Ethnicity;PRAMSAge Group;Infant Gender;Married;Poverty Level;Income (2000-2003);Income (2004-2011);Income (2012+);Birthweight;Smoke 3rd
Trimester;Smoke Before Pregnant;WIC During Pregnancy, for the Year(s)2000;2001;2002;2003;2004;2005;2006;2007;2008;2009;2010;2011;2012;2013
Note: Weighted responses, rounded to the nearest hundred; n/r (Not Reportable) - If the unweighted total responses for a dimension (row) is <30 that row will not be shown
Year: 2008
Smoke BeforePregnant
Yes NoWeighted
TotalResponses
# % C.I.(95%) # % C.I.(95%) #
Yes 300 7.3 5.0 - 10.6 3,200 92.7 89.4 - 95.0 3,500
No 900 6.1 5.0 - 7.4 14,000 93.9 92.6 - 95.0 14,900
WIC DuringPregnancy
Yes NoWeighted
TotalResponses
# % C.I.(95%) # % C.I.(95%) #
Yes 300 4.0 2.7 - 5.7 7,600 96.0 94.3 - 97.3 7,900
No 800 8.1 6.6 - 9.9 9,500 91.9 90.1 - 93.4 10,300
Report Source: The Hawaii Health Data Warehouse; Data Source: State of Hawaii, Department of Health, Family Health Services Division, Maternal and Child Health Branch, Pregnancy Risk Assessment Monitoring System
Report Date:02/08/201730/70

PRAMS Health Indicator Report - Drinking alcohol last 3 months of pregnancy- by State;County;DOH Race-Ethnicity;PRAMSAge Group;Infant Gender;Married;Poverty Level;Income (2000-2003);Income (2004-2011);Income (2012+);Birthweight;Smoke 3rd
Trimester;Smoke Before Pregnant;WIC During Pregnancy, for the Year(s)2000;2001;2002;2003;2004;2005;2006;2007;2008;2009;2010;2011;2012;2013
Note: Weighted responses, rounded to the nearest hundred; n/r (Not Reportable) - If the unweighted total responses for a dimension (row) is <30 that row will not be shown
Year: 2007
State
Yes NoWeighted
TotalResponses
# % C.I.(95%) # % C.I.(95%) #
Totals 1,100 6.0 5.0 - 7.2 17,200 94.0 92.8 - 95.0 18,300
County
Yes NoWeighted
TotalResponses
# % C.I.(95%) # % C.I.(95%) #
Hawaii 200 6.9 4.3 - 10.8 2,200 93.1 89.2 - 95.7 2,400
Honolulu 700 5.8 4.6 - 7.3 12,000 94.2 92.7 - 95.4 12,700
Kauai 100 5.4 2.3 - 11.9 1,000 94.6 88.1 - 97.7 1,100
Maui 100 6.7 4.0 - 11.1 2,000 93.3 88.9 - 96.0 2,200
Report Source: The Hawaii Health Data Warehouse; Data Source: State of Hawaii, Department of Health, Family Health Services Division, Maternal and Child Health Branch, Pregnancy Risk Assessment Monitoring System
Report Date:02/08/201731/70

PRAMS Health Indicator Report - Drinking alcohol last 3 months of pregnancy- by State;County;DOH Race-Ethnicity;PRAMSAge Group;Infant Gender;Married;Poverty Level;Income (2000-2003);Income (2004-2011);Income (2012+);Birthweight;Smoke 3rd
Trimester;Smoke Before Pregnant;WIC During Pregnancy, for the Year(s)2000;2001;2002;2003;2004;2005;2006;2007;2008;2009;2010;2011;2012;2013
Note: Weighted responses, rounded to the nearest hundred; n/r (Not Reportable) - If the unweighted total responses for a dimension (row) is <30 that row will not be shown
Year: 2007
DOH Race-Ethnicity
Yes NoWeighted
TotalResponses
# % C.I.(95%) # % C.I.(95%) #
Caucasian 500 13.0 10.0 - 16.7 3,600 87.0 83.3 - 90.0 4,100
Native Hawaiian 200 4.9 3.2 - 7.4 4,700 95.1 92.6 - 96.8 5,000
Chinese <50 2.9 1.4 - 6.2 600 97.1 93.8 - 98.6 700
Filipino 100 3.8 2.3 - 6.3 3,300 96.2 93.7 - 97.7 3,400
Japanese 100 5.0 2.8 - 8.9 2,100 95.0 91.1 - 97.2 2,200
Other 100 2.3 1.1 - 4.6 2,900 97.7 95.4 - 98.9 3,000
PRAMS AgeGroup
Yes NoWeighted
TotalResponses
# % C.I.(95%) # % C.I.(95%) #
<20 <50 2.2 0.7 - 6.3 1,600 97.8 93.7 - 99.3 1,700
20-24 200 3.6 2.2 - 6.0 4,400 96.4 94.0 - 97.8 4,600
25-34 600 6.5 5.0 - 8.3 8,400 93.5 91.7 - 95.0 9,000
35+ 300 10.3 7.4 - 14.1 2,800 89.7 85.9 - 92.6 3,100
Report Source: The Hawaii Health Data Warehouse; Data Source: State of Hawaii, Department of Health, Family Health Services Division, Maternal and Child Health Branch, Pregnancy Risk Assessment Monitoring System
Report Date:02/08/201732/70

PRAMS Health Indicator Report - Drinking alcohol last 3 months of pregnancy- by State;County;DOH Race-Ethnicity;PRAMSAge Group;Infant Gender;Married;Poverty Level;Income (2000-2003);Income (2004-2011);Income (2012+);Birthweight;Smoke 3rd
Trimester;Smoke Before Pregnant;WIC During Pregnancy, for the Year(s)2000;2001;2002;2003;2004;2005;2006;2007;2008;2009;2010;2011;2012;2013
Note: Weighted responses, rounded to the nearest hundred; n/r (Not Reportable) - If the unweighted total responses for a dimension (row) is <30 that row will not be shown
Year: 2007
Infant Gender
Yes NoWeighted
TotalResponses
# % C.I.(95%) # % C.I.(95%) #
Male 700 7.0 5.5 - 8.9 8,800 93.0 91.1 - 94.5 9,500
Female 400 5.0 3.7 - 6.6 8,400 95.0 93.4 - 96.3 8,800
Married
Yes NoWeighted
TotalResponses
# % C.I.(95%) # % C.I.(95%) #
Yes 700 6.5 5.2 - 8.0 10,600 93.5 92.0 - 94.8 11,400
No 400 5.3 3.8 - 7.4 6,600 94.7 92.6 - 96.2 7,000
Poverty Level
Yes NoWeighted
TotalResponses
# % C.I.(95%) # % C.I.(95%) #
0-130% 300 3.9 2.6 - 5.9 6,600 96.1 94.1 - 97.4 6,900
131-185% 200 5.6 3.4 - 9.1 2,600 94.4 90.9 - 96.6 2,700
186+% 600 8.6 6.8 - 10.8 6,800 91.4 89.2 - 93.2 7,500
Report Source: The Hawaii Health Data Warehouse; Data Source: State of Hawaii, Department of Health, Family Health Services Division, Maternal and Child Health Branch, Pregnancy Risk Assessment Monitoring System
Report Date:02/08/201733/70

PRAMS Health Indicator Report - Drinking alcohol last 3 months of pregnancy- by State;County;DOH Race-Ethnicity;PRAMSAge Group;Infant Gender;Married;Poverty Level;Income (2000-2003);Income (2004-2011);Income (2012+);Birthweight;Smoke 3rd
Trimester;Smoke Before Pregnant;WIC During Pregnancy, for the Year(s)2000;2001;2002;2003;2004;2005;2006;2007;2008;2009;2010;2011;2012;2013
Note: Weighted responses, rounded to the nearest hundred; n/r (Not Reportable) - If the unweighted total responses for a dimension (row) is <30 that row will not be shown
Year: 2007
Income(2004-2011)
Yes NoWeighted
TotalResponses
# % C.I.(95%) # % C.I.(95%) #
<$10,000 100 3.5 1.9 - 6.6 3,000 96.5 93.4 - 98.1 3,100
$10,000-$24,999 200 3.9 2.3 - 6.6 3,700 96.1 93.4 - 97.7 3,800
$25,000-$49,999 300 6.7 4.6 - 9.7 3,900 93.3 90.3 - 95.4 4,200
>=$50,000 500 8.7 6.7 - 11.2 5,400 91.3 88.8 - 93.3 6,000
Birthweight
Yes NoWeighted
TotalResponses
# % C.I.(95%) # % C.I.(95%) #
Low birth weight 100 4.3 2.0 - 8.9 1,500 95.7 91.1 - 98.0 1,600
Normal birth weight 1,000 6.2 5.1 - 7.5 15,700 93.8 92.5 - 94.9 16,800
Smoke 3rdTrimester
Yes NoWeighted
TotalResponses
# % C.I.(95%) # % C.I.(95%) #
Yes 100 7.3 3.9 - 13.2 1,400 92.7 86.8 - 96.1 1,500
No 1,000 5.9 4.8 - 7.1 15,700 94.1 92.9 - 95.2 16,700
Report Source: The Hawaii Health Data Warehouse; Data Source: State of Hawaii, Department of Health, Family Health Services Division, Maternal and Child Health Branch, Pregnancy Risk Assessment Monitoring System
Report Date:02/08/201734/70

PRAMS Health Indicator Report - Drinking alcohol last 3 months of pregnancy- by State;County;DOH Race-Ethnicity;PRAMSAge Group;Infant Gender;Married;Poverty Level;Income (2000-2003);Income (2004-2011);Income (2012+);Birthweight;Smoke 3rd
Trimester;Smoke Before Pregnant;WIC During Pregnancy, for the Year(s)2000;2001;2002;2003;2004;2005;2006;2007;2008;2009;2010;2011;2012;2013
Note: Weighted responses, rounded to the nearest hundred; n/r (Not Reportable) - If the unweighted total responses for a dimension (row) is <30 that row will not be shown
Year: 2007
Smoke BeforePregnant
Yes NoWeighted
TotalResponses
# % C.I.(95%) # % C.I.(95%) #
Yes 200 5.7 3.6 - 8.8 3,400 94.3 91.2 - 96.4 3,700
No 900 6.1 5.0 - 7.4 13,700 93.9 92.6 - 95.0 14,600
WIC DuringPregnancy
Yes NoWeighted
TotalResponses
# % C.I.(95%) # % C.I.(95%) #
Yes 400 5.1 3.7 - 7.1 7,200 94.9 92.9 - 96.3 7,600
No 700 6.8 5.4 - 8.5 9,700 93.2 91.5 - 94.6 10,400
Report Source: The Hawaii Health Data Warehouse; Data Source: State of Hawaii, Department of Health, Family Health Services Division, Maternal and Child Health Branch, Pregnancy Risk Assessment Monitoring System
Report Date:02/08/201735/70

PRAMS Health Indicator Report - Drinking alcohol last 3 months of pregnancy- by State;County;DOH Race-Ethnicity;PRAMSAge Group;Infant Gender;Married;Poverty Level;Income (2000-2003);Income (2004-2011);Income (2012+);Birthweight;Smoke 3rd
Trimester;Smoke Before Pregnant;WIC During Pregnancy, for the Year(s)2000;2001;2002;2003;2004;2005;2006;2007;2008;2009;2010;2011;2012;2013
Note: Weighted responses, rounded to the nearest hundred; n/r (Not Reportable) - If the unweighted total responses for a dimension (row) is <30 that row will not be shown
Year: 2006
State
Yes NoWeighted
TotalResponses
# % C.I.(95%) # % C.I.(95%) #
Totals 1,100 6.0 4.9 - 7.3 17,000 94.0 92.7 - 95.1 18,100
County
Yes NoWeighted
TotalResponses
# % C.I.(95%) # % C.I.(95%) #
Hawaii 100 4.5 2.3 - 8.5 2,100 95.5 91.5 - 97.7 2,200
Honolulu 700 5.4 4.2 - 6.8 12,500 94.6 93.2 - 95.8 13,200
Kauai 100 9.7 4.5 - 19.4 800 90.3 80.6 - 95.5 900
Maui 200 10.6 6.8 - 16.1 1,700 89.4 83.9 - 93.2 1,900
Report Source: The Hawaii Health Data Warehouse; Data Source: State of Hawaii, Department of Health, Family Health Services Division, Maternal and Child Health Branch, Pregnancy Risk Assessment Monitoring System
Report Date:02/08/201736/70

PRAMS Health Indicator Report - Drinking alcohol last 3 months of pregnancy- by State;County;DOH Race-Ethnicity;PRAMSAge Group;Infant Gender;Married;Poverty Level;Income (2000-2003);Income (2004-2011);Income (2012+);Birthweight;Smoke 3rd
Trimester;Smoke Before Pregnant;WIC During Pregnancy, for the Year(s)2000;2001;2002;2003;2004;2005;2006;2007;2008;2009;2010;2011;2012;2013
Note: Weighted responses, rounded to the nearest hundred; n/r (Not Reportable) - If the unweighted total responses for a dimension (row) is <30 that row will not be shown
Year: 2006
DOH Race-Ethnicity
Yes NoWeighted
TotalResponses
# % C.I.(95%) # % C.I.(95%) #
Caucasian 400 8.8 6.4 - 12.1 3,900 91.2 87.9 - 93.6 4,300
Native Hawaiian 300 6.8 4.7 - 9.9 4,600 93.2 90.1 - 95.3 5,000
Chinese <50 6.2 3.5 - 10.6 600 93.8 89.4 - 96.5 600
Filipino 100 3.5 2.0 - 6.1 3,200 96.5 93.9 - 98.0 3,300
Japanese 100 2.8 1.2 - 6.4 2,000 97.2 93.6 - 98.8 2,100
Other 200 5.5 3.3 - 8.9 2,700 94.5 91.1 - 96.7 2,900
PRAMS AgeGroup
Yes NoWeighted
TotalResponses
# % C.I.(95%) # % C.I.(95%) #
<20 <50 3.2 1.2 - 8.5 1,500 96.8 91.5 - 98.8 1,500
20-24 200 5.3 3.3 - 8.2 4,200 94.7 91.8 - 96.7 4,400
25-34 500 6.2 4.7 - 8.1 8,300 93.8 91.9 - 95.3 8,900
35+ 300 7.9 5.4 - 11.3 3,000 92.1 88.7 - 94.6 3,300
Report Source: The Hawaii Health Data Warehouse; Data Source: State of Hawaii, Department of Health, Family Health Services Division, Maternal and Child Health Branch, Pregnancy Risk Assessment Monitoring System
Report Date:02/08/201737/70

PRAMS Health Indicator Report - Drinking alcohol last 3 months of pregnancy- by State;County;DOH Race-Ethnicity;PRAMSAge Group;Infant Gender;Married;Poverty Level;Income (2000-2003);Income (2004-2011);Income (2012+);Birthweight;Smoke 3rd
Trimester;Smoke Before Pregnant;WIC During Pregnancy, for the Year(s)2000;2001;2002;2003;2004;2005;2006;2007;2008;2009;2010;2011;2012;2013
Note: Weighted responses, rounded to the nearest hundred; n/r (Not Reportable) - If the unweighted total responses for a dimension (row) is <30 that row will not be shown
Year: 2006
Infant Gender
Yes NoWeighted
TotalResponses
# % C.I.(95%) # % C.I.(95%) #
Male 400 4.0 2.9 - 5.6 8,900 96.0 94.4 - 97.1 9,300
Female 700 8.1 6.4 - 10.2 8,200 91.9 89.8 - 93.6 8,900
Married
Yes NoWeighted
TotalResponses
# % C.I.(95%) # % C.I.(95%) #
Yes 700 6.4 5.1 - 8.0 10,800 93.6 92.0 - 94.9 11,500
No 400 5.4 3.7 - 7.7 6,200 94.6 92.3 - 96.3 6,600
Poverty Level
Yes NoWeighted
TotalResponses
# % C.I.(95%) # % C.I.(95%) #
0-130% 300 5.5 3.8 - 7.9 6,000 94.5 92.1 - 96.2 6,300
131-185% 100 5.1 2.8 - 9.1 2,300 94.9 90.9 - 97.2 2,400
186+% 600 7.3 5.7 - 9.3 7,500 92.7 90.7 - 94.3 8,100
Report Source: The Hawaii Health Data Warehouse; Data Source: State of Hawaii, Department of Health, Family Health Services Division, Maternal and Child Health Branch, Pregnancy Risk Assessment Monitoring System
Report Date:02/08/201738/70

PRAMS Health Indicator Report - Drinking alcohol last 3 months of pregnancy- by State;County;DOH Race-Ethnicity;PRAMSAge Group;Infant Gender;Married;Poverty Level;Income (2000-2003);Income (2004-2011);Income (2012+);Birthweight;Smoke 3rd
Trimester;Smoke Before Pregnant;WIC During Pregnancy, for the Year(s)2000;2001;2002;2003;2004;2005;2006;2007;2008;2009;2010;2011;2012;2013
Note: Weighted responses, rounded to the nearest hundred; n/r (Not Reportable) - If the unweighted total responses for a dimension (row) is <30 that row will not be shown
Year: 2006
Income(2004-2011)
Yes NoWeighted
TotalResponses
# % C.I.(95%) # % C.I.(95%) #
<$10,000 100 3.0 1.5 - 6.0 2,900 97.0 94.0 - 98.5 3,000
$10,000-$24,999 300 6.7 4.3 - 10.3 3,500 93.3 89.7 - 95.7 3,800
$25,000-$49,999 200 5.7 3.7 - 8.6 4,100 94.3 91.4 - 96.3 4,300
>=$50,000 500 8.1 6.2 - 10.6 5,400 91.9 89.4 - 93.8 5,800
Birthweight
Yes NoWeighted
TotalResponses
# % C.I.(95%) # % C.I.(95%) #
Low birth weight 100 4.4 2.1 - 9.2 1,500 95.6 90.8 - 97.9 1,500
Normal birth weight 1,000 6.1 5.0 - 7.4 15,600 93.9 92.6 - 95.0 16,600
Smoke 3rdTrimester
Yes NoWeighted
TotalResponses
# % C.I.(95%) # % C.I.(95%) #
Yes 200 9.1 5.2 - 15.4 1,600 90.9 84.6 - 94.8 1,700
No 900 5.6 4.6 - 6.9 15,400 94.4 93.1 - 95.4 16,400
Report Source: The Hawaii Health Data Warehouse; Data Source: State of Hawaii, Department of Health, Family Health Services Division, Maternal and Child Health Branch, Pregnancy Risk Assessment Monitoring System
Report Date:02/08/201739/70

PRAMS Health Indicator Report - Drinking alcohol last 3 months of pregnancy- by State;County;DOH Race-Ethnicity;PRAMSAge Group;Infant Gender;Married;Poverty Level;Income (2000-2003);Income (2004-2011);Income (2012+);Birthweight;Smoke 3rd
Trimester;Smoke Before Pregnant;WIC During Pregnancy, for the Year(s)2000;2001;2002;2003;2004;2005;2006;2007;2008;2009;2010;2011;2012;2013
Note: Weighted responses, rounded to the nearest hundred; n/r (Not Reportable) - If the unweighted total responses for a dimension (row) is <30 that row will not be shown
Year: 2006
Smoke BeforePregnant
Yes NoWeighted
TotalResponses
# % C.I.(95%) # % C.I.(95%) #
Yes 300 7.2 4.8 - 10.7 3,600 92.8 89.3 - 95.2 3,900
No 800 5.6 4.5 - 7.0 13,400 94.4 93.0 - 95.5 14,200
WIC DuringPregnancy
Yes NoWeighted
TotalResponses
# % C.I.(95%) # % C.I.(95%) #
Yes 400 5.3 3.8 - 7.4 7,200 94.7 92.6 - 96.2 7,600
No 700 6.5 5.1 - 8.2 9,600 93.5 91.8 - 94.9 10,200
Report Source: The Hawaii Health Data Warehouse; Data Source: State of Hawaii, Department of Health, Family Health Services Division, Maternal and Child Health Branch, Pregnancy Risk Assessment Monitoring System
Report Date:02/08/201740/70

PRAMS Health Indicator Report - Drinking alcohol last 3 months of pregnancy- by State;County;DOH Race-Ethnicity;PRAMSAge Group;Infant Gender;Married;Poverty Level;Income (2000-2003);Income (2004-2011);Income (2012+);Birthweight;Smoke 3rd
Trimester;Smoke Before Pregnant;WIC During Pregnancy, for the Year(s)2000;2001;2002;2003;2004;2005;2006;2007;2008;2009;2010;2011;2012;2013
Note: Weighted responses, rounded to the nearest hundred; n/r (Not Reportable) - If the unweighted total responses for a dimension (row) is <30 that row will not be shown
Year: 2005
State
Yes NoWeighted
TotalResponses
# % C.I.(95%) # % C.I.(95%) #
Totals 800 4.5 3.6 - 5.6 16,500 95.5 94.4 - 96.4 17,200
County
Yes NoWeighted
TotalResponses
# % C.I.(95%) # % C.I.(95%) #
Hawaii 100 2.9 1.4 - 6.1 2,200 97.1 93.9 - 98.6 2,200
Honolulu 600 4.8 3.8 - 6.1 12,000 95.2 93.9 - 96.2 12,600
Kauai <50 2.8 0.8 - 10.0 700 97.2 90.0 - 99.2 700
Maui 100 5.0 2.6 - 9.4 1,600 95.0 90.6 - 97.4 1,700
Report Source: The Hawaii Health Data Warehouse; Data Source: State of Hawaii, Department of Health, Family Health Services Division, Maternal and Child Health Branch, Pregnancy Risk Assessment Monitoring System
Report Date:02/08/201741/70

PRAMS Health Indicator Report - Drinking alcohol last 3 months of pregnancy- by State;County;DOH Race-Ethnicity;PRAMSAge Group;Infant Gender;Married;Poverty Level;Income (2000-2003);Income (2004-2011);Income (2012+);Birthweight;Smoke 3rd
Trimester;Smoke Before Pregnant;WIC During Pregnancy, for the Year(s)2000;2001;2002;2003;2004;2005;2006;2007;2008;2009;2010;2011;2012;2013
Note: Weighted responses, rounded to the nearest hundred; n/r (Not Reportable) - If the unweighted total responses for a dimension (row) is <30 that row will not be shown
Year: 2005
DOH Race-Ethnicity
Yes NoWeighted
TotalResponses
# % C.I.(95%) # % C.I.(95%) #
Caucasian 300 7.8 5.5 - 10.9 3,500 92.2 89.1 - 94.5 3,700
Native Hawaiian 200 3.2 1.8 - 5.4 4,800 96.8 94.6 - 98.2 4,900
Chinese <50 1.7 0.7 - 4.5 600 98.3 95.5 - 99.3 600
Filipino 100 3.1 1.7 - 5.5 3,100 96.9 94.5 - 98.3 3,200
Japanese 100 3.3 1.6 - 6.6 2,200 96.7 93.4 - 98.4 2,300
Other 100 5.8 3.6 - 9.3 2,300 94.2 90.7 - 96.4 2,500
PRAMS AgeGroup
Yes NoWeighted
TotalResponses
# % C.I.(95%) # % C.I.(95%) #
<20 <50 2.2 0.7 - 6.2 1,400 97.8 93.8 - 99.3 1,500
20-24 200 3.7 2.2 - 6.0 4,100 96.3 94.0 - 97.8 4,200
25-34 400 4.3 3.1 - 5.9 8,200 95.7 94.1 - 96.9 8,600
35+ 200 7.4 5.0 - 10.9 2,700 92.6 89.1 - 95.0 3,000
Report Source: The Hawaii Health Data Warehouse; Data Source: State of Hawaii, Department of Health, Family Health Services Division, Maternal and Child Health Branch, Pregnancy Risk Assessment Monitoring System
Report Date:02/08/201742/70

PRAMS Health Indicator Report - Drinking alcohol last 3 months of pregnancy- by State;County;DOH Race-Ethnicity;PRAMSAge Group;Infant Gender;Married;Poverty Level;Income (2000-2003);Income (2004-2011);Income (2012+);Birthweight;Smoke 3rd
Trimester;Smoke Before Pregnant;WIC During Pregnancy, for the Year(s)2000;2001;2002;2003;2004;2005;2006;2007;2008;2009;2010;2011;2012;2013
Note: Weighted responses, rounded to the nearest hundred; n/r (Not Reportable) - If the unweighted total responses for a dimension (row) is <30 that row will not be shown
Year: 2005
Infant Gender
Yes NoWeighted
TotalResponses
# % C.I.(95%) # % C.I.(95%) #
Male 400 4.1 3.0 - 5.6 8,400 95.9 94.4 - 97.0 8,800
Female 400 4.9 3.6 - 6.6 8,100 95.1 93.4 - 96.4 8,500
Married
Yes NoWeighted
TotalResponses
# % C.I.(95%) # % C.I.(95%) #
Yes 500 4.7 3.7 - 6.1 10,400 95.3 93.9 - 96.3 11,000
No 300 4.1 2.7 - 6.0 6,000 95.9 94.0 - 97.3 6,300
Poverty Level
Yes NoWeighted
TotalResponses
# % C.I.(95%) # % C.I.(95%) #
0-130% 200 3.0 1.9 - 4.8 6,000 97.0 95.2 - 98.1 6,200
131-185% 100 6.1 3.4 - 10.7 1,700 93.9 89.3 - 96.6 1,800
186+% 400 5.5 4.1 - 7.3 7,300 94.5 92.7 - 95.9 7,700
Report Source: The Hawaii Health Data Warehouse; Data Source: State of Hawaii, Department of Health, Family Health Services Division, Maternal and Child Health Branch, Pregnancy Risk Assessment Monitoring System
Report Date:02/08/201743/70

PRAMS Health Indicator Report - Drinking alcohol last 3 months of pregnancy- by State;County;DOH Race-Ethnicity;PRAMSAge Group;Infant Gender;Married;Poverty Level;Income (2000-2003);Income (2004-2011);Income (2012+);Birthweight;Smoke 3rd
Trimester;Smoke Before Pregnant;WIC During Pregnancy, for the Year(s)2000;2001;2002;2003;2004;2005;2006;2007;2008;2009;2010;2011;2012;2013
Note: Weighted responses, rounded to the nearest hundred; n/r (Not Reportable) - If the unweighted total responses for a dimension (row) is <30 that row will not be shown
Year: 2005
Income(2004-2011)
Yes NoWeighted
TotalResponses
# % C.I.(95%) # % C.I.(95%) #
<$10,000 100 4.0 2.3 - 7.1 2,800 96.0 92.9 - 97.7 2,900
$10,000-$24,999 100 2.3 1.2 - 4.5 3,500 97.7 95.5 - 98.8 3,600
$25,000-$49,999 200 4.5 2.8 - 7.1 3,800 95.5 92.9 - 97.2 4,000
>=$50,000 300 6.4 4.7 - 8.7 5,000 93.6 91.3 - 95.3 5,400
Birthweight
Yes NoWeighted
TotalResponses
# % C.I.(95%) # % C.I.(95%) #
Low birth weight 100 5.8 2.8 - 11.6 1,200 94.2 88.4 - 97.2 1,200
Normal birth weight 700 4.3 3.4 - 5.4 15,300 95.7 94.6 - 96.6 16,000
Smoke 3rdTrimester
Yes NoWeighted
TotalResponses
# % C.I.(95%) # % C.I.(95%) #
Yes 100 6.8 3.5 - 12.8 1,300 93.2 87.2 - 96.5 1,400
No 700 4.3 3.4 - 5.4 15,000 95.7 94.6 - 96.6 15,700
Report Source: The Hawaii Health Data Warehouse; Data Source: State of Hawaii, Department of Health, Family Health Services Division, Maternal and Child Health Branch, Pregnancy Risk Assessment Monitoring System
Report Date:02/08/201744/70

PRAMS Health Indicator Report - Drinking alcohol last 3 months of pregnancy- by State;County;DOH Race-Ethnicity;PRAMSAge Group;Infant Gender;Married;Poverty Level;Income (2000-2003);Income (2004-2011);Income (2012+);Birthweight;Smoke 3rd
Trimester;Smoke Before Pregnant;WIC During Pregnancy, for the Year(s)2000;2001;2002;2003;2004;2005;2006;2007;2008;2009;2010;2011;2012;2013
Note: Weighted responses, rounded to the nearest hundred; n/r (Not Reportable) - If the unweighted total responses for a dimension (row) is <30 that row will not be shown
Year: 2005
Smoke BeforePregnant
Yes NoWeighted
TotalResponses
# % C.I.(95%) # % C.I.(95%) #
Yes 200 4.6 2.8 - 7.5 3,400 95.4 92.5 - 97.2 3,600
No 600 4.5 3.6 - 5.8 12,800 95.5 94.2 - 96.4 13,500
WIC DuringPregnancy
Yes NoWeighted
TotalResponses
# % C.I.(95%) # % C.I.(95%) #
Yes 200 2.6 1.6 - 4.0 7,100 97.4 96.0 - 98.4 7,300
No 600 6.0 4.7 - 7.7 9,000 94.0 92.3 - 95.3 9,600
Report Source: The Hawaii Health Data Warehouse; Data Source: State of Hawaii, Department of Health, Family Health Services Division, Maternal and Child Health Branch, Pregnancy Risk Assessment Monitoring System
Report Date:02/08/201745/70

PRAMS Health Indicator Report - Drinking alcohol last 3 months of pregnancy- by State;County;DOH Race-Ethnicity;PRAMSAge Group;Infant Gender;Married;Poverty Level;Income (2000-2003);Income (2004-2011);Income (2012+);Birthweight;Smoke 3rd
Trimester;Smoke Before Pregnant;WIC During Pregnancy, for the Year(s)2000;2001;2002;2003;2004;2005;2006;2007;2008;2009;2010;2011;2012;2013
Note: Weighted responses, rounded to the nearest hundred; n/r (Not Reportable) - If the unweighted total responses for a dimension (row) is <30 that row will not be shown
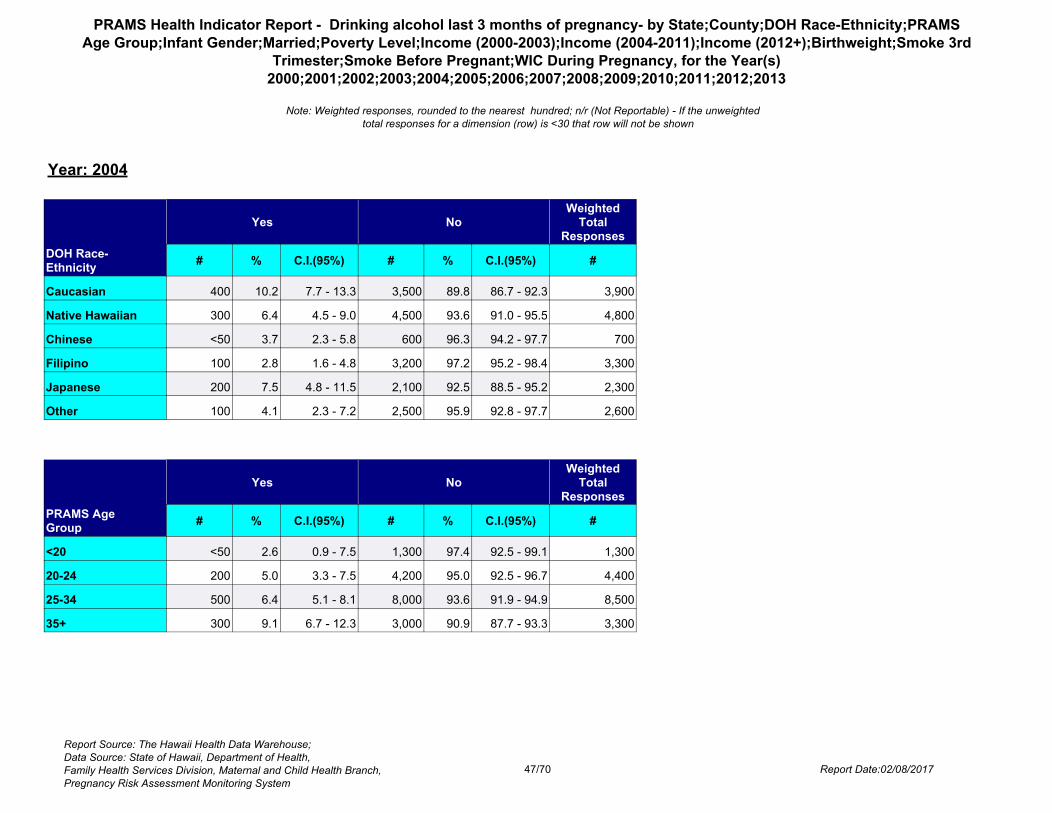
Year: 2004
State
Yes NoWeighted
TotalResponses
# % C.I.(95%) # % C.I.(95%) #
Totals 1,100 6.3 5.3 - 7.4 16,400 93.7 92.6 - 94.7 17,500
County
Yes NoWeighted
TotalResponses
# % C.I.(95%) # % C.I.(95%) #
Hawaii 100 6.5 4.0 - 10.6 2,000 93.5 89.4 - 96.0 2,200
Honolulu 700 5.8 4.7 - 7.2 12,000 94.2 92.8 - 95.3 12,700
Kauai <50 5.9 2.6 - 12.8 700 94.1 87.2 - 97.4 800
Maui 200 9.2 6.0 - 13.9 1,700 90.8 86.1 - 94.0 1,800
Report Source: The Hawaii Health Data Warehouse; Data Source: State of Hawaii, Department of Health, Family Health Services Division, Maternal and Child Health Branch, Pregnancy Risk Assessment Monitoring System
Report Date:02/08/201746/70
PRAMS Health Indicator Report - Drinking alcohol last 3 months of pregnancy- by State;County;DOH Race-Ethnicity;PRAMSAge Group;Infant Gender;Married;Poverty Level;Income (2000-2003);Income (2004-2011);Income (2012+);Birthweight;Smoke 3rd
Trimester;Smoke Before Pregnant;WIC During Pregnancy, for the Year(s)2000;2001;2002;2003;2004;2005;2006;2007;2008;2009;2010;2011;2012;2013
Note: Weighted responses, rounded to the nearest hundred; n/r (Not Reportable) - If the unweighted total responses for a dimension (row) is <30 that row will not be shown
Year: 2004
DOH Race-Ethnicity
Yes NoWeighted
TotalResponses
# % C.I.(95%) # % C.I.(95%) #
Caucasian 400 10.2 7.7 - 13.3 3,500 89.8 86.7 - 92.3 3,900
Native Hawaiian 300 6.4 4.5 - 9.0 4,500 93.6 91.0 - 95.5 4,800
Chinese <50 3.7 2.3 - 5.8 600 96.3 94.2 - 97.7 700
Filipino 100 2.8 1.6 - 4.8 3,200 97.2 95.2 - 98.4 3,300
Japanese 200 7.5 4.8 - 11.5 2,100 92.5 88.5 - 95.2 2,300
Other 100 4.1 2.3 - 7.2 2,500 95.9 92.8 - 97.7 2,600
PRAMS AgeGroup
Yes NoWeighted
TotalResponses
# % C.I.(95%) # % C.I.(95%) #
<20 <50 2.6 0.9 - 7.5 1,300 97.4 92.5 - 99.1 1,300
20-24 200 5.0 3.3 - 7.5 4,200 95.0 92.5 - 96.7 4,400
25-34 500 6.4 5.1 - 8.1 8,000 93.6 91.9 - 94.9 8,500
35+ 300 9.1 6.7 - 12.3 3,000 90.9 87.7 - 93.3 3,300
Report Source: The Hawaii Health Data Warehouse; Data Source: State of Hawaii, Department of Health, Family Health Services Division, Maternal and Child Health Branch, Pregnancy Risk Assessment Monitoring System
Report Date:02/08/201747/70

PRAMS Health Indicator Report - Drinking alcohol last 3 months of pregnancy- by State;County;DOH Race-Ethnicity;PRAMSAge Group;Infant Gender;Married;Poverty Level;Income (2000-2003);Income (2004-2011);Income (2012+);Birthweight;Smoke 3rd
Trimester;Smoke Before Pregnant;WIC During Pregnancy, for the Year(s)2000;2001;2002;2003;2004;2005;2006;2007;2008;2009;2010;2011;2012;2013
Note: Weighted responses, rounded to the nearest hundred; n/r (Not Reportable) - If the unweighted total responses for a dimension (row) is <30 that row will not be shown
Year: 2004
Infant Gender
Yes NoWeighted
TotalResponses
# % C.I.(95%) # % C.I.(95%) #
Male 600 6.3 5.0 - 7.9 8,900 93.7 92.1 - 95.0 9,500
Female 500 6.3 4.9 - 8.1 7,500 93.7 91.9 - 95.1 8,000
Married
Yes NoWeighted
TotalResponses
# % C.I.(95%) # % C.I.(95%) #
Yes 800 6.7 5.5 - 8.1 11,500 93.3 91.9 - 94.5 12,300
No 300 5.4 3.8 - 7.6 5,000 94.6 92.4 - 96.2 5,200
Poverty Level
Yes NoWeighted
TotalResponses
# % C.I.(95%) # % C.I.(95%) #
0-130% 300 4.3 2.9 - 6.1 6,200 95.7 93.9 - 97.1 6,400
131-185% 100 4.7 2.6 - 8.5 2,000 95.3 91.5 - 97.4 2,100
186+% 700 8.9 7.2 - 10.9 6,900 91.1 89.1 - 92.8 7,600
Report Source: The Hawaii Health Data Warehouse; Data Source: State of Hawaii, Department of Health, Family Health Services Division, Maternal and Child Health Branch, Pregnancy Risk Assessment Monitoring System
Report Date:02/08/201748/70

PRAMS Health Indicator Report - Drinking alcohol last 3 months of pregnancy- by State;County;DOH Race-Ethnicity;PRAMSAge Group;Infant Gender;Married;Poverty Level;Income (2000-2003);Income (2004-2011);Income (2012+);Birthweight;Smoke 3rd
Trimester;Smoke Before Pregnant;WIC During Pregnancy, for the Year(s)2000;2001;2002;2003;2004;2005;2006;2007;2008;2009;2010;2011;2012;2013
Note: Weighted responses, rounded to the nearest hundred; n/r (Not Reportable) - If the unweighted total responses for a dimension (row) is <30 that row will not be shown
Year: 2004
Income(2004-2011)
Yes NoWeighted
TotalResponses
# % C.I.(95%) # % C.I.(95%) #
<$10,000 100 5.0 2.9 - 8.4 2,600 95.0 91.6 - 97.1 2,700
$10,000-$24,999 200 4.0 2.6 - 6.3 4,100 96.0 93.7 - 97.4 4,300
$25,000-$49,999 300 5.7 4.0 - 8.0 4,200 94.3 92.0 - 96.0 4,400
>=$50,000 500 10.1 7.9 - 12.8 4,400 89.9 87.2 - 92.1 4,900
Birthweight
Yes NoWeighted
TotalResponses
# % C.I.(95%) # % C.I.(95%) #
Low birth weight <50 1.7 0.5 - 6.1 1,100 98.3 93.9 - 99.5 1,100
Normal birth weight 1,100 6.6 5.5 - 7.8 15,400 93.4 92.2 - 94.5 16,400
Smoke 3rdTrimester
Yes NoWeighted
TotalResponses
# % C.I.(95%) # % C.I.(95%) #
Yes 200 13.2 8.5 - 19.9 1,200 86.8 80.1 - 91.5 1,400
No 900 5.7 4.7 - 6.8 15,100 94.3 93.2 - 95.3 16,000
Report Source: The Hawaii Health Data Warehouse; Data Source: State of Hawaii, Department of Health, Family Health Services Division, Maternal and Child Health Branch, Pregnancy Risk Assessment Monitoring System
Report Date:02/08/201749/70

PRAMS Health Indicator Report - Drinking alcohol last 3 months of pregnancy- by State;County;DOH Race-Ethnicity;PRAMSAge Group;Infant Gender;Married;Poverty Level;Income (2000-2003);Income (2004-2011);Income (2012+);Birthweight;Smoke 3rd
Trimester;Smoke Before Pregnant;WIC During Pregnancy, for the Year(s)2000;2001;2002;2003;2004;2005;2006;2007;2008;2009;2010;2011;2012;2013
Note: Weighted responses, rounded to the nearest hundred; n/r (Not Reportable) - If the unweighted total responses for a dimension (row) is <30 that row will not be shown
Year: 2004
Smoke BeforePregnant
Yes NoWeighted
TotalResponses
# % C.I.(95%) # % C.I.(95%) #
Yes 300 9.2 6.6 - 12.6 3,300 90.8 87.4 - 93.4 3,600
No 800 5.5 4.5 - 6.8 13,100 94.5 93.2 - 95.5 13,800
WIC DuringPregnancy
Yes NoWeighted
TotalResponses
# % C.I.(95%) # % C.I.(95%) #
Yes 300 4.2 3.0 - 5.8 7,400 95.8 94.2 - 97.0 7,700
No 800 8.0 6.5 - 9.8 8,700 92.0 90.2 - 93.5 9,400
Report Source: The Hawaii Health Data Warehouse; Data Source: State of Hawaii, Department of Health, Family Health Services Division, Maternal and Child Health Branch, Pregnancy Risk Assessment Monitoring System
Report Date:02/08/201750/70

PRAMS Health Indicator Report - Drinking alcohol last 3 months of pregnancy- by State;County;DOH Race-Ethnicity;PRAMSAge Group;Infant Gender;Married;Poverty Level;Income (2000-2003);Income (2004-2011);Income (2012+);Birthweight;Smoke 3rd
Trimester;Smoke Before Pregnant;WIC During Pregnancy, for the Year(s)2000;2001;2002;2003;2004;2005;2006;2007;2008;2009;2010;2011;2012;2013
Note: Weighted responses, rounded to the nearest hundred; n/r (Not Reportable) - If the unweighted total responses for a dimension (row) is <30 that row will not be shown
Year: 2003
State
Yes NoWeighted
TotalResponses
# % C.I.(95%) # % C.I.(95%) #
Totals 800 4.3 3.3 - 5.6 16,700 95.7 94.4 - 96.7 17,500
County
Yes NoWeighted
TotalResponses
# % C.I.(95%) # % C.I.(95%) #
Hawaii 100 2.6 1.5 - 4.4 1,900 97.4 95.6 - 98.5 2,000
Honolulu 500 4.2 2.9 - 5.9 12,200 95.8 94.1 - 97.1 12,800
Kauai <50 5.3 2.8 - 9.8 800 94.7 90.2 - 97.2 800
Maui 100 6.9 4.8 - 9.9 1,700 93.1 90.1 - 95.2 1,900
Report Source: The Hawaii Health Data Warehouse; Data Source: State of Hawaii, Department of Health, Family Health Services Division, Maternal and Child Health Branch, Pregnancy Risk Assessment Monitoring System
Report Date:02/08/201751/70

PRAMS Health Indicator Report - Drinking alcohol last 3 months of pregnancy- by State;County;DOH Race-Ethnicity;PRAMSAge Group;Infant Gender;Married;Poverty Level;Income (2000-2003);Income (2004-2011);Income (2012+);Birthweight;Smoke 3rd
Trimester;Smoke Before Pregnant;WIC During Pregnancy, for the Year(s)2000;2001;2002;2003;2004;2005;2006;2007;2008;2009;2010;2011;2012;2013
Note: Weighted responses, rounded to the nearest hundred; n/r (Not Reportable) - If the unweighted total responses for a dimension (row) is <30 that row will not be shown
Year: 2003
DOH Race-Ethnicity
Yes NoWeighted
TotalResponses
# % C.I.(95%) # % C.I.(95%) #
Caucasian 300 8.2 5.4 - 12.1 3,400 91.8 87.9 - 94.6 3,800
Native Hawaiian 100 3.1 2.2 - 4.3 4,600 96.9 95.7 - 97.8 4,700
Chinese <50 6.3 1.6 - 21.3 600 93.7 78.7 - 98.4 700
Filipino 100 2.3 1.0 - 5.3 3,800 97.7 94.7 - 99.0 3,900
Japanese <50 1.3 0.3 - 5.7 2,000 98.7 94.3 - 99.7 2,000
Other 100 5.9 3.0 - 11.4 2,300 94.1 88.6 - 97.0 2,500
PRAMS AgeGroup
Yes NoWeighted
TotalResponses
# % C.I.(95%) # % C.I.(95%) #
<20 <50 3.0 1.1 - 8.1 1,500 97.0 91.9 - 98.9 1,600
20-24 100 2.8 1.5 - 5.4 4,000 97.2 94.6 - 98.5 4,200
25-34 500 5.4 3.9 - 7.5 8,300 94.6 92.5 - 96.1 8,800
35+ 100 3.9 2.1 - 7.3 2,900 96.1 92.7 - 97.9 3,000
Report Source: The Hawaii Health Data Warehouse; Data Source: State of Hawaii, Department of Health, Family Health Services Division, Maternal and Child Health Branch, Pregnancy Risk Assessment Monitoring System
Report Date:02/08/201752/70

PRAMS Health Indicator Report - Drinking alcohol last 3 months of pregnancy- by State;County;DOH Race-Ethnicity;PRAMSAge Group;Infant Gender;Married;Poverty Level;Income (2000-2003);Income (2004-2011);Income (2012+);Birthweight;Smoke 3rd
Trimester;Smoke Before Pregnant;WIC During Pregnancy, for the Year(s)2000;2001;2002;2003;2004;2005;2006;2007;2008;2009;2010;2011;2012;2013
Note: Weighted responses, rounded to the nearest hundred; n/r (Not Reportable) - If the unweighted total responses for a dimension (row) is <30 that row will not be shown
Year: 2003
Infant Gender
Yes NoWeighted
TotalResponses
# % C.I.(95%) # % C.I.(95%) #
Male 400 4.1 2.9 - 5.8 8,900 95.9 94.2 - 97.1 9,200
Female 400 4.6 3.1 - 6.7 7,900 95.4 93.3 - 96.9 8,200
Married
Yes NoWeighted
TotalResponses
# % C.I.(95%) # % C.I.(95%) #
Yes 500 4.8 3.5 - 6.5 10,900 95.2 93.5 - 96.5 11,500
No 200 3.5 2.2 - 5.4 5,800 96.5 94.6 - 97.8 6,000
Poverty Level
Yes NoWeighted
TotalResponses
# % C.I.(95%) # % C.I.(95%) #
0-130% 300 3.6 2.3 - 5.5 7,500 96.4 94.5 - 97.7 7,800
131-185% 100 5.0 2.7 - 9.1 2,400 95.0 90.9 - 97.3 2,500
186+% 300 5.8 3.9 - 8.7 5,100 94.2 91.3 - 96.1 5,500
Report Source: The Hawaii Health Data Warehouse; Data Source: State of Hawaii, Department of Health, Family Health Services Division, Maternal and Child Health Branch, Pregnancy Risk Assessment Monitoring System
Report Date:02/08/201753/70

PRAMS Health Indicator Report - Drinking alcohol last 3 months of pregnancy- by State;County;DOH Race-Ethnicity;PRAMSAge Group;Infant Gender;Married;Poverty Level;Income (2000-2003);Income (2004-2011);Income (2012+);Birthweight;Smoke 3rd
Trimester;Smoke Before Pregnant;WIC During Pregnancy, for the Year(s)2000;2001;2002;2003;2004;2005;2006;2007;2008;2009;2010;2011;2012;2013
Note: Weighted responses, rounded to the nearest hundred; n/r (Not Reportable) - If the unweighted total responses for a dimension (row) is <30 that row will not be shown
Year: 2003
Income(2000-2003)
Yes NoWeighted
TotalResponses
# % C.I.(95%) # % C.I.(95%) #
<=$15,000 200 4.5 2.6 - 7.8 4,100 95.5 92.2 - 97.4 4,300
$15,001-$25,000 <50 1.1 0.5 - 2.8 2,200 98.9 97.2 - 99.5 2,200
$25,001-$40,000 100 3.0 1.7 - 5.2 3,100 97.0 94.8 - 98.3 3,200
>=$40,001 400 6.2 4.3 - 8.9 6,200 93.8 91.1 - 95.7 6,600
Birthweight
Yes NoWeighted
TotalResponses
# % C.I.(95%) # % C.I.(95%) #
Low birth weight <50 3.2 1.0 - 9.9 1,200 96.8 90.1 - 99.0 1,200
Normal birth weight 700 4.4 3.4 - 5.7 15,500 95.6 94.3 - 96.6 16,300
Smoke 3rdTrimester
Yes NoWeighted
TotalResponses
# % C.I.(95%) # % C.I.(95%) #
Yes 100 7.4 3.9 - 13.5 1,500 92.6 86.5 - 96.1 1,600
No 600 4.1 3.0 - 5.4 14,900 95.9 94.6 - 97.0 15,600
Report Source: The Hawaii Health Data Warehouse; Data Source: State of Hawaii, Department of Health, Family Health Services Division, Maternal and Child Health Branch, Pregnancy Risk Assessment Monitoring System
Report Date:02/08/201754/70

PRAMS Health Indicator Report - Drinking alcohol last 3 months of pregnancy- by State;County;DOH Race-Ethnicity;PRAMSAge Group;Infant Gender;Married;Poverty Level;Income (2000-2003);Income (2004-2011);Income (2012+);Birthweight;Smoke 3rd
Trimester;Smoke Before Pregnant;WIC During Pregnancy, for the Year(s)2000;2001;2002;2003;2004;2005;2006;2007;2008;2009;2010;2011;2012;2013
Note: Weighted responses, rounded to the nearest hundred; n/r (Not Reportable) - If the unweighted total responses for a dimension (row) is <30 that row will not be shown
Year: 2003
Smoke BeforePregnant
Yes NoWeighted
TotalResponses
# % C.I.(95%) # % C.I.(95%) #
Yes 200 4.6 2.8 - 7.5 3,400 95.4 92.5 - 97.2 3,500
No 600 4.4 3.3 - 5.9 12,900 95.6 94.1 - 96.7 13,500
WIC DuringPregnancy
Yes NoWeighted
TotalResponses
# % C.I.(95%) # % C.I.(95%) #
Yes 200 3.1 2.0 - 4.9 7,100 96.9 95.1 - 98.0 7,400
No 500 5.2 3.7 - 7.1 9,400 94.8 92.9 - 96.3 9,900
Report Source: The Hawaii Health Data Warehouse; Data Source: State of Hawaii, Department of Health, Family Health Services Division, Maternal and Child Health Branch, Pregnancy Risk Assessment Monitoring System
Report Date:02/08/201755/70

PRAMS Health Indicator Report - Drinking alcohol last 3 months of pregnancy- by State;County;DOH Race-Ethnicity;PRAMSAge Group;Infant Gender;Married;Poverty Level;Income (2000-2003);Income (2004-2011);Income (2012+);Birthweight;Smoke 3rd
Trimester;Smoke Before Pregnant;WIC During Pregnancy, for the Year(s)2000;2001;2002;2003;2004;2005;2006;2007;2008;2009;2010;2011;2012;2013
Note: Weighted responses, rounded to the nearest hundred; n/r (Not Reportable) - If the unweighted total responses for a dimension (row) is <30 that row will not be shown
Year: 2002
State
Yes NoWeighted
TotalResponses
# % C.I.(95%) # % C.I.(95%) #
Totals 600 3.6 2.7 - 4.7 16,200 96.4 95.3 - 97.3 16,800
County
Yes NoWeighted
TotalResponses
# % C.I.(95%) # % C.I.(95%) #
Hawaii 100 4.5 2.9 - 7.0 1,900 95.5 93.0 - 97.1 2,000
Honolulu 400 3.2 2.2 - 4.8 12,000 96.8 95.2 - 97.8 12,400
Kauai <50 6.1 3.2 - 11.2 600 93.9 88.8 - 96.8 700
Maui 100 4.2 2.6 - 6.7 1,700 95.8 93.3 - 97.4 1,800
Report Source: The Hawaii Health Data Warehouse; Data Source: State of Hawaii, Department of Health, Family Health Services Division, Maternal and Child Health Branch, Pregnancy Risk Assessment Monitoring System
Report Date:02/08/201756/70

PRAMS Health Indicator Report - Drinking alcohol last 3 months of pregnancy- by State;County;DOH Race-Ethnicity;PRAMSAge Group;Infant Gender;Married;Poverty Level;Income (2000-2003);Income (2004-2011);Income (2012+);Birthweight;Smoke 3rd
Trimester;Smoke Before Pregnant;WIC During Pregnancy, for the Year(s)2000;2001;2002;2003;2004;2005;2006;2007;2008;2009;2010;2011;2012;2013
Note: Weighted responses, rounded to the nearest hundred; n/r (Not Reportable) - If the unweighted total responses for a dimension (row) is <30 that row will not be shown
Year: 2002
DOH Race-Ethnicity
Yes NoWeighted
TotalResponses
# % C.I.(95%) # % C.I.(95%) #
Caucasian 300 8.7 5.7 - 13.0 3,300 91.3 87.0 - 94.3 3,600
Native Hawaiian 100 3.2 2.3 - 4.5 4,400 96.8 95.5 - 97.7 4,600
Chinese 0 0.0 - 600 100.0 - 600
Filipino 100 1.9 0.8 - 4.6 3,300 98.1 95.4 - 99.2 3,400
Japanese <50 0.8 0.3 - 2.2 2,300 99.2 97.8 - 99.7 2,400
Other 100 2.8 1.0 - 7.4 2,300 97.2 92.6 - 99.0 2,300
PRAMS AgeGroup
Yes NoWeighted
TotalResponses
# % C.I.(95%) # % C.I.(95%) #
<20 <50 2.6 0.9 - 7.0 1,500 97.4 93.0 - 99.1 1,500
20-24 100 2.6 1.5 - 4.6 4,100 97.4 95.4 - 98.5 4,200
25-34 400 4.6 3.2 - 6.5 8,000 95.4 93.5 - 96.8 8,400
35+ 100 2.7 1.2 - 6.0 2,600 97.3 94.0 - 98.8 2,700
Report Source: The Hawaii Health Data Warehouse; Data Source: State of Hawaii, Department of Health, Family Health Services Division, Maternal and Child Health Branch, Pregnancy Risk Assessment Monitoring System
Report Date:02/08/201757/70

PRAMS Health Indicator Report - Drinking alcohol last 3 months of pregnancy- by State;County;DOH Race-Ethnicity;PRAMSAge Group;Infant Gender;Married;Poverty Level;Income (2000-2003);Income (2004-2011);Income (2012+);Birthweight;Smoke 3rd
Trimester;Smoke Before Pregnant;WIC During Pregnancy, for the Year(s)2000;2001;2002;2003;2004;2005;2006;2007;2008;2009;2010;2011;2012;2013
Note: Weighted responses, rounded to the nearest hundred; n/r (Not Reportable) - If the unweighted total responses for a dimension (row) is <30 that row will not be shown
Year: 2002
Infant Gender
Yes NoWeighted
TotalResponses
# % C.I.(95%) # % C.I.(95%) #
Male 300 3.6 2.5 - 5.3 8,000 96.4 94.7 - 97.5 8,300
Female 300 3.6 2.4 - 5.3 8,100 96.4 94.7 - 97.6 8,400
Married
Yes NoWeighted
TotalResponses
# % C.I.(95%) # % C.I.(95%) #
Yes 400 3.9 2.8 - 5.6 10,900 96.1 94.4 - 97.2 11,400
No 200 2.9 1.9 - 4.3 5,200 97.1 95.7 - 98.1 5,400
Poverty Level
Yes NoWeighted
TotalResponses
# % C.I.(95%) # % C.I.(95%) #
0-130% 100 2.1 1.3 - 3.2 6,500 97.9 96.8 - 98.7 6,600
131-185% 200 5.1 2.8 - 9.0 3,200 94.9 91.0 - 97.2 3,400
186+% 300 5.3 3.5 - 8.0 5,000 94.7 92.0 - 96.5 5,300
Report Source: The Hawaii Health Data Warehouse; Data Source: State of Hawaii, Department of Health, Family Health Services Division, Maternal and Child Health Branch, Pregnancy Risk Assessment Monitoring System
Report Date:02/08/201758/70
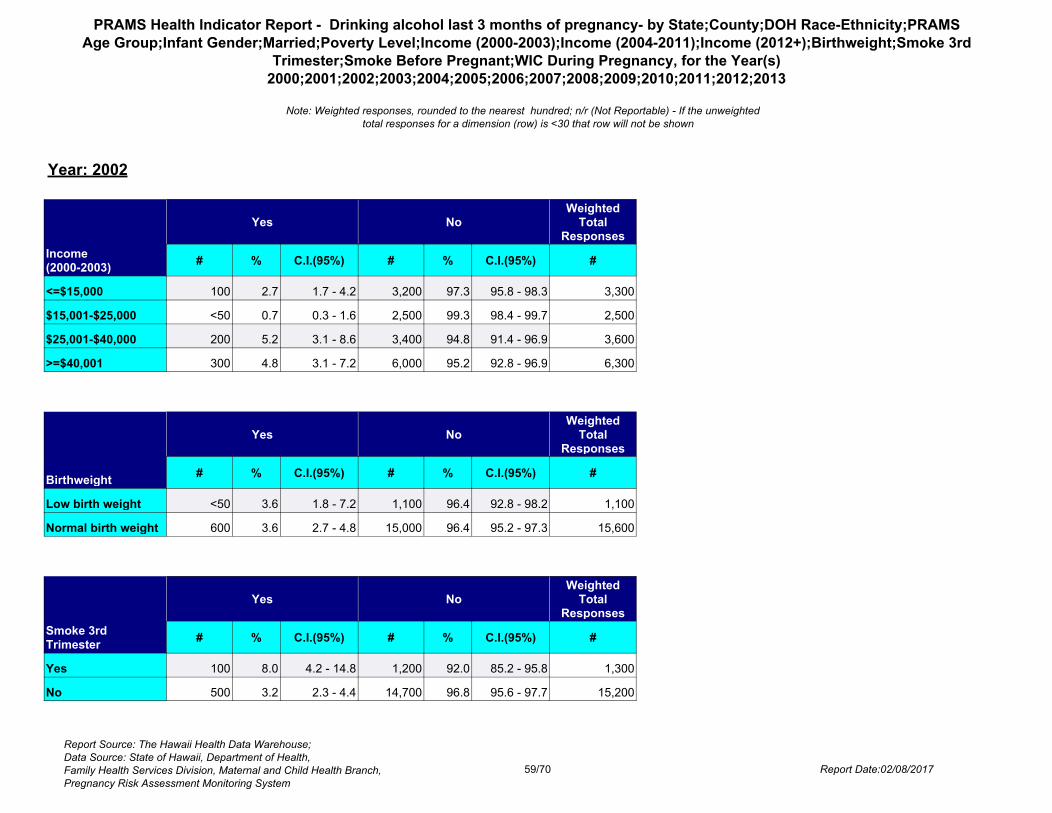
PRAMS Health Indicator Report - Drinking alcohol last 3 months of pregnancy- by State;County;DOH Race-Ethnicity;PRAMSAge Group;Infant Gender;Married;Poverty Level;Income (2000-2003);Income (2004-2011);Income (2012+);Birthweight;Smoke 3rd
Trimester;Smoke Before Pregnant;WIC During Pregnancy, for the Year(s)2000;2001;2002;2003;2004;2005;2006;2007;2008;2009;2010;2011;2012;2013
Note: Weighted responses, rounded to the nearest hundred; n/r (Not Reportable) - If the unweighted total responses for a dimension (row) is <30 that row will not be shown
Year: 2002
Income(2000-2003)
Yes NoWeighted
TotalResponses
# % C.I.(95%) # % C.I.(95%) #
<=$15,000 100 2.7 1.7 - 4.2 3,200 97.3 95.8 - 98.3 3,300
$15,001-$25,000 <50 0.7 0.3 - 1.6 2,500 99.3 98.4 - 99.7 2,500
$25,001-$40,000 200 5.2 3.1 - 8.6 3,400 94.8 91.4 - 96.9 3,600
>=$40,001 300 4.8 3.1 - 7.2 6,000 95.2 92.8 - 96.9 6,300
Birthweight
Yes NoWeighted
TotalResponses
# % C.I.(95%) # % C.I.(95%) #
Low birth weight <50 3.6 1.8 - 7.2 1,100 96.4 92.8 - 98.2 1,100
Normal birth weight 600 3.6 2.7 - 4.8 15,000 96.4 95.2 - 97.3 15,600
Smoke 3rdTrimester
Yes NoWeighted
TotalResponses
# % C.I.(95%) # % C.I.(95%) #
Yes 100 8.0 4.2 - 14.8 1,200 92.0 85.2 - 95.8 1,300
No 500 3.2 2.3 - 4.4 14,700 96.8 95.6 - 97.7 15,200
Report Source: The Hawaii Health Data Warehouse; Data Source: State of Hawaii, Department of Health, Family Health Services Division, Maternal and Child Health Branch, Pregnancy Risk Assessment Monitoring System
Report Date:02/08/201759/70

PRAMS Health Indicator Report - Drinking alcohol last 3 months of pregnancy- by State;County;DOH Race-Ethnicity;PRAMSAge Group;Infant Gender;Married;Poverty Level;Income (2000-2003);Income (2004-2011);Income (2012+);Birthweight;Smoke 3rd
Trimester;Smoke Before Pregnant;WIC During Pregnancy, for the Year(s)2000;2001;2002;2003;2004;2005;2006;2007;2008;2009;2010;2011;2012;2013
Note: Weighted responses, rounded to the nearest hundred; n/r (Not Reportable) - If the unweighted total responses for a dimension (row) is <30 that row will not be shown
Year: 2002
Smoke BeforePregnant
Yes NoWeighted
TotalResponses
# % C.I.(95%) # % C.I.(95%) #
Yes 200 5.2 3.1 - 8.5 3,100 94.8 91.5 - 96.9 3,200
No 400 3.1 2.2 - 4.4 12,700 96.9 95.6 - 97.8 13,200
WIC DuringPregnancy
Yes NoWeighted
TotalResponses
# % C.I.(95%) # % C.I.(95%) #
Yes 200 2.6 1.5 - 4.2 6,900 97.4 95.8 - 98.5 7,100
No 400 4.4 3.2 - 6.1 9,200 95.6 93.9 - 96.8 9,600
Report Source: The Hawaii Health Data Warehouse; Data Source: State of Hawaii, Department of Health, Family Health Services Division, Maternal and Child Health Branch, Pregnancy Risk Assessment Monitoring System
Report Date:02/08/201760/70

PRAMS Health Indicator Report - Drinking alcohol last 3 months of pregnancy- by State;County;DOH Race-Ethnicity;PRAMSAge Group;Infant Gender;Married;Poverty Level;Income (2000-2003);Income (2004-2011);Income (2012+);Birthweight;Smoke 3rd
Trimester;Smoke Before Pregnant;WIC During Pregnancy, for the Year(s)2000;2001;2002;2003;2004;2005;2006;2007;2008;2009;2010;2011;2012;2013
Note: Weighted responses, rounded to the nearest hundred; n/r (Not Reportable) - If the unweighted total responses for a dimension (row) is <30 that row will not be shown
Year: 2001
State
Yes NoWeighted
TotalResponses
# % C.I.(95%) # % C.I.(95%) #
Totals 700 4.5 3.6 - 5.6 15,600 95.5 94.4 - 96.4 16,400
County
Yes NoWeighted
TotalResponses
# % C.I.(95%) # % C.I.(95%) #
Hawaii 100 4.7 3.1 - 7.1 1,700 95.3 92.9 - 96.9 1,800
Honolulu 500 4.2 3.2 - 5.6 11,600 95.8 94.4 - 96.8 12,100
Kauai <50 5.2 2.7 - 9.7 700 94.8 90.3 - 97.3 800
Maui 100 6.0 3.9 - 9.0 1,600 94.0 91.0 - 96.1 1,700
Report Source: The Hawaii Health Data Warehouse; Data Source: State of Hawaii, Department of Health, Family Health Services Division, Maternal and Child Health Branch, Pregnancy Risk Assessment Monitoring System
Report Date:02/08/201761/70

PRAMS Health Indicator Report - Drinking alcohol last 3 months of pregnancy- by State;County;DOH Race-Ethnicity;PRAMSAge Group;Infant Gender;Married;Poverty Level;Income (2000-2003);Income (2004-2011);Income (2012+);Birthweight;Smoke 3rd
Trimester;Smoke Before Pregnant;WIC During Pregnancy, for the Year(s)2000;2001;2002;2003;2004;2005;2006;2007;2008;2009;2010;2011;2012;2013
Note: Weighted responses, rounded to the nearest hundred; n/r (Not Reportable) - If the unweighted total responses for a dimension (row) is <30 that row will not be shown
Year: 2001
DOH Race-Ethnicity
Yes NoWeighted
TotalResponses
# % C.I.(95%) # % C.I.(95%) #
Caucasian 300 8.8 6.3 - 12.3 3,200 91.2 87.7 - 93.7 3,500
Native Hawaiian 200 3.6 2.8 - 4.6 4,300 96.4 95.4 - 97.2 4,400
Chinese <50 4.1 1.1 - 14.3 700 95.9 85.7 - 98.9 700
Filipino <50 1.3 0.5 - 3.5 3,400 98.7 96.5 - 99.5 3,400
Japanese 100 3.0 1.2 - 7.4 1,900 97.0 92.6 - 98.8 2,000
Other 100 5.8 3.2 - 10.3 2,100 94.2 89.7 - 96.8 2,200
PRAMS AgeGroup
Yes NoWeighted
TotalResponses
# % C.I.(95%) # % C.I.(95%) #
<20 <50 1.6 0.8 - 3.0 1,500 98.4 97.0 - 99.2 1,600
20-24 100 3.3 2.0 - 5.4 4,100 96.7 94.6 - 98.0 4,200
25-34 400 5.0 3.8 - 6.7 7,500 95.0 93.3 - 96.2 7,900
35+ 200 6.5 4.0 - 10.3 2,500 93.5 89.7 - 96.0 2,700
Report Source: The Hawaii Health Data Warehouse; Data Source: State of Hawaii, Department of Health, Family Health Services Division, Maternal and Child Health Branch, Pregnancy Risk Assessment Monitoring System
Report Date:02/08/201762/70

PRAMS Health Indicator Report - Drinking alcohol last 3 months of pregnancy- by State;County;DOH Race-Ethnicity;PRAMSAge Group;Infant Gender;Married;Poverty Level;Income (2000-2003);Income (2004-2011);Income (2012+);Birthweight;Smoke 3rd
Trimester;Smoke Before Pregnant;WIC During Pregnancy, for the Year(s)2000;2001;2002;2003;2004;2005;2006;2007;2008;2009;2010;2011;2012;2013
Note: Weighted responses, rounded to the nearest hundred; n/r (Not Reportable) - If the unweighted total responses for a dimension (row) is <30 that row will not be shown
Year: 2001
Infant Gender
Yes NoWeighted
TotalResponses
# % C.I.(95%) # % C.I.(95%) #
Male 300 3.8 2.7 - 5.3 8,000 96.2 94.7 - 97.3 8,300
Female 400 5.2 4.0 - 6.9 7,600 94.8 93.1 - 96.0 8,100
Married
Yes NoWeighted
TotalResponses
# % C.I.(95%) # % C.I.(95%) #
Yes 500 4.7 3.6 - 6.1 10,400 95.3 93.9 - 96.4 10,900
No 200 4.1 2.9 - 6.0 5,200 95.9 94.0 - 97.1 5,400
Poverty Level
Yes NoWeighted
TotalResponses
# % C.I.(95%) # % C.I.(95%) #
0-130% 200 3.7 2.5 - 5.4 6,000 96.3 94.6 - 97.5 6,200
131-185% 100 3.1 2.1 - 4.5 3,400 96.9 95.5 - 97.9 3,500
186+% 300 6.1 4.3 - 8.6 5,100 93.9 91.4 - 95.7 5,400
Report Source: The Hawaii Health Data Warehouse; Data Source: State of Hawaii, Department of Health, Family Health Services Division, Maternal and Child Health Branch, Pregnancy Risk Assessment Monitoring System
Report Date:02/08/201763/70

PRAMS Health Indicator Report - Drinking alcohol last 3 months of pregnancy- by State;County;DOH Race-Ethnicity;PRAMSAge Group;Infant Gender;Married;Poverty Level;Income (2000-2003);Income (2004-2011);Income (2012+);Birthweight;Smoke 3rd
Trimester;Smoke Before Pregnant;WIC During Pregnancy, for the Year(s)2000;2001;2002;2003;2004;2005;2006;2007;2008;2009;2010;2011;2012;2013
Note: Weighted responses, rounded to the nearest hundred; n/r (Not Reportable) - If the unweighted total responses for a dimension (row) is <30 that row will not be shown
Year: 2001
Income(2000-2003)
Yes NoWeighted
TotalResponses
# % C.I.(95%) # % C.I.(95%) #
<=$15,000 100 4.1 2.5 - 6.6 3,200 95.9 93.4 - 97.5 3,300
$15,001-$25,000 100 3.6 1.8 - 7.1 2,200 96.4 92.9 - 98.2 2,200
$25,001-$40,000 100 3.2 2.1 - 4.9 3,400 96.8 95.1 - 97.9 3,500
>=$40,001 400 5.6 4.0 - 7.7 6,000 94.4 92.3 - 96.0 6,300
Birthweight
Yes NoWeighted
TotalResponses
# % C.I.(95%) # % C.I.(95%) #
Low birth weight <50 2.6 0.8 - 7.8 1,000 97.4 92.2 - 99.2 1,000
Normal birth weight 700 4.6 3.7 - 5.8 14,600 95.4 94.2 - 96.3 15,300
Smoke 3rdTrimester
Yes NoWeighted
TotalResponses
# % C.I.(95%) # % C.I.(95%) #
Yes 100 7.2 4.2 - 12.2 1,400 92.8 87.8 - 95.8 1,600
No 600 4.1 3.2 - 5.2 14,100 95.9 94.8 - 96.8 14,600
Report Source: The Hawaii Health Data Warehouse; Data Source: State of Hawaii, Department of Health, Family Health Services Division, Maternal and Child Health Branch, Pregnancy Risk Assessment Monitoring System
Report Date:02/08/201764/70

PRAMS Health Indicator Report - Drinking alcohol last 3 months of pregnancy- by State;County;DOH Race-Ethnicity;PRAMSAge Group;Infant Gender;Married;Poverty Level;Income (2000-2003);Income (2004-2011);Income (2012+);Birthweight;Smoke 3rd
Trimester;Smoke Before Pregnant;WIC During Pregnancy, for the Year(s)2000;2001;2002;2003;2004;2005;2006;2007;2008;2009;2010;2011;2012;2013
Note: Weighted responses, rounded to the nearest hundred; n/r (Not Reportable) - If the unweighted total responses for a dimension (row) is <30 that row will not be shown
Year: 2001
Smoke BeforePregnant
Yes NoWeighted
TotalResponses
# % C.I.(95%) # % C.I.(95%) #
Yes 200 6.2 4.1 - 9.2 3,100 93.8 90.8 - 95.9 3,400
No 500 3.8 2.9 - 4.9 12,100 96.2 95.1 - 97.1 12,600
WIC DuringPregnancy
Yes NoWeighted
TotalResponses
# % C.I.(95%) # % C.I.(95%) #
Yes 300 4.0 2.9 - 5.6 6,700 96.0 94.4 - 97.1 7,000
No 500 4.9 3.7 - 6.4 8,900 95.1 93.6 - 96.3 9,400
Report Source: The Hawaii Health Data Warehouse; Data Source: State of Hawaii, Department of Health, Family Health Services Division, Maternal and Child Health Branch, Pregnancy Risk Assessment Monitoring System
Report Date:02/08/201765/70

PRAMS Health Indicator Report - Drinking alcohol last 3 months of pregnancy- by State;County;DOH Race-Ethnicity;PRAMSAge Group;Infant Gender;Married;Poverty Level;Income (2000-2003);Income (2004-2011);Income (2012+);Birthweight;Smoke 3rd
Trimester;Smoke Before Pregnant;WIC During Pregnancy, for the Year(s)2000;2001;2002;2003;2004;2005;2006;2007;2008;2009;2010;2011;2012;2013
Note: Weighted responses, rounded to the nearest hundred; n/r (Not Reportable) - If the unweighted total responses for a dimension (row) is <30 that row will not be shown
Year: 2000
State
Yes NoWeighted
TotalResponses
# % C.I.(95%) # % C.I.(95%) #
Totals 800 4.8 4.0 - 5.8 15,900 95.2 94.2 - 96.0 16,700
County
Yes NoWeighted
TotalResponses
# % C.I.(95%) # % C.I.(95%) #
Hawaii 100 4.0 2.5 - 6.2 1,800 96.0 93.8 - 97.5 1,900
Honolulu 500 4.2 3.3 - 5.5 11,800 95.8 94.5 - 96.7 12,400
Kauai 100 8.3 4.9 - 13.8 600 91.7 86.2 - 95.1 700
Maui 100 8.2 5.8 - 11.6 1,600 91.8 88.4 - 94.2 1,700
Report Source: The Hawaii Health Data Warehouse; Data Source: State of Hawaii, Department of Health, Family Health Services Division, Maternal and Child Health Branch, Pregnancy Risk Assessment Monitoring System
Report Date:02/08/201766/70

PRAMS Health Indicator Report - Drinking alcohol last 3 months of pregnancy- by State;County;DOH Race-Ethnicity;PRAMSAge Group;Infant Gender;Married;Poverty Level;Income (2000-2003);Income (2004-2011);Income (2012+);Birthweight;Smoke 3rd
Trimester;Smoke Before Pregnant;WIC During Pregnancy, for the Year(s)2000;2001;2002;2003;2004;2005;2006;2007;2008;2009;2010;2011;2012;2013
Note: Weighted responses, rounded to the nearest hundred; n/r (Not Reportable) - If the unweighted total responses for a dimension (row) is <30 that row will not be shown
Year: 2000
DOH Race-Ethnicity
Yes NoWeighted
TotalResponses
# % C.I.(95%) # % C.I.(95%) #
Caucasian 400 9.3 6.9 - 12.4 3,600 90.7 87.6 - 93.1 4,000
Native Hawaiian 200 4.0 3.1 - 5.1 4,300 96.0 94.9 - 96.9 4,500
Chinese <50 5.6 1.9 - 15.1 600 94.4 84.9 - 98.1 600
Filipino 100 2.6 1.4 - 5.1 3,300 97.4 94.9 - 98.6 3,400
Japanese <50 1.3 0.4 - 4.3 2,000 98.7 95.7 - 99.6 2,000
Other 100 4.6 2.6 - 8.0 2,100 95.4 92.0 - 97.4 2,200
PRAMS AgeGroup
Yes NoWeighted
TotalResponses
# % C.I.(95%) # % C.I.(95%) #
<20 <50 1.5 0.7 - 3.1 1,800 98.5 96.9 - 99.3 1,800
20-24 200 4.1 2.8 - 6.0 3,900 95.9 94.0 - 97.2 4,000
25-34 400 5.1 3.8 - 6.7 7,500 94.9 93.3 - 96.2 7,900
35+ 200 6.9 4.8 - 9.9 2,700 93.1 90.1 - 95.2 2,900
Report Source: The Hawaii Health Data Warehouse; Data Source: State of Hawaii, Department of Health, Family Health Services Division, Maternal and Child Health Branch, Pregnancy Risk Assessment Monitoring System
Report Date:02/08/201767/70

PRAMS Health Indicator Report - Drinking alcohol last 3 months of pregnancy- by State;County;DOH Race-Ethnicity;PRAMSAge Group;Infant Gender;Married;Poverty Level;Income (2000-2003);Income (2004-2011);Income (2012+);Birthweight;Smoke 3rd
Trimester;Smoke Before Pregnant;WIC During Pregnancy, for the Year(s)2000;2001;2002;2003;2004;2005;2006;2007;2008;2009;2010;2011;2012;2013
Note: Weighted responses, rounded to the nearest hundred; n/r (Not Reportable) - If the unweighted total responses for a dimension (row) is <30 that row will not be shown
Year: 2000
Infant Gender
Yes NoWeighted
TotalResponses
# % C.I.(95%) # % C.I.(95%) #
Male 400 5.2 4.0 - 6.7 8,200 94.8 93.3 - 96.0 8,600
Female 400 4.4 3.3 - 5.7 7,700 95.6 94.3 - 96.7 8,100
Married
Yes NoWeighted
TotalResponses
# % C.I.(95%) # % C.I.(95%) #
Yes 600 4.9 3.8 - 6.1 11,000 95.1 93.9 - 96.2 11,600
No 200 4.7 3.3 - 6.5 4,900 95.3 93.5 - 96.7 5,100
Poverty Level
Yes NoWeighted
TotalResponses
# % C.I.(95%) # % C.I.(95%) #
0-130% 200 3.4 2.5 - 4.6 6,800 96.6 95.4 - 97.5 7,100
131-185% 100 6.2 4.0 - 9.5 2,100 93.8 90.5 - 96.0 2,200
186+% 400 6.2 4.6 - 8.2 5,700 93.8 91.8 - 95.4 6,100
Report Source: The Hawaii Health Data Warehouse; Data Source: State of Hawaii, Department of Health, Family Health Services Division, Maternal and Child Health Branch, Pregnancy Risk Assessment Monitoring System
Report Date:02/08/201768/70

PRAMS Health Indicator Report - Drinking alcohol last 3 months of pregnancy- by State;County;DOH Race-Ethnicity;PRAMSAge Group;Infant Gender;Married;Poverty Level;Income (2000-2003);Income (2004-2011);Income (2012+);Birthweight;Smoke 3rd
Trimester;Smoke Before Pregnant;WIC During Pregnancy, for the Year(s)2000;2001;2002;2003;2004;2005;2006;2007;2008;2009;2010;2011;2012;2013
Note: Weighted responses, rounded to the nearest hundred; n/r (Not Reportable) - If the unweighted total responses for a dimension (row) is <30 that row will not be shown
Year: 2000
Income(2000-2003)
Yes NoWeighted
TotalResponses
# % C.I.(95%) # % C.I.(95%) #
<=$15,000 100 3.7 2.4 - 5.8 3,700 96.3 94.2 - 97.6 3,900
$15,001-$25,000 100 2.9 1.8 - 4.6 2,600 97.1 95.4 - 98.2 2,700
$25,001-$40,000 200 5.4 3.6 - 8.1 3,000 94.6 91.9 - 96.4 3,200
>=$40,001 400 6.0 4.5 - 8.0 5,800 94.0 92.0 - 95.5 6,200
Birthweight
Yes NoWeighted
TotalResponses
# % C.I.(95%) # % C.I.(95%) #
Low birth weight <50 4.2 2.4 - 7.3 1,000 95.8 92.7 - 97.6 1,100
Normal birth weight 700 4.8 3.9 - 5.8 14,700 95.2 94.2 - 96.1 15,500
Smoke 3rdTrimester
Yes NoWeighted
TotalResponses
# % C.I.(95%) # % C.I.(95%) #
Yes 100 8.5 5.5 - 12.8 1,300 91.5 87.2 - 94.5 1,400
No 700 4.4 3.6 - 5.5 14,400 95.6 94.5 - 96.4 15,100
Report Source: The Hawaii Health Data Warehouse; Data Source: State of Hawaii, Department of Health, Family Health Services Division, Maternal and Child Health Branch, Pregnancy Risk Assessment Monitoring System
Report Date:02/08/201769/70

PRAMS Health Indicator Report - Drinking alcohol last 3 months of pregnancy- by State;County;DOH Race-Ethnicity;PRAMSAge Group;Infant Gender;Married;Poverty Level;Income (2000-2003);Income (2004-2011);Income (2012+);Birthweight;Smoke 3rd
Trimester;Smoke Before Pregnant;WIC During Pregnancy, for the Year(s)2000;2001;2002;2003;2004;2005;2006;2007;2008;2009;2010;2011;2012;2013
Note: Weighted responses, rounded to the nearest hundred; n/r (Not Reportable) - If the unweighted total responses for a dimension (row) is <30 that row will not be shown
Year: 2000
Smoke BeforePregnant
Yes NoWeighted
TotalResponses
# % C.I.(95%) # % C.I.(95%) #
Yes 200 5.8 4.1 - 8.2 3,100 94.2 91.8 - 95.9 3,300
No 600 4.5 3.6 - 5.7 12,500 95.5 94.3 - 96.4 13,100
WIC DuringPregnancy
Yes NoWeighted
TotalResponses
# % C.I.(95%) # % C.I.(95%) #
Yes 300 4.0 2.9 - 5.5 7,000 96.0 94.5 - 97.1 7,300
No 500 5.4 4.3 - 6.9 8,800 94.6 93.1 - 95.7 9,300
Report Source: The Hawaii Health Data Warehouse; Data Source: State of Hawaii, Department of Health, Family Health Services Division, Maternal and Child Health Branch, Pregnancy Risk Assessment Monitoring System
Report Date:02/08/201770/70