prague 3 -11-2005giovanni sabatini the evolution of initial public offerings in italy giovanni...
TRANSCRIPT

Prague 3 -11-2005 Giovanni Sabatini
The Evolution of Initial The Evolution of Initial Public Offerings in ItalyPublic Offerings in Italy
Giovanni Sabatini

Prague, 3-11-2005 Giovanni Sabatini
AgendaAgenda
Reasons to go public/stay private
The evolution of IPO’s in Italy
Final considerations
Empirical evidence
Introduction

Prague, 3-11-2005 Giovanni Sabatini
IntroductionIntroduction
The role of stock markets in financing investments, monitoring companies, reallocating corporate control varies greatly among developed capitalistic economies.
Market-oriented Systems– In Anglo-Saxon countries the stock market plays a central
role in those functions Bank-oriented Systems
– In most Continental European countries and in Japan banks have played a major role in financing companies

Prague, 3-11-2005 Giovanni Sabatini
IntroductionIntroduction IPO stands for initial public offering, i.e. when a
company sells its shares to the public for the first time.
Initial Public Offerings (IPOs) have represented the traditional way of raising capital for high-growth firms. Until ’90 IPOs have been limited to US and UK, where capital markets are more developed
In the ‘90s, large privatization programs in European markets led to a new wave of IPOs
Internet boom created another wave of IPOs worldwide (late ’90s)

Prague, 3-11-2005 Giovanni Sabatini
AgendaAgenda
Reasons to go public/stay private
The evolution of IPO’s in Italy
Final considerations
Empirical evidence
Introduction

Prague, 3-11-2005 Giovanni Sabatini
Reasons to go publicReasons to go public Strategic
– Growth: Raise capital - Investments too large to be provided by the founders
– Diversify (dilution effect) - Share business risk among many owners
Commercial – Enter Global competition – Acquisitions (cross-borders)
become more feasible– Increase visibility – (e.g. listing on the NYSE)
Financial – Rebalance capital structure – Cost of credit Increased bargaining power with banks– Exploit mispricing - If some stocks are mispriced, the
entrepreneurs recognizing that other companies in the same industry are overvalued, have an incentive to go public
Reputation – Transparency - Increase the accountability of the firm and
improve the reputation by reducing information asymmetry– Improve Corporate Governance - listed companies have to
comply with a Code of Discipline

Prague, 3-11-2005 Giovanni Sabatini
Reasons to stay privateReasons to stay private Maintain the control over the firm
– in widely held companies, dispersed shareholders do not participate in the annual meetings (they “vote with their feet”, selling the shares)
– the control of the firm is held by strong managers who act for their own interest
Avoid outside control (eg. regulatory bodies, auditor, financial analysts) - Public firms must regularly report to the Authorities and to the investors
Avoid underpricing - The IPO is expensive as the offer price is set at low levels to attract investors
TAX opaqueness
Direct and indirect costs of going public
Prague, 3-11-2005 Giovanni Sabatini
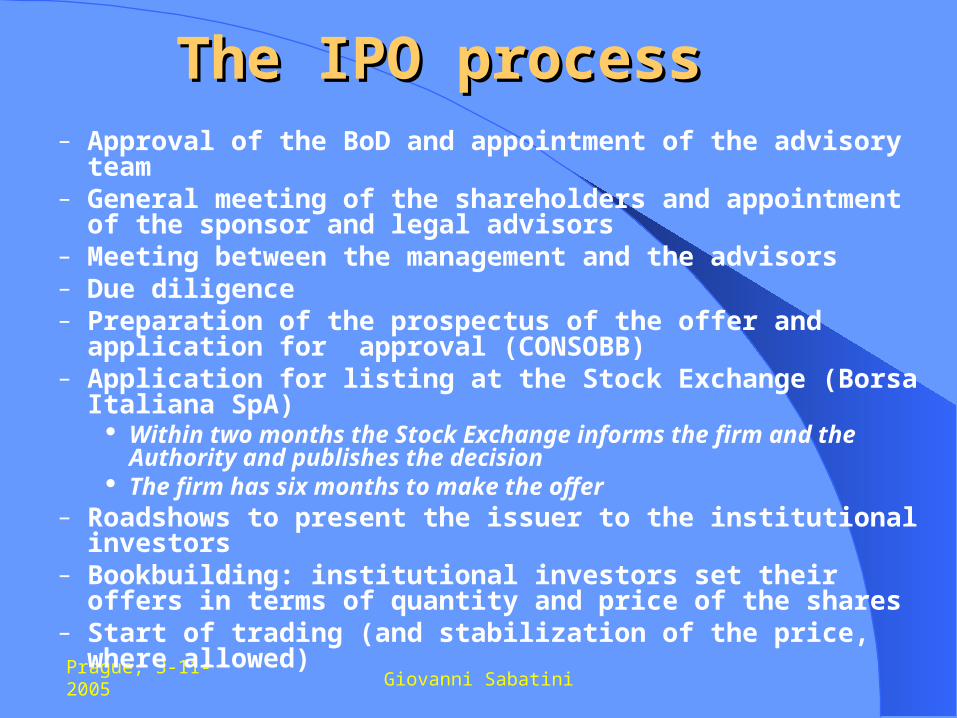
The IPO processThe IPO process– Approval of the BoD and appointment of the advisory
team – General meeting of the shareholders and appointment
of the sponsor and legal advisors– Meeting between the management and the advisors– Due diligence– Preparation of the prospectus of the offer and
application for approval (CONSOBB)– Application for listing at the Stock Exchange (Borsa
Italiana SpA) Within two months the Stock Exchange informs the firm
and the Authority and publishes the decision The firm has six months to make the offer
– Roadshows to present the issuer to the institutional investors
– Bookbuilding: institutional investors set their offers in terms of quantity and price of the shares
– Start of trading (and stabilization of the price, where allowed)
Prague, 3-11-2005 Giovanni Sabatini
The pricingThe pricing
Mechanisms to set the IPO price:
– Auction– Fixed Price– Price range (binding)– Price range not binding

Prague, 3-11-2005 Giovanni Sabatini
AllotmentAllotment
The offer differs depending on the type of investor to whom it is addressed– Private placement (to institutional investors) – this
implies that before the offering the underwriters contact potential IPO subscribers and collect indicative bids, with or without limit price (book building)
– Retail offer (to the public) – there is no discrimination among investors
The prospectus normally prescribes a minimum number of shares to be allotted to the public and a maximum number to institutional investors

Prague, 3-11-2005 Giovanni Sabatini
Special clausesSpecial clauses Green shoe option – allows the underwriter to place a further
fraction of IPO shares on the market (generally between 10-15% of the IPO shares within 30 days from the listing)
Overallotment – the underwriters assign an amount of shares to IPO subscribers that is larger than the IPO size; the short position is covered after the listing (by exercising the green shoe option or by repurchasing the shares)
Lock-up agreement – controlling shareholders and other insiders commit not to sell their portfolio shares within a certain period of time after listing (signalling their positive expectation about the firm value)
Bonus shares – additional shares assigned for free to investors retaining IPO stock up to a certain deadline (used in privatization offerings)
Remedy share – commitment by the IPO promoters that additional shares will be assigned for free to subscribers, in the event that the business targets declared in the prospectus will not be reached
Prague, 3-11-2005 Giovanni Sabatini
AgendaAgenda
Reasons to go public/stay private
The evolution of IPO’s in Italy
Final considerations
Empirical evidence
Introduction
Prague, 3-11-2005 Giovanni Sabatini
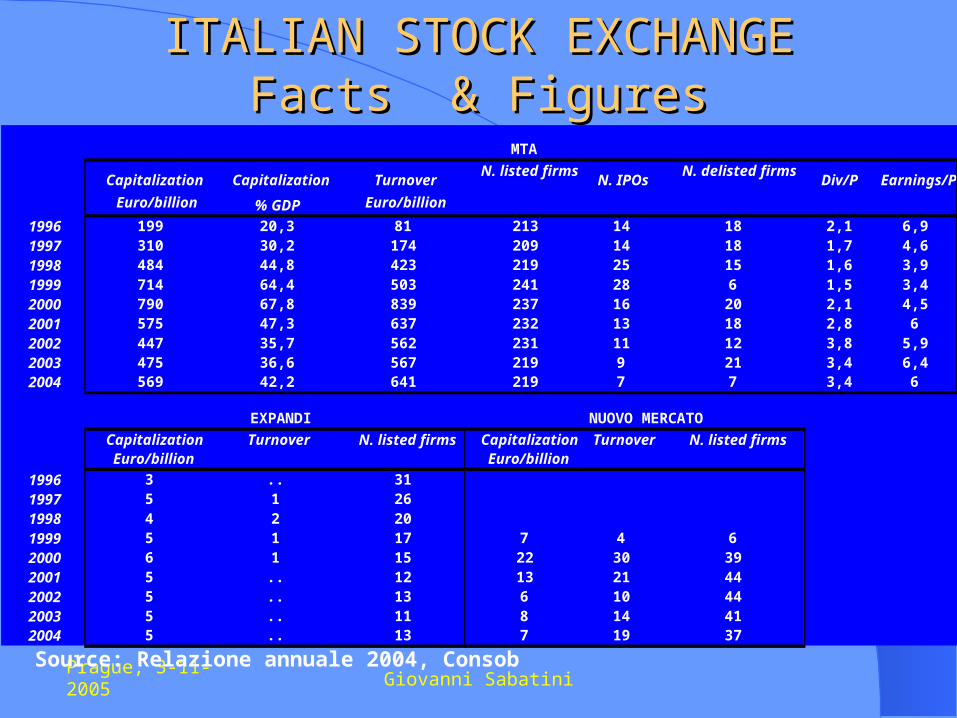
ITALIAN STOCK EXCHANGEITALIAN STOCK EXCHANGE Facts Facts & Figures & Figures
Source: Relazione annuale 2004, Consob
Capitalization Capitalization Turnover N. IPOs Div/P Earnings/P
Euro/billion % GDP
1996 199 20,3 81 213 14 18 2,1 6,91997 310 30,2 174 209 14 18 1,7 4,61998 484 44,8 423 219 25 15 1,6 3,91999 714 64,4 503 241 28 6 1,5 3,42000 790 67,8 839 237 16 20 2,1 4,52001 575 47,3 637 232 13 18 2,8 62002 447 35,7 562 231 11 12 3,8 5,92003 475 36,6 567 219 9 21 3,4 6,42004 569 42,2 641 219 7 7 3,4 6
Capitalization Turnover Capitalization TurnoverEuro/billion Euro/billion
1996 3 .. 311997 5 1 261998 4 2 201999 5 1 17 7 4 62000 6 1 15 22 30 392001 5 .. 12 13 21 442002 5 .. 13 6 10 442003 5 .. 11 8 14 412004 5 .. 13 7 19 37
EXPANDI
N. listed firms
NUOVO MERCATO
N. delisted firmsN. listed firms
N. listed firms
MTA
Euro/billion

Prague, 3-11-2005 Giovanni Sabatini
CharacteristicsCharacteristics of of Italian Industral StructureItalian Industral Structure
Limited firms sizeHighly Concentrated OwnershipFamily- OwnedLeverage Limited presence in high-technology
business

Prague, 3-11-2005 Giovanni Sabatini
The Italian IPO wavesThe Italian IPO waves There are waves in the history of Italian IPOs:
– 1985-19881985-1988 (bullish market): 69 IPOs firms, of which 32% financial, 58% industrial (mainly construction and electronics) and 10% services. Most were carve-outs
– 1989-19941989-1994: only 19 IPOs (52% of which were financial companies)
– 1995-1997: 34 IPO (76% of which were financial companies) most of them were small-medium companies taking advantage of the tax benefits granted by the “legge Tremonti”. No carve-outs
– 1998-20001998-2000 (dot.com bubble): 85 IPOs, most were high-tech firms in the services category (media, software, information technology)
– 2001-20042001-2004 (slowdown): 35 firms, the majority of which the were public utilities
– TodayToday: 13 firms, of which 4 listing in the Expandi segment The pattern supports the evidence that firms tend to
time the IPO when the moment is more convenient (“window opportunity”)
Prague, 3-11-2005 Giovanni Sabatini
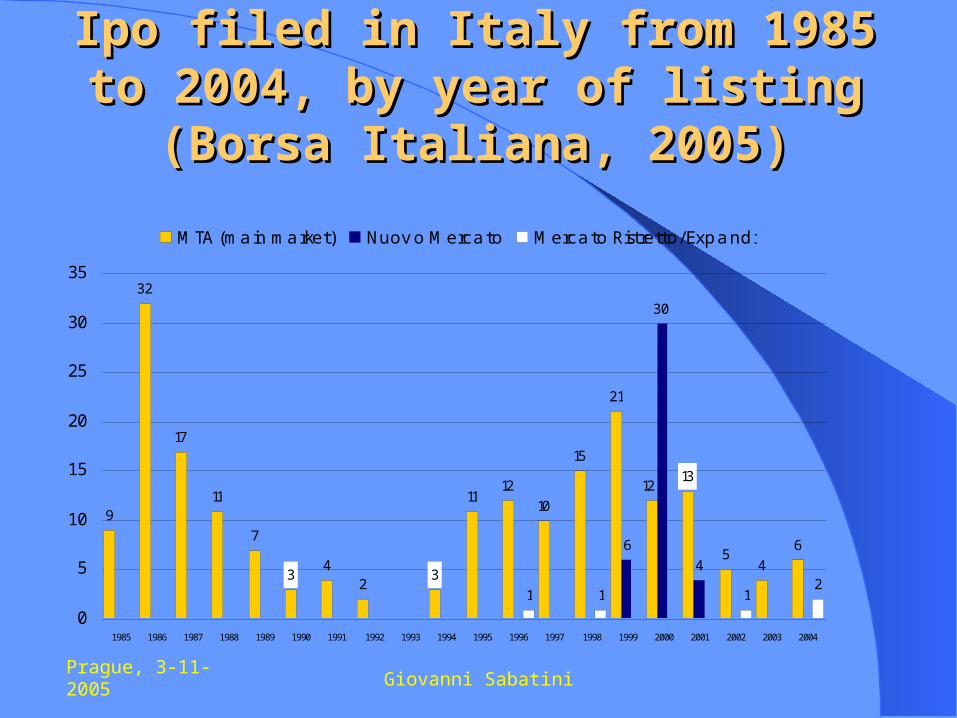
Ipo filed in Italy from 1985 to 2004, by Ipo filed in Italy from 1985 to 2004, by year of listing (Borsa Italiana, 2005)year of listing (Borsa Italiana, 2005)
9
32
17
11
7
42
1112
10
15
21
54
6
1 1 12
3 3
1312
6
30
4
0
5
10
15
20
25
30
35
1985 1986 1987 1988 1989 1990 1991 1992 1993 1994 1995 1996 1997 1998 1999 2000 2001 2002 2003 2004
MTA (main market) Nuovo Mercato Mercato Ristretto/Expandi
Prague, 3-11-2005 Giovanni Sabatini
The evolution of Initial The evolution of Initial Public Offerings in ItalyPublic Offerings in Italy
IPO firms in the recent years have different characteristics than the early IPOs:– Smaller and younger– Less concentrated ownership– More frequently participated by pre-IPO private
equity investors IPO pricing in Italy has become more
efficient Italian IPOs adopted several clauses of
the going public process in the US (green shoes, lock-ups, book building)
Prague, 3-11-2005 Giovanni Sabatini
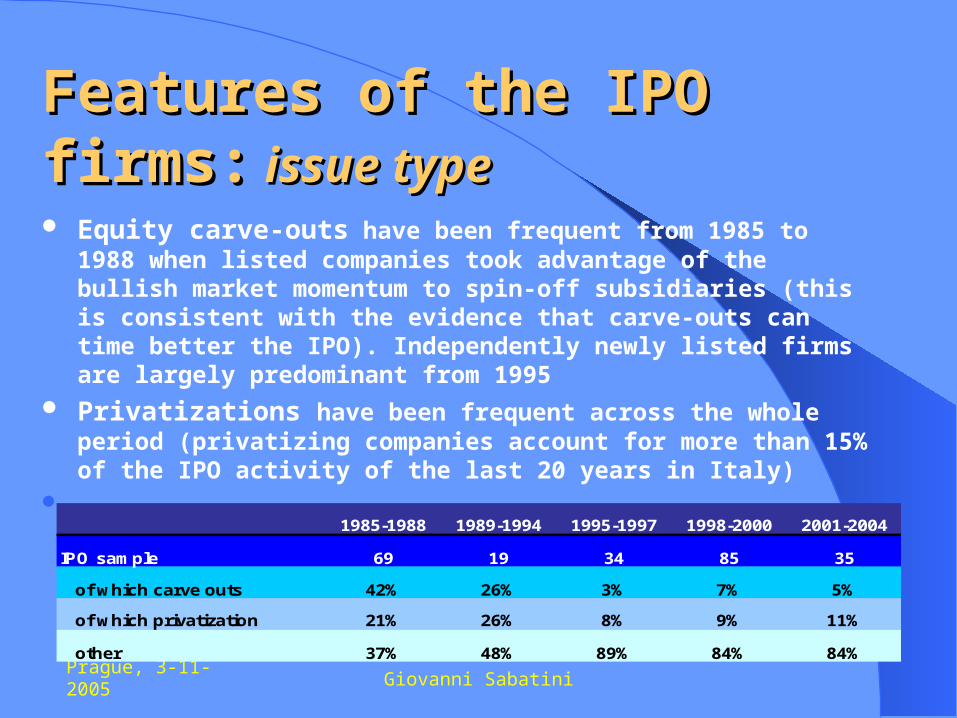
Features of the IPO firms:Features of the IPO firms: issue typeissue type Equity carve-outs have been frequent from 1985 to 1988
when listed companies took advantage of the bullish market momentum to spin-off subsidiaries (this is consistent with the evidence that carve-outs can time better the IPO). Independently newly listed firms are largely predominant from 1995
Privatizations have been frequent across the whole period (privatizing companies account for more than 15% of the IPO activity of the last 20 years in Italy)
1985-1988 1989-1994 1995-1997 1998-2000 2001-2004
IPO sample 69 19 34 85 35
of which carve outs 42% 26% 3% 7% 5%
of which privatization 21% 26% 8% 9% 11%
other 37% 48% 89% 84% 84%

Prague, 3-11-2005 Giovanni Sabatini
Features of the IPO firms: Features of the IPO firms: age, total assets, net profitsage, total assets, net profits The average age of the IPO firms has reduced Total assets vary across the periods, with small firms alternating
with large firms Net profits are always positive, as profitability is a listing
requirement (contrary to US, where firms with negative earnings can go public)
Statistics about the accounting value of consolidated assets and revenues are very dispersed and reveal that large companies alternated to smaller firms during the period
1985-1988 1989-1994 1995-1997 1998-2000 2001-2004
Firm age (yrs) 48 38 48 37 32
Total assets (euro ML) 2593 8517 2327 2200 837
Gross revenues 406 1402 1804 429 323
Net profit 15 35 79 44 30

Prague, 3-11-2005 Giovanni Sabatini
Median age of companies that made an IPO in Italy, Median age of companies that made an IPO in Italy, USA, and in Europe (Belgium, France, Germany, the USA, and in Europe (Belgium, France, Germany, the Netherlands, UK) (Borsa Italiana, 2005)Netherlands, UK) (Borsa Italiana, 2005)
Prague, 3-11-2005 Giovanni Sabatini
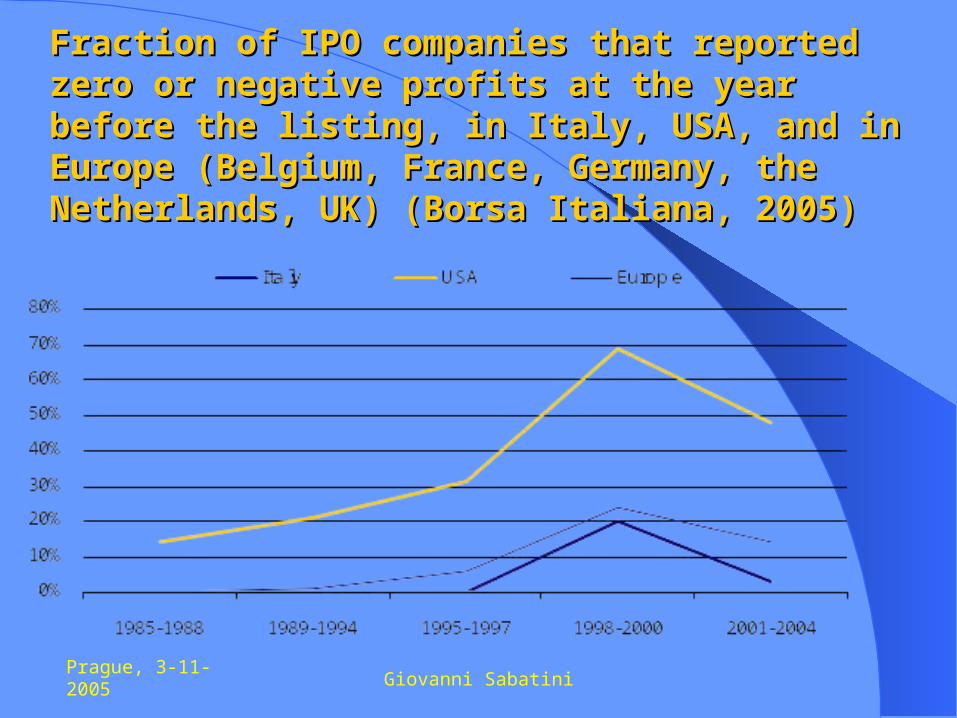
Fraction of IPO companies that reported zero or Fraction of IPO companies that reported zero or negative profits at the year before the listing, in negative profits at the year before the listing, in Italy, USA, and in Europe (Belgium, France, Italy, USA, and in Europe (Belgium, France, Germany, the Netherlands, UK) (Borsa Italiana, Germany, the Netherlands, UK) (Borsa Italiana, 2005)2005)
Prague, 3-11-2005 Giovanni Sabatini
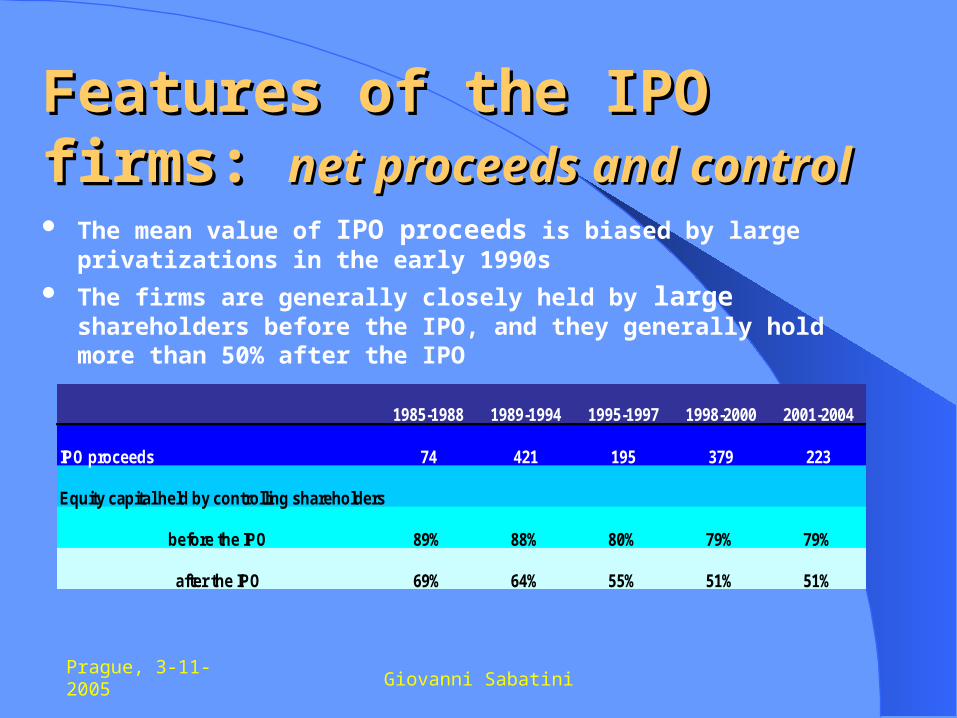
Features of the IPO firms: Features of the IPO firms: net proceeds and controlnet proceeds and control The mean value of IPO proceeds is biased by large
privatizations in the early 1990s The firms are generally closely held by large shareholders
before the IPO, and they generally hold more than 50% after the IPO
1985-1988 1989-1994 1995-1997 1998-2000 2001-2004
IPO proceeds 74 421 195 379 223
Equity capital held by controlling shareholders
before the IPO 89% 88% 80% 79% 79%
after the IPO 69% 64% 55% 51% 51%
Prague, 3-11-2005 Giovanni Sabatini
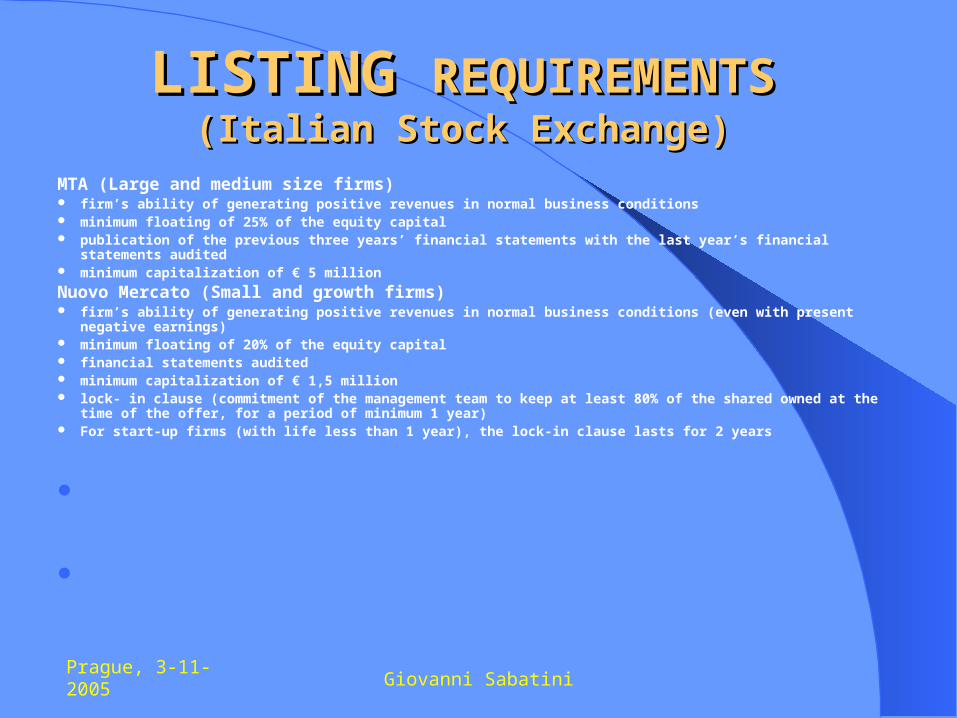
LISTING LISTING REQUIREMENTSREQUIREMENTS(Italian Stock Exchange)(Italian Stock Exchange)
MTA (Large and medium size firms) firm’s ability of generating positive revenues in normal business conditions minimum floating of 25% of the equity capital publication of the previous three years’ financial statements with the last year’s financial statements
audited minimum capitalization of € 5 million
Nuovo Mercato (Small and growth firms) firm’s ability of generating positive revenues in normal business conditions (even with present negative
earnings) minimum floating of 20% of the equity capital financial statements audited minimum capitalization of € 1,5 million lock- in clause (commitment of the management team to keep at least 80% of the shared owned at the
time of the offer, for a period of minimum 1 year) For start-up firms (with life less than 1 year), the lock-in clause lasts for 2 years
Prague, 3-11-2005 Giovanni Sabatini
AgendaAgenda
Reasons to go public/stay private
The evolution of IPO’s in Italy
Final considerations
Empirical evidence
Basics

Prague, 3-11-2005 Giovanni Sabatini
Empirical evidence:Empirical evidence:the opinion of the financial communitythe opinion of the financial community
Survey on the IPO effects (Osservatorio M&A, Bocconi University, Milan)
IPOs help growth:– after the IPO, the firms continue to grow (average of 18% revenues
increase)– 79,6% of the interviewed firms stated that the growth rate without IPO
would have been lower; 43% stated that without the IPO most investments would have been cut off
IPOs sustain the acquisition process: – 76,4% of the interviewed firms made at least one acquisition after the IPO– the average acquisition number is 4

Prague, 3-11-2005 Giovanni Sabatini
Empirical evidence:Empirical evidence:the opinion of the financial communitythe opinion of the financial community
(continue)(continue) IPO helps capital structure optimization
– Immediately after the IPO, the leverage decreases– In the following years the leverage increases and returns to previous
levels after three years– 68% of the interviewed firms consider the re-leverage process the main
reason for the IPO– The re-leverage is convenient because after the IPO the firm has increased
its bargaining power with banks
IPO improves the communication with the stakeholders– Institutional investors– Regulators– Shareholders
Prague, 3-11-2005 Giovanni Sabatini
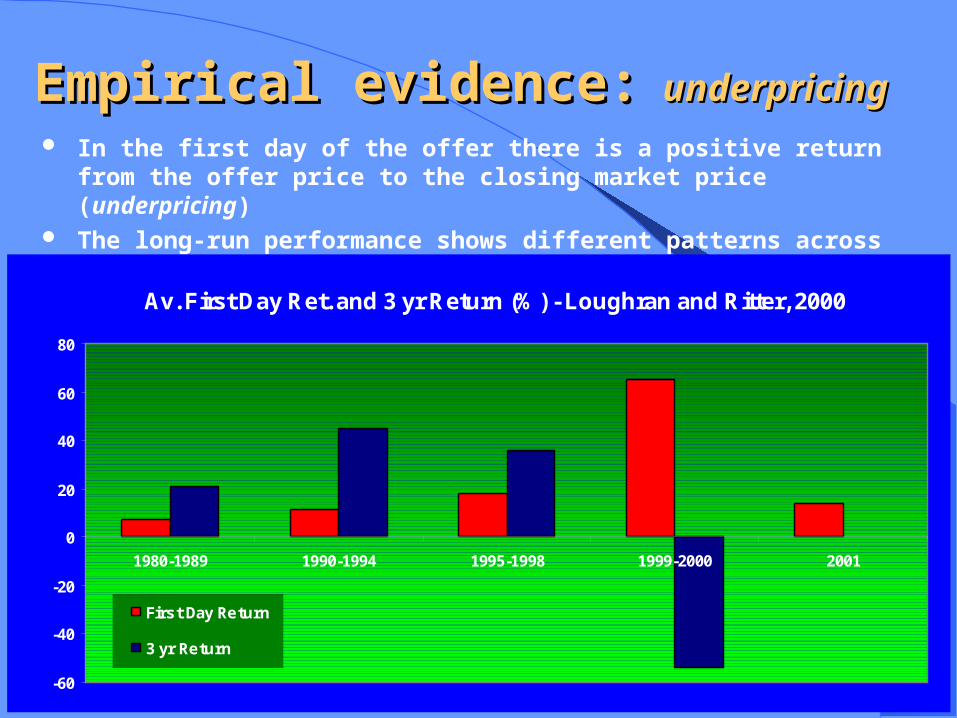
Empirical evidence:Empirical evidence: underpricingunderpricing In the first day of the offer there is a positive return from the
offer price to the closing market price (underpricing) The long-run performance shows different patterns across time
Av. First Day Ret. and 3 yr Return (%) - Loughran and Ritter, 2000
-60
-40
-20
0
20
40
60
80
1980-1989 1990-1994 1995-1998 1999-2000 2001
First Day Return
3 yr Return

Prague, 3-11-2005 Giovanni Sabatini
Underpricing (%) for 38 countries
0
5
10
15
20
25
30
35
1984-2002 1983-2000 1978-1999 1985-2001 1991-1998 1986-1998 1980-1998 1959-2001 1960-2001
Austria France Germany Italy Poland Spain Sweden UK USA
Period Av. First day Return (%)Average 3-year Buy-and-
Hold Return (%)
1980-1989 7,4 20,8
1990-1994 11,2 44,7
1995-1998 18,1 36
1999-2000 65 -53,8
2001 14 na
1980-2001 18,7 22,6
Prague, 3-11-2005 Giovanni Sabatini
Underpricing and longUnderpricing and longterm performanceterm performance
In the recent years the mean underpricing level in Italy has been decreasing
One interpretation (Giudici, Paleari) is that the reduction is related to the adoption of book building as opposed to previously used practices of setting the price (i.e.: fixed price) and to greater involvement of institutional investors in the placement
The long term underperformance is still present but less than in the past

Prague, 3-11-2005 Giovanni Sabatini
Empirical evidence: Empirical evidence: money money left on the tableleft on the table
Money on the table is the number of shares sold times the difference between the first-day closing market price and the offer price (the average IPO leaves $9.1 million on the table) – This is approximately twice as large as the fees paid to
investment bankers ($13 billion), and represents a substantial indirect cost to the issuing firm (Loughran and Ritter, 2000)
In Netscape’s August 1995 initial public offering (IPO) with Morgan Stanley as the lead underwriter, 5 million shares were sold to investors at $28.00 per share. With a closing market price of $58.25, $151 million was left on the table
Why don’t issuers get upset about leaving money on the table? – The discount is the condition imposed by financial
intermediaries in order to ensure the success of the placement
For 15 IPOs with first-day returns in excess of 60% that subsequently conducted follow-on offerings, all 15 retained the lead underwriter from the IPO (Krigman, Shaw, and Womack, 2001)

Prague, 3-11-2005 Giovanni Sabatini
PeriodAggregate Money Left on
the Table (millions $)Av. First day Return (%)
Average 3-year Buy-and-Hold Return (%)
1980-1989 5409 7,4 20,8
1990-1994 9954 11,2 44,7
1995-1998 22436 18,1 36
1999-2000 65625 65 -53,8
2001 2973 14 na
1980-2001 106379 18,7 22,6
Money Left on the Table (million $) - Loughran and Ritter, 2000
0
10000
20000
30000
40000
50000
60000
70000
1980-1989 1990-1994 1995-1998 1999-2000 2001

Prague, 3-11-2005 Giovanni Sabatini
Empirical evidence: Empirical evidence: valuation and ownershipvaluation and ownership
IPOs are typically valued using comparable multiples – For a sample of technology firms in the Internet boom
period, Chanine (2002) finds that these firms are priced at a larger discount than non-tech firms, consistent with the higher first-day returns on tech IPOs
The discount is larger if the incumbent shareholders do not lose the control after the IPO (Zingales, 1994)– This has been for decades the case of Italian IPOs, where
the owners, typically families, maintain the control of the firm after the listing
Prague, 3-11-2005 Giovanni Sabatini
Empirical evidence: Empirical evidence: IPO IPO waveswaves
IPOs follows waves, with intense periods followed by periods of low activity– A first wave occurred in US in the 1990-1994– A second wave occurred in US and in Europe in the late
1990s Historically, continental European IPO market has been
dwarfed by the US IPO market. In 2000, however, in spite of high volume of IPOs in the USA, continental European IPO volume exceeded that of the USA
One explanation is that in times when the market is over valuating certain industries, the firms in those industries will likely go public to exploit the mispricing

Prague, 3-11-2005 Giovanni Sabatini
Empirical evidence: Empirical evidence: size size and age effectand age effect
Large firms are more likely to go public as they can better afford high fixed costs of the IPO
Large firms leave less money on the table as their offer price is normally higher due to less uncertainty in valuation– IPO firms in Italy are larger than IPO firms in US
The size effect does not apply when the IPO regards a subsidiary of an holding company (carve-out) – fixed costs are indirectly borne by the holding company and the discount is lower as there is less uncertainty over the issue
Younger firms should go public more often than older firms because they need capital to finance investments– IPO firms in Italy are older than IPO firms in US

Prague, 3-11-2005 Giovanni Sabatini
AgendaAgenda
Reasons to go public/stay private
The evolution of IPO’s in Italy
Final considerations
Empirical evidence
Basics
Prague, 3-11-2005 Giovanni Sabatini
Final considerationsFinal considerations Italian IPOs in the past not driven by small
high-growth firms; Successful IPOs require developed capital
markets and good corporate governance systems;
In recent periods the Italian IPOs adopted pricing strategies and arrangements (special clause) in line with US market practices;
Whatever the reason to go public (finance growth, become more visible, exploit mispricing, etc.), IPOs help market development and improve firms’ accountability to investors.