practice operations coaching - amga · practice operations coaching ... central tenets of an aco...
TRANSCRIPT

Practice Operations Coaching American Medical Group Association
Institute for Quality Leadership
October 5, 2012

Presenters • Kevin McCune, MD, Chief Medical Officer, Advocate Medical Group
• Judi Miller, Vice President, Medical Services and Clinical Integration,
Advocate Physician Partners
• Scott Kent, Vice President Field Services, Advocate Physician Partners
• Jan Skoda, Vice President, Field Services, Advocate Physician Partners
• Kate Kalthoff, Practice Operations Coach
• Rick Bobos, Practice Operations Coach
2

Practice Operations Coaching
Background

Founded 1995 $4.7 Billion Annual Revenue AA Rated 12 Acute Care Hospitals
– 2 Children’s Hospitals – 5 Level 1 Trauma Centers – 4 Major Teaching Hospitals – 4 Magnet Designations
Over 250 Sites of Care – Advocate Medical Group
– Dreyer Medical Clinic
– Occupational Health
– Imaging Centers
– Immediate Care Centers
– Surgery Centers – Home Health / Hospice
Advocate Health Care
4

MVP
5

A faith-based system providing the best health
outcomes and building lifelong relationships
with those we serve
Mission, Values, Philosophy
Coordinated
Care Growth
Operational
Excellence
Strong Physician Engagement
Partnerships
Loyal Patients
Brand Development
Health Outcomes
Advocate Experience
Funding our Future
Access
Smooth Transitions
Innovative Care Models
Advocate 2020 Strategic Framework
6

Physicians on Medical Staffs ~ 6,000
Advocate Physician Partners = 4,350
Independent
Non-APP ~ 1,900 Independent APP = 3,200
Employed /
Affiliated = 1,150
AMG (Employed) = 1,000
Pluralistic Approach to Physician Partnering
Advocate Dreyer (Affiliated) = 150
230,000 Capitated Lives/700,000 PPO Lives
215,000 “Attributable” Lives
7

Advocate Physician Partners Vision
8
To drive improvement in Health Outcomes, Care Coordination and
Value Creation through an innovative and collaborative partnership
with our physicians members and the Advocate System
Condell
PHO
Future
PHO
Christ
PHO
Future
Medical
Group
South
Suburban
PHO
Dreyer
Medical
Clinic
Advocate
Medical
Group
Illinois
Masonic
PHO
BroMenn
PHO
Trinity
PHO
Good
Shepherd
PHO
Good
Samaritan
PHO
Lutheran
General
PHO

0
50
100
150
200
250
300
350
Number of PCPs per Group Size
PCP Physician Group Size
0
100
200
300
400
500
Number of Specialists per
Group Size
Specialist Physician Group Size
50% of PCPs Are Solo Practitioners, 27% In Offices of 2-3
APP Physicians by Practice Group Size
9

APP Partnership with Physicians Since 1995
1995 HMO Risk
2003 Clinical Integration
PPO Contracts
2011 Shared Savings/ACO – Commercial
2012 Shared Savings/ACO – Medicare
SynAPPs Electronic Medical Record Program
Value Added Programs Include Health
Insurance and Vendor Discounts
10

Clinical Integration
Physician Driven
Physician Commitment to a
Common & Broad Set of
Clinical Initiatives
A “Group Without Walls”
Working Together to Improve
Quality, Safety and Cost-
Effectiveness of Care
Rendered to All Patients
Single Incentive Fund
11

Advocate Medical Group 2007: 450 Advocate Employed
Physicians – Four Distinct and Separate Medical
Groups
– Two of These Groups Managed Through Hospital Infrastructure
2008: Formation of Single Dedicated Physician Practice Management Team
2009: Advocate Board Approval AMG Governing Council Charter and Merger of Groups
2010: Regional Dyad Governance and Management Development
2012: Growth to More Than 1000 Clinicians 12

AMG
Regional Councils
Advocate Medical Group
Governing Council
AMG Practice Sites/
Departments
Advocate Health Care
Board of Directors
AMG Governing Council CommitteesHealth Outcomes Committee
Operational Improvements Committee
Physician Engagement Committee
Strategic Planning & Development Committee
Finance Committee
AMG Vice-presidents
Medical Management/
AMG Vice-presidents
Operations
13

Management Dyad
VP of Practice
Operations
Regional Medical Director
Regional Leadership
Dyad
Practice Manager
Site Medical Director
Practice Site
Dyad
14

Physician Performance Expectations
The following are expectations for physicians at the Advocate Medical Group:
General
• Be consistently respectful, polite, and professional in working with reception, nurses, answering service and other staff members who manage appointment scheduling and patient flow.
• Avoid appointment cancellations and changes to schedule except for professional and unavoidable reasons; give reasonable advance notice prior to scheduling vacation or other planned time off.
• Return calls from other physicians and other health providers as quickly as possible; respond to all pages within a reasonable period to time. Be available by pager or phone after office hours; if unavailable, notify answering service.
• Complete chart notation in a timely fashion, including appropriate coding of diagnoses and procedures.
• Arrive on time for the first appointment (unless unavoidably detained for professional reasons) and make every effort to stay on schedule throughout the day.
• Ensure legibility of handwritten notes; provide accurate and complete medical record documentation that meets clinical and regulatory requirements.
• Act in accord with the Advocate Code of Business Conduct and Advocate Conflict of Interest Policy, including adherence to guidelines and policies on coding and documentation.
Patient Relations Standards
• Always strive to maintain the dignity, comfort and satisfaction of patients and family members.
• Listen to the patient, hear what they are saying, and respond appropriately.
• Greet patients in a congenial manner and with a smile when appropriate; apologize if you are behind schedule.
15

Central Tenets of An ACO
Successful Clinical Integration Program
Transformation to Population
Health Management Company
Putting the Patient & Patient
Interests First
Driving Value Creation – Right Care, Right Time, Right Place, Right Cost
Accountable Care Provides Partnership Opportunities – Physician & Hospital Partnership to Eliminate Waste
– Provide Better Patient Care and Care Coordination
– Incentives Aligned
16

“One Program, One Set of Measures, One Set of Incentives”
17
Global
Risk HMO
Surplus
Clinical Integration
AdvocateCare
Shared
Savings
Incentive Payout
Disease
Registry
Value
Creation Clinical
Integration Inpatient
Utilization

ACO Benefits to Physicians
Better Overall Care and Outcomes for Patients
Develop Lifelong Relationships with Patients
Improve Patient Experience
Extension of Clinical Integration Program
Opportunity for Revenue Enhancement
Access to Patient Utilization from Various
Providers
Transition to One Model of Care Regardless of
Payer
– Standard Approaches and Processes
– Improve Office Productivity and Efficiency 18

Blue Cross “Attributed” PPO Contract
January 2011 Start Up
“Attributes” PPO Members to APP Doctors
Approximately 150,000 lives
Focus on Reducing “Trend” Relative to
Non-APP Providers
– All Expenses, Risk Adjusted
– Change in APP Spend vs. Rest of Network
“AdvocateCare” – The Advocate Model of
Care
19

Medicare Shared Savings Contract
July 2012 Start Up
Attributes Medicare Beneficiaries to APP
Physicians
Focus on Reducing “Trend” Relative to Non-
APP Providers
– All Expenses, Risk Adjusted
– Change In APP Spend vs. Rest of Network
“AdvocateCare” – The Advocate Model of Care
20

Changing Paradigms …
FROM… TO…
Silo Care Management Enterprise Care Management
Episodes of Care Value-Driven Coordinated Care
Discharges Transitions
Utilization Management Right Care at the Right Place at
the Right Time
Caring for the Sick Improving Health Status
Production (Volume) Performance (Value/Lower Cost)
AdvocateCare Model
21

Key Drivers
22
Culture
Governance
Infrastructure
Incentives
Transparency of Results
Feedback Loop

Culture Change Communication
– Internal: Advocate & APP
Audiences
– External Audiences
Physician Engagement in Design
Training
Support Services
Physician Practice Performance
Coaching
Collaboratives 23

AdvocateCare Tactics
Clinical Integration as Foundation
AdvocateCare Goals and Outcomes
Implementation of EMR and Data Warehouse
Care Management Data Systems
Population Management Data Analytics
Advanced Medical Practice
24

AdvocateCare Dashboard
Population Measures
– ER Visits/1000
– Admits/1000
– Length of Stay
– Readmissions
– Network Care Coordination
CI Quality Measures
Patient Experience
25

Data Support
Practice Coaches and Other Advocate
Physician Partners Staff Assist Physicians in
Understanding Performance on Key
Measures
– All 5 AdvocateCare Index Measures
– Patient Experience (CG-CAHPS)
– Relevant Clinical Integration Measures
Including Chronic Disease and Prevention
26

Outpatient CM
System
Physician Office Performance
Coaches
In Network Care
Coordination
Data & Analytics
PCP Access/ Virtual Visits
Communication Strategies
Transitions
2012 Infrastructure & Support
27
Outpatient Care Management
• Dedicated Outpatient
CMs for High-Risk Patients
Post-Acute
• SNF CM Model • SNF, LTACH,
Inpatient Rehab Network
• HH Transition Coaches
Emergency/Acute Care Management
• Inpatient CMs • ED CMs • Hospitalists • Physician-Partnered
CM Model
Video Introduction to AdvocateCare – Population Management
28
Practice Operations Coaching Approach for Independent Physician Practices
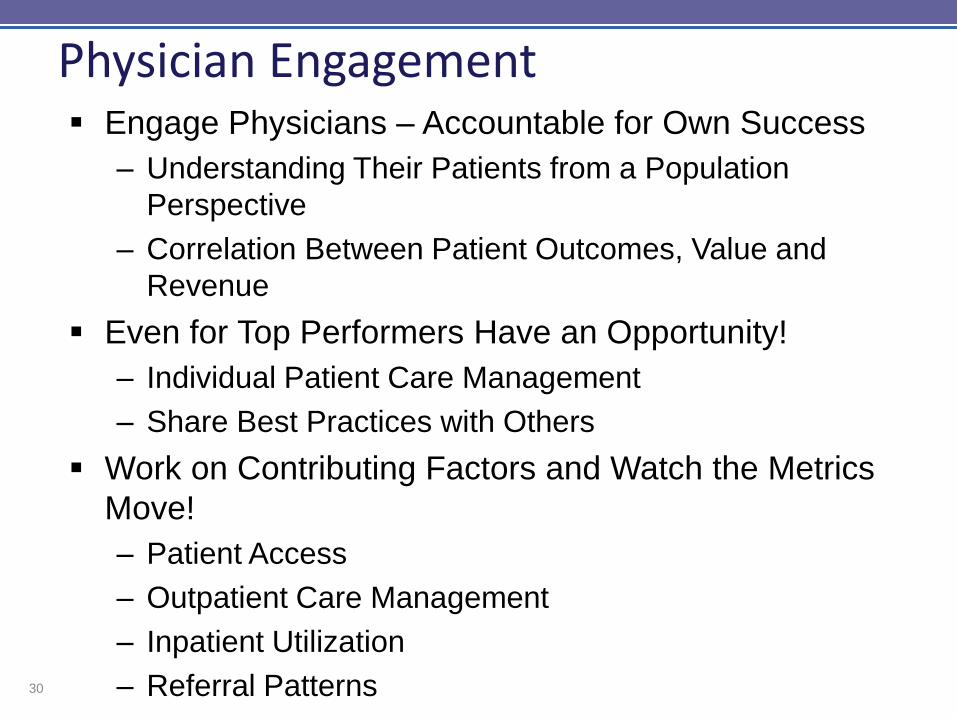
Physician Engagement Engage Physicians – Accountable for Own Success
– Understanding Their Patients from a Population
Perspective
– Correlation Between Patient Outcomes, Value and
Revenue
Even for Top Performers Have an Opportunity!
– Individual Patient Care Management
– Share Best Practices with Others
Work on Contributing Factors and Watch the Metrics
Move!
– Patient Access
– Outpatient Care Management
– Inpatient Utilization
– Referral Patterns
30

Why Change Approach Now?
Move From Membership to Partnership! Competing Demands for
Resources Infrastructure in Place Operating in Silos Many “Touches” Per
Practice - Uncoordinated
31

Which Physician Practices Drive Overall Success? Identified Physician Practices Representing Top 50%
of Patient Membership = High-Volume
– Global Risk HMO, BCBS PPO Attributed, Medicare
Attributed
– Only 77 Practices with 710 Physicians
32
3,290 521 189 710
Total APP Physicians Employed Physicians Independent Physicians

Focus on Outcomes
Simplify and Focus Resources
Five Measures –AdvocateCare Dashboard
– ED Visits/1000
– Admits/1000
– Length of Stay
– 30 Day Readmissions
– % Days In-Network
Easily Identify Metric Results
– Stop-Light Approach
Partner With Physicians to Move Metrics
– Resources Focused on High Volume Practices
33

Monthly Team Lead Meeting
Identify Practice Issues &
Opportunities
Assess Issues
Prioritize and Coordinate
Deployment of Resources
Develop Action Plan with
Assignments & Deadlines
– Approach Varies by Practice
Prioritize and Coordinate
Deployment of Resources
Establish Formal Reporting
Process 34

35
Director
Field Operations Team Structure
PHO Director
Team Lead
Hospital Physician Relations
Quality Improvement
Clinical Innovation
Decision Support
Medical Director
Provider Relations
Practice Coach
Pharmacy Inpatient Care Manager
Outpatient Care Manager
EMR Implementation

Physician Practice Assessment
Incorporate Into Initial Team Meetings
Assess Current Practice Status
Goal -> Team Member Base Level
Knowledge of Physician Practice
Don’t Get Hung Up on the Tool; Focus on
the Use !
36
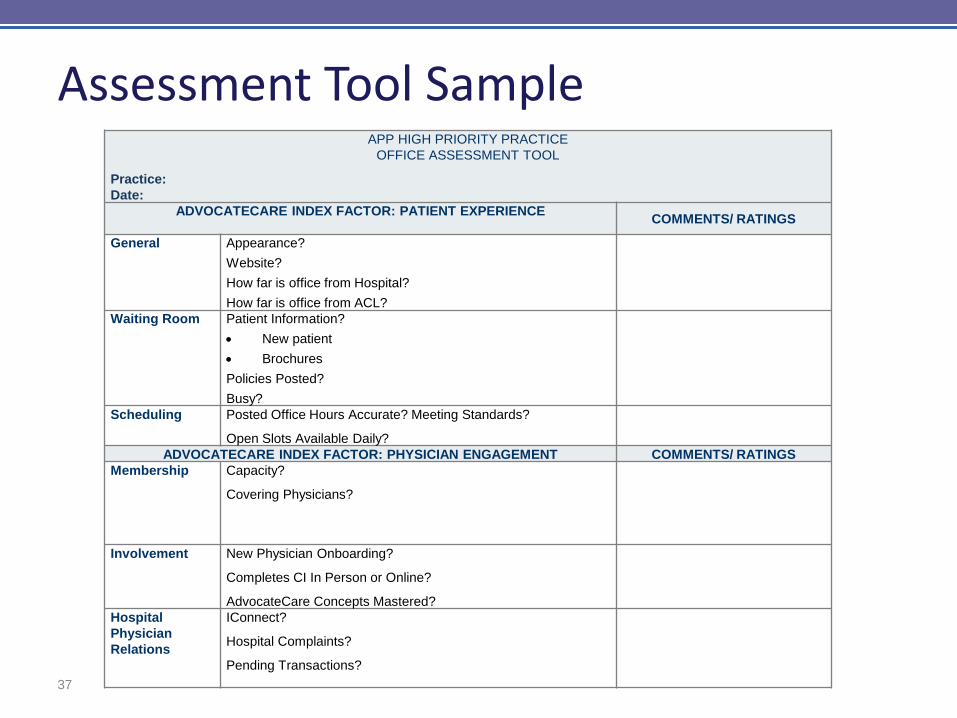
Assessment Tool Sample
37
APP HIGH PRIORITY PRACTICE
OFFICE ASSESSMENT TOOL
Practice:
Date:
ADVOCATECARE INDEX FACTOR: PATIENT EXPERIENCE
COMMENTS/ RATINGS
General Appearance?
Website?
How far is office from Hospital?
How far is office from ACL?
Waiting Room Patient Information?
New patient
Brochures
Policies Posted?
Busy?
Scheduling Posted Office Hours Accurate? Meeting Standards?
Open Slots Available Daily?
ADVOCATECARE INDEX FACTOR: PHYSICIAN ENGAGEMENT COMMENTS/ RATINGS
Membership Capacity?
Covering Physicians?
Involvement New Physician Onboarding?
Completes CI In Person or Online?
AdvocateCare Concepts Mastered?
Hospital
Physician
Relations
IConnect?
Hospital Complaints?
Pending Transactions?

Quality Improvement Office Assessment Tool
38

AdvocateCare Dashboard
ED Visits/1000 Admits/1000
Average
Length
Of Stay
Readmission
s
% Advocate
Acute Days
PHO Actual 166.5 61.4 3.93 5.49% 60.2%
PHO Target 178.0 63.5 3.73 6.09% 58.0%
Name of Practice
146.0
71.7
3.80 8.14% 56.4% Dr. A 115.8 72.0 3.4 9.09% 40.8%
Dr. B 158.5 43.2 2.9 0.00% 92.0%
Dr. C 138.2 65.8 3.9 10.00% 48.6%
Dr. D 208.7 74.5 2.8 0.00% 56.7%
Dr. E 126.7 66.8 4.9 11.11% 57.8%
Dr. F 156.1 58.5 2.7 N/A N/A
Dr. G 77.4 N/A N/A N/A N/A
Dr. H 227.0 227.0 3.7 0.00% 100.0%
Dr. I 175.0 95.7 4.1 14.29% 53.5%
39

Practice Level Metrics • ER Visits by Level of Care
• ER Visit Frequency
Procedure Code Services Paid/Service
99281 EMERGENCY DEPT VISIT 1 $310.00
99282 EMERGENCY DEPT VISIT 30 $325.61
99283 EMERGENCY DEPT VISIT 108 $642.33
99284 EMERGENCY DEPT VISIT 121 $1,208.12
99285 EMERGENCY DEPT VISIT 67 $1,698.20
Summary 327 $1,037.96
# of ER Visits in 12 Months Claimants Claimants % of
Total
ER Visits ER Paid
1 233 85.0% 233 $659,639
2 33 12.0% 66 $244,643
3 6 2.2% 18 $41,772
4 1 0.4% 4 $14,262
5 1 0.4% 5 $17,584
Summary 274 100.0% 326 $977,900
40

Practice and Physician Level Metrics • Inpatient Dashboard
Product
Provider Name Member
Months
Admits Days Average Length
of Stay
Admits/1000 Days/1000 In-Network
Days %
Dr. A 6,837 41 140 3.4 72.0 245.7 47.9%
Dr. B 3,332 12 35 2.9 43.2 126.1 94.3%
Dr. C 3,647 20 77 3.9 65.8 253.4 63.6%
Dr. D 2,415 15 42 2.8 74.5 208.7 69.0%
Dr. E 5,209 29 142 4.9 66.8 327.1 82.4%
Dr. F 615 3 8 2.7 58.5 156.1 100.0%
Dr. G 370 7 26 3.7 227.0 843.2 100.0%
Dr. H 4,389 35 144 4.1 95.7 393.7 68.1%
Total for Practice Name 27,124 162 614 3.8 71.7 271.6 69.5%
HMO & PPO
41

Develop Action Plan
Practice Assessment Tool
Identify Practice Opportunities
Assign a Local Lead for Each Opportunity
Plan Execution & Messaging
Drive & Measure Improvement
Report Results Back to APP Field Operations
Team at Monthly Meeting
Individualized Approach by Practice 42

Sample Practice Action Plan ER Visits/1000
Responsible Party Action Item Timeline
Practice Operations Coach and Outpatient Care Manager
Identify ‘frequent flyers’ in the ER and refer them for Care Management.
Immediately
Outpatient Care Manager
Discuss ‘frequent flyers’ with physician; collaborate on a care mgmt plan and begin telephonic visits
5 business days
Practice Operations Coach
Examine practice hours and accessibility. Uncover opportunities to open up same-day appointments and after-hours availability.
Complete by the next Field Operations meeting
Practice Operations Coach
Work with physicians and office manager in developing tools to educate patients on what to do and how to reach them after hours
Within 30 days of Field Ops meeting
43

Frequent Questions from Physicians
Live Births Are Good Admissions. Why Do They Appear to Count Against Us In the Admits/1000 Score?
This Isn’t My Patient. How Is This My Patient?
How Can I Tell My PPO Patients Which Hospital to Use? They Go to the Closest One.
44

Practice Operations Coaching Analysis and Tactics for Helping Employed Physicians Succeed

The Practice Operations Coach for Employed Physicians Approach to Coaching Employed Physicians
Types of Analysis
– Emergency Department
• All Advocate Employed Physicians
• Pediatrics
• Medicare
– Inpatient
• All Advocate Employed Physicians
• Medicare
Tactics for Improvement
Challenges and How to Overcome Them
46

Approach to Coaching
GOVERNING COUNCIL
REGIONAL COUNCIL
SITE LEADERS
PHYSICIANS
47

Approach to Coaching
Governing Council AUTHORITY
– President, COO and CMO
– Other High Level Leadership
Regional Council
– VPs of Medical Management
– VPs of Operations
– Regional Physician Leaders
Site Leaders
– Medical Directors
– Directors of Operations
Physicians
COACH
COACH
COACH
48

Approach to Coaching Move to One Culture: AMG Boot Camp
Consistent Message Delivered from the Governing
Council Via the Practice Operations Coach Down
to the Employed Physicians Through Each
Respective Channel
Determine High Volume Practices and Physicians
in Need of Assistance
Do Not Get Overwhelmed by the Data/Numbers
Avoid Data Paralysis
Compensation Plan Change Drives Focus
– Group Incentives
– Transparency 49

Clinical Compensation – Year 1&2
50
95% of Clinical
Compensation
Potential 5%
downside
Potential 5%
upside
100% of Clinical
Compensation
Health Outcomes – 2%
Patient Experience –1%
Service Area
Operating Margin – 2%
Upside
and
downside
consist
of…
Draw Methodology Remains Unchanged

Health Outcomes Distribution
51
Health Outcomes Scaling
Target Scores
Category Weight Minimum Goal Maximum
Clinical Integration 70% 79 83 90
Patient Safety 10% 50th Percentile 68th Percentile 90th Percentile
AdvocateCare Index 20% 50 100 150

Analysis
Areas of Focus
ALL of AMG
Medicare Pediatrics
Top 10 High Vol.
Poor Performing
52

Analysis
Emergency Department (2 Levels of Analysis)
– Level 1
• ER Visit Level (99212, 99213, 99214, 99215)
• Chronic and Non-Emergent Conditions Visits
• Frequency of Visits
– Level 2
• Top Diagnoses Seen In the ED
• Age Band
• Zip Code
• Day of the Week and Month of the Year
• HMO vs. PPO vs. Medicare
• In and Out-of-Network by Location
53

Analysis Inpatient Metrics (2 Levels of Analysis)
– Level 1
• Admission Rate
• Readmission Rate
• % In-Network
• Average Length of Stay
– Level 2
• Top Diagnoses (Including/Excluding Live Births)
• Age Band
• Surgical vs. Maternity vs. Non-Surgical
• In and Out-of-Network by Location
• PCP Hospitalist Utilization
• HMO vs. PPO vs. Medicare 54

Tactics for Improvement Physician Buy-In
– Valid, Believable, and Useful Data
– Physicians/Leadership Need to Understand the
Data
Office Manager and Office Staff
Create an Action Plan
– Education/Communication to Patients
– Access
– Care Managers
– Pharmacy/Disease Management
– Customize Plan for Ages 0-18, 19-64, and 65+
Control the Controllable
55

Challenges
External
Information
Physicians
• Patient Behavior
• Competition
• Data Lag
• Insurance Type
• Culture Change
• Accurate Coding
56

Other Coaching Enablers and Resources Practice Redesign
– Managing to Top of License
– Access Initiative
Huddle Page / Daily Team Huddle
– Rooming Standards
– Point of Care Registry
Advocate Experience
– Focus on CG-CAHPS
E-University
– AdvocateCare, Coding
Continued Focus on Clinical Integration
57

Wrap-Up
American Medical Group Association Institute for Quality Leadership
October 5, 2012

Summary of Tactics
Break Down Silos: Move to Team Based Care Engage Patients – The Art of Care Managers Simplify Outcome Measures: AdvocateCare
Dashboard – 5 Key Measures
Focus on the 20% Providing 80% of Results – Focus on High Volume Sites – Develop Individualized Practice Plan – Partnership with Physician
Internal Coordination Is Key
59
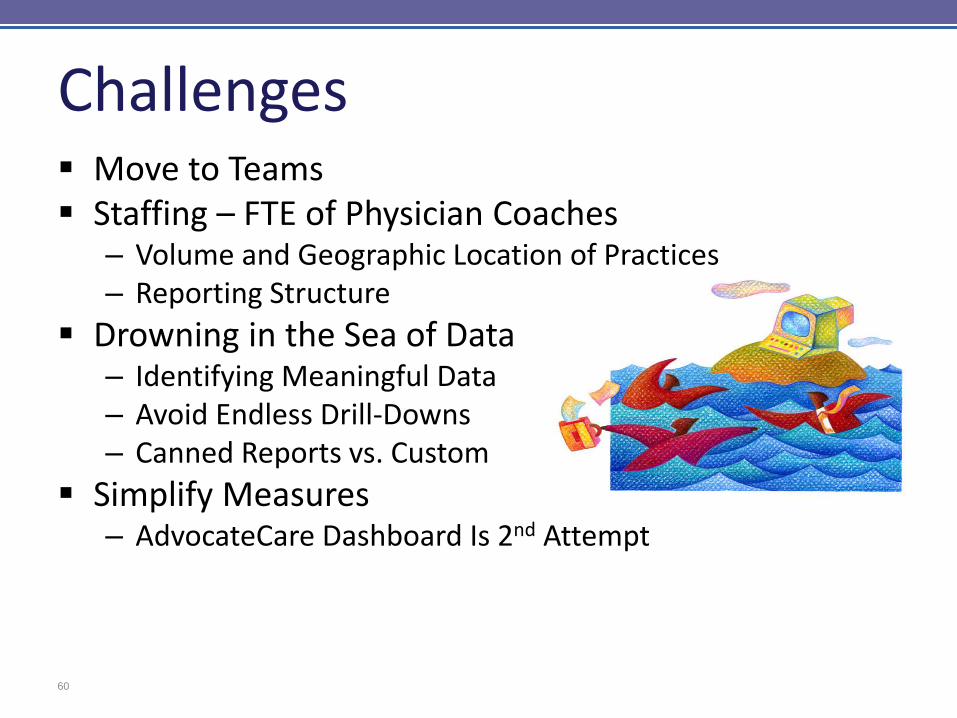
Challenges Move to Teams Staffing – FTE of Physician Coaches
– Volume and Geographic Location of Practices – Reporting Structure
Drowning in the Sea of Data – Identifying Meaningful Data – Avoid Endless Drill-Downs – Canned Reports vs. Custom
Simplify Measures – AdvocateCare Dashboard Is 2nd Attempt
60

Successes Advocate Transformation Cohesion of Team Member Roles
– Personal Introductions – Understanding Roles & Responsibilities – Knowledge of Individual Practices
Service Oriented Approach to Our Physicians! Success in Moving from to Greater Physician Understanding of Individual Impact
to Results and Outcomes
61

Going Forward
Commit to the Vision Accept Accountability in New Environment
– Mourning ‘Loss of Complete Control’ – Acceptance of Data /Analytics
Reinforce Population Health Concepts – Hardwiring Processes
Communicate, Communicate, Communicate
62

Questions?