practical risk analysis for safety management
TRANSCRIPT

Calhoun: The NPS Institutional Archive
DSpace Repository
Reports and Technical Reports All Technical Reports Collection
1976-06
Practical Risk Analysis for Safety Management
Kinney, G. F.
China Lake, CA: Naval Weapons Center
http://hdl.handle.net/10945/31846
Downloaded from NPS Archive: Calhoun
UBRANYTECHNICAL REPORT SF.CTIONNAVAL POSTORA0UATE SCHOOLMONTEREY. CALIFORNIA 93940
NWC TP 5865
Practical Risk Analysis for
Safety Managementby
G. F. Kinney
U.S. Naval Postgraduate School
and
A. D. Wiruth
Safety and Security Department
JUNE 1976
Approved for public release; distribution unlimited.
NavalWeaponsCenterCHINA LAKE. CALIFORNIA 93555

Naval Weapons CenterAN ACTIVITY OF THE NAVAL MATERIAL COMMANDR. G. Freeman, III, RAdm., USN Commander
G. L. Hollingsworth Technical Director
FOREWORD
In the study of explosives and their applications, safety is of
paramount importance. This report describes a practical risk analysissystem which was developed as an outgrowth of safety considerationsfor a continuing program of explosive blast effects.
The study described in this report was performed during fiscalyear 19 76 and supported by Navy Director of Laboratory Programs TaskAssignment R000 01 01.
This report has been prepared primarily for timely presentationof information. Although care has been taken in the preparation ofthe technical material presented, conclusions drawn are not necessar-ily final and may be subject to revision.
Released by Under authority ofH. W. HUNTER, Head G. L. HOLLINGSWORTHResearch Department Technical Director3 May 1976
NWC Technical Publication 5865
Published by Research DepartmentCollation Cover, 11 leavesFirst printing 440 unnumbered copies

UNCLASSIFIEDSECURITY CLASSIFICATION OF THIS PAGE (When Data Entered)
REPORT DOCUMENTATION PAGE READ INSTRUCTIONSBEFORE COMPLETING FORM
1. REPORT NUMBER
NWC TP 5865
2. GOVT ACCESSION NO 3. RECIPIENTS CATALOG NUMBER
4. TITLE (and Subtitle)
PRACTICAL RISK ANALYSIS FOR SAFETY MANAGEMENT
5. TYPE OF REPORT & PERIOD COVERED
Final
6. PERFORMING ORG. REPORT NUMBER
7. AUTHORfa.)
G. F. Kinney, A. D. Wiruth
8. CONTRACT OR GRANT NUMBERfa)
9 PERFORMING ORGANIZATION NAME AND ADDRESS
Naval Weapons CenterChina Lake, California 93555
10. PROGRAM ELEMENT, PROJECT, TASKAREA & WORK UNIT NUMBERS
DNLP TASK ASSIGNMENTR000 01 01
II. CONTROLLING OFFICE NAME AND ADDRESS
Naval Weapons CenterChina Lake, California 93555
12. REPORT DATE
June 19 7613. NUMBER OF PAGES
2014. MONITORING AGENCY NAME ft ADDRESSf// different from Controlling Office) 15. SECURITY CLASS, (of thla report)
UNCLASSIFIED
15a. DECLASSIFI CATION/ DOWNGRADINGSCHEDULE
16. DISTRIBUTION STATEMENT fof IJi/s R«pofi;
Approved for public release; distribution unlimited.
17. DISTRIBUTION STATEMENT (of the abetract entered In Block 20, It different from Report)
18- SUPPLEMENTARY NOTES
19. KEY WORDS (Continue on reverse aide It neceaaary and Identity by block number)
safetyrisk analysisrisk reductionaccident prevention
20. ABSTRACT (Continue on reverae aide It neceaaary and Identity by block number)
See back of form.
dd ,;FORMAN 73 1473 EDITION OF 1 NOV 65 IS OBSOLETE
S/N 0102-014-6601|
UNCLASSIFIEDSECURITY CLASSIFICATION OF THIS PAGE (Whan Data Entered)

UNCLASSIFIED
.LLUlflTY CLASSIFICATION OF THIS P AGEO*?>en Data Entered)
(U) Practical Risk Analysis for Safety Management_,
by G. F. Kinney and A. D. Wiruth. China Lake, Calif.,
Naval Weapons Center, June 1976. 20 pp. (NWC TP 5865,publication UNCLASSIFIED.)
(U) This report describes a practical risk analysissystem which can be used for the quantitative character-ization of risks and for the evaluation of proposed risk-
reduction procedures. The system uses numerical valuesfor comparison purposes and provides descriptive termsthat are meaningful to personnel in safety, operations,and management. The analysis functions are performedeither algebraically or graphically on nomographs pro-vided in the report.
UNCLASSIFIEDSECURITY CLASSIFICATION OF THIS PAGE(T*h«n Data Entered)

NWC TP 5865
SUMMARY
Proper safety measures can make positive contributions toward in-
creased production and reduced operating expense. Basic maxims for suchprograms can be summarized as (1) risk can never be completely eliminated,(2) care and effort can reduce risk, and (3) efforts to reduce risk shouldachieve maximum possible benefits.
It is taken here that risk increases with the likelihood of somehazardous event, with exposure to that hazard, and with possible conse-quences of the event. Numerical scales for these three factors are de-veloped; an overall risk score is then given as the product of thesethree factors. This risk score can be correlated with experience andranges from a situation where an operation should be discontinued throughone where attention is needed, and down to one where the risk is consid-ered acceptable by our current social standards.
Justification for a proposed risk reduction measure is taken as in-
creasing with increasing risk score and with effectiveness of the pro-posed measure, and decreasing with increased costs. A justificationfactor so assigned varies from that for a highly worthwhile effort downto efforts of doubtful merit. Such assigned justification factors makeit possible to establish realistic priorities within the safety program.
The mathematical operations involved here are relatively simple andare performed either algebraically or graphically on nomographs. Thesenomographs permit direct entry through descriptive terms; they give bothnumerical and descriptive answers. Such answers are meaningful not onlyto safety personnel but also to management and operating personnel. Thegraphical method also provides written documentation for the analysis.

NWC TP 5865
INTRODUCTION
A successful accident prevention program, aside from its humanitar-ian aspects, makes positive contributions to production rates and to
reduced operating expense. Much progress in such a program has beenmade in the last few decades. However, there is still room for improve-ment, which is well indicated by the observation that currently in theUnited States each year there are about 2,500,000 work-related disablingaccidents with about 50,000,000 man-days of lost time and some 14,000fatalities, and that the cost of such accidents is about $14 ,000,000 ,000
-
1
A safety management program designed to reduce the toll from indus-trial accidents requires considerable thought, effort, and compromise,or it can prove to be both wasteful and ineffective. A mathematicalapproach that avoids these defects is presented here.
SAFETY CONSIDERATIONS
A safety program should be based on documented factual informationand on informed judgement, and not on subjectivity or intuition. Like-wise, safety recommendations should be quantitative in nature so that
alternative proposals can readily be evaluated, urgencies assessed, andsafety priorities established. Furthermore, to be effective all safetyterms should be expressed simply so that they are understandable by bothoperating and management personnel. 2
' 3
Safety programs, desirable as they are, present difficulties. Oneconcerns the level of effort that should be devoted to a safety program.A low level of effort may be inadequate and not achieve its purpose.Alternatively, the effort can be so intense that an entire operation is
hampered to such an extent that no useful work can be accomplished.
1 Aooident Facts, published annually by the National Safety Council
,
425 N. Michigan Ave., Chicago, 111.2 Rollin H. Simonds and John V. Grimaldi. Safety Management:
Accident Cost and Control. Homewood, 111., Richard D. Irwin, Inc., 1963.3 H. W. Henrich. Industrial Accident Prevention: A Scientific
Approach. New York, McGraw-Hill, 1959.
NWC TP 5865
From such considerations it follows that there is a best safety programfor each situation. The following material describes one method for
achieving this optimum.
Hazard
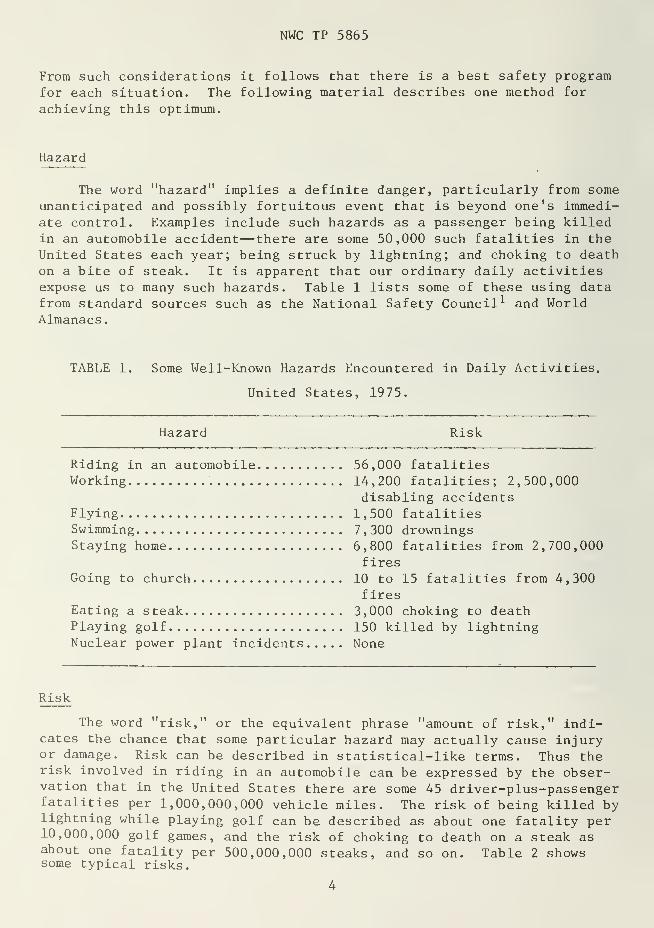
The word "hazard" implies a definite danger, particularly from someunanticipated and possibly fortuitous event that is beyond one's immedi-ate control. Examples include such hazards as a passenger being killedin an automobile accident— there are some 50,000 such fatalities in theUnited States each year; being struck by lightning; and choking to deathon a bite of steak. It is apparent that our ordinary daily activitiesexpose us to many such hazards. Table 1 lists some of these using datafrom standard sources such as the National Safety Council 1 and WorldAlmanacs.
TABLE 1. Some Well-Known Hazards Encountered in Daily Activities.
United States, 1975.
Hazard Risk
Riding in an automobile 56,000 fatalitiesWorking 14,200 fatalities; 2,500,000
disabling accidentsFlying 1,500 fatalitiesSwimming 7 , 300 drowningsStaying home 6,800 fatalities from 2,700,000
firesGoing to church 10 to 15 fatalities from 4,300
firesEating a steak 3,000 choking to deathPlaying golf 150 killed by lightningNuclear power plant incidents None
Risk
The word "risk," or the equivalent phrase "amount of risk," indi-cates the chance that some particular hazard may actually cause injuryor damage. Risk can be described in statistical-like terms. Thus therisk involved in riding in an automobile can be expressed by the obser-vation that in the United States there are some 45 driver-plus-passengerfatalities per 1,000,000,000 vehicle miles. The risk of being killed bylightning while playing golf can be described as about one fatality per10,000,000 golf games, and the risk of choking to death on a steak asabout one fatality per 500,000,000 steaks, and so on. Table 2 showssome typical risks.
4

NWC TP 5865
TABLE 2. Amounts of Risk Typically Considered Acceptable,
United States, 1975.
Hazard Risk
Riding in an automobile 45 fatalities per 10 vehicle-miles; 1 fatality per 1,000rider-years
Flying, scheduled flights 1.3 fatalities per 10 9 pas-
senger milesFlying, all flights 20 fatalities per 10 9 rider-
milesWorking 1 fatality per 4,500 worker-
yearsRiding a bicycle 1 hospitalization per 10 4
rider-milesHurricanes 1 fatality per 2,500,000 per-
son-yearsAll accidents 1 fatality per 1600 person-
yearsNuclear reactor operation 1 "incident" per 3 x 10 8
reactor-years
The Acceptable Risk
Since we cannot completely avoid all the hazards in our ordinarylives, all risk from such hazards can never be completely eliminated.However, one often takes steps to reduce the risk associated with someparticular hazard. Thus when we drive carefully with seat belts fas-tened, we reduce the risk of becoming an automobile accident fatality.Similarly we avoid open stretches of a golf course when a thunderstormis impending, and we eat our steaks in well-chewed small bites.
The above lugubrious thoughts serve to introduce the concept of
the acceptable risk, as suggested by Dr. Billings Brown of the SafetyDivision of the American Ordnance Association. An acceptable risk canbe defined as that real risk imposed by some hazard, but one that underthe circumstances would not deter a knowledgeable and prudent person.Thus, the risks of riding in an automobile, playing golf, or eating a
steak, are regarded by some people as acceptable risks. In any eventsuch risks often seem preferred over never driving or riding in anautomobile, never going out-of-doors, or never eating solid food.
Private communication, 1968.
5

NWC TP 5865
Convenience plays a part in setting an acceptable level of risk.Thus the risk of being killed in an automobile accident is about one per1,000 rider-years and obviously is considered acceptable to many of us.
This acceptance must be based in part on a rationalization such as, "I
will never live for one thousand years, hence I will never be one ofthese fatalities."
Other circumstances play a part in determining what risk is accept-able. This can be illustrated by comparing data for riding in airplaneswith those for riding in automobiles. The risk of traveling by airplaneis far less than traveling by automobile, but there are some people whoavoid airplane travel even though they ride in automobiles. And what is
considered an acceptable level for risk in industrial work is well belowthat considered acceptable in either the airplane or automobile mode of
travel. This low level of acceptable risk for industrial work meritsapproval; however, to achieve and maintain this level requires effort,along with optimum use of the available resources of time, material, andmoney
.
The Safety Maxims
The basic thoughts behind the observations above can be formalizedin safety maxims, as follows:
1. All the many hazards in life cannot be completely avoided, andall risks from such hazards can never be completely eliminated.
2. Careful thought and effort can often reduce the risks in ordin-ary life down to acceptable levels.
3. Our limited resources of time and effort should be utilizedfor maximum benefits of risk reduction rather than being dissipated in
hopeless efforts to completely eliminate certain selected risks.
These safety maxims are well accepted in the technical communityeven though in some situations, legal ones for example, they may not beconsidered relevant. These safety maxims have led to a system as de-
veloped here for quantitative characterization of risks and for evalu-ation of proposed risk-reduction procedures. This system uses numericalvalues for comparison purposes. It also provides descriptive terms that
are meaningful, not only to safety personnel but also to those in man-
agement and in operations. Such a system was first suggested in a re-
port by William T. Fine, and many of the evaluations here are based on
that report. **
4 Naval Ordnance Laboratory. Mathematical Evaluations for Con-trolling Hazards, by William T. Fine. White Oak, Md., NOL, 1971.
(NOLTR 71-31, publication UNCLASSIFIED.)

NWC TP 5865
RISK CALCULATION
The risk imposed by some particular hazard can be taken as increas-ing (1) with the likelihood that the hazardous event will actually occur
,
(2) with exposure to that event, and (3) with possible consequences of
that event. For risk calculations, numerical values are assigned to
each of these three factors. Then an overall risk score is computed as
the product of these three separate factors. The numerical values, al-though arbitrarily chosen, are self-consistent and together they providea realistic but relative score for the overall risk.
Likelihood of Hazardous Event
The likelihood of occurrence of a hazardous event is related to
the mathematical probability that it might actually occur. For purposeshere, however, likelihood is expressed in alternative terms of expecta-tions. Likelihoods that may be encountered in practical safety situa-tions range from the completely unexpected and unanticipated, but re-motely possible, up to an event that might well be expected at somefuture time.
An example of the first of these, an unexpected but remotely pos-sible event, is failure of a proof-tested container of compressed gases.For mathematical purposes the likelihood factor for such an event is
arbitrarily assigned the value of unity. An example of the second typeof hazardous event, one which might well be expected at some futuretime, is combustible material catching on fire in a drying oven, par-ticularly if this has happened in the recent past. The likelihood fac-
tor for such an event is assigned the value of 10.
These two likelihoods provide reference points on a scale of like-
lihoods for ordinary hazardous events. Situations between these two
reference likelihoods are then readily assigned intermediate values.For example, a "could happen" type of event is assigned a likelihoodvalue such as six, and an event that would be unusual, but still quitepossible, is assigned a value of three.
Safety considerations must provide not only for all such possiblesituations, but also for ones that approach the impossible. The abso-lutely impossible event would be assigned a likelihood value of zero.
However, no event that can be described can ever be considered as beingabsolutely impossible; that is, have a mathematical probability of zero.
Nevertheless, its probability can approach zero so closely that theevent is virtually impossible. A likelihood value of one-tenth is
assigned to this virtually impossible situation, which thus becomesanother reference point for the likelihood scale.

NWC TP 5865
This two-decade scale for likelihood factors ranges from the valueof one- tenth for the virtually impossible event, through the value of
unity for an unexpected but remotely possible event, up to the value of
10 for an expected event. These reference points plus interpolatedvalues are as follows:
Likelihood Value
''Might well be expected 10
Quite possible 6
Unusual but possible 3
*0nly remotely possible 1
Conceivable but very unlikely 0.5Practically impossible 0.2
^Virtually impossible 0.1
The Exposure Factor
The greater the exposure to a potentially dangerous situation the
greater is the associated risk. To provide for this, the value of unityis assigned to the situation of a rather rare exposure, perhaps only a
very few times per year. Then the value of 10 is assigned for continu-ous exposure. Interpolation between these two reference points providesfor intermediate values, thus the value of three is assigned for a weeklyexposure. Extrapolation is needed to provide for situations of a veryrare exposure, and indeed the value of zero would be assigned for no ex-
posure at all.
Likelihood Value
'^Continuous 10
Frequent (daily) 6
Occasional (weekly) 3
Unusual (monthly) 2
*Rare (a few per year) 1
Very rare (yearly) 0.5
Factors for Possible Consequences
Damage from a hazardous event can range all the way from minordamage that is barely noticeable up to the catastrophic. This very wide
range is taken as extending over two decades in numerical values. Thus
the reference value of unity is assigned for the noticeable situationand the value of 100 for the catastrophic.
*Reference point.

NWC TP 5865
The noticeable situation is taken as one that involves a materialdamage of perhaps $100, or an incident that would be classified as a
minor first aid accident. The catastrophic situation is taken as onewhere there are many fatalities, or where there is a material loss of
millions of dollars. Intermediate factors are readily assigned; for
example, a disaster with a few fatalities or with material damage greaterthan about $1,000,000 would carry the value of 40. Also included are thevery serious, the serious, and the important situations. Consequencefactors and values for these situations are included below:
Possible consequence Value
*Catastrophe (many fatalities, or >$10 7 damage).... 100
Disaster (few fatalities, or >$10° damage) 40
Very serious (fatality, or >$10 5 damage) 15
Serious (serious injury, or >$10t+
damage) 7
Important (disability, or >$10 3 damage) 3
^Noticeable (minor first aid accident, or>$ 100 damage) 1
It can be noted that the relation between possible material damage andthe consequence factor can be represented by the empirical formula
factor = (damage/100) - 4
Consequence factors have two rather different aspects. One is
personnel injury or fatality, or both. The other is material damage.
In spite of possible objections, practicalities of the situation dictatea common scale for these two quite different items (such as for liabil-ity insurance) . Such a common scale has an advantage in that it can
provide for situations where both personal injury and material damagemight occur; here the consequence factor is a weighted sum of its two
diverse aspects.
Risk Score
The risk score for some potentially hazardous situation is givennumerically as the product of three factors: one numerical value eachfor likelihood, for exposure, and for possible consequences.
Numerical risk scores, as so computed, can readily be associatedwith the risks observed for actual situations. Thus experience indi-cates that a risk score as low as 20 represents a situation of low risk,
one considered acceptable by our current standards for industrial work.
*Reference point.

NWC TP 5865
Such a risk is far less than the risks we ordinarily accept in everydaysituations; "for example, when we drive to work, when we mow the lawnwith a power mower, or when we ride a bicycle for exercise.
Experience also indicates that a situation with a risk score in theorder of 70 to 200 is one with substantial risk where, according to ourcurrent social standards, correction is needed (the social standards ofyears ago were not so demanding). Then there can be higher risk situ-ations; a risk score of 200 to 400 indicates that correction is urgentlyneeded. A very high risk score of more than 400 indicates a situationso risky that one should consider ceasing operation until at least in-
terim measures to correct the deficiency can be implemented, or perhapspermanent shutdown becomes necessary if the operation cannot be madesafe. These risk score classifications are based on experience and aresubject to adjustment when experience indicates otherwise. However the
classifications are very conservative and therefore provide strong state-ments for the risks involved.
Risk score Risk situation
>400 Very high risk; consider discontinuingoperation
200 to 400 High risk; immediate correction required70 to 200 Substantial risk; correction needed20 to 70 Possible risk; attention indicated
>20 Risk; perhaps acceptable
Graphical Calculation of Risk Score
Risk scores, defined above as products of three factors, can withsome convenience be calculated graphically as shown in Figure 1. The
likelihoods are listed on the first or left line of this nomograph. Thescale is logarithmic in nature and is graduated so that distances alongthis line are proportional to the logarithms of the likelihood factors.
However, only descriptive terms appear, and the actual numbers have beenomitted. The value of zero corresponding to a hypothetical "absolutelyimpossible" situation cannot be shown along this line as the logarithmof zero is minus infinity. Exposure factors are listed on the secondline in the nomograph. Factors for possible consequences appear along
the fourth line.
To calculate a risk score using this nomograph, locations corres-ponding to each factor involved are first established. Then a line is
drawn from the point for the likelihood factor through that for the ex-
posure factor and extended to the tie line at the center. (Locationalong this tie line corresponds to the product of these two factors, butthe numbers have been omitted.) A second line is drawn from this pointon the tie line through that for the consequence factor and extended to
the scale for the risk score. A numerical value for this risk score andits descriptive equivalent are then obtained directly.
10

NWC TP 5865
<2
UJ
z j-.UJ 5
i
j*. T£ O cr
j~.
? uLU U. </] =i
Q. cc
2: ^7 -'.". rC
zUJ
<
<
52
< <
* 5:
<
03
I—
I
a
en
•HPi
oI—
I

NWC TP 5865
Evaluation of a Proposed Risk-Reduction Action
The larger the risk score for a situation, the more effective a
proposed corrective action, and the less that action costs, the greateris the justification. A quantitative index for this justification canbe derived from numerical values assigned to each of its three componentfactors. These are considered separately.
Effectiveness Value
The effectiveness value assigned to a proposed risk-reductionaction is taken as unity for complete elimination of risk, and zero for
an action with no effect. Intermediate values are assigned accordingly;for example, a measure that would reduce risk by about 60% would be as-signed an effectiveness value of 0.6.
COST CONSIDERATIONS
Cost and justification bear an inverse relation. Thus a cost fac-tor is best expressed as a divisor whose numerical value increases withcost so that increased cost gives lesser justification.
Experience indicates that the divisor for cost is approximatelyproportional to the cube root of the total dollar amount included.These dollar amounts include actual out-of-pocket cost plus capitalizedcosts for any increase in operating or overhead expenses. On this basisthe reference value of unity is assigned to the divisor representing a
total cost of $100, and the value of 10 for costs of 1,000 times greater,
or $100,000. The mathematical relation can be expressed in the form of
an equation:
if to..v,tal costdxvrsor =
y[—
Cost Effectiveness
A justification factor for a proposed risk-reduction action can beobtained mathematically by multiplying the risk score for a given situ-ation by the effectiveness factor for the proposed action and thendividing by its cost divisor. This justification factor can be takenas the cost effectiveness for the proposed action. Numerical valuesfor this cost effectiveness have been correlated with experience. Thus,
a justification value of less than about 10 indicates that a proposalis of doubtful merit. The small risk reduction does not justify the
indicated expenditure of time, effort, and money, and such endeavorscould well be more effective in other situations. Values between 10 and
20 indicate that action is justified. Experience suggests that a
12

NWC TP 5865
justification value greater than about 20 indicates a highly worthwhilerisk-reduction action.
These values for the justification factor provide reference pointsfor an entire scale of justification factors. This scale permits readycomparison of the merits of various proposals for reduction of identi-fied risk. The scale is also a great aid in establishing prioritieswithin a broad risk-reduction program.
Graphical Calculation for Cost Effectiveness
The justification factor provides an index for cost effectiveness,and like the risk score can be calculated graphically as shown in Figure2. Entry to this nomograph is by three factors: one numerical valueeach for risk score as calculated previously, for degree of risk reduc-tion that the proposed measure provides, and for its cost divisor.Lines through these points give both a numerical value and a descriptiveterm for the justification factor.
The graphical methods have several advantages over the algebraic. (1)
When using the nomographs there is no need to refer to separate tablesfor values because entry can be made directly through the descriptiveitems of the chart. (2) The arithmetic calculation is simpler when donegraphically and, although it is of limited precision, this is quite sat-isfactory for purposes here. (3) The graphical solution automaticallyprovides documentation for both the risk analysis and justification cal-culation.
ANALYSIS OF A HAZARDOUS SITUATION
Risk Score Calculation
An access road in a processing plant carries occasional trafficpassing a large tank containing propane. There is a possibility that a
loaded truck on this access road might accidentally swerve from the roadat a point near the tank and crash into it. If so, the tank might failand spill its highly flammable contents. Then if these contents caughton fire, the damage could be substantial. Loss of the tank and its con-tents and damage inflicted on neighboring parts of the plant could costas much as $250,000. What is the risk score for this situation?
Algebraic Solution .
1. The chain of incidents described is conceivable but quite un-likely. The likelihood factor is assigned a value of 0.5
2. Only occasional exposure (weekly) is involved. This factoris assigned a value of 3
13

NWC TP 5865
en
uo4-1
aco
fa
en
en
ai
Coj
>H4J
OOJm
U-l
w
en
oa
CN
w!=oMfa
14

NWC TP 5865
3. As for possible consequences, serious personal injuries wouldnot be expected. For material damage of about $250,000, a consequencefactor is assigned (by interpolation) a value of 25
4. Risk score: 0.5 x 3 x 25 = (rounded) 30
This risk score of about 30 lies within the range of possible risk,and some attention is indicated.
Graphical Solution . The above calculation can readily be performedgraphically using Figure 1. First of the entry points are for desig-nated likelihood and exposure. A line through these is extended to thetie line and then drawn through the point for possible consequences ontothe line for risk score. The risk score indicated here lies at about 30
and is described as a possible risk, and some attention is indicated.This agrees with the algebraic results.
Justification Factor Calculation
It is suggested that the tank of the above risk score calculationbe moved to a more remote location, one about 100 feet (30 meters) fromthe access road. This move would eliminate perhaps as much as 75% of
the risk associated with the postulated accident. It is estimated thatthe move with its necessary replumbing would cost about $30,000. Whatis the justification factor and the cost effectiveness for this proposedsafety action?
Algebraic Solution .
1
.
Risk score as computed above 30
2. Value for 75% risk reduction 0.753. Divisor for costs, cube root of (30,000/100) 6.74. Justification factor and cost effectiveness
30 x 0.75 t 6.7 3.3
A cost effectiveness of only 3.3 indicates that the suggestion is ofdoubtful merit. But since the risk score of 30 indicates that somepossible risk is present, it appears that alternative methods for riskcontrol should be investigated.
It is suggested that a sturdy guard rail properly placed along theroad could reduce the risk of damage here considerably, perhaps as muchas 50%. Such a guard rail should cost only about $400. What is thejustification factor and the cost effectiveness for this proposed safetyaction?
Algebraic Solution .
1. Risk factor as computed above 30
2. Value for 50% risk reduction 0.5
15

NWC TP 5865
3. Divisor for costs, cube root of (400/100) 1.6
4. Justification factor and cost effectiveness:30 x 0.5 v 1.6 9.3
A cost effectiveness of 9.3 indicates that the action suggested in
this proposal is justified, but not overwhelmingly so. Nonetheless, it
is to be preferred over the somewhat more effective but far more expen-sive action of moving the tank. But in view of such a moderate justifi-cation, perhaps alternative proposals should also be investigated. Forexample, would a well-enforced speed limit be a preferred action? Or
should action with regard to this specific risk be deferred in favor of
a more justified action for some other risk situation?
16

NWC TP 5865
INITIAL DISTRIBUTION
1 Director of Navy Laboratories8 Naval Air Systems Command
AIR-104 (1)
AIR-30312 (2)
AIR-5108 (1)
AIR-603 (1)
AIR-954 (2)
AIR-OOP (1)
2 Chief of Naval OperationsOP-03EG (1)
OP-922F2 (1)
4 Chief of Naval MaterialMAT-033 (1)
NSP-00 (1)
1 Naval Facilities Engineering Command7 Naval Sea Systems Command
SEA-034 (1)
SEA-04H (1)
SEA-09G32 (2)
SEA-0962 (1)
SEA-0963 (1)
SEA-OOP (1)
3 Chief of Naval Research, ArlingtonScientific Information Librarian (1)
1 Bureau of Naval Personnel1 Commandant of the Marine Corps2 Marine Corps Development and Education Command, Quantico1 Air Test and Evaluation Squadron 5
1 Commander in Chief, Atlantic Fleet1 Commander in Chief, Pacific Fleet1 Civil Engineering Laboratory, Port Hueneme1 Cruiser-Destroyer Force, Atlantic Fleet1 Cruiser-Destroyer Force, Pacific Fleet1 Fleet Anti-Submarine Warfare School, San Diego1 Marine Corps Air Station, Yuma1 Marine Corps Supply Center, Barstow (D.E. Beach)1 Naval Air Development Center, Johnsville1 Naval Air Force, Atlantic Fleet1 Naval Air Force, Pacific Fleet1 Naval Air Propulsion Test Center, Trenton1 Naval Air Station, Alameda (Safety Director)
17

NWC TP 5865
1 Naval Air Station, North Island, San Diego, Calif.1 Naval Air Station, Patuxent River (Safety Director)1 Naval Air Test Center, Patuxent River (Armament Test)1 Naval Ammunition Depot, Concord1 Naval Ammunition Depot, Hawthorne1 Naval Ammunition Depot, MacAllister1 Naval Avionics Facility, Indianapolis3 Naval Electronics Laboratory, San Diego, Calif.1 Naval Explosives Ordnance Disposal Facility, Indian Head1 Naval Medical Research Institute, Bethesda1 Naval Observatory1 Naval Ordnance Station, Indian Head1 Naval Postgraduate School, Monterey (Technical Reports Section Library)1 Naval Research Laboratory (Safety Director)3 Naval Sea Support Center, Pacific, San Diego, (J. F. Green)6 Naval Sea Systems Safety School, Bloomington (G. W. Marsischky)1 Naval Ship Research and Development Center, Annapolis1 Naval Ship Research and Development Center, Bethesda1 Naval Submarine Medical Center, Naval Submarine Base, New London1 Naval Surface Weapons Center, Dahlgren Laboratory, Dahlgren
(MIL, Technical Library)2 Naval Surface Weapons Center, White Oak
Code EST, C. L. Berkey (1)
1 Naval Torpedo Station, Keyport (Safety Director)2 Naval Training Device Center, Orlando
Technical Library (1)
1 Naval Undersea Center, San Diego1 Naval War College, Newport1 Naval Weapons Evaluation Facility, Kirtland Air Force Base1 Naval Weapons Quality Assurance Office1 Naval Weapons Station, Yorktown6 Naval Weapons Support Center, Crane1 Navy Underwater Sound Reference Laboratory, Orlando1 Operational Test and Evaluation Force1 Pacific Missile Test Center, Point Mugu1 Philadelphia Naval Shipyard1 Submarine Force, Atlantic Fleet1 Submarine Force, Pacific Fleet1 Naval Air Systems Command Representative, Pacific4 Army Missile Command, Redstone Arsenal (Redstone Scientific
Information Center)1 Army Ammunition Procurement & Supply Agency, Joliet1 Army Research Office, Durham1 Aberdeen Proving Ground1 Deseret Test Center, Fort Douglas1 Edgewood Arsenal1 Frankford Arsenal1 Harry Diamond Laboratories1 Holston Army Ammunition Plant
18
NWC TP 5865
1 Iowa Army Ammunition Plant1 Picatinny Arsenal1 Plastics Technical Evaluation Center, Picatinny Arsenal (SMUPA-VP3)1 Radford Army Ammunition Plant1 Redstone Arsenal1 Rock Island Arsenal1 White Sands Missile Range1 Yuma Proving Grounds3 Headquarters, U. S. Air Force
AFOP-00 (1)
FRDRD-AC (1)
1 Aerospace Defense Command, Ent Air Force Base1 Air Force Systems Command, Andrews Air Force Base1 Tactical Air Command, Langley Air Force Base (TPL-RQD-M)1 Aeronautical Systems Division, Wright-Patterson Air Force Base4 Air Force Flight Test Center, Edwards Air Force Base (H. Smith)
1 Air Force Missile Test Center, Patrick Air Force Base1 Armament Development and Test Center, Eglin Air Force Base1 Deputy Director of Defense Research and Engineering1 Defense Advanced Research Projects Agency, Arlington1 Armed Forces Staff College, Norfolk
12 Defense Documentation Center3 Explosives Safety Board1 Atomic Energy Commission (Technical Library)1 Bureau of Mines, Pittsburgh1 Department of Labor (Jerry Scannell)1 Department of Labor, San Francisco (Larry Gromachey)1 Federal Aviation Administration, Department of Transportation,Atlantic City (Chief, Airborne Instrumentation Unit)
1 Langley Research Center1 Weapons System Evaluation Group1 AC Electronics Division, General Motors Corporation, Milwaukee
(Technical Library)1 AMC Safety School, Louisville, Ky.
1 Aerojet-General Corporation, Azusa, Calif.1 Aerojet Liquid Rocket Company, Sacramento, Calif, via AFPRO1 Allegany Ballistics Laboratory, Cumberland, Md.
1 Applied Physics Laboratory, JHU, Laurel, Md.1 Atlantic Research Corporation, Alexandria, Va. (Technical Library)1 Autonetics, A Division of North American Rockwell Corporation,Anaheim, Calif. (Technical Library)
1 Battelle Memorial Institute, Columbus, Ohio (Technical Library)1 Bell Aerosystems Company, Buffalo, N. Y. (Technical Library)1 Bell Telephone Laboratories, Inc., Whippany Laboratory, Whippany, N.
(Technical Library)1 Carboline Company, St. Louis, Mo.1 Center for Naval Analyses, University of Rochester, Arlington, Va.
(Director, Naval Long Range Studies)3 Chemical Propulsion Information Agency, Applied Physics Laboratory,
JHU, Silver Springs, Md.
19

NWC TP 5865
1 Convair Division of General Dynamics, San Diego, Calif.IE. I. duPont de Nemours & Company, Inc., Savannah River Laboratory,Augusta, Ga.
IE. I. duPont de Nemours & Company, Inc., Wilmington, Del.
1 Esso Research and Engineering Company, Linden, N. J. (Dr. J. A. Brown)1 Franklin Institute, Philadelphia, Pa.
1 General Dynamics, Pomona Division, Pomona, Calif. (EngineeringLibrarian)
1 General Precision, Inc., Librascope Division, Glendale, Calif.(Engineering Library)
1 Grumman Aerospace Corporation, Bethpage, N. Y. (Library Director)1 Honeywell Incorporated, Minneapolis, Minn.1 Hughes Aircraft Company, Culver City, Calif.1 IIT Research Institute, Chicago, 111.
1 ITT International Electric Corporation, Nutley, N. J.
1 Jet Propulsion Laboratory, CIT, Pasadena, Calif.1 Lincoln Laboratory, MIT, Lexington, Mass.1 Ling-Temco-Vought , Inc., Vought Aeronautics Division, Dallas, Tex.
1 Litton Systems, Inc., Woodland Hills, Calif.1 Lockheed Missiles and Space Company, Palo Alto, Calif.
1 Lockheed Missiles and Space Company, Sunnyvale, Calif.1 Los Alamos Scientific Laboratory, Los Alamos, N. Mex.
1 Marquart Corporation, Van Nuys, Calif.1 McDonnell Douglas Corporation, Long Beach, Calif.1 McDonnell Douglas Corporation, St. Louis, Mo. (Engineering Laboratory)1 Midway Research Institute, Kansas City (Technical Library)1 Minnesota Mining and Manufacturing Company, St. Paul, Minn.
1 Naval Warfare Research Center, Stanford Research InstituteMenlo Park, Calif.
2 New York University, University Heights, New YorkDr. John Grimaldi (1)
Document Control-CJM (1)
1 Norden Division, United Aircraft Corporation, Norwalk, Conn.
1 North American Rockwell Corporation, Downey, Calif.1 Northrop Corporation, Norair Division, Hawthorne, Calif.1 Oak Ridge National Laboratory, Metallurgical Division, Oak Ridge, Tenn.
1 Philco Ford Corporation, Communication Systems Division,Willow Grove, Pa.
1 Polytechnic Institute of Brooklyn, Farmingdale, N. Y.
(Aerodynamics Laboratory)1 Purdue University, Lafayette, Ind. (Department of Chemistry, E. T. McBee)1 Research Analysis Corporation, McLean, Va.
1 Rocketdyne, Canoga Park, Calif.1 Rocketdyne, McGregor, Tex. (Rocket Fuels Division)1 Rohm & Haas Company, Redstone Arsenal Research Division, Redstone, Ala.
1 Ryan Aeronautical Company, San Diego, Calif.1 Sandia Corporation, Albuquerque, N. Mex.1 Southwest Research Institute, Houston, Tex. (Dr. H. C. McKee)1 Stanford Research Institute, Poulter Laboratories, Menlo Park, Calif.
20
1 TRW Systems, Redondo Beach, Calif.
1 Texas Instruments, Inc., Dallas, Tex.
1 The Bendix Corporation, Electrodynamics, North Hollywood, Calif.1 The Boeing Company, Seattle, Wash.
1 The Boeing Company, Airplane Division, Wichita Branch, Wichita, Kan.
1 The Bunker-Rarao Corporation, Westlake Village, Calif.
1 The Dow Chemical Company, Midland, Mich.
1 The Rand Corporation, Santa Monica, Calif.
1 Thiokol Chemical Corporation, Huntsville Division, Huntsville, Ala.
1 Thiokol Chemical Corporation, Wasatch Division, Brigham City, Utah1 University of California, Institute of Engineering Research,
Berkeley, Calif.
5 University of California Lawrence Radiation Laboratory, (TechnicalInformation Division) Livermore
C. G. Craig (1)
J. Bell/M. Martin (2)
M. C. Larsen/W. L. Nevil (1)
Kenneth Street (1)
1 Walter G. Legge Company, New York, New York1 Westinghouse Electric Corporation, Baltimore, Md. (Engineering Library)
NWC 0032 805 (7/1) 440

DUDLEY KNOX LIBRARY - RESEARCH REPORTS
5 6853 01058315 6
UiOPb;