practical relationships from theoretical lead solubility
TRANSCRIPT

Practical Relationships fromTheoretical Lead Solubility Modeling
David G. Wahman, Matthew D. Pinelli,Michael R. Schock, and Darren A. Lytle
Center for Environmental Solutions & Emergency ResponseU.S. Environmental Protection Agency
Cincinnati, Ohio, United States2020 EPA Drinking Water Workshop
September 3, 2020

After this presentation, you will
09/03/2020 22020 EPA Drinking Water Workshop
1. Know of lead solubility simulation code
LimitationsCapabilities
2. Understand practical relationships from theory
Dissolved inorganic carbon (DIC) & pHDIC, pH, & orthophosphateSulfateChloride

Notes on Models – George Box
09/03/2020 32020 EPA Drinking Water Workshop
British statistician
https://rss.onlinelibrary.wiley.com/doi/pdf/10.1111/j.1740-9713.2010.00442.x
The most that can be expected from any model is that it can supply a useful approximation to reality:
All models are incomplete; some models are useful.

Notes on Models – Ongoing Process
09/03/2020 42020 EPA Drinking Water Workshop
Real System
ExperimentalData
ConceptualModel
Conceptual ModelEvaluation
ComputerizedModel
Model Implementationand Verification
ModelAnalysis
Simulation
ModelValidation
Adapted from Augusiak et al. (2014): https://doi.org/10.1016/j.ecolmodel.2013.11.009

09/03/2020 52020 EPA Drinking Water Workshop
Lead Solubility Model – LEADSOL
Written by Mike Schock (1978 with subsequent updates)Theoretical equilibrium assumed (where you are going)No kinetic considerations (how fast you get there)Fortran older language, difficult to maintain/share/update

09/03/2020 62020 EPA Drinking Water Workshop
Lead Solubility Model Code – R “Fixed” optionsWater!Pro, Tetra Tech (RTW) Model
“Custom” options Excel, PHREEQC, MINEQL+, Python, etc.R open source, freeware https://cran.r-project.org/
Code on GitHub eventually Reproducible Update/expansion by others
Graphical user interface Shiny package User–selectable inputs Select “simulation type” Select solids to consider Select equilibrium constants to use
Verified against LEADSOL & Excel version

09/03/2020 72020 EPA Drinking Water Workshop
Lead Solubility Models – Limitations Equilibrium assumption (no kinetic limitations)
Single, controlling solid (i.e., homogeneous scale) Discrepancy with field scale (e.g., Tully et al., 2019) Unknown/multiple solubility constants for solids (e.g., calcium substituted) Amorphous versus crystalline solids
Pb(II) only (i.e., no Pb(IV) no redox, disinfectants/O2)Total lead (TOTPb) = soluble only (no particulate)No mass transfer limitations (e.g., Ma et al., 2018)Only 25°C temperatureNo biotic (e.g., biofilm) or organic matter (i.e., NOM) interactionsPhosphate
Scavenging ignored (e.g., calcium solids) Orthophosphate only (i.e., polyphosphates ignored)

Limitation – Heterogeneous Scale
09/03/2020 82020 EPA Drinking Water Workshop
Multiple solids & thicknesses (controlling? eq. constant?)
Figure 4 from Tully et al. (2019): https://doi.org/10.1002/aws2.1127

Limitations – Multiple Constants (Uncertainty)
pH6.5 7.0 7.5 8.0 8.5
Lead
, mg/
L
0.001
0.01
0.1
09/03/2020 92020 EPA Drinking Water Workshop
Hydroxypyromorphite (Pb5(PO4)3OH(s)) example 1 mg phosphate/L; DIC as noted
log K-62.83 (Nriagu 1972), 10 mg C/L-66.77 (Zhu et al. 2015), 10 mg C/L-62.83 (Nriagu 1972), 50 mg C/L-66.77 (Zhu et al. 2015), 50 mg C/L Action Level
Nriagu (1972): https://doi.org/10.1021/ic50116a041Zhu et al. (2015): https://doi.org/10.1155/2015/269387

09/03/2020 102020 EPA Drinking Water Workshop
Limitations – Mass Transfer (Diffusion)
pH ~ 7 (Bulk)
pH ~ 4 (Surface)
Bulk,What we measure
Surface,What scale sees
Hydraulics matter Flow velocity Stagnation
Figure 3 (a) from Ma et al. (2018): https://doi.org/10.1021/acs.est.7b05526

09/03/2020 112020 EPA Drinking Water Workshop
Lead Solubility Models – Useful? Historically used Schock (1980, 1981)
Applicable for simple Pb carbonate or phosphate scales (Tully et al., 2019)Tool in the toolbox
Pipe rigs, scale analyses, coupon studies, premise sampling, biostability, cleaning
Show trends with water chemistry Alkalinity, DIC, pH, phosphate, chloride, sulfate
Potential impact of operational changesGuide research questions
Evaluate/interpret experimental/field results Propose solids georgeite (Lytle et al., 2019) Estimate unknown solubilities Indicate other mechanisms controlling?
Schock (1980): https://doi.org/10.1002/j.1551-8833.1980.tb04616.xSchock (1981): https://doi.org/10.1002/j.1551-8833.1980.tb04615.xLytle et al. (2019): https://doi.org/10.1016/j.cej.2018.08.106Tully et al. (2019): https://doi.org/10.1002/aws2.1127

09/03/2020 122020 EPA Drinking Water Workshop
Lead Solubility Model Code BasicsTheoretical Equilibrium Lead Solubility Simulator (TELLS)
Future GitHub download instructions to run locallyNine solids included individual & multipleMajor complexes included
Hydroxide, carbonate, phosphate, chloride, and sulfate TOTPb = Pb(II) + Pb(II) complexes
Evaluate change in a selected parameter pH, DIC, phosphate, chloride, sulfate, or ionic strength
Generate solubility plotsExport data (.csv)

09/03/2020 132020 EPA Drinking Water Workshop
TELLS – Sidebar & General Info Tab
Solubility Plots
User Selections
General Info

09/03/2020 142020 EPA Drinking Water Workshop
TELLS – Equilibrium Constants

09/03/2020 152020 EPA Drinking Water Workshop
TELLS – Simulation Type Example

09/03/2020 162020 EPA Drinking Water Workshop
TELLS – Solids to Consider & Buttons

09/03/2020 172020 EPA Drinking Water Workshop
TELLS – Individual Solid (Log C vs. pH)L)
g/m
or ar
olm
ion
(atr
ent
onc
Log
c
User selected simulation type (pH, DIC, IS, Cl–, TOTSO4, TOTPO4)
T
Pb(II
) Com
plex
es
Pb(II)
OTPbAL

09/03/2020 182020 EPA Drinking Water Workshop
TELLS – Multiple Solids Considered

09/03/2020 192020 EPA Drinking Water Workshop
LEADSOL Verification
pH6 7 8 9 10 11
Lead
, mg/
L
0.01
0.1
1
105 mg C/L DIC (Digitized)50 mg C/L DIC (Digitized)100 mg C/L DIC (Digitized)5 mg C/L DIC (Simulation)50 mg C/L DIC (Simulation)100 mg C/L DIC (Simulation)
Digitized from Schock (2017):https://www.researchgate.net/publication/315761502_Lead_Corrosion_Control_101_A_Journey_in_Rediscovery
After this presentation, you will
09/03/2020 202020 EPA Drinking Water Workshop
1. Know of lead solubility simulation code Limitations Capabilities
2. Understand practical relationships from theory DIC & pH DIC, pH, & orthophosphate Sulfate Chloride

09/03/2020 212020 EPA Drinking Water Workshop
DIC & pH – Pb Solubility
At lower pH,↑ DIC = ↓ TOTPb
At higher pH,↑ DIC = ↑ TOTPb
Around pH 8,minor DIC impact
As ↑ pH, controllinglead solid changes from
cerussite hydrocerussite
Cerussite Hydrocerussite

09/03/2020 222020 EPA Drinking Water Workshop
DIC & pH – Important Species Simulator provides all individual lead species’ concentrationsLead and lead complex concentrations
Allows understanding of some trends
Carbonate solids example: ↑ DIC = ↑ Pb(CO3)22– importance at high pH
L/g m
ad,
eL
0.01
0.1
1
10
6 7 8 9 10 11
DIC = 5 mg C/L
Pb 2+ Total Pb
PbCO3
Pb(OH)2 2-
H)3PbOH + 4
(O
)H
b (OPPbHCO3 + bP
TOTPb
PbCO3
Pb2+
Pb(
6 7 8 9 10 11
L/g m
ad,
eL
0.01
0.1
1
10
TOTPb
pH
OH)2
DIC = 100 mg C/L
Total Pb
PbCO3
Pb 2+
Pb(CO3)2 2-
PbHCO (OH) H)3
Pb 2 (O3 +
Pb
PbCO3Pb2+
Pb(CO3)2–
Pb(OH)2
pH

09/03/2020 232020 EPA Drinking Water Workshop
DIC, pH, & Orthophosphate #1
6.5 7.0 7.5 8.0 8.5 9.0 9.50.01
0.1
With orthophosphate, minimum lead solubility near pH 7.5 ↑ orthophosphate = ↓ TOTPb
Lead
, mg/
L
0.016.5 7.0 7.5 8.0 8.5 9.0 9.5
0.1
DIC = 10 mg C/L
pH pH6.5 7.0 7.5 8.0 8.5 9.0 9.5
Lea
d, m
g/L
0.01
0.1
0 mg PO4/L .5 mg PO4/L 1 mg PO4/L 3 mg PO4/L 5 mg PO4/L
Lead
, mg/
L
0.01
0.1
6.5 7.0 7.5 8.0 8.5 9.0 9.5
0.0 mg TOTPO4/L0.5 mg TOTPO4/L1.0 mg TOTPO4/L3.0 mg TOTPO4/L5.0 mg TOTPO4/L
DIC = 50 mg C/L
pH
09/03/2020 242020 EPA Drinking Water Workshop
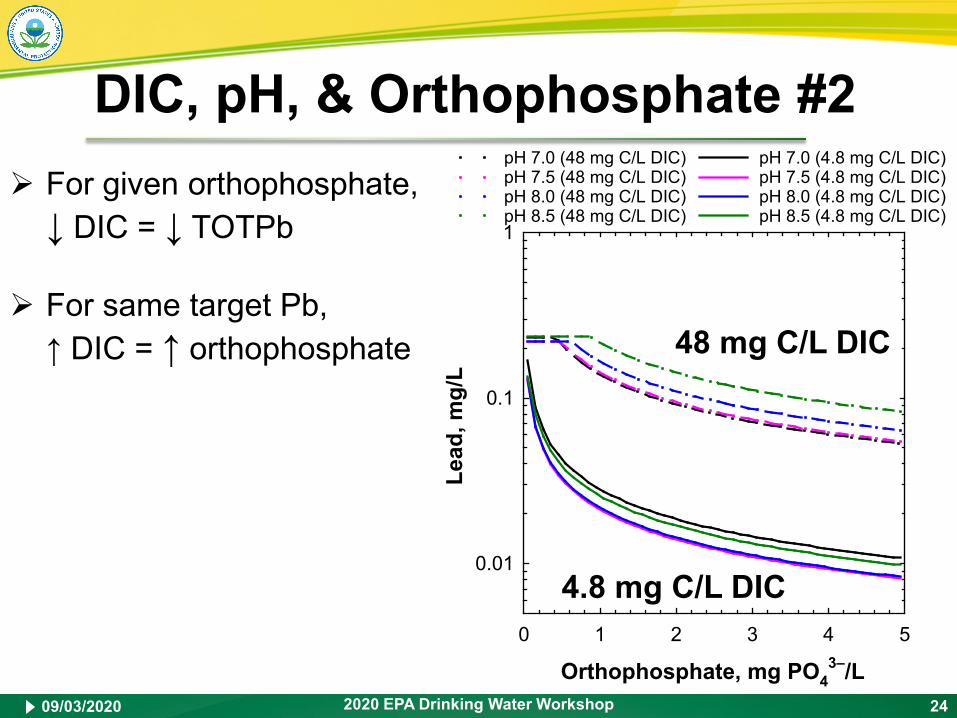
DIC, pH, & Orthophosphate #2 For given orthophosphate,↓ DIC = ↓ TOTPb
For same target Pb,↑ DIC = ↑ orthophosphate
0 1 2 3 4 5
Lead
, mg/
L
0.01
0.1
1
pH 7.0 (48 mg C/L DIC)pH 7.5 (48 mg C/L DIC) pH 8.0 (48 mg C/L DIC)pH 8.5 (48 mg C/L DIC)
pH 7.0 (4.8 mg C/L DIC)pH 7.5 (4.8 mg C/L DIC)pH 8.0 (4.8 mg C/L DIC)pH 8.5 (4.8 mg C/L DIC)
48 mg C/L DIC
4.8 mg C/L DIC
Orthophosphate, mg PO 3–4 /L

pH3.0 3.5 4.0 4.5 5.0 5.5 6.0
Lead
, (m
g/L)
1
10
100
1000 mg SO4/L (CSMR=0.1)200 mg SO4/L (CSMR=0.5)100 mg SO4/L (CSMR=1)
50 mg SO4/L (CSMR=2)20 mg SO4/L (CSMR=5) 10 mg SO4/L (CSMR=10)
09/03/2020 12020 EPA Drinking Water Workshop
Sulfate (100 mg chloride/L)
Minimal impact pH 7–11
Under acidic pH Anglesite (PbSO4) controls pH impact is minimal ↑ sulfate = ↓ TOTPb
3 4 5 6 7 8 9
)Lg/
(mad
,eL
0.01
0.1
1
10
100
pH
DIC = 5 mg C/L
1,000 mg TOTSO4/L (CSMR = 0.1)200 mg TOTSO4/L (CSMR = 0.5)100 mg TOTSO4/L (CSMR = 1.0)
50 mg TOTSO4/L (CSMR = 2)20 mg TOTSO4/L (CSMR = 5)10 mg TOTSO4/L (CSMR = 10)
CSMR = chloride to sulfate mass ratio

09/03/2020 262020 EPA Drinking Water Workshop
Chloride (100 mg sulfate/L)
Minimal impact pH 7–11
Under acidic pH
Anglesite (PbSO4) controls
1,000 mg Cl–/L (CSMR = 10)500 mg Cl–/L (CSMR = 5)200 mg Cl–/L (CSMR = 2)100 mg Cl–/L (CSMR = 1.0)50 mg Cl–/L (CSMR = 0.5)10 mg Cl–/L (CSMR = 0.1)
pH impact is minimal ↑ chloride = ↑ TOTPb
• ↑ chloride is less impactfulthan ↑ sulfate
• Chloride impact fromPbCl+ complex
CSMR = chloride to sulfate mass ratio pH3 4 5 6 7 8 9
)Lg/
(mad
,eL
0.01
0.1
1
10
100
DIC = 5 mg C/L

After this presentation, you will
09/03/2020 272020 EPA Drinking Water Workshop
1. Know of lead solubility simulation code Limitations Capabilities
2. Understand practical relationships from theory DIC & pH DIC, pH, & orthophosphate Sulfate Chloride

Summary R source code simulate theoretical lead solubility Verified against LEADSOL & Excel implementation Tool in the toolbox Highlighted limitations & capabilities Trends versus actual concentrations
Practical relationships from theory No orthophosphate
• ↑ DIC reduces or increases solubility (pH dependent)• Controlling carbonate solid switches (pH dependent) With orthophosphate, solubility depends on pH & DIC
09/03/2020 282020 EPA Drinking Water Workshop
Sulfate & chloride• Minimal impact pH 7–11• Acidic pH anglesite controls• Sulfate more impactful
09/03/2020 292020 EPA Drinking Water Workshop
Questions?AcknowledgementsCasey Formal
Contact InformationDavid G. Wahman
DisclaimerThe information in this presentation has been reviewed and approved for public dissemination in accordance with U.S. Environmental Protection Agency (EPA) policy. The views expressed in this presentation are those of the author and do not necessarily represent the views or policies of the EPA. Any mention of trade names or commercial products does not constitute EPA endorsement or recommendation for use.