practical online retrieval evaluation sigir 2011 tutorial filip radlinski (microsoft) yisong yue...
TRANSCRIPT

Practical Online Retrieval EvaluationSIGIR 2011 Tutorial
Filip Radlinski (Microsoft)Yisong Yue (CMU)

Retrieval Evaluation Goals
Goals: Practicality, Correctness, Efficiency
Baseline Ranking Algorithm My Research Project
Which is better?

Retrieval Evaluation Goals
• Practicality– If I’m a researcher with a small group, can I really use this
evaluation method in practice?
• Correctness– If my evaluation says that my ranking method is better than
a baseline, would users really agree?– If my evaluation says that my ranking method isn’t better
than the baseline, is that true?
• Efficiency– I want to make the best use of my resources: How do I best
trade off time/cost and sensitivity to changes?

EvaluationTwo types of retrieval evaluation:
• “Offline evaluation”Ask experts or users to explicitly evaluate your retrieval system. This dominates evaluation today.
• “Online evaluation”See how normal users interact with your retrieval system when just using it.

Do we need online evaluation?• Traditional offline evaluation: The Cranfield approach
– Sample some real representative queries– Run them against a number of systems– Judge the relevance of (top) documents versus (inferred)
information needs
• More often: Assume that somebody else has done this– Many groups have: TREC, OHSUMED, CLEF, LETOR, …
• Basic evaluation method:– For my new approach, rank a collection & combine the
judgments into a summary number. Hope it goes up

Do we need online evaluation?• The Cranfield approach is a good idea when
– Query set is representative of cases that my research tries to address
– Judges can give accurate judgments in my setting– I trust a particular summary value (e.g., MAP, NDCG, ERR)
to accurately reflects my users’ perceptions
• If these aren’t the case: Even if my approach is valid, the number might not go up– Or worse: The number might go up despite my approach
producing worse rankings in practice

Challenges with Offline Evaluation• Do users and judges agree on relevance?
– Particularly difficult for personalized search– Particularly difficult for specialized documents
• It’s expensive and slow to collect new data– Cheaper crowdsourcing (this morning) is sometimes an alternative
• Ambiguous queries are particularly hard to judge realistically– Which intent is most popular? Which others are important?
• Judges need to correctly appreciate uncertainty– If you want to diversify web results to satisfy multiple intents, how do judges
know what is most likely to be relevant?
• How do you identify when relevance changes?– Temporal changes: Document changes; Query intent changes
• Summary aggregate score must agree with users – Do real users agree with MAP@1000? NDCG@5? ERR?

Challenges with Offline Evaluation

Challenges with Offline Evaluation• Query: “introduction to ranking boosted decision trees”• Document:
…

Challenges with Offline Evaluation• Query: “ski jump world record”• Document:

Tutorial Goals• Provide an overview of online evaluation
– Online metrics: What works when (especially if you’re an academic)– Interpreting user actions at the Document or Ranking level– Experiment Design: Opportunities, biases and challenges
• Get you started in obtaining your own online data– How to realistically “be the search engine”– End-to-End: Design, Implementation, Recruitment and Analysis– Overview of alternative approaches
• Present interleaving for retrieval evaluation– Describe one particular online evaluation approach in depth– How it works, why it works and what to watch out for– Provide a reference implementation– Describe a number of open challenges
• Quick overview of using your online data for learning

Outline• Part 1: Overview of Online Evaluation
– Things to measure (e.g. clicks, mouse movements)– How to interpret feedback (absolute vs. relative)– What works well in a small-scale setting?
• Part 2: End-to-End, From Design to Analysis
(Break during Part 2)
• Part 3: Open Problems in Click Evaluation
• Part 4: Connection to Optimization & Learning

Online Evaluation
Key Assumption: Observable user behavior reflects relevance
• Implicit in this: Users behave rationally
– Real users have a goal when they use an IR system• They aren’t just bored, typing and clicking pseudo-randomly
– They consistently work towards that goal• An irrelevant result doesn’t draw most users away from their goal
– They aren’t trying to confuse you• Most users are not trying to provide malicious data to the system

Online Evaluation
Key Assumption: Observable user behavior reflects relevance
• This assumption gives us “high fidelity” Real users replace the judges: No ambiguity in information need; Users actually want results; Measure performance on real queries
• But introduces a major challengeWe can’t train the users: How do we know when they are happy? Real user behavior requires careful design and evaluation
• And a noticeable drawbackData isn’t trivially reusable later (more on that later)

What is Online Data?• A variety of data can describe online behavior:
– Urls, Queries and Clicks• Browsing Stream: Sequence of URLs users visit• In IR: Queries, Results and Clicks
– Mouse movement• Clicks, selections, hover
• The line between online and offline is fuzzy– Purchase decisions: Ad clicks to online purchases– Eye tracking– Offline evaluation using historical online data

Online Evaluation Designs• We have some key choices to make:
1. Document Level or Ranking Level?
2. Absolute or Relative?
Document Level Ranking Level
I want to know about the documents
Similar to the Cranfield approach, I’d like to find out the quality of each document.
I am mostly interested in the rankings
I’m trying to evaluate retrieval functions. I don’t need to be able to drill down to individual documents.
Absolute Judgments Relative JudgmentsI want a score on an absolute scale
Similar to the Cranfield approach, I’d like a number that I can compare to many methods, over time.
I am mostly interested in a comparison
It’s enough if I know which document, or which ranking, is better. Its not necessary to know the absolute value.

Online Evaluation Designs
Click
• Document-Level feedback• E.g., click indicates document is relevant• Document-level feedback often used to define
retrieval evaluation metrics.
• Ranking-level feedback• E.g., click indicates result-set is good• Directly define evaluation metric for a result-set.

Experiment DesignLab Study
Ask users to come to the lab, where they perform a specific task while you record online behavior.
• Controlled Task• Controlled Environment
Example: Users sit in front of an eye tracker while finding the answers to questions using a specific search engine [Granka et al, SIGIR ’04]
Controlled Task Field StudyAsk volunteers to complete a specific task using your system but on their computer.
• Controlled Task• Uncontrolled Environment
Example: Crowdsourcing tasks (tutorial this morning)
General Usage Field StudyAsk volunteers to use your system for whatever they find it useful for over a longer period of time
• Uncontrolled Task• Uncontrolled Environment
Example: Track cursor position on web search results page [Huang et al, CHI ‘11]

Concerns for Evaluation• Key Concerns:
– Practicality– Correctness– Efficiency (cost)
• Practical for academic scale studies– Keep it blind: Small studies are the norm– Must measure something that real users do often– Can’t hurt relevance too much (but that’s soft)– Cannot take too long (too many queries)

Interpretation ChoicesAbsolute Relative
Document LevelClick Rate,
Cascade Models,…
Click-Skip,FairPairs
Ranking LevelAbandonment,
Reciprocal Rank, Time to Click, PSkip,
…
Side by Side,Interleaving

Absolute Document Judgments• Can we simply interpret clicked results as relevant?
– This would provide a relevance dataset, after which we run a Cranfield style evaluation
• A variety of biases make this difficult– Position Bias:
Users are more inclined to examine and click on higher-ranked results
– Contextual Bias:Whether users click on a result depends on other nearby results
– Attention Bias:Users click more on results which draw attention to themselves

Position BiasHypothesis: Order of presentation influences where
users look, but not where they click!
→ Users appear to have trust in Google’s ability torank the most relevant result first.
0%
10%
20%
30%
40%
50%
60%
normal swapped
Pro
bab
ility
of C
lick
1 2 1 2
Normal: Google’s order of results
Swapped: Order of top 2 results swapped
[Joachims et al. 2005, 2007]
More relevant

What Results do Users View/Click?
Time spent in each result by frequency of doc selected
0
20
40
60
80
100
120
140
160
180
1 2 3 4 5 6 7 8 9 10 11
Rank of result
# t
imes r
an
k s
ele
cte
d
0
0.1
0.2
0.3
0.4
0.5
0.6
0.7
0.8
0.9
1
mean
tim
e (
s)
# times result selected
time spent in abstract
[Joachims et al. 2005, 2007]

Which Results are Viewed Before Click?
0
10
20
30
40
50
60
70
80
90
100
1 2 3 4 5 6 7 8 9 10Rank of Result
Pro
bab
ilit
y R
esu
lt w
as V
iew
ed Clicked Link
→ Users typically do not look at lower results before they click (except maybe the next result) [Joachims et al. 2005, 2007]

Quality-of-Context BiasHypothesis: Clicking depends only on the result itself, but
not on other results.
Rank of clicked link as sorted by relevance judges
Normal + Swapped 2.67
Reversed 3.27
→ Users click on less relevant results, if they are embedded between irrelevant results.
Reversed: Top 10 results in reversed order.
[Joachims et al. 2005, 2007]

• How to model position bias?
• What is the primary modeling goal?
Correcting for Position (Absolute / Document-Level)
Position Models Cascade Models
Clicks depend on relevance and position
Each rank position has some independent probability of being examined.
Users examine ranking sequentially
Users scan down the ranking until finding a relevant document to click on.
Insight into User Behavior Estimating RelevanceModel parameters can be used to interpret how users behave
“Position bias generally affects users X amount at rank 1”. Indirectly enables relevance estimation of documents.
Directly estimate the relevance of documents (or quality of rankings)
“A clicked document corresponds to X% probability of being relevant”. Does not directly give insight on user behavior.
Also: Some joint models do both!

Examination Hypothesis(Position Model)
• Users can only click on documents they examine– Independent probability of examining each rank
– Choose parameters to maximize probability of observing click log
– Straightforward to recover prob. of relevance– Extensions possible (e.g. Dupret & Piwowarski 2008)
– Requires multiple clicks on the same document/query pair (at different rank positions is helpful)
[Richardson et al. 2007; Craswell et al. 2008; Dupret & Piwowarski 2008]
A
C
B Click
C
A
B
Click

Logistic Position Model(Position Model)
– Choose parameters to maximize probability of observing click log
– Removes independence assumption– Straightforward to recover relevance (α)
• (Interpret as increase in log odds)
– Requires multiple clicks on the same document/query pair (at different rank positions helpful)
[Craswell et al. 2008; Chapelle & Zhang 2009]

Relative Click Frequency(Position Model)
[Agichtein et al 2006a; Zhang & Jones 2007; Chapelle & Zhang 2009]
Can also use ratio of click frequencies • called Clicks Over Expected Clicks (COEC) [Zhang & Jones 2007]

Cascade Model• Assumes users examines results top-down
1. Examines result2. If relevant: click, end session3. Else: go to next result, return to step 1
– Probability of click depends on relevance of documents ranked above.
– Also requires multiple query/doc impressions
[Craswell et al. 2008]

Cascade Model Example
500 users typed a query• 0 click on result A in rank 1• 100 click on result B in rank 2• 100 click on result C in rank 3
Cascade Model says:• 0 of 500 clicked A relA = 0
• 100 of 500 clicked B relB = 0.2
• 100 of remaining 400 clicked C relC = 0.25

Dynamic Bayesian Network(Extended Cascade Model)
• Like cascade model, but with added steps1. Examines result at rank j2. If attracted to result at rank j:
• Clicks on result• If user is satisfied, ends session
3. Otherwise, decide whether to abandon session4. If not, j j + 1, go to step 1
– Can model multiple clicks per session– Distinguishes clicks from relevance– Requires multiple query/doc impressions
[Chapelle & Zhang 2009]

Dynamic Bayesian Network(Extended Cascade Model)
[Chapelle & Zhang 2009]

Performance Comparison
[Chapelle & Zhang 2009]
• Predicting clickthrough rate (CTR) on top result• Models trained on query logs of large-scale search engine

Estimating DCG Change Using Clicks• Model the relevance of each doc as random variable
– I.e., multinomial distribution of relevance levels
– X = random variable– aj = relevance level (e.g., 1-5)– c = click log for query q
– Can be used to measure P(ΔDCG < 0)– Requires expert labeled judgments
[Carterette & Jones 2007]
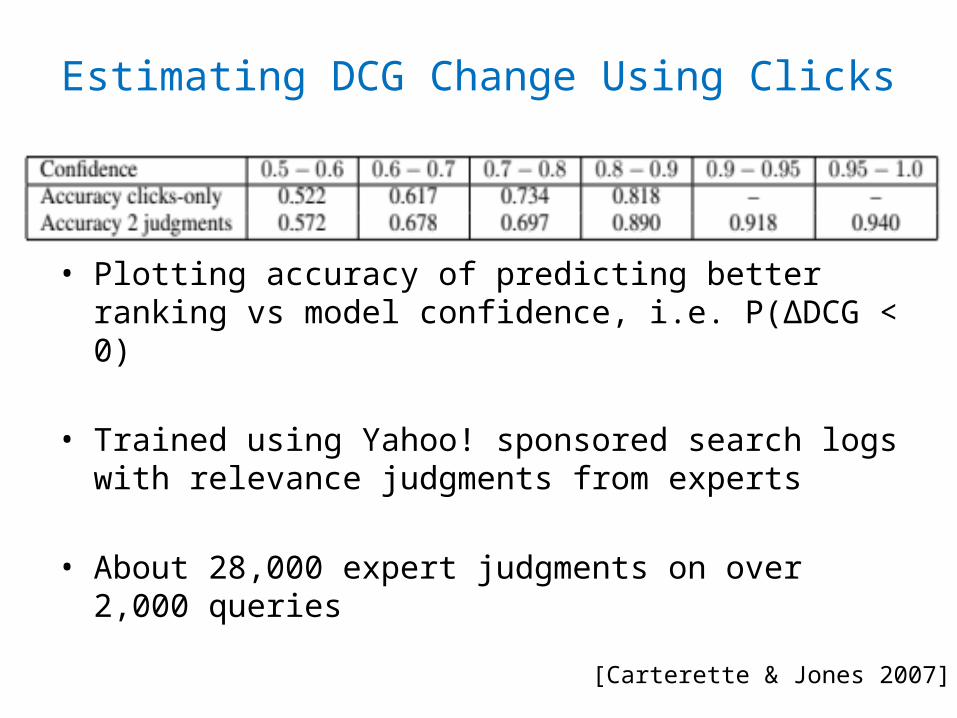
Estimating DCG Change Using Clicks
• Plotting accuracy of predicting better ranking vs model confidence, i.e. P(ΔDCG < 0)
• Trained using Yahoo! sponsored search logs with relevance judgments from experts
• About 28,000 expert judgments on over 2,000 queries
[Carterette & Jones 2007]

Absolute Document Judgments (Summary)
• Joint model of user behavior and relevance– E.g., how often a user examines results at rank 3
• Straightforward to infer relevance of documents– Need to convert document relevance to evaluation metric
• Requires additional assumptions – E.g., cascading user examination assumption
• Requires multiple impressions of doc/query pair– A special case of “Enhancing Web Search by Mining Search
and Browse Logs” tutorial this morning– Often impractical at small scales

Absolute Ranking-Level Judgments• Document-level feedback requires converting
judgments to evaluation metric (of a ranking)
• Ranking-level judgments directly define such a metric
Some Absolute MetricsAbandonment Rate Reformulation Rate
Queries per Session Clicks per Query
Click rate on first result Max Reciprocal Rank
Time to first click Time to last click
% of viewed documents skipped (pSkip)
[Radlinski et al. 2008; Wang et al. 2009]

Absolute Ranking-Level Judgments• Benefits
– Often much simpler than document click models– Directly measure ranking quality: Simpler task requires less
data, hopefully
• Downsides– Can’t really explain the outcome:
• Never get examples of inferred ranking quality• Different queries may naturally differ on metrics: counting on the
average being informative
– Evaluations over time need not necessarily be comparable. Need to ensure:
• Done over the same user population• Performed with the same query distribution• Performed with the same document distribution

Monotonicity Assumption• Consider two sets of results: A & B
– A is high quality– B is medium quality
• Which will get more clicks from users, A or B?– A has more good results: Users may be more likely to click when
presented results from A. – B has fewer good results: Users may need to click on more
results from ranking B to be satisfied.
• Need to test with real data– If either direction happens consistently, with a reasonable
amount of data, we can use this to evaluate online

Testing Monotonicity on ArXiv.org• This is an academic search engine, similar to ACM
digital library but mostly for physics.• Real users looking for real documents.• Relevance direction known by construction
ORIG > SWAP2 > SWAP4• ORIG: Hand-tuned ranking function• SWAP2: ORIG with 2 pairs swapped• SWAP4: ORIG with 4 pairs swapped
ORIG > FLAT > RAND• ORIG: Hand-tuned ranking function, over many fields• FLAT: No field weights• RAND : Top 10 of FLAT randomly reordered shuffled
•Evaluation on 3500 x 6 queries[Radlinski et al. 2008]
Do all pairwise tests: Each retrieval function used half the time.

Absolute MetricsName Description Hypothesized Change
as Quality FallsAbandonment Rate % of queries with no click Increase
Reformulation Rate % of queries that are followed by reformulation
Increase
Queries per Session Session = no interruption of more than 30 minutes
Increase
Clicks per Query Number of clicks Decrease
Clicks @ 1 Clicks on top results Decrease
pSkip [Wang et al ’09] Probability of skipping Increase
Max Reciprocal Rank* 1/rank for highest click Decrease
Mean Reciprocal Rank* Mean of 1/rank for all clicks Decrease
Time to First Click* Seconds before first click Increase
Time to Last Click* Seconds before final click Decrease
(*) only queries with at least one click count

Evaluation of Absolute Metrics on ArXiv.org
Abandonm Rate
Reform Rate
Queries p
er S
Number of C
Max
Recip Ran
k
Mean
Recip Ran
k
Time to
First
C
Time to
Last
C0
0.5
1
1.5
2
2.5ORIGFLATRANDORIG SWAP2SWAP4
[Radlinski et al. 2008]

Evaluation Metric Consistent (weak)
Inconsistent (weak)
Consistent (strong)
Inconsistent (strong)
Abandonment Rate 4 2 2 0
Clicks per Query 4 2 2 0
Clicks @ 1 4 2 4 0
pSkip 5 1 2 0
Max Reciprocal Rank 5 1 3 0
Mean Reciprocal Rank 5 1 2 0
Time to First Click 4 1 0 0
Time to Last Click 3 3 1 0
Evaluation of Absolute Metrics on ArXiv.org
• How well do statistics reflect the known quality order?
[Radlinski et al. 2008; Chapelle et al. under review]
Absolute Metric Summary
• None of the absolute metrics reliably reflect expected order.
• Most differences not significant with thousands of queries.
(These) absolute metrics not suitable for ArXiv-sized search engines with these retrieval quality differences.

Relative Comparisons• What if we ask the simpler question directly:
Which of two retrieval methods is better?
• Interpret clicks as preference judgments– between two (or more) alternatives
U(f1) > U(f2) pairedComparisonTest(f1, f2) > 0
• Can we control for variations in particular user/query?• Can we control for presentation bias?• Need to embed comparison in a ranking

Analogy to Sensory Testing• Suppose we conduct taste experiment: vs
– Want to maintain a natural usage context
• Experiment 1: absolute metrics– Each participant’s refrigerator randomly stocked
• Either Pepsi or Coke (anonymized)
– Measure how much participant drinks
• Issues:– Calibration (person’s thirst, other confounding variables…)– Higher variance

Analogy to Sensory Testing• Suppose we conduct taste experiment: vs
– Want to maintain natural usage context
• Experiment 2: relative metrics– Each participant’s refrigerator randomly stocked
• Some Pepsi (A) and some Coke (B)
– Measure how much participant drinks of each• (Assumes people drink rationally!)
• Issues solved:– Controls for each individual participant– Lower variance
A B

A Taste Test in Retrieval:Document Level Comparisons
ClickThis
Is probably better than that
[Joachims, 2002]

A Taste Test in Retrieval:Document Level Comparisons
• There are other alternatives– Click > Earlier Click– Last Click > Skip Above– …
• How accurate are they?
[Joachims et al, 2005]

A Taste Test in Retrieval:Document Level Comparisons
• We can only observe that lower > higher• So randomly reorder pairs of documents
Document 2
Document 1
Document 1
Document 2
Half the time, show: The other half, show:
Click ClickWhat happens more often?
[Radlinski & Joachims ‘07]

A Taste Test in Retrieval:Document Level Comparisons
• We can only observe that lower > higher• So randomly reorder pairs of documents
• Hybrid approach: Convert pairs to absolute[Agrawal et al ‘09]
Document 2
Document 1
Document 1
Document 2
Half the time, show: The other half, show:
Click ClickWhat happens more often?
[Radlinski & Joachims ‘07]

Document-Level Comparisons(Summary)
• Derive pairwise judgments between documents
• Often more reliable than absolute judgments– Also supported by experiments on collecting expert judgments
[Carterette et al. 2008]
• Benefits: reliable & easily reusable– Gives “correct” (in expectation) feedback– Easy to convert into training data for standard ML algorithms
• Limitations: still a biased sample– Distribution of feedback slanted towards top of rankings– Need to turn document-level feedback into evaluation metric

A Taste Test in Retrieval:Ranking Level Comparisons
• Not natural (even getting rid of the “vote” button) • If you’re an expert, maybe you can guess which is which
• What about getting a preference between rankings?
e.g. [Thomas & Hawking, 2008]

Paired Comparisons• How to create a natural (and blind) paired test?
– Side by side disrupts natural usage context– Need to embed comparison test inside a single ranking

Ranking A1. Napa Valley – The authority for lodging...
www.napavalley.com2. Napa Valley Wineries - Plan your wine...
www.napavalley.com/wineries3. Napa Valley College
www.napavalley.edu/homex.asp4. Been There | Tips | Napa Valley
www.ivebeenthere.co.uk/tips/166815. Napa Valley Wineries and Wine
www.napavintners.com6. Napa Country, California – Wikipedia
en.wikipedia.org/wiki/Napa_Valley
Ranking B1. Napa Country, California – Wikipedia
en.wikipedia.org/wiki/Napa_Valley2. Napa Valley – The authority for lodging...
www.napavalley.com3. Napa: The Story of an American Eden...
books.google.co.uk/books?isbn=...4. Napa Valley Hotels – Bed and Breakfast...
www.napalinks.com5. NapaValley.org
www.napavalley.org6. The Napa Valley Marathon
www.napavalleymarathon.org
Presented Ranking1. Napa Valley – The authority for lodging...
www.napavalley.com2. Napa Country, California – Wikipedia
en.wikipedia.org/wiki/Napa_Valley3. Napa: The Story of an American Eden...
books.google.co.uk/books?isbn=...4. Napa Valley Wineries – Plan your wine...
www.napavalley.com/wineries5. Napa Valley Hotels – Bed and Breakfast...
www.napalinks.com 6. Napa Valley College
www.napavalley.edu/homex.asp7 NapaValley.org
www.napavalley.org
AB
[Radlinski et al. 2008]
Team Draft Interleaving

Team Draft InterleavingRanking A
1. Napa Valley – The authority for lodging...www.napavalley.com
2. Napa Valley Wineries - Plan your wine...www.napavalley.com/wineries
3. Napa Valley Collegewww.napavalley.edu/homex.asp
4. Been There | Tips | Napa Valleywww.ivebeenthere.co.uk/tips/16681
5. Napa Valley Wineries and Winewww.napavintners.com
6. Napa Country, California – Wikipediaen.wikipedia.org/wiki/Napa_Valley
Ranking B1. Napa Country, California – Wikipedia
en.wikipedia.org/wiki/Napa_Valley2. Napa Valley – The authority for lodging...
www.napavalley.com3. Napa: The Story of an American Eden...
books.google.co.uk/books?isbn=...4. Napa Valley Hotels – Bed and Breakfast...
www.napalinks.com5. NapaValley.org
www.napavalley.org6. The Napa Valley Marathon
www.napavalleymarathon.org
Presented Ranking1. Napa Valley – The authority for lodging...
www.napavalley.com2. Napa Country, California – Wikipedia
en.wikipedia.org/wiki/Napa_Valley3. Napa: The Story of an American Eden...
books.google.co.uk/books?isbn=...4. Napa Valley Wineries – Plan your wine...
www.napavalley.com/wineries5. Napa Valley Hotels – Bed and Breakfast...
www.napalinks.com 6. Napa Balley College
www.napavalley.edu/homex.asp7 NapaValley.org
www.napavalley.org
Tie!
Click
Click
[Radlinski et al. 2008]

Scoring Interleaved Evaluations• Clicks credited to “owner” of result
– Ranking r1
– Ranking r2
– Shared
– A & B share top K results when they have identical results at each rank 1…K
– Ranking with more credits wins
A
C
D
B
A
E
F
BA
C
F
B
r1 r2

Simple Example
• Two users, Alice & Bob – Alice clicks a lot, – Bob clicks very little.
• Two retrieval functions, r1 & r2
– r1 > r2
• Two ways of evaluating:– Run r1 & r2 independently,
measure absolute metrics– Interleave r1 & r2, measure
pairwise preference

Simple Example
• Two users, Alice & Bob – Alice clicks a lot, – Bob clicks very little.
• Two retrieval functions, r1 & r2
– r1 > r2
• Two ways of evaluating:– Run r1 & r2 independently,
measure absolute metrics– Interleave r1 & r2, measure
pairwise preference
• Absolute metrics:
Higher chance of falselyconcluding that r2 > r1
• Interleaving:
User Ret Func #clicks
Alice r2 5
Bob r1 1
User #clicks on r1 #clicks on r2
Alice 4 1
Bob 1 0

Challenges (Calibration)• No longer need to calibrate clickthrough rate
– across users or across queries
• More sensitive– Fewer queries to achieve statistical significance
Will see empirical evaluations later.

Challenges (Presentation Bias)• Interleaved ranking preserves rank fairness
– Random clicker clicks on both rankings equally– Biased clicker clicks on both rankings equally
• More reliable– More consistently identifies better ranking
Will see empirical evaluations later.

Benefits & Drawbacks of Interleaving• Benefits
– A more direct way to elicit user preferences– A more direct way to perform retrieval evaluation– Deals with issues of position bias and calibration
• Drawbacks– Reusability: Can only elicit pairwise preferences for
specific pairs of ranking functions• Similar to some offline settings [Carterette & Smucker, 2007]
– Benchmark: No absolute number for benchmarking– Interpretation: Unable to interpret much at the
document-level, or about user behavior

Quantitative Analysis• Can we quantify how well Interleaving performs?
– Compared with Absolute Ranking-level Metrics– Compared with Offline Judgments
• How reliable is it? – Does Interleaving identify the better retrieval function?
• How sensitive is it?– How much data is required to achieve a target p-value?
[Radlinski et al. 2008; Chapelle et al. (under review)]

Experimental Setup• Selected 4-6 pairs of ranking functions to compare
– Known retrieval quality, by construction or by judged evaluation
• Collected click logs in two experimental conditions– Each ranking function by itself to measure absolute metrics– Interleaving of the two ranking functions
• Three search platforms used– arXiv.org– Yahoo!– Bing
[Radlinski et al. 2008; Chapelle et al. (under review)]

Comparison with Absolute Metrics (Online)
[Radlinski et al. 2008; Chapelle et al. (under review)]
p-va
lue
Query set size
•Experiments on arXiv.org•About 1000 queries per experiment•Interleaving is more sensitive and more reliable
Clicks@1 diverges inpreference estimate
Interleaving achievessignificance faster
ArXiv.org Pair 1 ArXiv.org Pair 2
Agre
emen
t Pro
babi
lity
Comparison with Absolute Metrics (Online)p-
valu
e
Query set size
[Radlinski et al. 2008; Chapelle et al. (under review)]
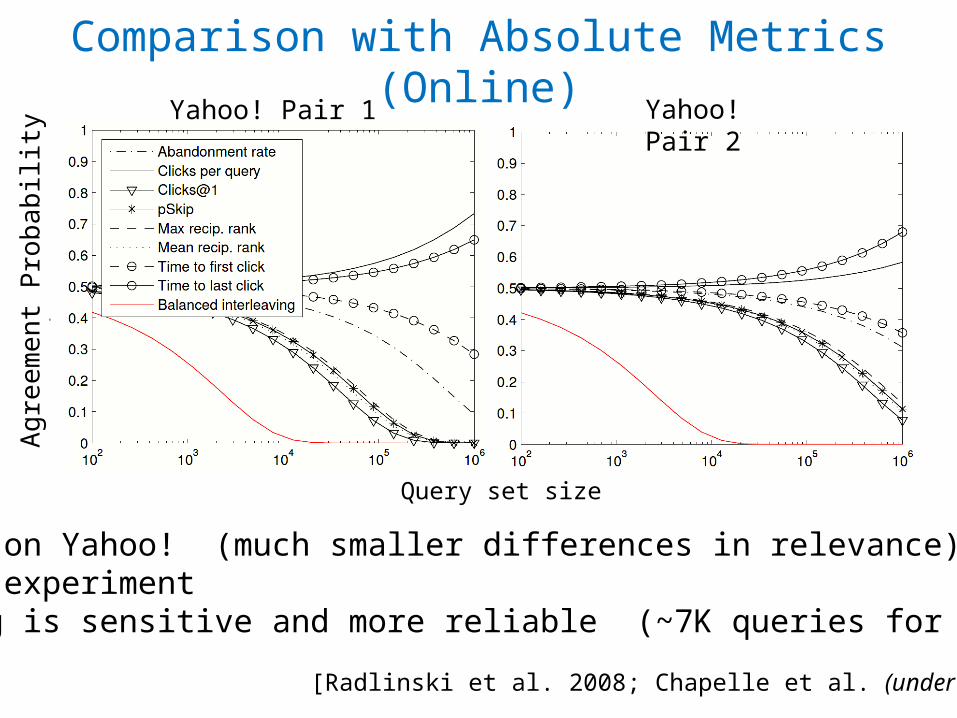
•Experiments on Yahoo! (much smaller differences in relevance)•Large scale experiment•Interleaving is sensitive and more reliable (~7K queries for significance)
Yahoo! Pair 1 Yahoo! Pair 2
Agre
emen
t Pro
babi
lity
Comparative Summary
Pair1 Pair2 Pair3 Pair4 Pair5 Pair60
0.1
0.2
0.3
0.4
0.5
0.6
0.7
0.8AbandonmentClicks / QueryClicks @ 1pSkipMax Recip. RankMean Recip. RankTime to First ClickTime to Last ClickInterleaving
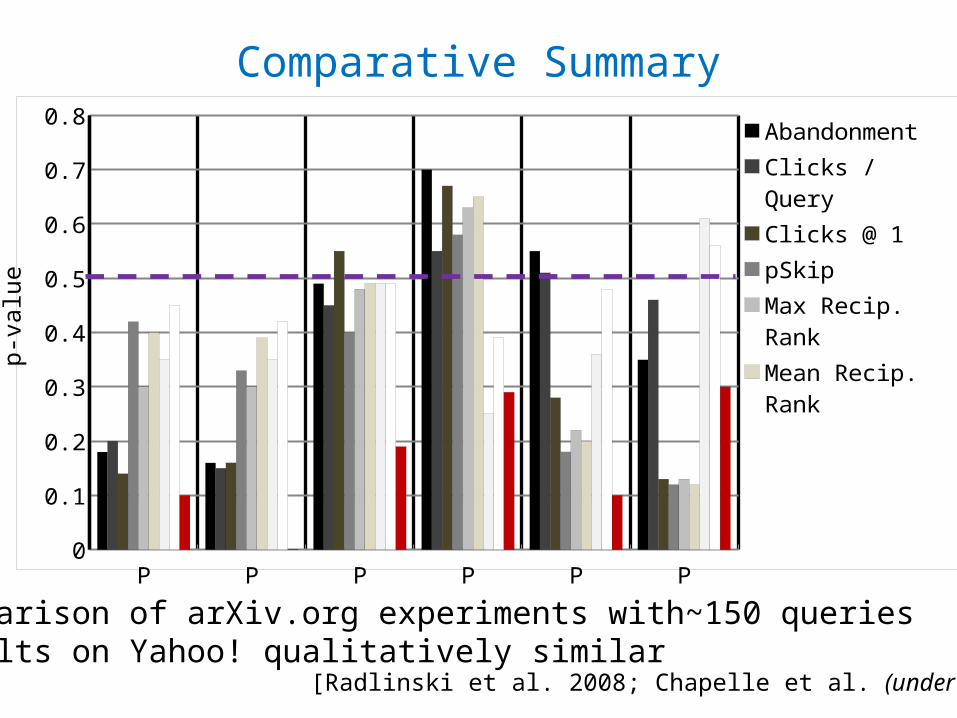
•Comparison of arXiv.org experiments with~150 queries•Results on Yahoo! qualitatively similar
p-va
lue
[Radlinski et al. 2008; Chapelle et al. (under review)]

Comparative Summary
Method Consistent (weak)
Inconsistent (weak)
Consistent (strong)
Inconsistent (strong)
Abandonment Rate 4 2 2 0
Clicks per Query 4 2 2 0
Clicks @ 1 4 2 4 0
pSkip 5 1 2 0
Max Reciprocal Rank 5 1 3 0
Mean Reciprocal Rank 5 1 2 0
Time to First Click 4 1 0 0
Time to Last Click 3 3 1 0
Interleaving 6 0 6 0
•Comparison of arXiv.org experiments•Results on Yahoo! qualitatively similar
[Radlinski et al. 2008; Chapelle et al. (under review)]

Interpretation ChoicesAbsolute Relative
Document LevelClick Rate,
Cascade Model,…
Click/Skip,FairPairs
Ranking LevelAbandonment,
Reciprocal Rank, Time to Click, PSkip,
…
Side by Side,Interleaving
Often more reliable & sensitive
Often more
reusable
Often what you actually
want
Best understood & most reusable

Returning to Interleaving• Quantitatively compared Interleaving to a
number of absolute online metrics– Interleaving appears more reliable– Interleaving appears more sensitive
• What about relative to offline (expert) judgments?– Does Interleaving agree with experts?– How many clicks need to be observed relative to
judged queries?
Calibration with Offline Judgments
[Radlinski & Craswell 2010; Chapelle et al. (under review)]
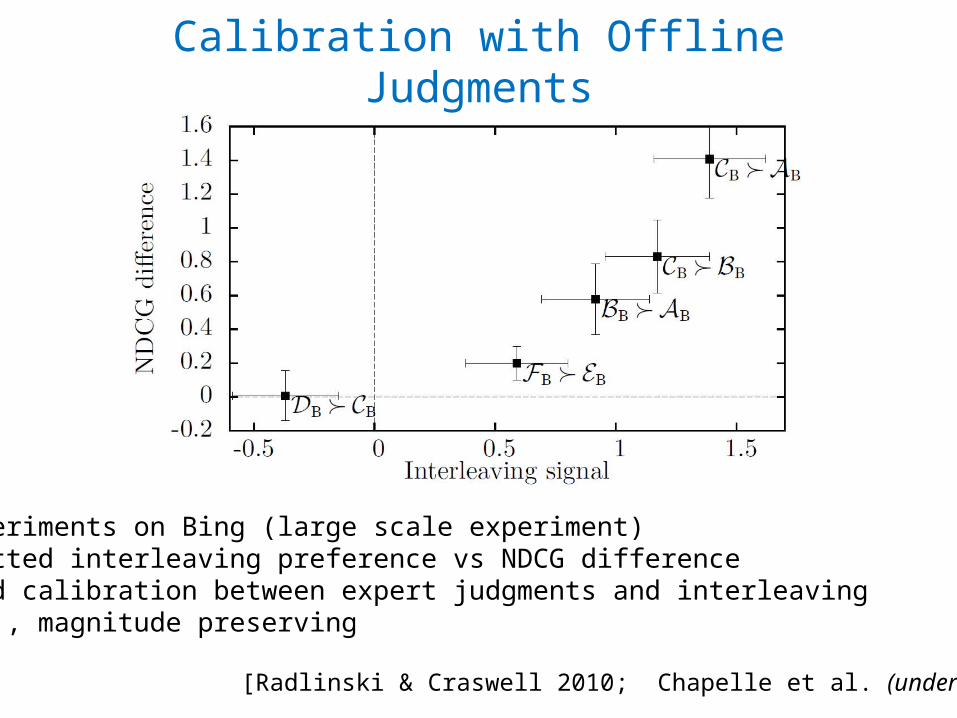
• Experiments on Bing (large scale experiment)• Plotted interleaving preference vs NDCG difference• Good calibration between expert judgments and interleaving• I.e., magnitude preserving

Comparison with Offline Judgments
[Radlinski & Craswell 2010; Chapelle et al. (under review)]
• Experiments on Bing (large-scale experiment)• Plotted queries required vs expert judgments required (for different p-values)• Linear relationship between queries and expert judgments required• One expert judgment is worth ~10 queries

Summary of Ranking-Level Quantitative Analysis
• Interleaving is reliable– Consistent & calibrated expert judgments
• Interleaving is sensitive– Requires fewer queries to achieve significance– For Bing: 1 judgment = ~10 queries
• Not easily reusable or interpretable– Each evaluation requires new online experiment
• Similar limitation to methods for efficient offline evaluation, e.g., [Carterette et al. 2006; Carterette & Smucker 2007]
– Hard to say more than Ranking A > Ranking B

More In-Depth Analysis• Other usage patterns reflect more than relevance
– Click entropy for personalization [Teevan et al. 2008]
– Revisitations to detect “bookmarking” and long-term interests [Adar et al. 2008]
– Spikes in queries and clicks [Kulkarni et al. 2011]
• This enables more detailed understanding of users– Can design specific changes to better service such specific types
of information needs– Typically requires larger scale usage data– Requires more careful experimental design
• Related tutorial: “Design of Large Scale Log Analysis Studies” by Dumais et al, at HCIC 2010

Summary of Part 1• Considered online versus offline evaluation
– Under which conditions is each better
• With online data– Compared absolute & relative interpretations– Compared document level & ranking level
interpretations
• Part 2 will show you how to collect data and apply these methods yourself

Practical Online Retrieval EvaluationPart 2
Filip Radlinski (Microsoft)Yisong Yue (CMU)

Outline• Part 1 : Overview of Online Evaluation
• Part 2: End-to-End, From Design to Analysis– Setting up a search service– Getting your own data– Running online experiments
(Break during Part 2)
• Part 3: Open Problems in Click Evaluation
• Part 4: Connection to Optimization & Learning

InformationSystemsYour
System!

A Recipe
0. Come up with a new retrieval algorithm
1. Create logging infrastructure2. Create reranking infrastructure3. Recruit some users4. Wait for data5. Analyze Results
6. Write a paper

User behavior we can record
• Queries & results– Context as well: Which computer & when
• Clicks on results– Metadata: What order, dwell time
• The same methods can be used to observe– Query reformulations – Browsing of result site
• With some more work– Mouse movements, text selection, tabs, etc …

Being the Search Engine• To get real data, we need real users
– Need to implement an IR system that people want to use …– … without having to break their normal routine– Then convince some people to actually do it
• Benefits– Real users & data!
• Challenges– Make the system usable (hint: start by using it yourself)– Effective data collection– Make it easy to run evaluation experiments– Important consideration: Privacy & Human Subjects

A spectrum of possible approaches
• Web proxy– Intercept, record & modify results before they get to the client
• Browser toolbar– Intercept and modify the page the browser gets
• Search engine on top of a public search API– Fetch results from a search API, build your own results page– Or fetch results page like a proxy, but serve it yourself
• Your own search engine– Many tools exist to get you most of the way there– Direct access to index, generate any rankings– Usually for a special collection: arXiv.org, CiteSeer, PubMed, …

A spectrum of possible approaches
MethodEasy to
get users
Easy on/off?
Easy to observe Robust Runs
on …Amount of work
Changes are easy
Proxy All web traffic server
Toolbar Everything client
Search API Our queries & clicks server
Write an engine Our queries
& clicks server
Can you get some volunteers to spend 5 minutes to be set up, then regularly use it
without thinking?
How easy is it for a user to remember that you’re logging
things? Can they just turn it off for a
minute?
What data can you (the researcher)
easily record?
How likely are you to need to actively keep
tweaking it?
Do you need to set up a special server?
Is this something you can do before lunch?
What happens when you find a bug just after setting up the
20th user?

Demo ApplicationSome easy to use academic research systems

Building a Proxy
• Intercepting traffic is easy– All you need are representative users– … who don’t mind sharing their traffic with you
• Four parts to a proxy:– Intercepting search engine requests– Logging queries & results– Logging clicks on results– Substituting in your own search engine results

Intercepting search engine requests• Write a proxy, e.g. in Perl. Its REALLY EASY!
• Set volunteers’ browsers to use this proxy
Dat
a Lo
ggin
g&
Exp
erim
enta
tion

Logging clicks
we want to log this request
Then log it
Get request metadata

Logging queries & results
we want to log this request
Get the metadata
Parse the results

Modifying results
Get the original results
Rerank them
Set up the evaluation
Replace the old results with your new set

Demo!

Other approaches• Browser toolbar
– All modern browsers support custom toolbars– They are relatively straightforward to write– Lemur toolkit [lemurproject.org] has open source toolbars to start with.
Another starting point is AlterEgo [Matthijs & Radlinski ’10]– GreaseMonkey is another way to do limited logging & rewriting
• Use a search API– Bing, Google, Yahoo! all offer search APIs– Many non-web-search engines (twitter, Facebook, etc) also offer APIs– You can treat a regular search page as an API of sorts, parsing the results– ViewSer [Lagun & Agichtein ‘11] is one example of a fetch-and-serve
implementation (also shows an example of how to do mouse position tracking)
• Build your own search engine– Easy to use libraries: Lucene (java), Lucene.Net (C#)– Easy to run-on engines: Indri, Lucene, Terrier, Zettair, and many more

Designing interleaving experiment
Get the original results
Rerank them
Replace the old results with your new set
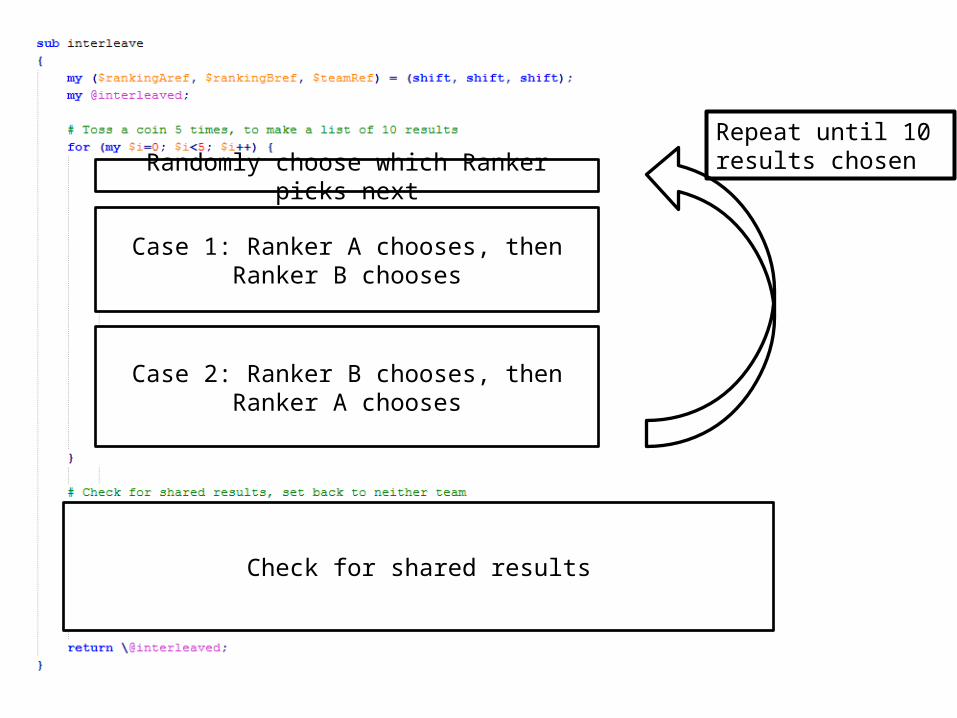
Randomly choose which Ranker picks next
Case 1: Ranker A chooses, then Ranker B chooses
Case 2: Ranker B chooses, then Ranker A chooses
Check for shared results
Repeat until 10 results chosen

Demo!
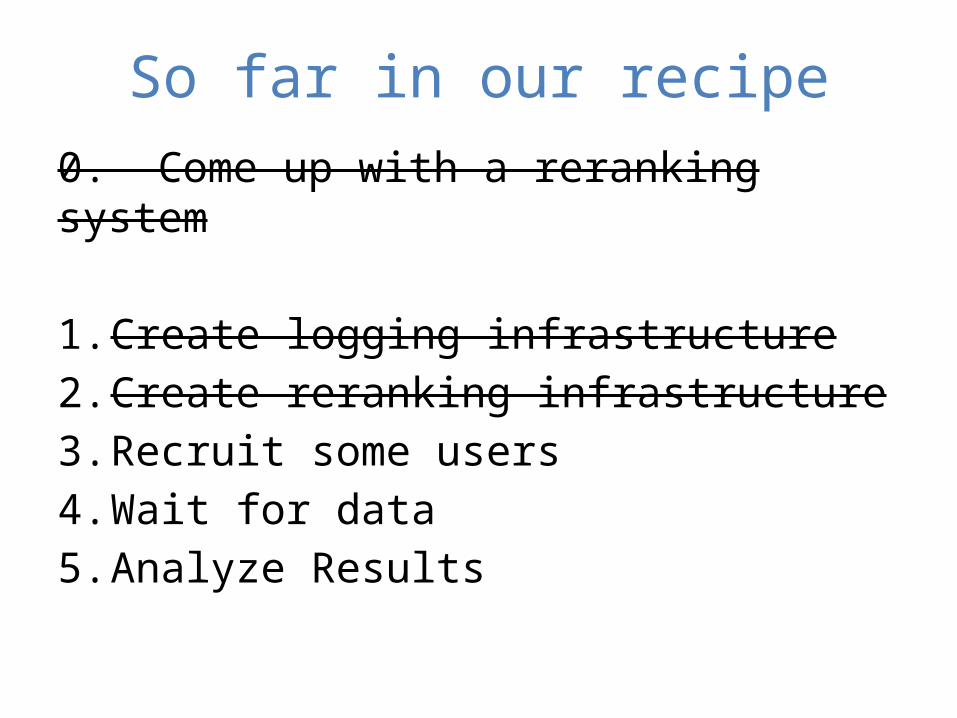
So far in our recipe0. Come up with a reranking system
1. Create logging infrastructure2. Create reranking infrastructure3. Recruit some users4. Wait for data5. Analyze Results

Recruiting Users
Questions to ask when recruiting1. Are you using the system yourself?
• If not, why not?
2. Will your users find the system usable?• A little worse than the default is ok• A little slower than the default is ok• A little less reliable than the default is ok
… but never by too much
3. Are you collecting private data?• Do you really need to?• What will you do with it?
4. Is your user base representative?

• Recall the three study setup alternatives
– Controlled task lab study– Controlled task, uncontrolled environment– General uncontrolled retrieval tasks
• The right setup depends on the research question
– Will users naturally enter a sufficient number of queries that you want to improve?
• For example, for long question queries
– Do you need additional metadata about users?• For example, for personalization
– Is there a natural place this system should be deployed?• For example, on a computer in your building lobby?
What to ask of your users

Analyzing the Results
• We have collected data of the form:<query> <results> <metadata>
and <clicks> <associated query>• We want to group those into
<query> <metadata> <clicks>• And evaluate how often each retrieval function wins
<query 1> <which ranking won><query 2> <which ranking won>…
• Finally, we can see if the retrieval functions are different, statistically significantly.

Significance Testing• The simplest test: Sign Test• Suppose:
– The baseline won interleaving on 120 queries– Your ranking won interleaving on 140 queries– Is your ranking significantly better? [here: no]
• Statistical tests: – Run a sign test in your favorite software– Use a Binomial confidence interval
p=�̂�± 𝑧𝛼√ �̂� (1− �̂�)𝑛

Significance Testing• We can also test the power (or consistency) of the
evaluation methodology– (Bootstrap Sampling)
• Given set of logged queries Q = {q1,…,qn} – Sample k queries Q’ from Q with replacement
• k ≤ n• A “bag”
– Compute whether r1 wins in Q’– Repeat m times
• Power (consistency) is fraction of bags that agree[Efron & Tibshirani 1993]

Significance Testing• Example: log 4 queries Q = { }q1 q2 q3 q4
[Efron & Tibshirani 1993]

Significance Testing• Example: log 4 queries Q = { }
• Generate m bootstrap samples– Sample w/ replacement– Record who wins each sample
q1 q2 q3 q4
[Efron & Tibshirani 1993]
q1 q1 q3 q4
q2 q4 q3 q2
q4 q1 q4 q2
q3 q1 q3 q3…

Significance Testing• Example: log 4 queries Q = { }
• Generate m bootstrap samples– Sample w/ replacement– Record who wins each sample
• E.g., r1 wins in 74% of samples– Suppose we know r1 > r2
– We’d make the wrong conclusion 26% of the time– More queries = higher confidence (more consistent)
[Efron & Tibshirani 1993]
q1 q2 q3 q4
q1 q1 q3 q4
q2 q4 q3 q2
q4 q1 q4 q2
q3 q1 q3 q3…

Significance Testing• Many other statistical tests exist
– Assumes a dataset sample from a population• Query logs with clicks
– Tests on a measured quantity• Each query has signed score indicating preference• Is the aggregate score noticeably different from 0?
– More sensitive binomial tests– t-Test
– Also see [Smucker et al., 2009] for another comparison of various statistical tests

Evaluation Demo

Summary of Part 2• Provided a recipe for evaluation
– Blind test, minimally disruptive of natural usage context– A number of implementation alternatives reviewed– Proxy implementation presented– Demonstration of logging, interleaving, and analysis
• Interleaving reference implementation– Combining document rankings– Credit assignment
• Overview of significance testing

Practical Online Retrieval EvaluationPart 3
Filip Radlinski (Microsoft)Yisong Yue (CMU)

Outline• Part 1 : Overview of Online Evaluation
• Part 2: End-to-End, From Design to Analysis
(Break during Part 2)
• Part 3: Open Problems in Click Evaluation– Alternative interleaving algorithms– Challenges in click interpretation– Other sources of presentation bias– Learning better click weighting
• Part 4: Connection to Optimization & Learning

Alternative Interleaving Algorithms• Goals of interleaving
– Paired test to maximize sensitivity– Fair comparison to maximize reliability
• There are multiple ways to interleave rankings– We saw Team-Draft Interleaving in Part 2.– Another way is Balanced Interleaving– Other methods exist, e.g., [He et al. 2009; Hofmann et al. 2011b]
• There are multiple ways to assign credit for clicks– We’ll see what the parameters are

Balanced InterleavingRanking A
1. Napa Valley – The authority for lodging...www.napavalley.com
2. Napa Valley Wineries - Plan your wine...www.napavalley.com/wineries
3. Napa Valley Collegewww.napavalley.edu/homex.asp
4. Been There | Tips | Napa Valleywww.ivebeenthere.co.uk/tips/16681
5. Napa Valley Wineries and Winewww.napavintners.com
6. Napa Country, California – Wikipediaen.wikipedia.org/wiki/Napa_Valley
Ranking B1. Napa Country, California – Wikipedia
en.wikipedia.org/wiki/Napa_Valley2. Napa Valley – The authority for lodging...
www.napavalley.com3. Napa: The Story of an American Eden...
books.google.co.uk/books?isbn=...4. Napa Valley Hotels – Bed and Breakfast...
www.napalinks.com5. NapaValley.org
www.napavalley.org6. The Napa Valley Marathon
www.napavalleymarathon.org
Presented Ranking1. Napa Valley – The authority for lodging...
www.napavalley.com2. Napa Country, California – Wikipedia
en.wikipedia.org/wiki/Napa_Valley3. Napa Valley Wineries – Plan your wine...
www.napavalley.com/wineries4. Napa Valley College
www.napavalley.edu/homex.asp5. Napa: The Story of an American Eden...
books.google.co.uk/books?isbn=...6. Been There | Tips | Napa Valley
www.ivebeenthere.co.uk/tips/166817. Napa Valley Hotels – Bed and Breakfast...
www.napalinks.com [Joachims ‘02]

Balanced InterleavingRanking A
1. Napa Valley – The authority for lodging...www.napavalley.com
2. Napa Valley Wineries - Plan your wine...www.napavalley.com/wineries
3. Napa Valley Collegewww.napavalley.edu/homex.asp
4. Been There | Tips | Napa Valleywww.ivebeenthere.co.uk/tips/16681
5. Napa Valley Wineries and Winewww.napavintners.com
6. Napa Country, California – Wikipediaen.wikipedia.org/wiki/Napa_Valley
Ranking B1. Napa Country, California – Wikipedia
en.wikipedia.org/wiki/Napa_Valley2. Napa Valley – The authority for lodging...
www.napavalley.com3. Napa: The Story of an American Eden...
books.google.co.uk/books?isbn=...4. Napa Valley Hotels – Bed and Breakfast...
www.napalinks.com5. NapaValley.org
www.napavalley.org6. The Napa Valley Marathon
www.napavalleymarathon.org
[
Presented Ranking1. Napa Valley – The authority for lodging...
www.napavalley.com2. Napa Country, California – Wikipedia
en.wikipedia.org/wiki/Napa_Valley3. Napa Valley Wineries – Plan your wine...
www.napavalley.com/wineries4. Napa Valley College
www.napavalley.edu/homex.asp5. Napa: The Story of an American Eden...
books.google.co.uk/books?isbn=...6. Been There | Tips | Napa Valley
www.ivebeenthere.co.uk/tips/166817. Napa Valley Hotels – Bed and Breakfast...
www.napalinks.com
Winner!
Click
Click
[Joachims ‘02]

Biases in Interleaving• Different interleaving approaches exhibit
different properties in various corner cases
• Would random clicking consistently prefer one ranking over another?
• Would rational clicking consistently prefer one ranking over another equally good one?

Random Clicking is subtleRanking A Ranking B
Balanced Interleaving
Click Ranking A wins
Click Ranking B wins
Click Ranking A wins
Random clicks A wins 2/3 of the time

Random Clicking is subtleRanking A Ranking B
Balanced Interleaving
Click Ranking A wins
Click Ranking B wins
Click Ranking A wins
Random clicks A wins 2/3 of the time, againThis affects Balanced, but not Team Draft interleaving

Rational Clicking is subtle
Team Draft Interleaving
49 %
49 %
2 %
One Query, Three Intents
A
A
B A
B
B
A
B
B A
B
A
Ranking A Ranking B
A gets 50% A gets 49% A gets 50% A gets 49%Ranking B is better?
A A A B B A B BCoin Tosses:
98% happy 51% happy

Biases in Interleaving• Both interleaving algorithms can be broken
– These are contrived edge cases– If each edge case prefers for each ranker equally
often, it doesn’t affect the outcome
• These cases seem to have low impact across many real experiments
• Open problem: Does there exist an interleaving algorithm not subject to such edge cases?

Clicks versus Relevance
• Presentation bias affects clicks– Interleaving addresses position bias– Are there other important biasing effects?
• Sometimes clicks ≠ relevance– Sometimes the answer is in the snippet– Otherwise, a click is the expectation of relevance
• Some snippets are misleading
– How do we define relevance?• What people click on, or what the query means?
• Result attractiveness also plays a role
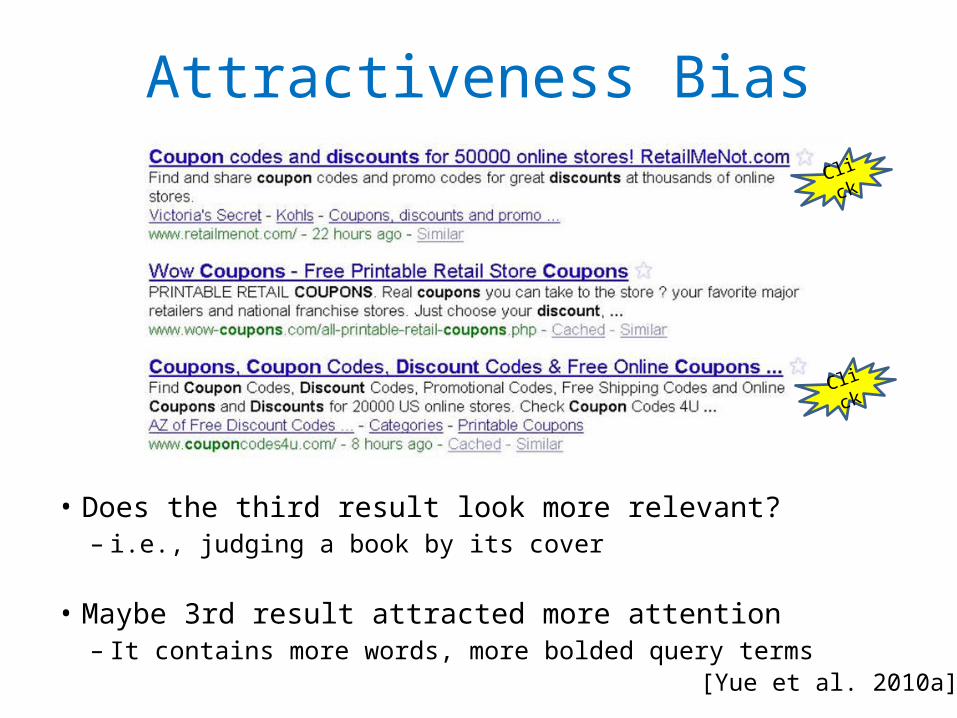
[Yue et al. 2010a]
Click
Click
Attractiveness Bias
• Does the third result look more relevant?– i.e., judging a book by its cover
• Maybe 3rd result attracted more attention– It contains more words, more bolded query terms

Recall: Document Level Comparisons
• Randomly reorder pairs of documents• Measure which is clicked more frequently
when shown at lower rank
Document 2
Document 1
Document 1
Document 2
Half the time, show: The other half, show:
Click ClickWhat happens more often?
[Radlinski & Joachims ‘07]

Bias due to Bolding in Title
• Click frequency on adjacent results (randomly swapped)• Click data collected from Google web search• Bars should be equal if not biased
Suggests a method to correct for attractiveness bias
[Yue et al. 2010a]
Rank Pair

Credit Assignment
• Not all clicks are created equal– Most click evaluation usually just counts clicks as binary
events– Clicks can be weighted based on order, time spent, position…
• Example: Interleaved query session with 2 clicks – One click at rank 1 (from ranking A)– Later click at rank 4 (from ranking B)– Normally would count this query session as a tie

Credit Assignment
• Clicks need not be weighted equally in Interleaving evaluation
• Take this Team Draft interleaving: (this click was very likely)
(yet the user clicked again)
• Is this a tie, or should Ranking B actually win here?– Rather than making something up, lets look at some data
A
B
A
B
Click
Click

Credit Assignment• A simple test:
– Suppose you saw many queries– How often does a small subsample
agree on the experiment outcome?– More sensitive assignment should
agree more often
[Radlinski & Craswell, 2010]
A
B
A
B
Click
ClickAmount of data Get the “right”
outcome sooner
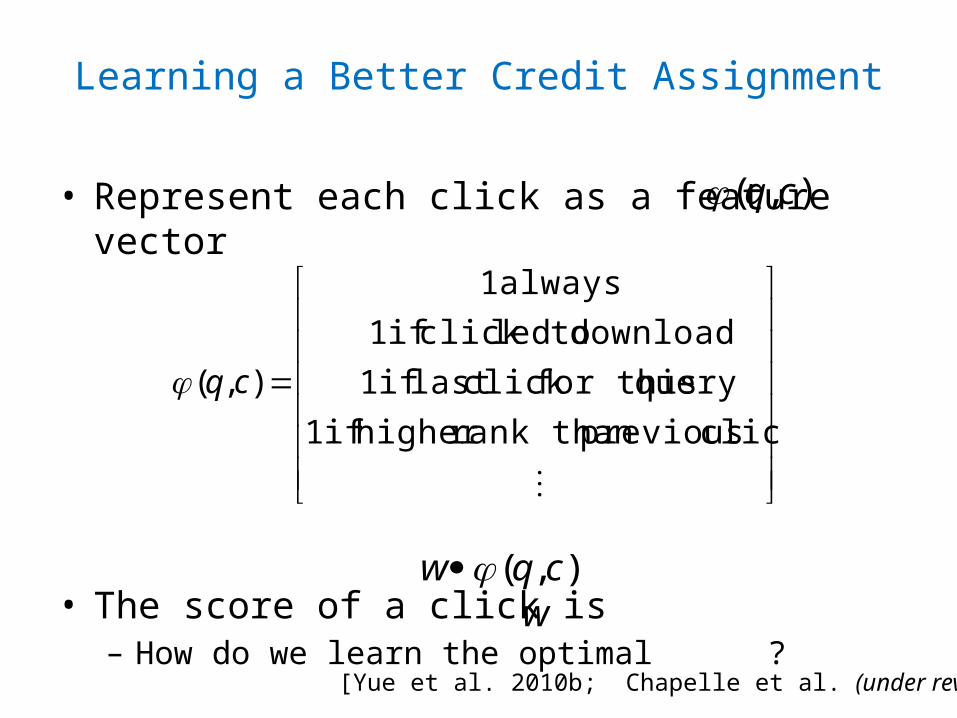
Learning a Better Credit Assignment
• Represent each click as a feature vector
• The score of a click is– How do we learn the optimal ?
click previousrank than higher if 1
query for thisclick last if 1
download toledclick if 1
always 1
),( cq
[Yue et al. 2010b; Chapelle et al. (under review)]
),( cq
),( cqw
w

Learning a Better Credit Assignment
• differentiates last clicks and other clicks
[Yue et al. 2010b; Chapelle et al. (under review)]
otherwise 0 click,last not is c if 1
otherwise 0 click,last is c if 1),( cq
),( cqw

Learning a Better Credit Assignment
• differentiates last clicks and other clicks
• Suppose we interleave A vs B• Lets suppose that:
– On average there are 3 clicks per session– The last click is on A 60% of the time– The other 2 clicks split 50/50 random
• Normal weighting corresponds to w = [1 1]• A weighting vector w = [1 0] has much lower variance
[Yue et al. 2010b; Chapelle et al. (under review)]
otherwise 0 click,last not is c if 1
otherwise 0 click,last is c if 1),( cq
),( cqw

Experimental Test
• Click data collected from ArXiv.org with two known rankers• Learned weights let you obtain the same significance level
with fewer queries• However, the calibration results from Part 2 no longer hold
Dat
a Re
quire
d
Target p-value
[Yue et al. 2010b; Chapelle et al. (under review)]
Uniform click weighting
Learning approaches

Other Click Evaluation Challenges• Clicks on different documents are only equally meaningful if
they get the same attention– E.g. documents with different length snippets– E.g. a mix of text, images and video
• Evaluating for diversity– Suppose the goal is to diversify search results– Some types of intents might be preferentially not clicked– Two differently diverse lists, if interleaved, may end up less diverse
• Beyond rankings– Evaluating results in a grid (e.g. images) – Evaluating faceted search rankings (e.g. shopping)
• Beyond evaluation: How to optimize the system?

Summary of Part 3• Subtleties/imperfections in interleaving
– Different interleaving methods exhibit different behavior– Interpretation can be improved by weighting clicks
• Part 1 focused on position bias– Should be aware of other sources of bias (e.g., title bias)
• Alternative click weighting was explored– Provide more sensitive evaluation for interleaving– But you lose the calibration results shown in Part 1 – Not limited to interleaving: Any online evaluation could do
something similar

Practical Online Retrieval EvaluationPart 4
Filip Radlinski (Microsoft)Yisong Yue (CMU)

Outline• Part 1 : Overview of Online Evaluation
• Part 2: End-to-End, From Design to Analysis
(Break during Part 2)
• Part 3: Open Problems in Click Evaluation
• Part 4: Connection to Optimization & Learning– Deriving training data from pairwise preferences– Document-level vs ranking-level feedback– Machine learning approaches that use pairwise prefs.

From Evaluation to Optimization
• Evaluation is only half the battle
• We want better information retrieval systems!
• Conclude with brief overview of machine learning approaches that leverage implicit feedback

OptimizationTwo general ways of optimizing
1. Start with collection of retrieval functions– Pick best one based on user feedback
2. Start with parameterized retrieval function– Pick best parameters based on user feedback

Optimization Criterion• We need to an optimization goal
• Our goal is simple: maximize an evaluation metric!
• Leverage techniques we’ve seen for deriving judgments from usage data – Convert into deriving training data for machine
learning algorithms

Absolute JudgmentsTrivial conversion to Cranfield style training
– Covered in Machine Learning for IR tutorial this morning
Agichtein et al. 2006bCarterette & Jones 2007 Chapelle & Zhang 2009Bennett et al. 2011
Presented Ranking1. Napa Valley – The authority for lodging...
www.napavalley.com2. Napa Country, California – Wikipedia
en.wikipedia.org/wiki/Napa_Valley3. Napa: The Story of an American Eden...
books.google.co.uk/books?isbn=...4. Napa Valley Wineries – Plan your wine...
www.napavalley.com/wineries5. Napa Valley Hotels – Bed and Breakfast...
www.napalinks.com 6. Napa Balley College
www.napavalley.edu/homex.asp7 NapaValley.org
www.napavalley.org
Click
ClickDerived judgmentsRel(D1) = 1Rel(D2) = 0Rel(D3) = 0…

Reliable Training Data
• We’ll mainly focus on pairwise online data– If pairwise evaluation is more sensitive, can we
derive training data using pairwise approaches?
• Two approaches:– Document-level feedback– Ranking-level feedback (interleaving two rankings)

Outline of Approaches
Document-level Judgments
Ranking-level Judgments
Select the Best Retrieval Function from a Collection
1 3
Optimize a Parameterized Retrieval Function
2 4

Presented Ranking1. Napa Valley – The authority for lodging...
www.napavalley.com2. Napa Country, California – Wikipedia
en.wikipedia.org/wiki/Napa_Valley3. Napa: The Story of an American Eden...
books.google.co.uk/books?isbn=...4. Napa Valley Wineries – Plan your wine...
www.napavalley.com/wineries5. Napa Valley Hotels – Bed and Breakfast...
www.napalinks.com 6. Napa Balley College
www.napavalley.edu/homex.asp7 NapaValley.org
www.napavalley.org
Document-level Training Data• Recall from Part 1:
– Users tend to look at results above clicked result– Users sometimes look at one below clicked result
• Derived judgments– D5 > D2– D5 > D3– D5 > D4– D1 > D2– D5 > D6 Click
Click
[Joachims et al. 2007]

Derived Judgments as Optimization Criterion
• Measure utility of ranking function r: – U(r) = # of pairwise judgments ranked correctly– Summed over all derived (q, d+, d-) tuples
• Derived judgments– D1 > D2– D5 > D2– D5 > D3– D5 > D4– D5 > D6

Derived Judgments as Optimization Criterion
• Measure utility of ranking function r: – U(r) = # of pairwise judgments ranked correctly– Summed over all derived (q, d+, d-) tuples
• Derived judgments– D1 > D2– D5 > D2– D5 > D3– D5 > D4– D5 > D6
U(r) = 1[ r(q,D1) > r(q,D2) ] + 1[ r(q,D5) > r(q,D2) ] + 1[ r(q,D5) > r(q,D3) ] + 1[ r(q,D5) > r(q,D4) ] + 1[ r(q,D5) > r(q,D6) ]
I.e., classification accuracy on pairwise judgments!Similar to pSkip objective [Wang et al. 2009]

Derived Judgments as Optimization Criterion
• Case 1. Collection of retrieval functions {r1,…,rk}– Choose ri with highest U(ri)
• Example:– Three retrieval functions r1, r2, r3
– U(r1) = 100
– U(r2) = 250
– U(r3) = 175
– Conclusion: r2 is best

Derived Judgments as Optimization Criterion
• Case 2. Parameterized retrieval function r(q,d;w)– Choose w with highest U(r)
– Often optimize w over a smooth approximation of U(r)• Recall U(r) is just classification accuracy on pairwise judgments
– Can use SVM, Logistic Regression, etc.• E.g., Joachims 2002; Freund et al. 2003; Radlinski & Joachims 2005; Burges
et al. 2005
• Example: logistic regression
),,(
),(),(1logmaxargddq
dqwdqw
w
TT
e

Document-level Judgments (Extensions)
• Relative preferences across query reformulations• Clicked doc more relevant than earlier unclicked doc
– “Query Chains”
• Requires mechanism for segment query sessions• Simple 30 minute timeout worked well on Cornell Library
[Radlinski & Joachims 2005]
A
B
C
D
E
F
Click
Click
B > AB > CD > AD > CD > E
q1 q2Derived document-level judgments:

Document-level Judgments (Extensions)
• Recall from Part 1: Most pairwise judgments go against current ranking– E.g., cannot derive judgment that higher ranked result is
better than lower ranked result
• Solution: swap 2 adjacent results w/ prob. 50%– E.g., interleave two results– “FairPairs”
– Only store judgment between paired results (e.g., D1 > D2)
[Radlinski & Joachims 2006; 2007; Craswell et al. 2008]
D1
D2
D3
Click D2
D1
D3
Click
50% 50%

Document-level Judgments (Summary)
• Derive pairwise judgments between documents
• Often more reliable than absolute judgments– Also supported by experiments on collecting expert judgments
[Carterette et al. 2008]
• Benefits: reliable & easily reusable– Often gives “correct” (in expectation) feedback– Easy to convert into training data for standard ML algorithms
• Limitations: still a biased sample– Distribution of feedback slanted towards top of rankings

Ranking-level Training Data• In Part 2, we evaluated pairs of retrieval functions by
interleaving rankings
• Use directly as derived judgments for optimization– Interleave r1 and r2
– Derive U(r1) > U(r2) or vice versa

Derived Judgments as Optimization Criterion
• Case 1. Collection of retrieval functions {r1,…,rk}– Choose ri that wins interleaving comparisons vs rest
• Example:– Three retrieval functions r1, r2, r3
– U(r1) > U(r2)
– U(r1) > U(r3)
– U(r2) > U(r3)
– r1 is best retrieval func.
Interleaving Winner (% clicks)r1 vs r2 r1 (60%)r1 vs r3 r1 (75%)
r2 vs r3 r2 (65%)
[Feige et al. 1997; Yue et al. 2009; 2011]
Only need r1 vs r2 and r1 vs r3!What is cost of comparing r2 vs r3?

Derived Judgments as Optimization Criterion
• Case 2. Parameterized retrieval function r(w)– Choose w with highest U(r(w)) – Interleaving reveals relative values of U(r(w)) vs U(r(w’))
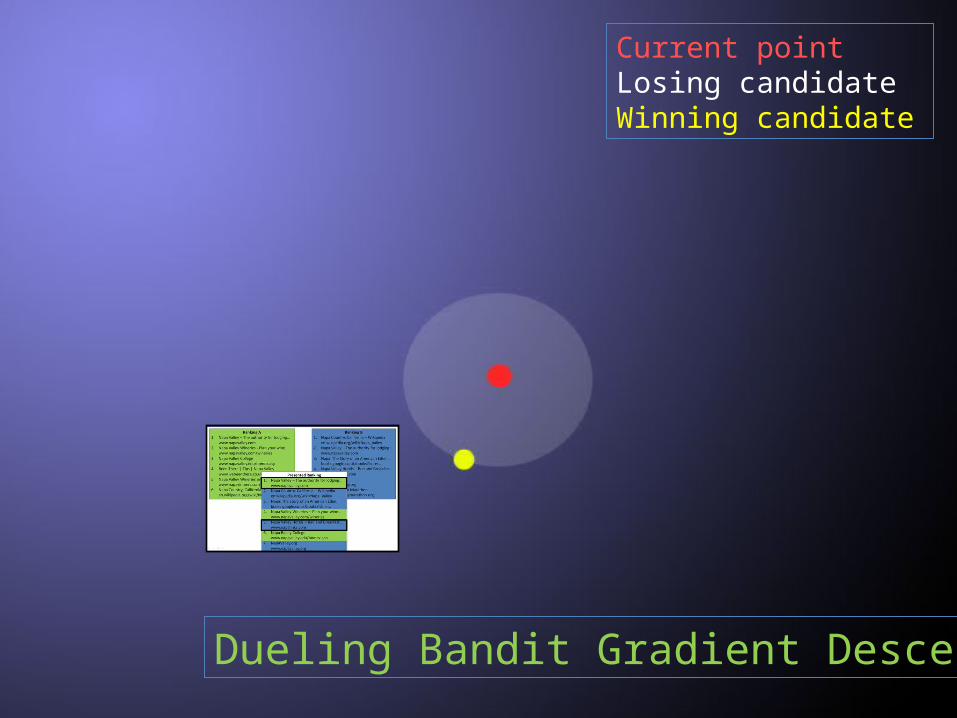
• Approach: gradient descent via interleaving– Make a perturbation w’ from w– Interleave r(w) vs r(w’)– If r(w’) wins, replace w = w’
[Yue & Joachims 2009; Hofmann et al. 2011a]

Current pointLosing candidateWinning candidate
Dueling Bandit Gradient Descent

Current pointLosing candidateWinning candidate
Dueling Bandit Gradient Descent

Current pointLosing candidateWinning candidate
Dueling Bandit Gradient Descent

Current pointLosing candidateWinning candidate
Dueling Bandit Gradient Descent
Current pointLosing candidateWinning candidate
Dueling Bandit Gradient Descent

Current pointLosing candidateWinning candidate
Dueling Bandit Gradient Descent

Current pointLosing candidateWinning candidate
Dueling Bandit Gradient Descent

Current pointLosing candidateWinning candidate
Dueling Bandit Gradient Descent

Ranking-level Judgments (Summary)
• Derive pairwise judgments between rankings– Directly measures relative quality between two rankings– I.e., U(r) > U(r’) ??– Fewer assumptions about the form of U(r)
• Benefits: reliable & unbiased feedback– Interleaving samples from the distribution of queries and users
• Drawbacks: not easily reusable– Evaluating each pair requires new interleaving experiment– Should model cost of running an interleaving experiment

Summary of Approaches
Document-level Judgments
Ranking-level Judgments
Select the Best Retrieval Function from a Collection
•Define utility based on pairs ranked correctly•Select retrieval function with highest utility
•Treat interleaving as comparison oracle•Similar to running a tournament
Optimize a Parameterized Retrieval Function
•Treat as classification •Judgments are training labels between pairs•Train w/ standard methods
•Treat interleaving as comparison oracle•Can be used to estimate a gradient in parameter space
*More popular

Other Approaches
• Usage data as features– E.g., clickthrough rate as feature of a result
– Use expert judgments as training data (Cranfield-style)– E.g., [Agichtein et al. 2006a; Chapelle & Zhang 2009; Wang et al. 2009]

Other Approaches
Other forms of usage data
• Browsing data– “The documents users browse to after issuing a query are
relevant documents for that query.”– Teevan et al. 2005; Liu et al. 2008; Bilenko & White 2008
• Mouse movements– “The search results that users mouse over often are
relevant documents for that query”– Guo et al. 2006a; 2006b; Huang et al. 2011

Summary of Part 4• Ultimate goal: Find the best retrieval system
– Evaluation is only half the battle
• ML approach to optimization
• Reviewed methods for deriving training data– Focused on pairwise/relative feedback

Tutorial Summary• Provided an overview of online evaluation
– Online metrics: What works when (especially if you’re an academic)– Interpreting user actions at the Document or Ranking level– Experiment Design: Opportunities, biases and challenges
• Showed how to get started obtaining your own online data– How to realistically “be the search engine”– End-to-End: Design, Implementation, Recruitment and Analysis– Overview of alternative approaches
• Presented interleaving for retrieval evaluation– Described one particular online evaluation approach in depth– How it works, why it works and what to watch out for– Provide a reference implementation– Describe a number of open challenges
• Quick overview of using your online data for learning

Questions?
Acknowledgments• We thank Thorsten Joachims, Nick Craswell, Matt Lease, Yi Zhang, and the
anonymous reviewers for providing valuable feedback.
• We thank Eugene Agichtein, Ben Carterette, Olivier Chapelle, Nick Craswell, and Thorsten Joachims for providing slide material.
• Yisong Yue was funded in part by ONR (PECASE) N000141010672.

Bibliography• 1 Interleaving Algorithms & Evaluation
– 1.1 Producing interleaved rankings• JOACHIMS, T. 2002. Optimizing Search Engines Using Clickthrough Data. In Proceedings of the ACM
International Conference on Knowledge Discovery and Data Mining (KDD).pp 132–142.• JOACHIMS, T. 2003. Evaluating Retrieval Performance using Clickthrough Data. In Text Mining, J. Franke,
G. Nakhaeizadeh, and I. Renz, Eds. Physica/Springer Verlag, 7996.• RADLINSKI, F., KURUP, M., AND JOACHIMS, T. 2008. How Does Clickthrough Data Reflect Retrieval
Quality. In Proceedings of the ACM Conference on Information and Knowledge Management (CIKM).• RADLINSKI, F., KURUP, M., AND JOACHIMS, T. 2010. Evaluating search engine relevance with click-based
metrics. In Preference Learning, J. Fuernkranz and E. Huellermeier, Eds. Springer, pp 337–362.• CHAPELLE, O., JOACHIMS, T., RADLINSKI, F., YUE, Y. (under review) Large Scale Validation and Analysis of
Interleaved Search Evaluation.– 1.2 Alternative scoring approaches & Statistical tests
• CHAPELLE, O., JOACHIMS, T., RADLINSKI, F., YUE, Y. (under review) Large Scale Validation and Analysis of Interleaved Search Evaluation.
• EFRON, B., TIBSHIRANI, R. 1993. An Introduction to the Bootstrap. Chapman & Hall, CRC Monographs on Statistics & Applied Probability.
• RADLINSKI, F. AND CRASWELL, N. 2010. Comparing the sensitivity of information retrieval metrics. In Proceedings of the ACM International Conference on Research and Development in Information Retrieval (SIGIR).pp 667–674.
• SMUCKER, M. AND ALLAN, J. AND CARTERETTE, B. 2009. Agreement Among Statistical Significance Tests for Information Retrieval Evaluation at Varying Sample Sizes. In Proceedings of the ACM International Conference on Research and Development in Information Retrieval (SIGIR).
• YUE, Y. AND GAO, Y. AND CHAPELLE, O., ZHANG, Y., AND JOACHIMS, T. 2010. Click-Based Retrieval Evaluation. In Proceedings of the ACM International Conference on Research and Development in Information Retrieval (SIGIR).

– 1.3 Examples of other work that uses interleaving to evaluate rankings• RADLINSKI, F. AND JOACHIMS, T. 2005. Query chains: Learning to rank from implicit feedback. In
Proceedings of the ACM International Conference on Knowledge Discovery and Data Mining (KDD).• MATTHIJS, N. AND RADLINSKI, F. 2011. Personalizing Web Search using Long Term Browsing History. In
Proceedings of the ACM International Conference on Web Search and Data Mining (WSDM).• HE, J. AND ZHAI, C. AND LI, X. 2009. Evaluation of methods for relative comparison of retrieval systems
based on clickthroughs. In Proceedings of the ACM Conference on Information and Knowledge Management (CIKM).
• HOFMANN, K. AND WHITESON, S. AND DE RIJKE, M. 2011. A Probabilistic Method for Inferring Preferences from Clicks. In Proceedings of the ACM Conference on Information and Knowledge Management (CIKM).
• 2 Clicks in General – 2.1 Click based evaluation
• AGICHTEIN, E., BRILL, E., DUMAIS, S., AND RAGNO, R. 2006. Learning user inter- action models for prediction web search results preferences. In Proceedings of the ACM International Conference on Research and Development in Information Retrieval (SIGIR).
• BENNETT, P., RADLINSKI, F., WHITE, R., YILMAZ, E. 2011. Inferring and Using Location Metadata to Personalize Web Search. In Proceedings of the ACM International Conference on Research and Development in Information Retrieval (SIGIR).
• CARTERETTE, B. AND JONES, R. 2007. Evaluating search engines by modeling the relationship between relevance and clicks. In Proceedings of the International Conference on Advances in Neural Information Processing Systems (NIPS).
• CHAPELLE, O., ZHANG, Y., METZLER, D., AND GRINSPAN, P. 2009. Expected Reciprocal Rank for Graded Relevance. In Proceedings of the ACM Conference on Information and Knowledge Management (CIKM).
• CHAPELLE, O. AND ZHANG, Y. 2009. A dynamic bayesian network click model for web search ranking. In Proceedings of the International Conference on the World Wide Web (WWW).pp 1–10.
• CRASWELL, N., ZOETER, O., TAYLOR, M., AND RAMSEY, B. 2008. An experimental comparison of click position-bias models. In Proceedings of the ACM International Conference on Web Search and Data Mining (WSDM).

• DUPRET, G., AND LIAO, C., 2010. A model to estimate intrinsic document relevance from the clickthrough logs of a web search engine. In Proceedings of the ACM International Conference on Web Search and Data Mining (WSDM).
• DUPRET, G., AND PIWOWARSKI, B. 2008. A User Browsing Model to Predict Search Engine Click Data from Past Observations. In Proceedings of the ACM International Conference on Research and Development in Information Retrieval (SIGIR).
• JOACHIMS, T., GRANKA, L., PAN, B., HEMBROOKE, H., RADLINSKI, F., AND GAY, G. 2007. Evaluating the accuracy of implicit feedback from clicks and query reformulations in web search. ACM Transactions on Information Science (TOIS) 25 (2). Article 7.
• JOACHIMS, T., GRANKA, L., PAN, B., HEMBROOKE, H., GAY, G. 2005. Accurately Interpreting Clickthrough Data as Implicit Feedback. In Proceedings of the ACM International Conference on Research and Development in Information Retrieval (SIGIR).
• RADLINSKI, F., BENNETT, P., AND YILMAZ, E. 2011. Detecting Duplicate Web Documents using Clickthrough Data. In Proceedings of the ACM International Conference on Web Search and Data Mining (WSDM).
• RADLINSKI, F., JOACHIMS, T. 2007. Active Exploration for Learning Rankings from Clickthrough Data. In Proceedings of the ACM International Conference on Knowledge Discovery and Data Mining (KDD).
• THOMAS, P., HAWKING, D. 2008. Experiences evaluating personal metasearch. In Proceedings of the Information Interaction in Context Conference (IIiX).
• WANG, K., WALKER, T., AND ZHENG, Z. 2009. PSkip: estimating relevance ranking quality from web search clickthrough data. In Proceedings of the ACM International Conference on Knowledge Discovery and Data Mining (KDD).pp 1355–1364.
• YUE, Y., PATEL, R., AND ROEHRIG, H. 2010a. Beyond Position Bias: Examining Result Attractiveness as a Source of Presentation Bias in Clickthrough Data. In Proceedings of the International Conference on the World Wide Web (WWW).
• ZHANG, W., JONES, R. 2007. Comparing Click Logs and Editorial Labels for Training Query Rewriting. In Proceedings of the International Conference on the World Wide Web (WWW).
• ZHONG, F., WANG, D., WANG, G., WEIZHU, C., ZHANG, Y., CHEN, Z., WANG, H. 2010. Incorporating Post-Click Behaviors into a Click Model. In Proceedings of the ACM International Conference on Research and Development in Information Retrieval (SIGIR).

– 2.2 Limitations of clicks• YUE, Y., PATEL, R., AND ROEHRIG, H. 2010a. Beyond Position Bias: Examining Result Attractiveness as a
Source of Presentation Bias in Clickthrough Data. In Proceedings of the International Conference on the World Wide Web (WWW).
• LI, J., HUFFMAN, S., TOKUDA, A. 2009. Good Abandonment in Mobile and PC Internet Search. In Proceedings of the ACM International Conference on Research and Development in Information Retrieval (SIGIR).
– 2.3 Clicks as features• AGICHTEIN, E., BRILL, E., DUMAIS, S., AND RAGNO, R. 2006a. Learning user interaction models for
prediction web search results preferences. In Proceedings of the ACM International Conference on Research and Development in Information Retrieval (SIGIR).
• AGICHTEIN, E., BRILL, E., AND DUMAIS, S. 2006b. Improving Web Search Ranking by Incorporating User Behavior Information. In Proceedings of the ACM International Conference on Research and Development in Information Retrieval (SIGIR).
• CHAPELLE, O. AND ZHANG, Y. 2009. A dynamic bayesian network click model for web search ranking. In Proceedings of the International Conference on the World Wide Web (WWW).pp 1–10.
• GAO, J., YUAN, W., LI, X., DENG, K., AND NIE, J. 2009. Smoothing clickthrough data for web search ranking. In Proceedings of the ACM International Conference on Research and Development in Information Retrieval (SIGIR).
• JI, S., ZHOU, K., LIAO, C., ZHENG, Z., XUE, G., CHAPELLE, O., SUN, G., AND ZHA, H. 2009. Global Ranking by Exploiting User Clicks. In Proceedings of the ACM International Conference on Research and Development in Information Retrieval (SIGIR).
• TEEVAN, J., DUMAIS, S., LIEBLING, D. 2008. To Personalize or Not to Personalize: Modeling Queries with Variation in User Intent. In Proceedings of the ACM International Conference on Research and Development in Information Retrieval (SIGIR).
• WANG, K., WALKER, T., AND ZHENG, Z. 2009. PSkip: estimating relevance rank- ing quality from web search clickthrough data. In Proceedings of the ACM International Conference on Knowledge Discovery and Data Mining (KDD).pp 1355–1364.

– 2.4 Learning from Clicks• AGRAWAL, R., HALVERSON, A., KENTHAPADI, K., MISHRA, N., AND TSAPARAS, P. 2009. Generating labels
from clicks. In Proceedings of the ACM International Conference on Web Search and Data Mining (WSDM).pp 172–181.
• BOYAN, J., FREITAG, D., AND JOACHIMS, T. 1996. A Machine Learning Architecture for Optimizing Web Search Engines. Proceedings of the AAAI Workshop on Internet Based Information Systems.
• EL-ARINI, K., VEDA, G., SHAHAF, D., GUESTRIN, C. 2009. Turning down the noise in the blogosphere. In Proceedings of the ACM International Conference on Knowledge Discovery and Data Mining (KDD).
• FEIGE, U., RAGHAVAN, P., PELEG, D., UPFAL. E. 1994. Computing with Noisy Information. SIAM Journal on Computing 23(5):1001-1018.
• HOFMANN, K. AND WHITESON, S. AND DE RIJKE, M. 2011. Balancing Exploration and Exploitation in Learning to Rank Online. In Proceedings of the European Conference on Information Retrieval (ECIR).
• JOACHIMS, T. 2002. Optimizing Search Engines Using Clickthrough Data. In Proceedings of the ACM International Conference on Knowledge Discovery and Data Mining (KDD).pp 132–142.
• LI, L., CHU, W., LANGFORD, J., SCHAPIRE, R. 2010. A contextual-bandit approach to personalized news article recommendation. In Proceedings of the International Conference on the World Wide Web (WWW).
• RADLINSKI, F. AND JOACHIMS, T. 2005. Query chains: Learning to rank from implicit feedback. In Proceedings of the ACM International Conference on Knowledge Discovery and Data Mining (KDD).
• RADLINSKI, F., JOACHIMS, J. 2007. Active Exploration for Learning Rankings from Clickthrough Data. In Proceedings of the ACM International Conference on Knowledge Discovery and Data Mining (KDD).
• RADLINSKI, F., KLEINBERG, R., AND JOACHIMS, T. 2008. Learning Diverse Rankings with Multi-Armed Bandits. In Proceedings of the International Conference on Machine Learning (ICML).
• SLIVKINS, A., RADLINSKI, F., GOLLAPUDI, S. 2010. Learning optimally diverse rankings over large document collections. In Proceedings of the International Conference on Machine Learning (ICML).
• YUE, Y., JOACHIMS, T. 2009. Interactively Optimizing Information Retrieval Systems as a Dueling Bandits Problem. In Proceedings of the International Conference on Machine Learning (ICML).
• YUE, Y., BRODER, J., KLEINBERG, R., JOACHIMS, T.. 2009. The K-Armed Dueling Bandits Problem. In Proceedings of the International Conference on Learning Theory (COLT).
• YUE, Y., JOACHIMS, T. 2011. Beat the Mean Bandit. In Proceedings of the International Conference on Machine Learning (ICML).

• 3 Online Usage Data Beyond Search Clicks – 3.1 Non-click based metrics
• BUSCHER, G., DENGEL, A., AND VAN ELST, L. 2008. Eye movements as implicit relevance feedback. In Proceedings of the ACM Conference on Human Factors in Computing Systems (CHI).pp 2991–2996.
• GRANKA, L., JOACHIMS, T. AND GAY, G. 2004. Eye-Tracking Analysis of User Behavior in WWW-Search, Poster Abstract, In Proceedings of the ACM International Conference on Research and Development in Information Retrieval (SIGIR).
• HUANG, J., WHITE, R., DUMAIS, S. 2011. No Clicks, No Problem: Using Cursor Movements to Understand and Improve Search. In Proceedings of the ACM Conference on Human Factors in Computing Systems (CHI).
• KELLY, D. AND TEEVAN, J. 2003. Implicit feedback for inferring user preference: A bibliography. ACM SIGIR Forum 37, 2, pp 18–28.
• GUO, Q., AGICHTEIN, E., 2010. Ready to Buy or Just Browsing? Detecting Web Searcher Goals from Interaction Data. In Proceedings of the ACM International Conference on Research and Development in Information Retrieval (SIGIR).
• GUO, Q., AGICHTEIN, E., 2010. Towards Predicting Web Searcher Gaze Position from Mouse Movements. In Proceedings of the ACM Conference on Human Factors in Computing Systems (CHI).

– 3.2 Clicks outside of search• BILENKO, M., WHITE, R., RICHARDSON, M., AND Murray, C. 2008. Talking the talk vs. walking the walk:
salience of information needs in querying vs. browsing. In Proceedings of the ACM International Conference on Research and Development in Information Retrieval (SIGIR).
• BILENKO, M., WHITE, R. 2008. Mining the Search Trails of Surfing Crowds: Identifying Relevant Websites From User Activity. In Proceedings of the ACM International Conference on Research and Development in Information Retrieval (SIGIR).
• LIU, Y., GAO, B., LIU, T., ZHANG, Y., Ma, Z., HE, S., AND LI, H. 2008. BrowseRank: letting web users vote for page importance. In Proceedings of the ACM International Conference on Research and Development in Information Retrieval (SIGIR).
• MATTHIJS, N. AND RADLINSKI, F. 2011. Personalizing Web Search using Long Term Browsing History. In Proceedings of the ACM International Conference on Web Search and Data Mining (WSDM).
• TEEVAN, J., DUMAIS, S., HORVITZ, E., 1995. Personalizing Search via Automated Analysis of Interests and Activities. In Proceedings of the ACM International Conference on Research and Development in Information Retrieval (SIGIR).

• 4 Learning from Pairwise Feedback• BURGES, C., SHAKED, T., RENSHAW, E., LAZIER, A., DEEDS, M., HAMILTON, N., HULLENDER, G. 2005.
Learning to Rank using Gradient Descent. In Proceedings of the International Conference on Machine Learning (ICML).
• FREUND, Y., IYER, R., SCHAPIRE, R., SINGER, Y. 2003. An Efficient Boosting Algorithm for Combining Preferences. Journal of Machine Learning Research (JMLR), Vol 4, pp 933–969
• HOFMANN, K. AND WHITESON, S. AND DE RIJKE, M. 2011. Balancing Exploration and Exploitation in Learning to Rank Online. In Proceedings of the European Conference on Information Retrieval (ECIR).
• JOACHIMS, T. 2005. A Support Vector Method for Multivariate Performance Measures. In Proceedings of the International Conference on Machine Learning (ICML).
• RADLINSKI, F., JOACHIMS, J. 2007. Active Exploration for Learning Rankings from Clickthrough Data. In Proceedings of the ACM International Conference on Knowledge
• Discovery and Data Mining (KDD).
• 5 Efficient Offline Evaluation• CARTERETTE, B., ALLAN, J., SITARAMA, R. 2006. Minimal Test Collections for Retrieval Evaluation. In
Proceedings of the ACM International Conference on Research and Development in Information Retrieval (SIGIR)
• CARTERETTE, B., BENNETT, P. N., CHICKERING, D. M., AND DUMAIS, S. T. 2008. Here or there: Preference judgments for relevance. In Proceedings of the European Conference on Information Retrieval (ECIR).
• CARTERETTE, B., SMUCKER, M. 2007. Hypothesis Testing with Incomplete Relevance Judgments. In Proceedings of the ACM Conference on Information and Knowledge Management (CIKM).