practical definition of criticality regarding road
TRANSCRIPT
PRACTICAL DEFINITION OF CRITICALITY REGARDING ROAD INFRASTRUCTURE
Consultant: Eng. MSc. Claudio Garuti Anderlini | 2020

GIDRM | 2020 | 2
Content General Introduction .................................................................................. 3
Background Information ........................................................................................................ 4
Criticality Model ......................................................................................... 5
Goal ........................................................................................................................................ 5
Identification of Assumptions ................................................................................................ 6
Hierarchical Structure ............................................................................................................ 6
Criticality Model of Existing Projects .................................................................................. 9
Criticality Model of New Projects..................................................................................... 10
Prioritized Criticality Model ...................................................................... 11
Prioritization Process ........................................................................................................... 11
Measurement ruler .............................................................................................................. 12
Criticality Model of Existing Projects ................................................................................ 12
Criticality Model of New Projects..................................................................................... 13
Criticality Thresholds ............................................................................................................ 14
Introduction to Criticality Thresholds .............................................................................. 14
General Process to Determine Thresholds ...................................................................... 14
Criticality Model and Thresholds for New and Existing Projects ..................................... 14
Calibration ................................................................................................ 15
Assessment Tool................................................................................................................... 15
Exemplary Project Assessment ............................................................................................ 15
Conclusions and Recommendations ......................................................... 16
Annex ....................................................................................................... 17
Indicators of Physical Criticality ....................................................................................... 17
Indicators of Functional Criticality ................................................................................... 18
Indicators of Social Criticality ........................................................................................... 20
GIDRM | 2020 | 3
General Introduction The Global Initiative on Disaster Risk Management, a project implemented by the German De-velopment Cooperation (GIZ) and commissioned by the German Federal Ministry for Economic Cooperation and Development (BMZ), is supporting international and national, governmental and non-governmental selected stakeholders in their efforts to achieve coherence in terms of planning, implementing and reporting disaster risk management (DRM) in line with the Sendai Framework for Disaster Risk Management, the Paris Agreement and other international agen-das, such as the 2030 Agenda and Habitat III.
The assignment has been commissioned by the GIDRM to assist countries in Latin American and the Caribbean in organizing their infrastructure in terms of disaster risks. The assignment is fo-cusing on the road infrastructure of Mexico. In the framework of the technical assistance sup-plied by the German Cooperation Agency (GIZ) to the Investment Unit of the Secretariat for Finance and Public Credit (SHCP) and the Sub-secretariat of Infrastructure of the Secretariat for Communication and Transport (SCT), the Global Initiative on Disaster Risk Management (GIDRM) has defined the need for a multicriteria tool to prioritize public investment projects on highway infrastructure in Mexico according to the degree of criticality.
In 2018, the process to develop criteria to determine the criticality of public investment projects for network infrastructure was initiated using highway and road networks in Mexico, Costa Rica and Chile as an example. A workshop was held to establish criteria to define the criticality of public investment projects for highways in Mexico with a hierarchical structure of three strategic criteria: Physical Criticality, Functional Criticality and Social Criticality.
In consultation with the SCT and the SHCP it was determined that, due to the change of govern-ment administration in Mexico and its focus on austerity, it was necessary to rethink the tool not only for projects on new federal and connection highways, but also for periodical preserva-tion programs and reconstruction of existing highways, which slightly modified the study’s ori-entation. The criteria of the model, their relations and definitions were updated accordingly while maintaining the strategic criticality pillars. Descriptive assessment scales were created to establish the sources and entities responsible for obtaining information.
A second workshop, held in Mexico City on November 6-8th, 2019 aimed at reviewing and vali-dating the criteria, their proposed definitions and scales and reaching a consensus on a mul-ticriteria model that covers the priorities of the components agreed upon, including cardinal scales to assess highways and prioritize them in terms of their criticality within the country’s road network. A key activity would be the practical assessment of some chosen project.
This document is structured as follows: The process used to construct the assessment and prioritization tool is explained. The final criticality model is presented in its different compo-nents (goal, criteria, sub-criteria and indicators). The process to obtain the weights of the criteria and global measurement ruler is introduced. Cardinal scales are introduced to allow for the as-sessment of projects and the project’s classification thresholds according to the associated crit-icality level. The project assessment tool is presented and some example projects are assessed to calibrate the measurement ruler and the developed scales. Some considerations are given on how to use the tool. Lastly, the main conclusions drawn during the workshop and subsequent analysis are shared as well as some recommendations.

GIDRM | 2020 | 4
Background Information GIZ promotes the achievement of a common model for Latin America to assess disaster risk in critical road infrastructure. This would allow for exchange of experience between different coun-tries thereby using synergies and increasing the effectiveness of the tools through mutual learn-ing. Fostering DRM in Latin America and the Caribbean in terms of critical infrastructure is shown in Figure 1.
Figure 1: The GIDRM and the Critical Infrastructure in Latina America and the Caribbean
To that end, the definition and classification of critical infrastructure and how it is related to the concept of disaster risk management has to be clear: A strategy linking these two concepts (dis-aster risk and criticality) with a joint action structure while including all authorities involved in public-investment decision-making has to be developed. The following logical decision structure can be applied to any country where the concept of criticality and effectivity in assigning re-sources is relevant (see figure 2):
Figure 2: Solution strategy – Diagram linking criticality to disaster risk

GIDRM | 2020 | 5
The strategy comprises three steps:
1. First, it is determined which road infrastructures are critical nationally. This is based on multiple criteria including absolute proportional metrics, a reliable measurement ruler and associated criticality thresholds (acceptable criticality maximum). These are then integrated in the multicriteria analysis models, particularly in the AHP/ANP (Analytic Hierarchy Pro-cess/Analytic Network Process).
2. Second, once the critical highways have been defined (i.e. critical road infrastructure), the next phase of the solution strategy (c.f. figure 2) assesses the level or degree of disaster risk each infrastructure is subject to in terms of existing and emerging threats, degree of expo-sure, vulnerability and response capacities.
3. Third, for those infrastructures defined as both critical and bearing high risk (higher than the previously calculated acceptable risk threshold), the resilience of the infrastructure needs to be strengthened. By improving its capacity (e.g. in regard to robustness, speed and/or redundancy) in the design/construction/built stage, risks can be mitigated. By clos-ing the gap between the acceptable risk threshold and the calculated risk value (project risk is lower than the acceptable risk threshold), critical infrastructure resilience is improved.
This solution strategy allows for prioritization of those highways that require more or faster at-tention in distributing resources. Thereby, planned investments to place a project and its risks below the acceptable risk threshold are used without falling below or exceeding the budget scheduled. The three central points of the strategy are:
− A clear and transversal definition of the concept of criticality in road infrastructure.
− An assessment model representing the criticality and generalized and transversal charac-teristics to be applied in different countries.
− Criticality metrics (measurement ruler) agreed upon between the different institutions rel-evant to the road infrastructure problem and distribution of national resources.
Criticality Model
Goal The overall goal is to prioritize (measure) the routes according to their degree of criticality for the road network. Critical routes are understood to be those whose failure would significantly affect the network’s connectivity. Therefore, the purpose of identifying critical highways is to assure nationwide connectivity.
Additionally, the following considerations were suggested during the workshop:
− Agreement not to include references to the disaster risk management contexts, which con-stitutes a second phase once the highway criticality has been classified (see strategy). The goal is embedded in infrastructure planning with Finance, that administrates the Public-Investment System.
− No other risks are included (for example, financial or legal risks) which are considered in the project’s full analysis.

GIDRM | 2020 | 6
Identification of Assumptions The following assumptions related to the model were analyzed and confirmed as valid, with the indicated annotations.
− The effective regulation on route classification and characteristics is applied.
− Highways are not assessed as a whole, but by sections. The section definition is a key aspect of the process and the section on Assessment Tools gives general insights in that regard. It is important for this measurement unit to be known at a level on which the different entities (SCT, SH and other divisions that supply information for the assessment) have the necessary information at their disposal.
Hierarchical Structure This risk model’s hierarchical structure has three basic branches or strategical criteria and asso-ciated indicators or terminal criteria. In relation to these terminal criteria, the measurement scales are defined which are used in practice to determine the criticality level of each highway section.
Physical Criticality: This refers to the transport infrastructure’s physical elements that may have a degree of criticality in case of structural failure, e.g. transport routes, road length (arch), capacity (to absorb traffic) and other infrastructure assets included in the assess-ment such as bridges, tunnels, viaducts, etc.
Functional Criticality: This refers to all relations between infrastructure and the services it renders and its degree of criticality in case of failure, e.g. the access it gives to the produc-tion system in its different scales (local, regional, national or international) and the services required by the population (drinking water, health safety, intermodal energy connectivity).
Social Criticality: This refers to the characteristics of the population that is being attended to and the degree of impact it will receive in case the road network fails, e.g. the level of isolation of the population in a certain section as well as its specific characteristics (educa-tion level, poverty percentage, invalidity, age and presence of indigenous communities in the sector or section).
Below these three strategic criteria are broken down and the intermediate sub-criteria can be considered as groups relating each strategic criterion to the final indicators in order to maintain the necessary principle of comparative homogeneity between the criteria. The level indicates whether it is a grouping sub-criterion or a specific indicator. The specific description of the indi-cator scales can be found in the Annex.
PHYSICAL CRITICALITY
Level Sub-criterion Description
Indicator Section length Represents the total length of the highway section to be preserved/repaired in kms.
Sub-criterion Number of lanes of the pro-ject
Represents the number of lanes of the project considering both traffic directions.
Indicator Number of lanes of federal highways
Number of federal highway lanes for preservation.
Indicator Number of lanes for rural and connection roads
Number of rural and connection roads for preservation.

GIDRM | 2020 | 7
PHYSICAL CRITICALITY
Level Sub-criterion Description
Indicator Running surface Represents the characteristics of the highway running sur-face and the layers composing it, as well as the type of material.
Indicator Type of terrain (topogra-phy)
Topographical conditions of the highway project.
Sub-criterion Type of infrastructure of the section
Tipo of infrastructure available in the highway section.
Indicator % preservation of bridges Percentage of bridge length to be preserved in relation to the highway section length.
Indicator % preservation of tunnels Percentage of tunnel length to be preserved in relation to the highway section length.
Indicator Drainage works Existence of drainage works necessary in the section.
Note: The models corresponding to new and existing projects are differentiated by the name and definition of the scales associated with the following concepts: section length, number of lanes, construction (or repair) of tunnels and construction (or repair) of bridges, and are, therefore, marked in red.
For the indicated criteria, the branch of physical criticality for news projects is defined as follows:
Level Sub-criterion Description
Indicator Section length Represents the total length of the highway section to be built/enlarged/modernized in kms.
Sub-criterion Number of lanes of the pro-ject
Represents the number of lanes of the project consider-ing both traffic directions.
Indicator Number of lanes of federal highways
Number of federal highway lanes for construction/en-largement/modernization
Indicator Number of lanes for rural and connection roads
Number of lanes of rural and connection roads for con-struction/enlargement/modernization
Indicator % Construction/moderniza-tion/widening of bridges
Percentage of bridge length to be built/enlarged/mod-ernized in relation to the highway section length.
Indicator % Construction/moderniza-tion of tunnels
Percentage of tunnel length to be built/enlarged/mod-ernized in relation to the highway section length
In terms of structure, the two models are very similar. Therefore, in the following, the differ-ences will be highlighted only where applicable.
FUNCTIONAL CRITICALITY
Level Sub-criterion Description
Indicator Highway classification Type of highway according to its function in the national network.
Sub-criterion Highway volume Load regarding number of vehicles that come through the section in a year.
indicator AADT Annual average daily traffic: number of vehicles that come through the section during a year, divided by the number of days in a year.
Indicator % AADT in heavy traffic Annual average daily traffic of heavy traffic: number of heavy-traffic vehicles that come through the section dur-ing a year, divided by the number of days in a year.

GIDRM | 2020 | 8
FUNCTIONAL CRITICALITY
Level Sub-criterion Description
Indicator Alternative routes (redun-dancy)
Existence of alternative transport routes that give access to destinations that would otherwise be inaccessible due to the temporary/permanent closure of the highway sec-tion (PIARC, 2015).
Sub-criterion Accessibility Accessibility to different types of services through the specific section. In general, complies or does not comply.
Indicator Access to supply centers Access to supply centers.
Indicator Access to public service con-trol centers
Access to public service control centers.
Indicator Access to emergency service centers
Access to emergency service centers.
Indicator Access to medical centers and hospitals
Access to medical centers and hospitals.
Sub-criterion Connectivity
Sub-criterion Importance of the section in the network
Ponderation of connectivity functions.
Indicator Connects rural highway with a connection road
Connects rural highway with a connection road.
Indicator Connects a connection high-way with a free federal high-way or a highway corridor
Connects a connection highway with a free federal high-way or a highway corridor.
Indicator Connects a free federal high-way with highway corridors
Connects a free federal highway with highway corridors.
Indicator Connects highway corridors or transport axes
Connects highway corridors or transport axes.
Sub-criterion Economic-production con-nection
Indicator Connects to airports Connects to airports.
Indicator Connects to urban centers (including periphery)
Connects to urban centers (including periphery).
Indicator Connects to border ports Connects to border ports.
Indicator Connects to 2 or more urban centers, including periphery
Connects to 2 or more urban centers, including periph-ery.
Indicator Connects with 2 or more bor-der ports
Connects with 2 or more border ports.
Sub-criterion Connection with connection roads, rural roads and gaps
In general, complies or does not comply.
Indicator Farming field access roads Indicates whether the section connects to farming field access roads.
Indicator Recreation and cultural cen-ters
Indicates whether the section connects to recreation and cultural centers.
Indicator Educational centers Indicates whether the section connects to educational centers.
Indicator Food distribution centers (in-put supply)
Indicates whether the section connects to food distribu-tion centers (input supply).
Indicator Medical and health centers Indicates whether the section connects to medical and health centers.

GIDRM | 2020 | 9
SOCIAL CRITICALITY
Level Sub-criterion Description
Indicator Degree of isolation Measured in terms of the distance of the town to a paved highway (in kms).
Indicator CONAPO margination index CONAPO indicator (direct value).
Sub-criterion Priority of attending municipal-ities
Priority level established in the documentation.
Indicator Municipalities located in high-margination regions
Priority level of municipalities located in high-mar-gination regions.
Indicator Indigenous municipalities Priority level of municipalities with indigenous pres-ence.
Criticality Model of Existing Projects Below, the final structure of the criticality model for existing projects is presented. The numbers (e.g. D: ,3326) refer to the global weight of the concept in relation to the goal. The value of 0.3326 is interpreted as 33.26%.
GOAL: Prioritize routes according to their degree of criticality (existing projects) Physical Criticality (D: ,3326)
Functional Criticality (D: ,4582)
Social Criticality (D: ,2093)
Length of the section (D: ,0329) Length existing pro-
jects (D: ,0329) Number of lanes in the
project (D: ,0205) Number of lanes for
construction, modern-ization and conserva-tion (D: ,0174)
Number of lanes for rural and connection roads (D: ,0031)
Running surface (mate-rial) (D: ,0268)
Type of terrain (topogra-phy) (D: ,1220)
Type of Infrastructure in the section (D: ,1304) % of bridges (D: ,0855)
% conservation of bridges (D: ,0855)
% of tunnels (D: ,0117) % conservation of
tunnels (D: ,0117) Drainage works
(D: ,0332)
Road classification (D: ,0318) Road volume (D: ,0524)
Annual average daily traffic (D: ,0417) Annual average of daily heavy traffic
(D: ,0107) Alternative routes (redundancy (D: ,0651) Accessibility (D: ,1465)
Supply centers (D: ,0331) Public service control centers (D: ,0280) Emergency service centers (D: ,0327) Health care centers and hospitals
(D: ,0527) Connectivity (D: ,1624)
Importance of the network section (D: ,0568) Connects a rural with a connection
highway (D: ,0035) Connects a connection highway with
a free federal highway or with a high-way corridor (D: ,0093)
Connects a free federal highway with highway corridors (D: ,0188)
Connects highway corridors or transport axes (D: ,0253)
Economic-productive connection (D: ,0792) Connects to airports (D: ,0039) Connects to urban center (including
periphery) (D: ,0189) Connects to border ports (D: ,0086)
Degree of insula-tion (distance to highway) (D: ,0238)
Marginalization In-dex (CONAPO) (D: ,0973)
Priority of atten-tion to municipali-ties (D: ,0882) Municipalities
located in highly margin-alized regions (D: ,0685)
Indigenous municipalities (D: ,0198)

GIDRM | 2020 | 10
Connects 2 (or more) urban centers (including periphery) (D: ,0339)
Connects 2 (or more) border ports (D: ,0139)
Connects connection roads, rural roads and gaps (D: ,0263) Farming-field entrance roads
(D: ,0045) Recreational and cultural centers
(D: ,0011) Educational centers (D: ,0030) Food distribution centers (inputs sup-
ply) (D: ,0067) Medical and health centers (D: ,0110)
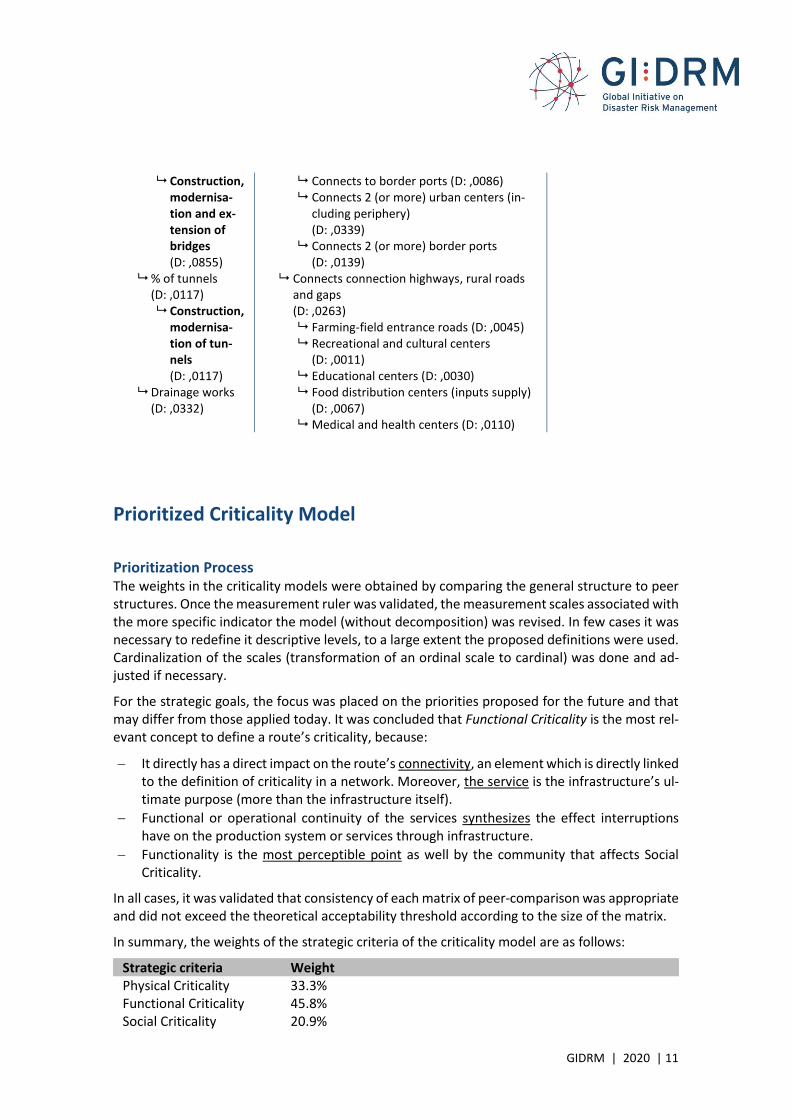
Criticality Model of New Projects Below, the hierarchical structure of the criticality model for new projects is shown. As has been indicated, the structure is practically the same, with minor variations in the names of three Phys-ical Criticality indicators. The weights of the criteria are the same as in the model for existing projects.
GOAL: Prioritize routes according to their degree of criticality (existing projects) Physical Criticality (D: ,3326)
Functional Criticality (D: ,4582)
Social Criticality (D: ,2093)
Length of the sec-tion (D: ,0329) Length new pro-
jects (D: ,0329)
Number of lanes in the project (D: ,0205) Number of lanes
for construction, modernization and conservation (D: ,0174)
Number of lanes for rural and connection roads (D: ,0031)
Running surface (material) (D: ,0268)
Type of terrain (to-pography) (D: ,1220)
Type of Infrastruc-ture in the section (D: ,1304) % of bridges
(D: ,0855)
Road classification (D: ,0318) Road volume (D: ,0524)
Annual average daily traffic (D: ,0417) Annual average of daily heavy traffic
(D: ,0107) Alternative routes (redundancy (D: ,0651) Accessibility (D: ,1465)
Supply centers (D: ,0331) Public service control centers (D: ,0280) Emergency service centers (D: ,0327) Health care centers and hospitals (D: ,0527)
Connectivity (D: ,1624) Importance of the network section (D: ,0568)
Connects a rural with a connection high-way (D: ,0035)
Connects a connection road with a free federal highway or with a highway corri-dor (D: ,0093)
Connects a free federal highway with highway corridors (D: ,0188)
Connects highway corridors or transport axes (D: ,0253)
Economic-productive connection (D: ,0792) Connects to airports (D: ,0039) Connects to urban center (including pe-
riphery) (D: ,0189)
Degree of insulation (distance to high-way) (D: ,0238)
Marginalization In-dex (CONAPO) (D: ,0973)
Priority of attention to municipalities (D: ,0882) Municipalities lo-
cated in highly marginalized re-gions (D: ,0685)
Indigenous mu-nicipalities (D: ,0198)
GIDRM | 2020 | 11
Construction, modernisa-tion and ex-tension of bridges (D: ,0855)
% of tunnels (D: ,0117) Construction,
modernisa-tion of tun-nels (D: ,0117)
Drainage works (D: ,0332)
Connects to border ports (D: ,0086) Connects 2 (or more) urban centers (in-
cluding periphery) (D: ,0339)
Connects 2 (or more) border ports (D: ,0139)
Connects connection highways, rural roads and gaps (D: ,0263) Farming-field entrance roads (D: ,0045) Recreational and cultural centers
(D: ,0011) Educational centers (D: ,0030) Food distribution centers (inputs supply)
(D: ,0067) Medical and health centers (D: ,0110)
Prioritized Criticality Model
Prioritization Process The weights in the criticality models were obtained by comparing the general structure to peer structures. Once the measurement ruler was validated, the measurement scales associated with the more specific indicator the model (without decomposition) was revised. In few cases it was necessary to redefine it descriptive levels, to a large extent the proposed definitions were used. Cardinalization of the scales (transformation of an ordinal scale to cardinal) was done and ad-justed if necessary.
For the strategic goals, the focus was placed on the priorities proposed for the future and that may differ from those applied today. It was concluded that Functional Criticality is the most rel-evant concept to define a route’s criticality, because:
− It directly has a direct impact on the route’s connectivity, an element which is directly linked to the definition of criticality in a network. Moreover, the service is the infrastructure’s ul-timate purpose (more than the infrastructure itself).
− Functional or operational continuity of the services synthesizes the effect interruptions have on the production system or services through infrastructure.
− Functionality is the most perceptible point as well by the community that affects Social Criticality.
In all cases, it was validated that consistency of each matrix of peer-comparison was appropriate and did not exceed the theoretical acceptability threshold according to the size of the matrix.
In summary, the weights of the strategic criteria of the criticality model are as follows:
Strategic criteria Weight Physical Criticality 33.3% Functional Criticality 45.8% Social Criticality 20.9%

GIDRM | 2020 | 12
Measurement ruler The measurement ruler shows the relative importance of the terminal criteria (measurement indicators) in the criticality assessment, establishing the most determinant criteria at the criti-cality level of the highway sections. Once the models in the existing and new projects had been divided, the measurement ruler was validated with the attendants, and the same one was kept for both cases. Nonetheless, since some names were adjusted in the criteria, the rulers are at-tached for both cases.
Criticality Model of Existing Projects Figure 3 shows the measurement ruler associated with the model of existing projects:
Figure 3: Measurement ruler of the model for existing projects

GIDRM | 2020 | 13
Criticality Model of New Projects Figure 4 shows the measurement ruler associated with the model of new projects:
Figure 4: Measurement ruler of the model for new projects
The two measurement rulers above show the following:
• Both rulers are formed by a total of 34 terminal criteria or measurement indicators and their distribution is clearly not linear. The important thing is that three large zones are highlighted in the graph.
• In the first or top zone, the first seven terminal criteria can be classified for new and ex-isting projects: (1) type of terrain, (2) margination index (CONAPO), (3) percentage of bridge construction (or repair of bridges for existing projects), (4) municipalities located in high-margination regions, (5) alternative routes (redundancy), (6) medical attention centers and (7) annual average of daily traffic; all representing 53.27% of the criticality decision and indicating that these seven criteria determine criticality.
• Then, we have a second zone (intermediate zone), with 10 terminal criteria more, which are in the range of importance between 2 and 3.5% each, representing 30.14% of the

GIDRM | 2020 | 14
criticality decision. It is worth noting that if we add these two zones up, over 83% of the criticality decision in highways has been formed by the first 17 criteria (50% of the total number of indicators) and which, each, weigh over 2% of the total.
• Finally, a 3rd zone (bottom zone) is shown with 17 indicators (the remaining 50%) with less than 2% each and which together add up to 17% of the total.
Criticality Thresholds
Introduction to Criticality Thresholds Criticality thresholds are used to classify the projects according to their degree of criticality (high, moderate or low) and are obtained based upon a theoretical-empirical process, i.e., applying statistical, distribution and calibration aspects on the assessment scales of the terminal criteria. For this, two threshold levels were defined: one lenient and one demanding. If a project exceeds the demanding threshold, it clearly is a critical project which requires more attention. If it ex-ceeds the lenient threshold, it is a project that (according to the budget) could be a critical pro-ject and could require the relevant attention; finally, if it does not exceed the lenient threshold, it is not considered a critical project.
The warning thresholds were defined so the assessor can consider these values too to determine how close a project is to being critical.
Should a project turn out to be in the critical zone, it should be checked which sections are re-sponsible for said criticality to distribute resources accordingly.
General Process to Determine Thresholds The thresholds are obtained based upon the transformation functions (from ordinal scales into cardinal scales), by determining their gravity center and inflexion point for each of the model’s terminal criteria to make a weighted sum of the terminal criteria of the entire model. Finally, the model’s degree of global consistency (analogue to “margin of error”), thus achieving the model’s final criticality threshold value. Obviously, this value is theoretical and must be con-trasted with practical examples and adjusted if necessary. Normally, the required adjustments are minor and the initial value (theoretical value) turns out to be close to the real value (empir-ical value).
Note: the described procedure counts for strictly crescent or decrescent functions. For other kinds of functions, the process may turn out to be more complex.
Criticality Model and Thresholds for New and Existing Projects It is important to show that the values of the thresholds are the same for both models. This has to do with the fact that the measurement ruler is the same in both models. The value table for thresholds is:
Criticality thresholds
Demanding (> 0,571) 0
1 = selected 0 = not selected
Critical project Moderately critical project
Project with low criticality Warning (0,519)
Lenient (> 0,487) 1
No. of terminal criteria = 34
Warning (0,443)

GIDRM | 2020 | 15
This table helps the assessor to define whether to use the demanding threshold (> 0,571) or the lenient threshold (> 0,487), i.e. to determine whether a project is critical, which is also related to its budget capacity. If the threshold is lower (lenient threshold), more projects might turn out to be critical. The traffic light of colors indicates the typology of the section under evaluation: red = critical project (exceeds criticality threshold), yellow = moderately critical project, green = project of low criticality.
Note: this table is the same as the one in the excel spreadsheets for the assessment of highways built to assess the criticality of the components or sections of the project as a whole.
Calibration Regarding calibration it is important to remember that both the model and the associated thresholds need continuous analysis and calibration. This can be done by reviewing the results of the examples being processed in the system. The more examples, the more certainty regard-ing the values initially calculated.
The incorporation of results from different and diverse highway assessments and the adjust-ments of values adds to the finetuning of the model and thresholds.
Assessment Tool To assess highways, an Excel spreadsheet was created for the project assessment itself. The user can enter the sections, in which the project has been subdivided in (note that the subdivision should be done with homogeneity criteria between the sections). The following columns contain the row with the different measurement indicators and their relevant assessment scales. The degree of criticality can be selected of the scale with which they wish to assess the section for the selected measurement indicator. Once per project, the usage of either lenient or demanding threshold has to be determined, in the top part of the spreadsheet, entering a “1” to activate the threshold and a “0” for the threshold not to be activated.
Exemplary Project Assessment The project “Casas Grandes Puerto Palomas” highway is composed of 3 sections: “Casas Grandes-Janos”, “Janos-Los Trios” and “Los Trios-Puerto Palomas”. The three sections are green, which means that they are under the selected lenient threshold. On the other hand, the highway as a whole is also green (which is logical, since the highway is calculated as the arithmetic aver-age of the sections composing it). In this case, both the total project and each one of its compo-nents turned out to be of low criticality. This means that this highway with a criticality index of 0.3673 is 25% below the lenient criticality threshold (0.487). Therefore, this is not a critical high-way for the Mexican road infrastructure network.
In the second example, the “Los Herrera-Tamazula” highway is the assessment of an existing rural road with a criticality value of 0.5888, which means, by 21% above the lenient threshold (it should be noted that it also exceeds the demanding thresholds, though by only 3%). Therefore, it would be a critical highway for the road infrastructure network in Mexico from multidimen-sional point of view. Given that the project consists of one single section, it is directly responsible

GIDRM | 2020 | 16
for the highway’s critical category, and, therefore, the variable(s) with the most influence on the final value of the criticality index has to be determined.
An important point to highlight is the case in which a highway of low criticality (green) or mod-erate criticality (yellow), but with one or more critical sections (red). The section in red needs to be reviewed, since, even though the section does not make the highway critical on a whole, it can be a section of high local importance and, therefore, require specific attention. This is even more relevant for highways in the category yellow, since they can be close to becoming critical.
Conclusions and Recommendations The goal of the multicriteria work session in Mexico City was broadly achieved, both in terms of the validation of the general model (decision structure), and the obtainment of the local weights representing the Mexican reality as well as in terms of validating the final measurement ruler to be used to later assess the sections.
The project assessment spreadsheets is the main operational tool of the entire decision-making process, the final tool to measure the degree of criticality of the projects, and has the advantage of integrating the different visions of the institutions that participated in the process, by com-bining them in a final criticality indicator. With a shared criticality assessment of road infrastruc-ture, the institutions and actors involved make use of existing synergies and break down tradi-tional silo barriers. By developing a final criticality indicator, subsequent budget allocation be-comes more efficient. The recurring adjustment of criteria and values is vital to foster the preci-sion and calibration of the criticality model.

GIDRM | 2020 | 17
Annex This annex presents the different indicators with their associated cardinal scale. For reasons of simplicity the indicators are shown in the same order in which they are used in the assessment of the sections, with maintenance of the hierarchical model’s criticality groups.
Indicators of Physical Criticality Below are, for each indicator, the levels of scale and their values on cardinal scale between 0 and 1. Given the subtle differences between the models for existing projects and new projects, below we show the scales of the model for existing projects and, after that, those of Physical Criticality of the model for new projects.
Existing projects
Section length existing projects No. of federal lanes for preservation
Very high > 20 1 Very high > 4 1
High 13-20 0.5099 High 4 0.5725
Medium 7-12 0.2515 Medium 2 lanes/acot) 0.2904
Low 3-6 0.1236 Low 2 lanes of 3,5 m 0.1467
Very low < 3 0.065 Very low 2 lanes <3,5m 0.0706
No. of connection and rural lanes for preservation
Running surface (material)
High 2 lanes of 3.5m 1 Hydraulic pavement 1
Medium 2 lanes of 3m 0.5928 Conventional asphalt pavement 0.5099
Low 1 lane of 4m 0.1406 Surface treatment 0.2515
Coating 0.1236
Dirt 0.065
Type of terrain
% preservation of bridges
Mountainous 1 Very high > 40p/100km 1
Hilly-mountainous 0.5099 High 29-40p/100km 0.5234
Hilly 0.2515 Medium 17-28p/100km 0.2786
Flat-hilly 0.1236 Low 5-16p/100km 0.1284
Flat 0.065 Very low < 5p/100km 0.065
Zero, no bridge 0
% preservation of tunnels Drainage works
> 700m 1 4 or more drainage works/km 1
400-700 m 0.2752 3 drainage works/km 0.4641
< 400m 0.1514 2 drainage works/km 0.208
Zero, no tunnel 0 1 drainage works/km 0.0978
Without drainage works 0

GIDRM | 2020 | 18
New projects
Section length new projects
No. of federal lanes for construction, mod-ernization
Very high > 40 1 Very high > 4 1
High 21-40 0.5099 High 4 0.5725
Medium 11-20 0.2515 Medium 2 lanes/acot) 0.2904
Low 3-10 0.1236 Low 2 lanes of 3,5 m 0.1467
Very low < 3 0.065 Very low 2 lanes <3,5m 0.0706
No. of connection and rural lanes for con-struction, modernization
Running surface (material)
High 2 lanes of 3.5m 1 Hydraulic pavement 1
Medium 2 lanes of 3m 0.5928
Conventional asphalt pave-ment 0.5099
Low 1 lane of 4m 0.1406 Surface treatment 0.2515
Coating 0.1236
Dirt 0.065
Type of terrain
% construction, modernization and enlarge-ment of bridges
Mountainous 1 Very high > 5% 1
Hilly-mountainous 0.5099 High 3,6-5% 0.5099
Hilly 0.2515 Medium 2.1-3.5% 0.2515
Flat-hilly 0.1236 Low 0.5-2% 0.1236
Flat 0.065 Very low < 0.5% 0.065
Zero, no bridge 0
% construction, modernization of tunnels Drainage works
Very high > 5% 1 4 or more drainage works/km 1
High 3,6-5% 0.4312 3 drainage works/km 0.4641
Medium 2.1-3.5% 0.1926 2 drainage works/km 0.208
Low 0.5-2% 0.123 1 drainage works/km 0.0978
Very low < 0.5% 0.0669 Without drainage works 0
Zero, no tunnel 0
Indicators of Functional Criticality Below the indicator scales for Functional Criticality are shown, which are common for both mod-els.
Highway classification AADT
Highway corridor 1 Very high > 20000 1
Federal network outside the corridor 0.671
High 5001-20000 0.5728
Connecting road 0.317 Medium 3001-5000 0.2287
Camino rural 0.1463 Low 1500-3000 0.1418
Ga´p 0.0666 Very low < 1500 0.0702

GIDRM | 2020 | 19
% AADT of heavy traffic Alternative routes (redundancy)
Very high > 30% 1 Very high/without alternative route 1
High 21-30% 0.4833 High > 200% .5291
Medium 11-20% 0.1794 Medium 100-200% 0.2479
Low 6-10% 0.1048 Low 50-99% 0.1218
Very low < 6% 0.068 Very low < 50% (addit.) 0.0614
Zero without heavy traffic 0 Zero without alternative route 0
Supply centers Public-service control centers
Gives access 1 Gives access 1
Does not give access 0 Does not give access 0
Emergency service centers Medical centers and hospitals
Gives access 1 Gives access 1
Does not give access 0 Does not give access 0
Connects a rural road with a connection
road
Connects a connection highway with a free federal highway or with a highway corridor
Connects 1 Connects 1
Does not connect 0 Does not connect 0
Connects a free federal highway with high-
way corridors
Connects highway corridors or transport axes
Connects 1 Connects 1
Does not connect 0 Does not connect 0
Connects with airports
Connects with urban centers (including periph-ery)
Connects 1 Connects 1
Does not connect 0 Does not connect 0
Connects with border ports
Connects 2 (or more) urban centers (including periphery)
Connects 1 Connects 1
Does not connect 0 Does not connect 0
Connects 2 (or more) border ports
Farming-field entrance road
Connects 1 Connects 1
Does not connect 0 Does not connect 0
Recreation and cultural centers Educational centers

GIDRM | 2020 | 20
Connects 1 Connects 1
Does not connect 0 Does not connect 0
Food distribution centers (inputs supply) Medical and health centers
Connects 1 Connects 1
Does not connect 0 Does not connect 0
Indicators of Social Criticality
Below the indicator scales for Social Criticality are shown, which are common for both models.
Degree of isolation (distance to highway) Margination index (CONAPO)
Very high > 5km 1 Very high 1
High 2-5 km 0.5141 High 0.5724
Medium 1-2 km 0.261 Medium 0.2184
Low 500m-1km 0.1321 Zero 0
Very low < 500m 0.0688 Zero 0
Municipalities located in high-margination
regions Indigenous municipalities
Very high priority 1 1 Very high priority 1 1
High priority 2 0.5724 High priority 2 0.5724
Medium priority 3 0.2184 Medium priority 3 0.2184
Zero (no priority) 0 Zero (no priority) 0