practical control strategies for starling infestations
TRANSCRIPT
Practical Control Strategies for Starling Infestations
Participatory research to determine recommendations for starling control and infestation management Report prepared for DairyCo by Kingshay June 2013

1 TABLE OF CONTENTS
1 Executive summary ......................................................................................................................... 1
2 Introduction .................................................................................................................................... 2
2.1 Rationale for study .................................................................................................. 3
2.1.1 Dairy cow health .............................................................................................. 3
2.2 Distribution and population trends of European Starlings ........................................ 4
2.3 Population Trends of Common European Breeding Birds 2012 - Pan-European Common Bird Monitoring Scheme (PECBMS) ................................................................... 4
2.4 Breeding trends and decline ................................................................................... 5
2.5 Somerset Levels roosts 2012/13 ............................................................................. 5
2.6 Starlings and UK agriculture ................................................................................... 6
2.7 Mitigation methods .................................................................................................. 6
2.8 Climate change ....................................................................................................... 7
3 Objectives........................................................................................................................................ 9
4 Research methodology ................................................................................................................. 10
4.1 Final site selection: monitor farms mapped ........................................................... 10
4.2 Participating farm systems .................................................................................... 11
4.2.1 Farm B1 (and Case Study 4 & 5) ................................................................... 12
4.2.2 Farm B2 ......................................................................................................... 12
4.2.3 Farm B3 ......................................................................................................... 12
4.2.4 Farm T1 (and Case Study 2) .......................................................................... 12
4.2.5 Farm T2 ......................................................................................................... 13
4.2.6 Farm CS1 ...................................................................................................... 13
4.2.7 Farm CS3 ...................................................................................................... 13
4.2.8 Farm CS6 ...................................................................................................... 13
4.3 Trial 1 - Using the feed additive BLAST in TMR, replicated on 3 farms ................. 14
4.3.1 Trial 1 Protocol ............................................................................................... 14
4.3.2 Assessments ................................................................................................. 15
4.3.3 Data quality .................................................................................................... 16
4.4 Trial 2 – Altering the feed time of a once-a-day feeding system ............................ 16
4.4.1 Protocol ......................................................................................................... 17
4.4.2 Assessments for trial 2 ................................................................................... 17
4.5 Statistical analysis................................................................................................. 17
5 Results ........................................................................................................................................... 18
5.1 Trial 1 results ........................................................................................................ 18
5.1.1 Overall starling numbers ................................................................................ 18
5.1.2 Starling numbers pre, post and during feed additive treatment ...................... 19

5.1.3 Starling activity during the day ....................................................................... 21
5.1.4 Feed loss ....................................................................................................... 22
5.1.5 Summary of trial 1 .......................................................................................... 23
5.2 Trial 2 results ........................................................................................................ 24
5.2.1 Overall starling numbers ................................................................................ 24
5.2.2 Starling numbers pre, post and during feed time change ............................... 25
5.2.3 Starling activity during the day ....................................................................... 27
5.2.4 Feed quality and volume loss ......................................................................... 28
5.2.5 Stakeholder feedback and farm observations ................................................ 29
5.2.6 Summary of trial 2 .......................................................................................... 30
6 Mitigation Case Studies ................................................................................................................ 31
6.1 Farm CS 1 ............................................................................................................ 31
6.1.1 Changing the timing of feeding: ..................................................................... 31
6.1.2 Employing a man to shoot to scare: ............................................................... 31
6.1.3 Auditory scaring devices: ............................................................................... 31
6.1.4 Deployment of bird-scaring rockets: ............................................................... 31
6.1.5 Flying a Harris Hawk: ..................................................................................... 32
6.1.6 Outcomes ...................................................................................................... 32
6.2 Farm CS 2 ............................................................................................................ 33
6.2.1 Costing for exclusion of birds with netting to reduce losses incurred by starling activity 33
6.3 Farm CS 3 ............................................................................................................ 34
6.4 Farm CS 4 & 5 ...................................................................................................... 34
6.4.1 CS4 Mitigation measures ............................................................................... 35
6.4.2 CS4 Recommendations ................................................................................. 35
6.4.3 CS5 Mitigation measures ............................................................................... 35
6.4.4 CS5 Recommendations ................................................................................. 36
6.5 Farm CS 6 ............................................................................................................ 36
7 Discussion ...................................................................................................................................... 37
8 Conclusions ................................................................................................................................... 38
9 Recommendations ........................................................................................................................ 39
10 References ................................................................................................................................ 41
11 Appendices & photos ................................................................................................................ 43
12 End Page .................................................................................................................................... 55

GLOSSARY
UK BAP UK Biodiversity Action Plan
DEFRA Department for Environment, Food & Rural Affairs
CAFO Concentrated Animal Feeding Operations
PECBMS Pan –European Common Bird Monitoring Scheme
SPEC Species of European Conservation Concern
S41 List Habitats & species of principle importance in England
BBS British Bird Survey
NERC Natural Environment & Rural Communities
RSPB Royal Society for the Protection of Birds
NE Natural England
BTO British Trust for Ornithology
TMR Total Mixed Ration
DMI Dry Matter Intake
ME Metabolisable Energy
NDF Neutral Detergent Fibre
ANOVA Analysis of Variance statistical test
PPE Personal Protective Equipment
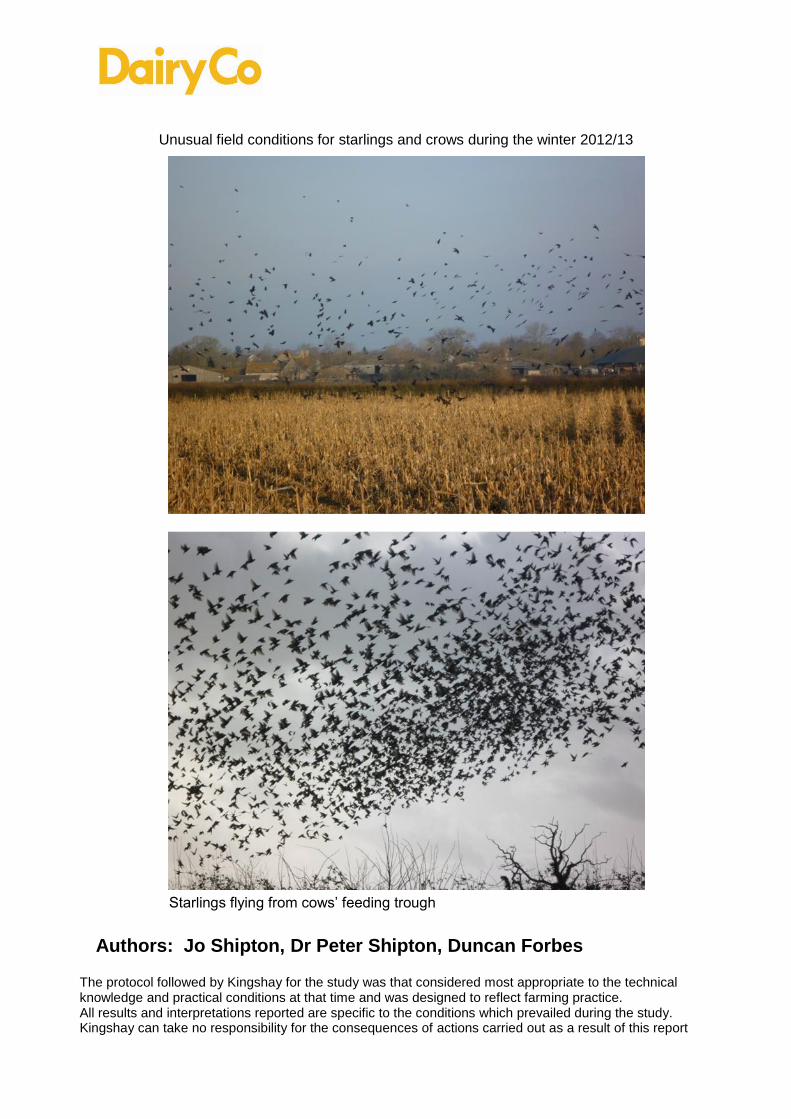
Unusual field conditions for starlings and crows during the winter 2012/13
Starlings flying from cows’ feeding trough
Authors: Jo Shipton, Dr Peter Shipton, Duncan Forbes
The protocol followed by Kingshay for the study was that considered most appropriate to the technical knowledge and practical conditions at that time and was designed to reflect farming practice. All results and interpretations reported are specific to the conditions which prevailed during the study. Kingshay can take no responsibility for the consequences of actions carried out as a result of this report
1
1 Executive summary
The UK breeding population of starlings has declined by 70% over the last 50 years, upgrading the species in the UK conservation listing to ‘Red’ status and, they are now on the critical list of UK birds most at risk, a UK BAP priority and S41 species. Agricultural change is often cited as a causal factor in the decline of the UK’s farmland birds because the fall in bird numbers has mirrored changes in agricultural practices. However it is likely that there are many causal factors for the decline in starling populations in particular winter food supplies, winter and spring weather and climate change. Although many dairy farmers faced with the annual problem may think starlings are a pest, because of their protected status as a species in decline, there is no legal lethal method of control.
The cost to the farmer of an average starling infestation was determined in the 2012 study to be £96 per 100 cows per day, rising to £106 in 2013 (based on prices at the time of writing this report). Losses over the winter period can amount to many thousands of pounds, allowing the adoption of many mitigation methods to be cost effective if starling numbers can be reduced.
A range of control measures are being used on farms which, when implemented correctly, offer some degree of starling control. The effectiveness of mitigation methods very much depends on their suitability for the individual farm, together with timing and the level of diligence and persistency of implementation.
Trials detailed in this report sought to determine the benefits of changing feeding times to reduce starling numbers. This is a logical approach to making farms unattractive as an early morning feed source, although some change to the farm routine is required. Implemented as part of a mitigation strategy it was determined that this method has a great deal of potential to reduce starling numbers as well as reducing feed loss (recorded as up to 1.8%), thereby reducing the cost of starling feeding activity with little or no additional costs of implementation.
Feed additive flavourings have the potential to deter starlings from feeding on farms and anecdotal evidence worldwide has demonstrated this potential. This study trialled the only additive in the UK market at the time of the study, to determine its effectiveness. Under the trial conditions detailed in this report, no reduction in bird numbers was observed whilst using the product.
As a result of detailed case studies and trial work over two years it is clear that starling numbers can be reduced, but rarely eradicated from a farm which starlings have chosen as a main feed source. The most effective approach to reducing starlings is to integrate the use of several methods of mitigation simultaneously or sequentially. However, the key to reducing starling numbers is to employ mitigation methods as soon as migrating birds are expected to arrive. Once starlings have selected their feeding sites for the winter it becomes increasingly difficult to change their feeding habits.
The development of guidance in this report aims to help dairy farmers to adopt strategies to reduce the costs associated with large flocks of starlings feeding on cattle rations.
Acknowledgements:
Kingshay wishes to thank all of the participating farmers in this project for their cooperation, time given to assisting the trial work and the use of their farms and animals.
This project was supported by DairyCo, the GB dairy industry’s levy organisation, working on behalf of Britain’s dairy farmers.
2
2 Introduction
Winter starling infestations continue to be a problem for dairy farmers, and the winter of 2012/13 proved to be an extended migration period, some starlings staying here more than a month longer than usual, due to unseasonal cold weather in the spring. This will have added to the losses incurred by starling predation of cattle feed. Starling depredation at livestock feeding areas can be reduced (Twedt & Glahn. 1982) by implementing appropriate management practices and losses reduced by limiting the rate at which starlings are able to consume exposed feed. Proofing of buildings in which cattle are fed complete diets is suggested as the most effective means of preventing this food loss (Feare et al, 1981) but this is not always appropriate in modern dairy systems.
Exposed feed, water sources and open feed stores on dairy farms are the attracting factors for starlings when sourcing feed sites during the early part of the migration period. Once feed sites are established, starlings will develop responsive behaviour of frequent and regular visits to the same farm. The importance of effective mitigation before the winter migration begins (late October/November) is developed in this report.
Although many dairy farmers faced with the annual problem may think starlings are a pest, because of their protected status as a species in decline, there is no legal lethal method of control. Climate change may be significant in the starling population decline. The decline of starling populations is unlikely to be entirely due to agricultural intensification or the change in land use, as suggested by some environmental organisations.
In the US a number of chemical repellents, pesticides and avicides can be legally used in the control of starlings, particularly on cattle feed lots and dairy farms experiencing infestations over the winter period. Chemical repellents can elicit withdrawal from specific or combined sensory stimuli or by producing learned avoidance via association between adverse postingestive effects and specific sensory cues (Werner & Clark, 2003). Products based on phenethyl alcohol, or methyl and dimethyl anthranilate (DMA), a food grade non-lethal grape extract, are used successfully as repellents, causing nerve irritation in the birds’ mucous membranes (Mason et al, 1988). Avery & Matteson (1993) determined increased effectiveness when using eyespots (kites or balloons with eye markings) with repellents. Currently the only feed flavouring (additive) repellant on the market in the UK is BLAST® (Active Flavour Technology). Additional products for use on British farms are proposed next year but their form is yet to be disclosed by manufacturers.
This document reports on trial work investigating two possible methods to reduce the effect of starling infestations as well as exploring measures which can be adopted by farmers so that the cost of the winter starling infestation can be at least reduced, or at best, prevented.
Mitigation methods and products were trialed for effectiveness, together with an examination of ‘case study’ farms undertaking different methods or products to mitigate their specific starling problems. With a data set of almost 90,000 records taken from photographic images of starling activity, analysis was a thorough, if prolonged process, providing robust and conclusive evidence.
The use of digital photography for monitoring is a useful tool for assessing bird populations, providing accurate counts of bird minutes (the amount of birds feeding for a whole minute recorded digitally), while avoiding estimation subjectivity and disturbance from observers. When estimating the size of large flocks of birds, observers generally overestimate small groups and underestimate large (Bibby, 2000). A low cost digital image counting programme, discussed by Perez-Garcia (2012), determined reduced estimation errors, but still manual counting with grids is the preferred option for the initial analysis of the images (carried out for this study).

3
2.1 Rationale for study
Kingshay have carried out this study on behalf of DairyCo to further the understanding of the potential benefits of different mitigation methods and to provide recommendations for their implementation. This study follows on from a previous study (Kingshay, 2012), which determined the cost of on-farm starling infestations to be on average £0.96 per cow per day, equating to approximately 3 pence per litre of milk produced. Surprisingly few farmers have implemented mitigation measures, largely because of limited appreciation of the extent of the total losses incurred from starlings. Those who have, have achieved varying degrees of success.
DEFRA figures for June 2012 show that the UK dairy herd has decreased by 2,000 for the previous 12 months, to 1.8 million cows, continuing the long term decline. However, this was a smaller decline than the previous 12 months (June 2010-2011), which was 33,000. The average dairy herd size is 125 cows (DairyCo Dairy Statistics, 2012) with an average milk yield of 7,445 litres. The main dairy systems affected by starling infestations are those fed on a TMR including maize silage, high energy and protein products and cereal grains. These herds have a higher concentrate use per cow. According to the latest Kingshay Dairy Focus Review, the annual concentrate use per cow for herds producing in excess of 9,000 litres is 3293 kg/cow/year. A starling infestation within TMR fed herds are likely to have a greater cost apportioned because of the loss of feed and feed value (Kingshay, 2012).
A range of control measures are being used on farms which, when implemented correctly, offer some degree of starling control. The development of protocols that effectively reduce bird numbers coupled with a positive cost:benefit analysis will encourage farmers to adopt strategies to reduce the cost of starling infestations.
2.1.1 Dairy cow health
European starlings are known to carry several microbial pathogens capable of transmitting diseases to humans and livestock, in particular Escherichia coli, Salmonella spp., Mycobacterium avium subsp. Paratuberculosis, associated with Johne’s disease (Gaukler et al, 2009, LeJeune et al, 2008, Mason et al, 1988) and Campylobacter (Colles et al, 2009). Studies carried out in the US determining prevalence of these pathogens and resistance to antimicrobials has prompted the use of avian toxicants and avian taste aversive agents in the hope of starling control on cattle feed lots, and food producing arable and dairy farms.
Carlson et al (2011) suggest that starlings are a source of S. enterica contamination (in feed and water troughs) in concentrated animal feeding operations (CAFOs) in the US and that population control, habitat management, exclusionary devices and bird repellents should be used to reduce the spread of disease within livestock production systems.
A likely source of contamination of gastro-intestinal diseases from pathogens (e.g. Salmonella, E. coli, Campylobacter and Cryptosporidium) is faecal material deposited by birds on roofs. Starlings perch on farm building roofs, and if the farm has a heavy infestation large amounts of faecal material can be deposited. Starlings can therefore elevate bacterial counts and contribute to faecal coliform contamination of surface waters, which may also indicate a higher rate of disease pathogens.
The Environment Agency have reported high rates of Ammonia and the presence of faecal coliforms, in water courses. These high values can usually be linked with contamination by slurry, and levels above 0.5mg/l can have an effect on livestock which can lead to liver failure. Analysis on a farm with a heavy winter starling infestation local to the study area have tested with very high levels of Ammonia (11mg/l) and the source was traced to starling faecal contamination beneath perching sites (pers. comm James Wigmore EA).

4
2.2 Distribution and population trends of European Starlings
The European Starlings’ (Sturnus vulgaris) ability to adapt to a large variety of habitats has allowed for their dispersal and establishment throughout the world—resulting in a habitat range from coastal wetlands to alpine forests, from sea level to 1900 meters above sea level.
Widespread throughout the northern hemisphere, the European Starling is native to Eurasia and is found throughout Europe, northern Africa (from Morocco to Egypt), northern India, Nepal, the Middle East (including Syria, Iran and Iraq), and north-western China. Furthermore, it has been introduced to and successfully established itself in New Zealand, Australia, North America, Fiji and several Caribbean islands.
The abundance of breeding Starlings in the UK has fallen rapidly, particularly since the early 1980s, and especially in woodlands (Robinson et al. 2002, 2005a) and the trend continues to be strongly downward. The declines have been greatest in the south and west of Britain; recent British Bird Survey data suggest that populations are also decreasing in Scotland and Northern Ireland, where the trends were initially upward. The species' UK conservation listing has been upgraded from amber to red as the decline has become more severe. Widespread declines in northern Europe during the 1990s outweighed increases in the south, and the European status of this species is no longer considered 'secure' (BirdLife International 2004). Overall, there has been a widespread moderate decrease across
Europe since 1980 (Pan European Common Bird Monitoring Scheme 2011a).
2.3 Population Trends of Common European Breeding Birds 2012 - Pan-European Common Bird Monitoring Scheme (PECBMS)
Common Starling Sturnus vulgaris for the period 1980-2010
Short-term trend (1990-2010) -9% with an annual change of -0.86%
Long-term trend (1980-2010) -52% with an annual change of -1.81%
Although the trend is downward globally, the decline has been less in Europe than it has been in the UK over the last decade, and little research has been done to understand the reasons, although anecdotally the blame focuses on agricultural intensification. Evidence suggests (Smith, 2005) that a national decline of starling numbers and the reduction in nest-site competition may have contributed to the increase in nest success, numbers and habitat distribution of the Great Spotted Woodpecker in Britain. Competition for nest-sites can be important for many species of cavity-nesting birds. Up to the 1980s, when starling numbers were high, nest-site interference was a significant cause of nest failure and delayed breeding in the Great Spotted Woodpecker and may have been sufficiently high to affect their population and habitat distribution. The decline in starling numbers in recent decades has led to increased breeding success of the woodpeckers and may have allowed them to expand their breeding distribution into less wooded habitats.
Plate 1 Starling migration paths

5
2.4 Breeding trends and decline
Starlings continue to decline, both in the UK and across their farm habitat and breeding range of the Baltics, Scandinavia, and Europe (Birdlife International, 2011).
In many countries in their range, starlings are thought to be a pest, and farmers experiencing problems of infestation or crop damage are permitted to use lethal control methods. Other countries positively encourage starlings, valued as insect predators.
The UK breeding population has declined by 70% over the last 50 years, upgrading the species UK conservation listing to ‘Red’ status and, they are now on the critical list of UK birds most at risk, a UK BAP priority and S41 species. Starlings are also rated as SPEC category 3 (declining) in Europe. The decline has accelerated since the 1990s, and the RSPB has reported a loss of over 40 million starlings from the European Union (including the UK) since 1980, more than any other farmland bird. Starling decline is claimed by some environmental organisations to be due to the loss of permanent pasture, increased use of farm chemicals and a shortage of food and nesting sites in many parts of the UK.
There may be many causal factors for the decline in starling populations; winter food supplies, winter and spring weather, which affect breeding condition, breeding success and juvenile survival rates as well as spring temperatures (stimulating spring migration for breeding) and the effects of climate change upon all of these factors. Limitation of invertebrates and supplementation with vegetation and grain in the winter diet may result in inappropriate body condition or fat reserves and could affect breeding and brooding ability.
Research by RSPB (lead by Dr. Richard Gregory) has suggested the decline in winter migrant starling numbers could be linked to the decline elsewhere in Europe where they are still plentiful but also declining rapidly. In parts of Europe a loss of grassland to reforestation could be a factor, but these agricultural changes have not affected the UK in the same way, so the rapid decline here is not understood.
A joint research project with NE and RSPB, part of the 'Action for Birds in England' programme, aims to diagnose the decline of the UK breeding starling population. Fieldwork will focus on SW England, where declines have been particularly severe. It involves establishing new nesting populations of starlings in nestboxes for subsequent study of diet-breeding performance relationships. This will include faecal analysis, direct observation and nestbox cameras, as well as measuring breeding productivity.
2.5 Somerset Levels roosts 2012/13
Figure 1 Somerset starling numbers 2013
0
200,000
400,000
600,000
800,000
1,000,000
1,200,000
Star
ling
Nu
mb
ers
6
Somerset roosts in 2013 have been concentrated on Ham Wall nature reserve, Somerset Levels. The peak numbers using the roost have been recorded monthly (source John Leece, BTO & Jane Allen, RSPB).
The maximum numbers for 2012/13 have been recorded in late December and January but these numbers are still down on last year (2012), when they peaked at 1,500,000 in February. The overall figure for starlings at the roost for the winter of 2012/13 is half the previous year.
2.6 Starlings and UK agriculture
Agricultural change is often cited as a causal factor in the decline of the UK’s farmland birds because the fall in bird numbers has mirrored changes in agricultural practice. The effects of agricultural intensification and changes in grassland management can be observed in a reduction of prey abundance or accessibility, for example, which specialists may not be able to adapt to. A study by Devereux et al, (2004) found short grass swards to be more profitable foraging habitat for soil and surface invertebrate feeders, facilitating surface prey detection and to improve forager mobility, increasing foraging time. This may explain starlings’ grazing behaviour and their desire to graze alongside livestock (Kingshay, 2012). RSPB report that starlings prefer grazed grassland less than 5cm. Tipulidae (Leatherjackets) and Lumbricidae (worms) are the main feed of grazing starlings.
More than three-quarters of the UK land area is agricultural landscape (DEFRA, Farming Statistics, 2012) and the utilized agriculture area on holdings in England has increased by 0.7% from 2011 to a total of 8.9 million hectares. The area of permanent pasture has fallen by 1% to 3.2 million hectares, whereas the total cropping area has increased by 1.9% in 2012 to 4.0 million hectares.
Since the mid-nineties the population of farmland birds has remained fairly stable, and despite the recent cold winters affecting some species, for other species we are seeing a population increase. What are farmers doing for farmland birds? Farmers in England are growing wild bird seed mixtures on almost 30,000ha. Targeted agri-environment initiatives have increased populations of certain scarce farmland birds e.g. cirl buntings by 130 per cent (1992-2003) and stone curlews by 87 per cent (1997-2005). The tree sparrow and the song thrush, both red-listed Biodiversity Action Plan priority species, have increased in the UK by 55 per cent and 27 per cent (between 1995 and 2008).
The fact that starlings secure a food source on dairy farms during their winter migration period may contribute to a successful breeding condition, and not their decline. It is not known if starling intelligence has prompted searches for feeding opportunities on-farm because of a need to supplement their diet, or if infestations are a result of opportunist visits, attracted by large, unprotected and accessible feed sources, increasing year by year.
2.7 Mitigation methods
Proximity of neighboring farms, building design, level of mitigation, proximity of orchards or trees suitable for perching could affect how ‘attractive’ farms are to starlings. During on-farm assessments, a positive correlation was previously determined (Kingshay 2012) for mitigation score (allocated for the farm methods used and effectiveness and diligence of implementation) against starling numbers. More or better implemented mitigation resulted in reduced bird numbers. This indicates that reducing starling numbers on individual farms is potentially possible through the selection of the right strategy combined with the right level of determination to implement the control method. Implementation and conscientiousness was determined to be most important from the onset of the migration period. Assessments of the effectiveness of used mitigation methods were entirely consistent with the findings of Bishop et al (2003). Recommendations to achieve a high level of control were determined as follows;
7
The most effective approach is to integrate the use of several methods of mitigation simultaneously or sequentially
Implement completely and persistently from the start of, or before, starling activity, not wait until the problem is out of hand
Consider changing feeding times to twice a day, or once after the starlings have left in the afternoon. It is not advisable to change the inclusion rates of different feeds in the TMR during a 24 hour period to deter starlings, as this can reduce cow performance
Consider not feeding maize. This may be a last resort and needs to be discussed with a good nutritionist to ensure that the desired cow performance is not compromised. Alternative feeds need to be considered carefully.
Differences in the ability to carry out control measures and their effectiveness occurs between farms. Not all strategies are appropriate for all farms and although changes in feed management i.e. not feeding maize, has a dramatic effect on starling numbers on farm this might not be an economic strategy for many producers.
Mitigation methods include; bio-acoustics, species specific distress calls, gas guns, pyrotechnics, scarecrows, kites and other visual displays and devices, birds of prey, shooting to scare, and exclusion and proofing methods (netting).
Auditory techniques of control are considered to be relatively effective (Bishop et al, 2003), but subject to habituation and therefore only of short-term benefit. Visual techniques vary from extremely effective (human disturbance) to ineffective (static scarecows). Exclusion techniques and habitat modification were found to be the most effective.
A combination of techniques, used in an integrated control strategy with diligence at the start of the season will achieve the best results. Erickson et al (1992), suggest that there is no evidence that ultrasonic devices deter birds – most species of birds do not hear ultrasonic range (>20KHz) so there is no biological basis for its use.
2.8 Climate change
The weather in 2012 (extreme rainfall) could be a consequence of climate change, with five of the wettest recorded summers occurring during the last 12 years. A combination of a drought early in the year, followed by the second wettest summer on record, produced difficult growing conditions, reducing crop yields whilst some maize crops were not harvested at all. If these seasonal changes become commonplace, patterns of output could change significantly, and which crops are viable to grow in the future will come into question.
At least over the last 3 decades, climate change has been advancing the phenology of important life-history events in a wide range of taxa (e.g. plants flowering earlier, mammals emerging from hibernation earlier and birds breeding earlier). Photoperiod is the principal environmental cue used to time each stage, allowing birds to adapt their physiology in advance of predictable environmental changes. Photoperiod is extremely important for starlings because, like other temperate-zone species, they use the shape of the annual change in day length to control the time of breeding and moult (Dawson 2005). However every year the actual date of migration back to their breeding ground differs, which may be due to a combination of weather, or temperature, and condition of the birds dependent on the winter availability of food.
In migratory birds the timing of spring migration is one of the major determinants of the timing of breeding. In a study by Both (2007), comparing the short-distance migrant European starling with the long-distance migrant pied fly-catcher, determined that starlings are predicted to have advanced breeding over most of their range, with the greatest advance in north-eastern Europe. If climate change is advancing both spring migration and breeding

8
date in the starling population, breeding success is dependent on prey species doing the same.
Climate change may lead to increased spring temperatures and this will advance the time of the peak abundance of invertebrates (Buse et al. 1999), on which many species of birds rely to feed their young. If birds rely entirely on photoperiod to time breeding, they will be unable to compensate by adjusting the time of breeding and a mismatch will develop between the time of invertebrate abundance and peak nestling growth (Visser, Both & Lambrechts 2004; Coppack & Pulido 2004).

9
3 Objectives
The main objectives of the study were as follows:
To trial the effectiveness of mitigation management practices and products to reduce starling infestations on farms. The mitigation practices trialed were:
o Application of the flavouring additive BLAST to cattle feed, claimed as a starling repellant
o Changing the timing of once-a-day feeding of cows from a.m. to p.m.
Improve the understanding of starling behaviour on the project farms through assessments of the following:
o Daily photographic monitoring of bird presence o Analyse data to extract bird behavioural patterns o Analyse data to correlate farm activity with bird numbers and mitigation
measures o Identify the potential to reduce starling infestation on farms
Evaluate the effectiveness of mitigation methods used by the case study farms including:
o Exclusion and physical methods o Auditory, visual and scaring methods o Use of birds of prey
Evaluate costs and benefits associated with the trials
Make recommendations by developing guidance that could be adopted by dairy farmers to control potential starling infestations

10
4 Research methodology
Two trials were conducted focusing on the effectiveness of mitigation methods to reduce starling infestation; Trial 1
Using the product BLAST® as a bird repellant to reduce depredation of TMR feed on
three farms
Trail 2
Changing the time of feeding the cows from early in the morning to late afternoon, after the starlings have left the farm returning to their night-time roosts (about 16:30) on two farms
Both of these trials were assessed by:
o Feed loss assessments
Feed loss assessments were made by evaluating loss of quality and volume from fed TMR.
Cow access to a 4m section of feed trough was prevented during the period 7am to 5pm and sampling was undertaken when the feed was dispensed (am) and before starlings were on the farm and again after starlings had left at the end of daylight hours (pm). The exposed ration was turned regularly to simulate cow disturbance of the ration. Measurements taken am and pm included:
Total weight of TMR (restricted access area only)
Sieving of TMR using Penn State Forage Particle Separator sieves (Department of
Dairy and Animal Science, Pennsylvania State University) to assess ration structure
change.
Sampling for laboratory analysis of feed nutritional value
o Time-lapse photography monitoring for starling activity
(See 4.2.2 and 4.3.2) Production losses were recorded by daily milk yield and DMI.
4.1 Final site selection: monitor farms mapped
The locations of all farms participating in the study are within the area marked below, together with the three starling roosts. Starlings used RSPB Ham Wall, Somerset Levels - Grid ref: ST449397 for their night-time roosts between November 2012 and March 2013. The same farms that participated in the Kingshay 2012 study were approached first to see if they would be willing to participate for a second year. Suitable farms were selected for trial 1. Recruitment for trial 2 was more difficult; the proposed disruption to staff rotas proved too difficult for most, and the two farms recruited for this trial were able to do so because the farmers themselves fed the cows.
Table 4-1 Location of participating farms
Trial 1 Trial 2
Farm
Code Postcode
Distance
from
roost
(miles) Herd size
Yield
(litres
per cow)
Farm
Code Postcode
Distance
from
roost
(miles) Herd size
Yield
(litres
per cow)
B1 BA6 6.9 150 9,200 T1 BA6 7.0 300 8,700
B2 BA6 6.5 180 7,300 T2 BA7 12 350 10,000
B3 BA6 7.3 350 9,200

11
NE Shapwick Heath. RSBP Ham Wall. SWT Westhay Moor 5 trial farms
4.2 Participating farm systems
All participating farms had experienced problems of starling infestation and expressed a desire to find methods of control to reduce their losses. Table 4-2 provides a breakdown of feeding system for each of the farms in both trial 1 and 2 and also information on current starling mitigation strategies
NE RSPB
Table 4-2 Farm Systems
Farm Herd size Trial TMR Insi
de
tro
ug
hs
Ou
tsid
e t
rou
gh
s
Gra
ss S
ila
ge
Ma
ize
Sil
ag
e
So
ya
Ra
pe
me
al
Wh
ea
t (r
oll
ed
/cr
imp
ed
)
Ble
nd
Ma
ize
(cr
imp
ed
)
Ca
ust
ic W
he
at
Su
ga
r b
ee
t/ M
ola
sse
s
Fo
dd
er
be
et
Co
ve
r si
lag
e f
ace
wit
h
she
et
/ n
et
Ne
t b
uil
din
gs
Au
dit
ory
sca
rin
g d
ev
ice
s
Bir
ds
of
pre
y
Sh
oo
tin
g t
o s
care
Dis
turb
an
ce/
Fa
rm
act
ivit
y
Sca
rin
g d
ev
ice
s/ H
an
gin
g
de
ad
bir
ds
Usi
ng
sta
ff t
o f
rig
hte
n
Ch
an
gin
g t
ime
of
fee
d
B1/CS4 & 5 150/180 Blast 3 3 3 3 3 3 3 3 3 3
B2 180 Blast 3 3 3 3 3 3 3 3 3 3 3 3
B3 350 Blast 3 3 3 3 3 3 3 3 3 3 3 3
T1/CS2 280 Feed time 3 3 3 3 3 3 3 3 3 3
T2 350 Feed time 3 3 3 3 3 3 3 3 3 3
CS1 580 Case study 3 3 3 3 3 3 3 3 3 3 3 3 3 3 3 3
CS3 200 Case study 3 3 3 3 3 3 3 3 3 3 3
CS6 500 Case study 3 3 3 3 3 3 3 3 3 3 3 3 3 3 3
Feed used MitigationTroughs
SWT
SWT
NE RSPB

12
4.2.1 Farm B1 (and Case Study 4 & 5)
850 acre (344 ha) farm with 2 dairy units, 150 cows (CS4) and 180 cows (CS5)
Conventional Holstein/Friesians milked twice a day - yield 9,500 litres
Cropping: 200 acres of wheat and maize, grass and IR leys
Fed TMR by mixer wagon once a day, 8 am
TMR ingredients: grass & maize silages, HP blend, crimped wheat and minerals
Inside and outside troughs
Established heavy starling infestation over the last decade
Orchards situated between farms used by starlings for perching
Case studies on these 2 farms compare and assess effectiveness of mitigation methods in place.
4.2.2 Farm B2
640 acre farm (259 ha), 60’ above sea level, average rainfall 31” (796mm)
180 Holstein/Friesians milked twice a day – yield 7,500 litres
Cropping: 500 acres grassland, 56 acres maize and 84 acres winter rape
Fed TMR by mixer wagon twice a day
TMR ingredients: grass & maize silages, blend of urea, soya and wheat, minerals
Inside and outside troughs
At least a decade of winter starling infestation problem
Large ash and oak trees used by starlings for perching surrounding the buildings.
No mitigation, apart from new gas gun this year and cover maize clamp.
4.2.3 Farm B3
600 acre (243 ha) farm
350 Holstein/Friesian cows milked twice a day – yield 9,200 litres
Cropping : maize, grass leys and 250 acres wheat
Fed TMR by mixer wagon twice a day
TMR ingredients: grass & maize silages, alkalage, blend, sugar beet and rolled wheat
Inside and outside troughs
Established low level starling infestation
Perching on telegraph wires opposite farm
Mitigation: maize clamp covered, scaring devices, licensed shooting, displaying dead birds, using farm staff and working dog to scare birds.
4.2.4 Farm T1 (and Case Study 2)
470 acre (190 ha) farm, new dairy built 2010
280 Holstein/Friesian cows, housed all year, milked twice a day – yield 8,700 litres
Cropping: maize, grass leys and wholecrop cereals
Fed TMR by mixer wagon twice a day
TMR ingredients: grass & maize silages, wholecrop wheat, crimped maize, soya and molasses
Inside troughs
Established large starling infestation
Perching in orchard trees between new dairy, old dairy and neighbouring dairy farm
Mitigation: low levels scaring devices and shooting to scare.

13
4.2.5 Farm T2
2011 expansion, with new cow buildings, milking parlour and storage, with the aim of expanding to 500 cows.
350 Holstein cows, housed all year and milked twice a day – yield 10,000 litres
Cropping: maize and IRG leys
Fed TMR by mixer wagon once a day in the morning
TMR ingredients: grass & maize silages, blend, molasses and wheat
Inside troughs
Established large starling infestation
Perching on telegraph wires opposite farm
Mitigation: low levels, very open buildings.
4.2.6 Farm CS1
400 acre (162 ha) farm
580 Holstein/Friesian cows, housed all year and milked 3 times a day, through a 50 point rotary parlour – yield 9,200 litres
Cropping: maize and grass leys
Fed TMR by mixer wagon once a day in the afternoon
TMR ingredients: grass & maize silages, molasses, soya, rape and caustic wheat
Inside and outside troughs
Established infestation for many years, starling numbers peaked at 50,000 in 2012
Suitable perching trees near buildings, and an orchard nearby
Mitigation: high level, new this year (see case study)
4.2.7 Farm CS3
Farm located very near to the Somerset Levels nature reserves used as starling roosts
200 Holstein/Friesian cows, milked twice a day – yield 11,000 litres
Cropping: maize and grass leys
Fed TMR by mixer wagon
TMR ingredients: maize & grass silages, blend, straw and fodder beet
Inside troughs
History of starling infestation, reduced to low levels for a few years
Mitigation: high levels, well implemented
4.2.8 Farm CS6
1300 acre (526 ha) farm
500 Holstein/Friesian cows, housed all year and milked 3 times a day – yield 10,200 litres
Cropping: 1000 acres arable + grass and clover and IRG leys
Fed TMR by mixer wagon once a day, early morning
TMR ingredients: maize and grass silages, blend of soya, rape and beet pulp, caustic wheat and molasses
Inside and outside troughs
History of starling infestation
Nearest dairy farm achieves complete exclusion, therefore area is not attractive to starlings
Mitigation: high levels, well mitigated and achieves good control

14
4.3 Trial 1 - Using the feed additive BLAST in TMR, replicated on 3 farms
Aim: To determine the effectiveness of the flavour additive BLAST as a deterrent to starlings by its addition to TMR and an application to the maize silage face where left uncovered, under controlled management conditions.
From research during the previous study an understanding of the majority of the existing control measures and their effectiveness was developed. However, the testing of feed additives was beyond the scope of that study.
Claims for the only flavouring currently available to farmers, ‘BLAST’, are for large reductions in starling numbers but results were inconclusive on the benefits of this product. The trial aimed to assess the product’s potential as a deterrent and an assessment of the cost:benefit of a product currently costing £0.15 per cow per day, made.
BLAST is claimed to be “an approved animal feed flavouring, and is formulated from an active blend of flavouring identical to those found in spices, herbs and other plants. Using flavour technology, BLAST actively discourages birds from eating TMR rations and soiling feed areas” - quote from advertising material.
4.3.1 Trial 1 Protocol
A 4m section of feed trough treatment area was selected on all farms. The selection was made to ensure that it was representative of the whole farm feeding as well as being suitable for monitoring by camera. Cameras were set up for recording starling numbers, cow behaviour, cow and starling interaction, farm activity, weather conditions and feeding times by time-lapse photography. Images were taken every minute during the starling activity daytimes between dawn, 07.30 and dusk 16.30 (plates 4 and 5). Monitoring periods before, during and after the trial are detailed in the trial calendar table 4-3. Trial dates and times were decided to coincide with maximum migrant starling roost populations and farm activity (on-farm feeding), to demonstrate maximum treatment response.
Protocols for mixing the BLAST product
Plate 2 Mixed product BLAST
Plate 3 Protocol cards for mixing and usage of BLAST

15
and usage instructions (see appendix) were agreed with the manufacturer and issued to farmers with a Kingshay trial specialist responsible for each farm. Blast (powder) was mixed, according to manufacturer instructions and the Kingshay trial protocol, during the evening before application to allow for standing time to form an emulsion. The mixed solution was applied to the TMR load with the maize silage during mixing and fed out to the cows at usual feed times. Blast was applied to all loads and fed to all cattle on the farm (including beef), so that all maize silage fed on the study farms during the trial period was treated with the product.
Plate 4 Timelapse photographs taken every minute
4.3.1.1 Trial 1 protocol procedure • Assess bird numbers and behaviour on the farm for 7 days prior to using treated silage
(time-lapse photography on feeding trough), during the 10 day additive treated period
and continue for 7 days non treated period, a total of 24 days.
• Using the farm’s normal feed, add BLAST to TMR rations via the feeder wagon
according to the manufacturer’s instructions (see above)
• Apply BLAST to open maize silage clamps at the same time as TMR applications and at
the same rate of application, by knapsack sprayer, if clamps are left open during the
day.
• Treat TMR for at least 10 days for all feeding requirements on the farm
• Return to non-treated TMR for 7 days
Table 4-3 Trial 1 calendar
4.3.2 Assessments
Feed loss assessments were made by evaluating loss of quality and volume from fed TMR. Cow access to a 4m section of feed trough was prevented during the period 7am to 5pm and sampling was undertaken when the feed was dispensed (am) and before starlings were on the farm and again after starlings had left at the end of daylight hours (pm). The exposed ration was turned regularly to simulate cow disturbance of the ration. Measurements taken am and pm included:
Project
Farm
Code
Start of
Recording
Date Onto
Trial Date Off Trial Trial Days
Date of Feed
Loss 1
Date of Feed
Loss 2
End of
Recording
Blast B1 21/01/2013 31/01/2013 12/02/2013 12 days 30/01/2013 11/02/2013 20/02/2013
Blast B2 21/01/2013 30/01/2013 13/02/2013 14 days 29/01/2013 12/02/2013 20/02/2013
Blast B3 21/01/2013 31/01/2013 12/02/2013 12 days 30/01/2013 11/02/2013 21/02/2013
Plate 5 Timelapse camera set up

16
• Total weight of TMR (restricted access area only) • Sieving of TMR using Penn State Forage Particle Separator sieves (Department of
Dairy and Animal Science, Pennsylvania State University) to assess ration structure change.
• Sampling for laboratory analysis of feed nutritional value
To determine the effectiveness of Blast as a deterrent, or repellent to starlings, the expected outcomes could be as follows;
• Increased total DMI could result from less faecal contamination by starlings and therefore could provide additional data to support changes in bird numbers
• Lower DMI could result from rejection of treated feed. Rejection of feed could result in the termination of the trial
• Increased milk yield could reflect changes in DMI from less faecal contamination or from lower feed losses from bird feeding
• Concurrent feeding of treated and non-treated maize in different feed areas would not allow for assessment of the effect on total bird number changes on the farm
The following assessments were made to provide data to meet the project objectives;
• Assess any changes in bird numbers or bird behaviour during each treatment period (time-lapse photography on feeding trough and visual assessments)
• Assess any changes in dry matter intake (DMI) between the treated and non-treated feeding regimes. This assessment required liaison with farm staff and the recording of feed usage and any adjustments required to satisfy cow requirements. Feed loss assesments were made before, during and after change in feed times
• Measure feed loss for both treated and untreated feeding regimes. Feed quantity and quality assessments carried out as per method previously undertaken in the 2011/2012 study
• Recording of changes to herd milk yield throughout all assessment periods • Assess cow behaviour with the system changes i.e. lying times
4.3.3 Data quality
The data set of nearly 90,000 time-lapse photographs were manually analysed and scored individually for bird presence and bird numbers. The use of digital photography for monitoring is a useful tool for assessing bird populations, providing accurate counts of bird minutes (birds present feeding for a whole minute), while avoiding estimation subjectivity and disturbance from observers. When estimating the size of large flocks of birds, observers generally overestimate small groups and underestimate large (Bibby, 2000). A low cost digital image counting programme discussed by Perez-Garcia (2012) determined reduced estimation errors, but still manual counting with grids is the preferred option for the initial analysis of the images.
4.4 Trial 2 – Altering the feed time of a once-a-day feeding system
Aims: to assess the potential of changing the feeding time from a once-a-day morning feeding system to an afternoon system, under controlled management conditions and to assess any changes in cow performance or DMI. Exposed feed and open feed stores on a dairy farm are the attracting factor for starlings and the more feed exposed the greater the attraction. The majority of farms feed twice a day or once a day in the morning. Whilst it is important to keep feed in front of cows constantly there could be large benefits from feeding at dusk when birds have left the farm, which would give cows up to 16 hours per day of eating feed untouched by starlings. This straightforward approach is practiced by few farmers due to a largely established morning

17
feeding routine. Showing the potential benefits of a changed routine could be a low cost method of reducing starling numbers by reducing the attractiveness of the farm unit.
By altering the feeding time of a once-a-day feeding system to the afternoon (after the starlings have left the farm), the cows are presented with a fresh ration, uncontaminated and with the correct nutrient value for 16 hours a day before the starlings start their feeding period (08:00 to 16:00). Conclusions made during the previous study (Kingshay, 2012) found that by changing the farm routine to afternoon feeding, the cost of a starling infestation could be reduced, even if the on-farm starling numbers were the same. If the cows alter their feeding routine to mainly over-night, stimulated by the fresh food being presented after afternoon milking, they will respond with changes to their daily behaviour and routines, such as increased lying and cudding time during the day.
4.4.1 Protocol
Time-lapse cameras were set up to monitor a 4m section of cow feed trough on the recruited 2 farms.
The farms were monitored for at least a week prior to a 9 and 10 day trial period. Monitoring continued for a further period of at least a week after the trial. Farm T1 returned to feeding in the morning after the trial period but farm T2 elected to keep feeding at dusk until the end of the winter. Table 4-4 Trial 2 calendar
4.4.2 Assessments for trial 2
The following assessments were made to provide data to meet the project objectives;
• Assess any changes in bird numbers or bird behaviour during each feeding time treatment period (time-lapse photography on feeding trough and visual assessments)
• Assess any changes in dry matter intake (DMI) between feeding time treatments. This assessment will require liaison with farm staff and the recording of feed usage and any adjustments required to satisfy cow requirements
• Measure feed loss for both treated and untreated feeding regimes. Feed quantity and quality assessments carried out as per method previously undertaken in the 2011/2012 study
• Assess cow behaviour and performance with the system changes
4.5 Statistical analysis
Data collected during both Trial 1 and Trial 2 were statistically analysed where this was appropriate.
Photographic images provided a large data set of starling counts which had a positively skewed distribution due to the time when starlings were not present. A statistical Mann-Whitney test was used to analyse this raw dataset based on the sample median.
Average daily counts of starling numbers throughout the days of the trial were compared using a standard t test for independent variables.
Feed loss data was subjected to a statistical two-way analysis of variance test (ANOVA).
All statistical significance is reported at the p=<0.05 level.
Project
Farm
Code
Start of
Recording
Date Onto
Trial Date Off Trial Trial Days
Date of Feed
Loss 1
Date of Feed
Loss 2
End of
Recording
FeedTime T1 05/02/2013 14/02/2013 23/02/2013 9 days 13/02/2013 22/02/2013 01/03/2013
FeedTime T2 05/02/2013 15/02/2013 26/02/2013 12 days 14/02/2013 25/02/2013 01/03/2013

18
5 Results
5.1 Trial 1 results
Trial research hypotheses for Trial 1 were:
H1: The application of Blast feed additive will reduce the level of bird feeding activity on a TMR ration
H2: The loss in feed value of a TMR ration presented to cows will be reduced with the application of Blast feed additive resulting from reduced starling feeding.
The alternative null hypotheses being:
Hо1: Blast feed additive has no effect on the level of starling feeding activity
Hо2: Blast feed additive does not reduce the level of feed value loss resulting from starling feeding
5.1.1 Overall starling numbers
Assessment of starling numbers on the 4m trial feed area every minute throughout the 10 hour day when starlings could potentially be present on the 3 trial farms indicated different levels of daily bird activity between farms. Throughout the 30 day trial period average bird numbers recorded were significantly higher on farm B1 compared with the other two farms (Figure 5.1). Figure 5-1 Average starling count on the 4m observed feed section during the 30 day trial period. DairyCo starling feed additive trial 2013
The trial area on Farm B1 was less prone to disturbance by farm traffic other than during milking and feeding and attracted high numbers of birds throughout the trial with flock size averages (number of birds on the trial farm each day) of more than 5,000 (see Table 5-1). Table 5-1 Average flock size and peak counts on trial area
Farm Maximum bird count
Flock size average
B1 500 9,000
B2 300 3,000
B3 250 2,750
Average count provides an indication of overall starling activity on the trial area although birds were not always on the feed throughout the whole day. The percentage of time that bird numbers on the trial area were greater than zero is shown in Table 5-2.
0
20
40
60
80
B1 B2 B3
Ave
rage
sta
rlin
g co
un
t
Farm
19
Table 5-2 Average time starlings were feeding on the trial area throughout the trial period
Farm B1 had a consistently higher percentage of the day when starlings were feeding on the trial area as well as having higher starling numbers. These figures are only representative of the trial area and starlings are almost certainly on other parts of the farm at the same time and also during times when they were not present on the trial area.
Farms B2 and B3 had feed areas where a greater chance of human activity occurred which had a day-to-day influence on the starling activity. This is very much the nature of dairy farms where daily routines are often spread over large parts of the day as well as regular, having many ancillary activities occurring over time.
These figures are based on one minute intervals and it is assumed that starlings fed, on average, for the full one minute period. Observations indicated that birds will feed for periods in excess of one minute providing they are not disturbed and there is an ample feed source.
5.1.2 Starling numbers pre, post and during feed additive treatment
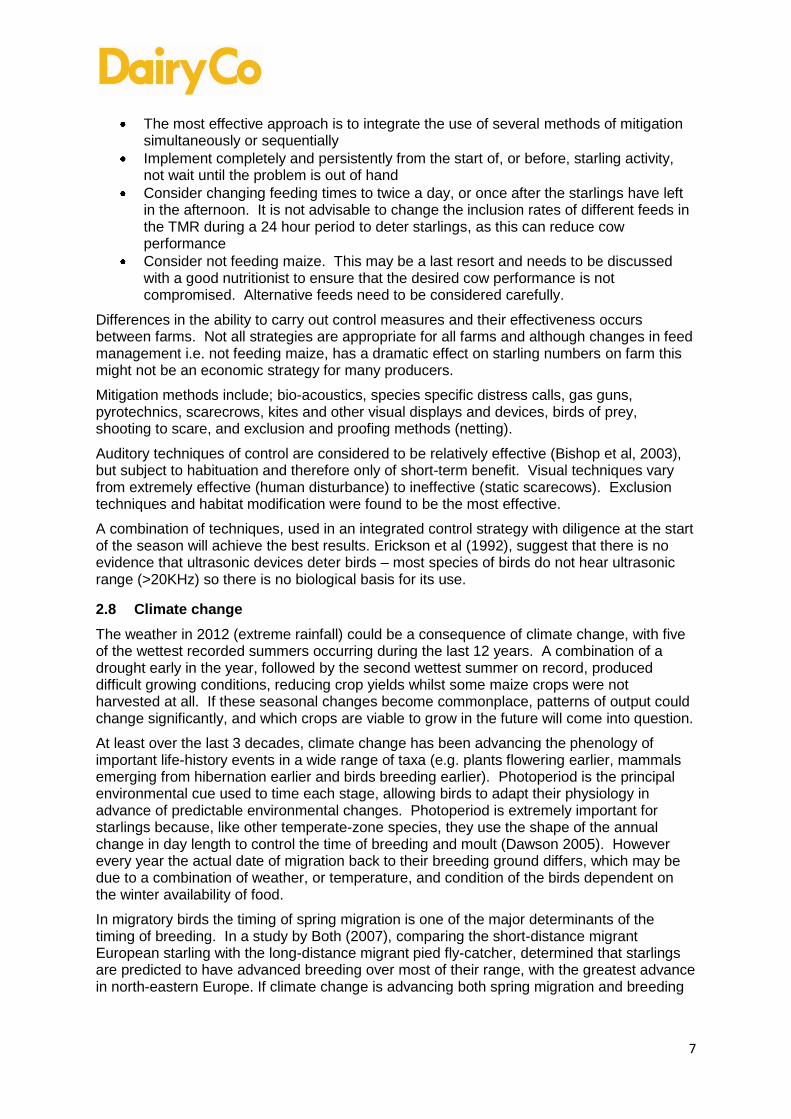
Results from data recorded over the trial period indicated no consistent changes as a direct result of applying the starling preventative product Blast to the TMR on all three farms. Figure 2 presents the results of the average daily starling numbers on the trial area on each of the 3 farms over the 30 day trial period.
Figure 5-2 Average daily starling count throughout the trial period. DairyCo starling feed additive trial 2013
Data produced from the trial throughout each day was positively skewed due to the periods where no starlings were present. A statistical Mann-Whitney test indicated significant differences between no additive and additive treated periods based on the sample median (see Table 5-3).
0
20
40
60
80
100
120
140
160
Ave
rage
sta
rlin
g co
un
t
B1 B2 B3
Farm
Percentage of day starlings fed on the trial area
%
B1 38.9
B2 21.8
B3 17.6

20
Table 5-3 Starling counts descriptive data
Farm and treatment N Daily Mean Standard Deviation
SE Mean Significance P<0.05
B1 untreated 4925 35.26 67.30 0.959
B1 additive applied 5374 76.37 101.37 1.38 0.000
B2 untreated 4207 17.64 44.74 0.690
B2 additive applied 7348 24.77 50.26 0.598 0.000
B3 untreated 4903 18.06 45.57 0.651
B3 additive applied 5851 18.83 44.38 0.580 0.67
N = daily mean of observations i.e. number of images, number of counts. See Trial 1 protocol 4.3.1.
No significant benefit was determined from using the product to reduce starling numbers. Significant differences between additive treatment and no additive treatment periods, B1 and B2, were both for greater starling numbers during the additive treatment period.
The increased starling numbers during the additive treatment period are likely to have been a result of an overall increase in the number of birds on the farm and not specifically due to the feed additive. The additive application did not appear to have any limiting effect on the steadily increasing starling population. Farm B3 had no significant difference between additive treated and no additive treated periods.
Similarly, when analysing the data for the percentage of time that starlings were present on the trial area during the course of the day the results show a similar trend (Figure 5-3).
Maximum starling persistency, as measured by the percentage of time starlings were present, varied between the three farms. Farm B1 and B2 both had their maximum persistency whilst the additive was being applied with a maximum of 59% and 51% persistency respectively, whereas B3 peaked at 39% persistency during the post additive period. These percentages are for the trial area alone indicating the very high level of bird feeding on all farms throughout the trial period.
0%
10%
20%
30%
40%
50%
60%
70%
Pe
rce
nta
ge o
f ti
me
sta
rlin
gs w
ere
o
bse
rve
d in
th
e t
rial
are
a
B1 B2 B3
Figure 5-3 Percentage of time starlings were present in the trial area during each day. DairyCo starling feed additive trial 2013

21
The average percentage of starling persistency throughout the trial period was evaluated for the three trial periods (Table 5-4).
Table 5-4 Percentage of records where starlings were present
Farm Pre treatment During treatment Post treatment
B1 21.3 42.4 46.2
B2 19.9 27.5 14.7
B3 17.1 19.5 13.5
The results clearly indicate that on all three trial farms the percentage of time that starlings were present on the trial areas was greater during the treatment phase compared to the pre-treatment period. For two out of three trial farms the percentage of starling presence declined after the additive was stopped in the post treatment period. During the trial period the average flock size across the farms were assessed by both visual observation with vantage point surveys and gridded digital photograph counting and are shown in Table 5-5.
Table 5-5 Average flock size during the DairyCo starling feed additive trial 2013
Average Flock size
Farm Pre During Post
B1 4,000 5,000 7,000
B2 3,000 3,000 2,700
B3 2,900 2,750 2,500
5.1.3 Starling activity during the day
Average daily starling numbers were calculated and a standard t test statistic was used to determine any significant differences between the means. Table 5-6 Descriptive statistics and significance of mean variation for average starling numbers occurring throughout the trial period on 3 trial farms. DairyCo starling feed additive trial 2013
Mean Standard error
Farm No treatment Additive treated No treatment Additive treated Significance P
B1 72.3 75.6 10 6.4 0.79 B2 15.8 24.0 2.2 3.4 0.06 B3 14.8 17.1 2.4 3.0 0.56
No significant differences were determined on any of the 3 farms between no additive treatments and additive treated periods. Patterns of starling activity during the day showed little correlation between farms although some degree of consistent activity during the day on a specific farm was apparent (Figure 5-4).

22
Figure 5-4 Average starling numbers throughout the day during the trial period on the 3 trial farms. DairyCo starling feed additive trial 2013
Farm B1 had a tendency for bird activity to build during the day and peak around 13.00 hours. This occurred at different levels throughout the trial period although the activity pattern remained similar.
Farm B2 maximum bird activity had a tendency to be earlier in the day at approximately 11.00 am. Farm B3 had a similar tendency as B1 for bird numbers to peak around 13.00 hours although by the end of the trial period bird numbers were generally beginning to decline relative to the pre-treatment and the additive treatment period.
5.1.4 Feed loss
Average weight loss for the feed loss assessment indicated no benefit from the application of the feed additive. No statistical differences were measured between feed loss with an additive applied compared without the additive (Table 5-7).
Table 5-7 Feed loss resulting from starling feeding
0
100
200
300
7 9 11 13 15 17
Ave
rgae
bir
d
cou
nt
Farm B1 On trial Pre trial Post trial
0
20
40
60
7 9 11 13 15 17
Ave
rgae
bir
d
cou
nt
Farm B2
0
20
40
60
7 9 11 13 15 17
Ave
rgae
bir
d
cou
nt
Time of the day, 00 hours
Farm B3
Farm Feed weight loss%
no additive Feed weight loss%
with additive Significance
p=0.05
B1 6.53 6.96 0.49
B2 4.91 4.78 0.59
B3 4.54 5.08 0.28

23
Feed quality analysis from samples taken from freshly delivered TMR rations before bird arrival (am) and at the end of daylight hours when bird feeding had ceased (pm) are presented in Table 5-8. Statistical analysis is by 2 way ANOVA.
Table 5-8 Change in feed values between am and pm feed sample analysis with and without the application of the feed additive Blast
ME MJ/kg DM
Starch NDF Oil Dry
Matter Crude
Protein % % % % %
No additive am 10.73 15.02 42.52 3.29 40.43 13.55
No additive pm 10.37 11.83 44.26 3.16 38.8 14.21
Additive am 10.77 16.26 38.8 3.88 43.33 14.12
Additive pm 10.37 12.84 42.11 3.98 36.77 14.57
Significance p=<0.05
Time of day 0.045 0.021 0.088 0.992 0.295 0.371
Additive or no additive 0.952 0.367 0.054 0.326 0.909 0.454
*Figures in bold = statistically significant P = < 0.05
The results indicated statistically significant (p=<0.05) differences in ME and starch between am and pm. There was no significant difference between other feed parameters or between feed additive treatments.
Assessment of other parameters detailed in 4.3.2 showed no significant change;
• No Δ in DMI
• No Δ in milk yield
• No Δ in cow behaviour
5.1.5 Summary of trial 1
No evidence was determined to advocate the use of the feed flavouring BLAST as a
deterrent of starlings under the conditions specific to the trial. Starling numbers remained
the same or more during the period where the feed additive was applied. TMR loss, both in
percentage reduction and feed value, was not improved during the period where feed
flavouring were applied.
The research hypotheses H1 and H2 (the application of Blast feed flavouring will reduce the
level of bird feeding activity on a TMR ration and/or will reduce the loss in feed value of a
TMR ration) are rejected. Null hypotheses Hо1 and Hо2 (Blast feed flavouring has no effect
on the level of starling feeding activity and/or does not reduce the level of feed value loss
resulting from starling feeding) are accepted.

24
5.2 Trial 2 results
Trial research hypotheses for Trial 2 was
H1: Changing the time of feeding from once a day in the early morning to once a day in the late afternoon will reduce the level of starling feeding activity on a TMR ration
H2: The loss in feed value of a TMR ration presented to cows will be reduced by changing the feeding time from once a day in the early morning to once a day in the late afternoon, resulting from reduced starling feeding.
The alternative null hypotheses being:
Hо1: Changing the feeding time from once a day in the early morning to once a day in the late afternoon has no effect on the level of starling feeding activity on a TMR ration
Hо2: Changing the feeding time from once a day in the early morning to once a day in the late afternoon does not reduce the level of feed value loss resulting from starling feeding
5.2.1 Overall starling numbers
Assessment of starling numbers on the 4m trial feed area every minute throughout the 10 hour day when starlings could potentially be present, indicated similar levels of daily bird activity between the two farms (Figure 5-5).
Figure 5-5 Average starling count on the 4m observed feed section during the 30 day trial period. DairyCo starling feeding times 2013
Large starling flocks were consistently present on the farm prior to the beginning of the trial (Table 5-9). Table 5-9 Average flock size and peak counts on trial area
Farm Maximum bird count
Flock size average
T1 200 7,000
T2 400 8,000
Average count provides an indication of overall starling activity on the trial area although birds were not always on the feed throughout the whole day. The percentage of time that bird numbers on the trial area were greater than zero is shown in Table 5-10.
0
10
20
30
40
50
T1 T2
Ave
rage
sta
rlin
g co
un
t

25
Table 5-10 Average time starlings were feeding on the trial area throughout the trial period
Differences between the two farms are indicative of the total feed area available in relation to starling flock size, i.e. farm T2 had greater feed trough availability relative to total flock numbers, compared with farm T1.
These figures are based on one minute intervals and it is assumed that starlings fed, on average, for the full one minute period. Observations indicated that birds will feed for periods far in excess of one minute providing they are not disturbed and there is an ample feed source.
5.2.2 Starling numbers pre, post and during feed time change
Figure 5-6 presents the results of the average daily starling numbers on the trial area on each of the 2 farms over the 25 day trial period.
Figure 5-6 Average daily starling count throughout the trial period. DairyCo starling feed timing trial 2013
Data produced from the trial throughout each day was positively skewed due to the periods where no starlings were present. A statistical Mann-Whitney test indicated significant differences between the different feed time periods based on the sample median (Table 5-11).
0
10
20
30
40
50
60
70
80
90
100
Ave
rage
sta
rlin
g co
un
t
T1 T2
Farm
Percentage of day starlings fed on the trial area
%
T1 51.2
T2 36.7
pm feeding period T1
pm feeding period T2

26
Table 5-11 Starling counts descriptive data
Farm and treatment N Daily Mean Standard Deviation
SE Mean
Significance
P = < 0.05
T1 am feeding 4962 36.85 41.23 0.59 0.000 (am v pm)
T1 pm feeding 5039 31.8 39.25 0.55
T1 return to am feeding 3586 35.81 38.76 0.65 0.000 (pm v am)
T2 am feeding 5183 54.82 72.75 1.05 0.000 (am v pm)
T2 pm feeding 5139 47.07 65.3 0.91
T2 pm feeding continued 3572 12.32 35.73 0.75 0.000 (pm v pm)
A significant difference was identified from the change in feed times although the presence of starlings was still high.
At the end of the trial pm feeding period farm T1 returned to an am feeding system and farm T2 continued with a pm system. The indications were that the benefits of changing to a pm feeding system were emphasized by the subsequent change in starling numbers, T1 had an increase and T2 had a decline in numbers.
The results after the end of the initial pm feeding period need to be qualified by the overall changes in starling populations at that time. Weather conditions began to improve and bird numbers and activity were not necessarily consistent with the previous period as the starlings began to prepare for their return to their breeding areas.
Data for the percentage of time that starlings were present on the trial area during the course of the day show a similar trend (Figure 5-7).
Figure 5-7 Percentage of time starlings were present in the trial area during each day. DairyCo starling feed additive trial 2013
The average percentage of starling persistency throughout the trial period was evaluated for the two trial feeding times (Table 5-12).
0%
10%
20%
30%
40%
50%
60%
70%
80%
90%T1 T2
pm feeding period T1
pm feeding period T2

27
Table 5-12 Percentage of records where starlings were present
Farm AM feeding PM feeding
T1 51.3 46.8
T2 49.4 42.6
During the trial period the average flock size across the farm as assessed by vantage point survey and gridded digital photography counts are shown in Table 5-13.
Table 5-13 Average flock size during the DairyCo starling feeding times trial 2013
Average Flock size
Farm Pre During Post
T1 3500 5,000 7000
T2 2900 2,750 2500
5.2.3 Starling activity during the day
Average daily starling numbers were calculated and a standard t test statistic was used to determine any significant differences between the means. Table 5-14 Descriptive statistics and significance of mean variation for average starling numbers occurring throughout the trial period. DairyCo starling feeding times trial 2013
Mean Standard error
Farm am feeding pm feeding am feeding pm feeding Significance P
T1 36.5 31.8 4.1 3.0 0.38
T2 48.1 36.8 8.2 4.2 0.24
No significant differences were determined between am and pm feeding systems based on daily average bird numbers. Daily fluctuations in starling numbers are normal and therefore larger datasets are required to provide statistical significance at the p<0.05 level. Reducing data to averages per day i.e. 500 datum to 1, will affect the degree of certainty for significance. Nonetheless bird numbers were shown to decline with the change in the system albeit without statistical confirmation.

28
Patterns of starling activity during the day remained relatively consistent (Figure 5-8).
Figure 5-8 Average starling numbers throughout the day during the trial period on the 2 feed time trial farms. DairyCo starling feed additive trial 2013
Farm T1 had a tendency for peak bird numbers at the beginning of the day with a gradual decline as the day progressed. Changing the feed time did little to change this behaviour.
Birds arrived early at farm T2 for an early feed. With am feeding numbers then declined by early morning to a relatively constant average of approximately 50 during the remainder of the day until mid-afternoon when they left. The change to pm feeding saw a similar pattern but with a decline to an approximate average of 30 during the day. Early morning starling activity declined considerably during the extended pm feeding period.
5.2.4 Feed quality and volume loss
Average weight loss for the feed loss assessment indicated a significant difference between am feeding and pm feeding. Farm T1 recorded a reduction in feed loss of 1.1% (equating to a fall in feed loss from 1.8kg/cow to 1.6kg/cow), and farm T2 a reduction of 1.8% i.e. a fall in feed loss from 1.84kg to 1.4kg (Table 5-15).
Table 5-15 Feed loss resulting from starling feeding, feed timings trial
Farm Feed loss% am feeding
Feed loss% pm feeding Significance p<0.05
T1 8.00 6.88 0.00
T2 8.05 6.27 0.00
0
20
40
60
80
100
7 9 11 13 15 17
Ave
rgae
bir
d c
ou
nt
Farm T1 am feeding
pm feeding
Post pm feeding (am feeding)
0
20
40
60
80
100
120
140
7 9 11 13 15 17
Ave
rgae
bir
d c
ou
nt
Time of the day, 00 hours
Farm T2 am feeding
pm feeding
Post pm feeding (continued pm feeding)

29
Feed quality analysis from samples taken from freshly delivered TMR rations before bird arrival (am) and at the end of daylight hours when bird feeding had ceased (pm) are presented in Table 5-16. Statistical analysis is by 2 way ANOVA. Table 5-16 Change in feed values between am and pm feed sample analysis. Am and pm feeding times trial 2013
ME MJ/kg
DM
Starch NDF Oil Dry
Matter Crude Protein %
% % % %
am feeding, am 11.10 16.64 41.19 4.75 41.10 14.31
am feeding, pm 10.55 12.63 42.85 4.17 38.05 14.10
pm feeding, am 10.60 16.00 44.49 4.04 41.10 14.13
pm feeding, pm 10.35 13.82 45.20 3.98 38.90 14.36
Significance p=<0.05
Time of day (am/pm) 0.006 0.05 0.018 0.743 0.007 0.527
Time of feeding (am/pm) 0.035 0.765 0.013 0.329 0.669 0.967
*Figures in bold = statistically significant P = < 0.05
The results indicated statistically significant (p=<0.05) differences in ME, starch and NDF between samples taken before and after starling feeding (am and pm). There was also significant differences for ME and starch percentage between am and pm feeding systems. These results provide confirmation that starling feeding activity was reduced. Trends were consistent between farms i.e. no interaction between farms within the trial.
The combination of feed quality and volume losses equates to approximately £44 per cow per 100 days of starling infestation (dependent on milk price and feed costs), £16 for loss in feed quality and £28 for loss in feed volume. The breakdown of this cost can be found in Appendix 1.
5.2.5 Stakeholder feedback and farm observations
Farm production parameters and observations when feed time was changed to a pm feed:
Farm T1
Initially cow DMI went down when feed time was changed
Feed consumption fell by 0.4kg/cow. Milk yield went up by 0.4L/cow during pm feeding period, compared to am feeding (because cows were eating better quality feed)
Cow behaviour altered to adapt to the new system, and more lying time was observed during the day.
Unacceptable change to existing routine for some staff members, meant that the farm could not adopt the new system at that time, but they would consider changing from the beginning of the winter next year
Farm T2
Initially DMI went down, by 200 kg (0.6 kg/head/day) on the first day of changing to pm feeding, then a further 400kg (1.2 kg/head/day) on the second and third day and returned to normal on the fourth day.
The farmer was alarmed at the drop of intake initially, together with loose, pitted dung from the cows. At the same time a new maize silage pit was opened, which could also explain the dung.
The cows’ lying time changed to the middle of the day and also the afternoon milking was much shorter as the cows were keen to get out of the parlour for feeding time.

30
The change in the feeding system did not cause any disruption to the farm or staff routines as the farmer himself fed the cows and he continued feeding in the afternoon even after the starlings had left
No change in milk yield.
The farmer has indicated that he will continue the change of policy of feeding in the afternoon, but will start before the birds are due to arrive i.e.by the end of October, as he thinks he will get even greater benefit next year in terms of reduced losses.
5.2.6 Summary of trial 2
The trial results indicated that there is some potential to reduce the starling numbers feeding
on a TMR ration throughout the day by changing the feeding to a once a day pm feed.
Average numbers dropped on both farms in the trial which was statistically significant. Daily
averages dropped but this was not statistically verified.
Feed weight loss was reduced by 1.1% and 1.8% for farms T1 and T2 respectively and feed
nutritional value reduction was also less with the pm feeding system.
The combination of feed quality and volume losses equates to approximately £44 per cow
per 100 days of starling infestation (dependent on milk price and feed costs).
The research hypothesis H1, changing the time of feeding from once a day in the early
morning to once a day in the late afternoon will reduce the level of starling feeding activity on
a TMR ration is therefore accepted. Likewise the research hypothesis H2, the loss in feed
value of a TMR ration presented to cows will be reduced by changing the feeding time from
once a day in the early morning to once a day in the late afternoon, is also accepted.
Changes in DMI and cow behaviour were assessed by farmer feedback. Disturbance
appeared to be short-lived and intakes and milk production were not adversely affected, and
in fact a lift in milk production was experienced. The change in staff routines was the biggest
challenge to the implementation of changing feeding times from the morning to late
afternoon, particularly at weekends.

31
6 Mitigation Case Studies
6.1 Farm CS 1
This case study comprises the farm that had the highest degree of starling infestation during the 2011-12 study. However, with new initiatives in place early in the 2012/13 starling season the farm has managed to reduce the infestation level significantly. Several methods have been employed together with a change in the feeding time of the milking cows, to the afternoon. Successful mitigation methods implemented this season include;
Changing the time of feeding
Flying a bird of prey (Harris Hawk) for starling control
Employing a man to shoot to scare, daily
Using auditory scaring devices
Deployment of bird-scaring rockets as starlings descend on the farm around 8.00 am
High levels of disturbance, using farm staff to prevent starlings descending on farm at daylight
The main aim was to reduce the cost of starlings to the farm, in terms of losses of milk, feed and feed value. The larger the herd, the larger the feed source and consequently the greater potential for feed losses, and greater cost to the farm.
6.1.1 Changing the timing of feeding:
The key element to the change in farm policy this year (2012/2013), was the decision to change from 2 to 3 times a day milking, which had a significant effect on labour routines. The reason for changing the time of feeding from early morning to the afternoon was due to the change in routines for 3 times a day milking. There have been many benefits for changing the feed time including reduced costs, by spreading the work load through the day enabling the reduction of one labour unit in the mornings. Feed management and decisions were made easier by having less pressure on the feed operator, adjustments could be made during the middle of the day instead of hurried at 04.00 am or left until the next day. This has also had a positive effect on cow performance (pers. comm. farmer). Increased tractor and human activity around the farm buildings, silage pits and feed stores during the day helped to discourage starlings from these areas which were heavily infested the previous year.
6.1.2 Employing a man to shoot to scare:
A local shooting enthusiast has been employed during the winter specifically for starling control. His duties began in early October (before the migrant starlings arrived) to shoot to scare, making 2 or 3 visits to the farm a week and patrolling the farm between 9.00am and 1.00 pm, for which he is paid £7 an hour. A personal licence application WML-A08 from NE has been authorized to enhance existing scaring methods with lethal shooting, with a limit of 50 starlings a year. Displaying the dead birds was found to deter other starlings landing.
6.1.3 Auditory scaring devices:
During the study period in 2011/12 observations were made about the lack of effectiveness of auditory devices. Bio-acoustic distress call units were set up on timed sequences which were changed regularly. On several farms, including this one, we have observed habituation with these types of devices. Frequent sequence changes or frequent changes to device location and species cards is essential.
6.1.4 Deployment of bird-scaring rockets:
Rockets were used last year, but this last season it was decided to use them as part of the concentrated programme to have several methods acting together at the beginning of the

32
day (around 8 O’Clock) to prevent starlings descending on the farm. Over 140 were used, at a cost of £15 for a box of 10.
6.1.5 Flying a Harris Hawk:
This is the main focus, and the most popular of the mitigation methods used on this farm. The Hawk was bought last summer, when he was 4 months old, to build a bond with the trainer/ handler on the farm.
The responsibility of training and flying the hawk has been taken on by a member of the farm staff who is extremely enthusiastic and although 1-2 hours a day are allocated to flying (patrolling the farm) a great deal more time is put to this activity, which is not seen in the costings of the activity, such as familiarisation and set-up (see table 6-1).
The first stage in the training process is ‘manning’, getting the wild bird associating the human as a source of food. The bird is weighed daily and gradually its weight is reduced to a flying weight of 1lb 9.25oz. It is important to keep the bird hungry in order prevent it from flying away.
The hawk was flown daily, after the ‘gun’ had finished his shooting to scare rounds (see Plate 6). The handler releases the bird who then perches on a high vantage point and then flies on. They patrol the farm for one to two hours. The hawk will not chase or catch starlings, unlike a sparrowhawk, but this activity successfully keeps the starlings away from the farm buildings. Information on using a contractor for hawk control is in Appendix 2.
6.1.6 Outcomes
For this farm the starling control strategy has been very successful, dramatically reducing starling numbers seen on the farm compared to last year when the infestation recorded flocks of between 30-50,000 birds.
Implementation of mitigation methods this year has been consistent and diligent which has reduced the infestation level to 10% of what it was last year, making the overall strategy cost effective.
Table 6-1 Farm CS1 Starling mitigation details
* See Appendix 2 for set up costs for flying a bird of prey
Plate 6 Hawk perching during flying exercise in January 2013
Method Cost Frequency
Changing time of feedingReduced cost of drop of
labour unit early morningDaily from am to pm
Flying a bird of prey £3,045.00* Staff time 1-2 hrs daily
Employed staff for shooting £7.00 / hr 9.00-1.00, 2-3 /week
Cartridges @ £6.00 box of 25
Pyrotechnics - rockets 140-150 used £15 box of 10 Daily
Auditory - electronic distress calls £585 Random settings daily
Gas gun £330-450 Random settings daily
Rope bangers £34.50 for 12 Daily
Shooting to scare licence Free to apply each year

33
6.2 Farm CS 2
The farm has a history of well-established starling infestation over at least a decade in the older dairy unit and the neighbouring farm, and for the last 3 winters in the new unit. The new unit is well designed and a very good environment for the dairy herd, but the open ends, sides and roof ridges allow starlings free access to the internal feed passages and water troughs. The design of the cow buildings make them suitable for netting to achieve complete exclusion, as all troughs are internal.
There is a high degree of fouling on the gates, rails, equipment and walls from the large flocks that feed and perch during the day (see Appendix photographs).
In a perfect world a new build would incorporate starling infestation mitigation, which can be achieved with exclusion using netting, roller screens, doors and panels, ventilated panel walls or netting in rolls for DIY fixing. See Appendix 3 for more details of products to prevent birds from entering buildings.
Scaring devices are used from the beginning of the season, together with shooting to scare by farm staff. Farm infestation levels are established both on the new and old dairy unit and also the neighbouring farm which is only a few meters away. The starlings fly between farms all day and perch in the trees between the farms.
6.2.1 Costing for exclusion of birds with netting to reduce losses incurred by starling activity
The minimum gap size that a starling can get into a building and feed source is 28mm (a little over an inch). If the gaps between the space boarding is more than that, starlings will enter this way, if Canadian boarding is not implemented (alternate overlapping spaces).
The requirement for starling exclusion is netting with a hole size of <28mm. Appendix 3 illustrates the requirements for this farm. The high, end openings of the feed passages would be more suitably secured with either roller screens or roller doors, to provide easy access for lorries and tractors which can be closed after working. The chain driven roller doors offer greater security with the galvanized steel guide rails providing no gaps at the side where starlings can get in. To change these openings from the roller screens to roller doors or to roller doors where there is no protection other than metal gates, is estimated to cost £5,470 on this farm.
The total area to be netted amounts to 839.13m2. The material cost for netting ranges from about £320 (for fruit cage netting, probably not robust enough to last a complete starling season) to £1,200. This is based on DIY installation and labour fitting charges to be added. It will probably be necessary to replace the netting every year to ensure effective exclusion.
An alternative to netting the bays at the north east elevation, could be to install Galebreaker Bay screens, secured with ratchets and including edge protectors. The three and four bay lengths will be covered to a height of 3 meters and is estimated to cost £240 and £475 respectively. The product range from Galebreaker also include bottom opening electric rolling door systems, which may be more suitable for some farms.
Total cost = £6309.13 + labour. Costs, elevation pictures and measurements can be seen in Appendix 3.
Good building ventilation is vital to maintain healthy, productive cows; reducing infections, respiratory conditions and heat stress. This is the reason why new building design often maintains large open sides and reduced areas of space boarding. However, this type of building offers no resistance to starlings. Netting, or using temporary screens and doors can alter the ventilation within the building, but will not reduce airflow as much as space boarding. Mitigation methods can reduce airflow into the building by up to 50% and

34
therefore increased levels of exclusion materials may result in the need for more ventilation by increasing building inlet and outlet openings, or by installing fans, to improve airflow.
6.3 Farm CS 3
This 200-head high yielding herd was included in the study last year as a farm maintaining a low infestation score resulting from early season and persistent mitigation. The farm is the farthest west located of the study farms and near to the Somerset Levels roosts. The farm has a history of heavy starling infestation but has reduced the numbers seen on farm by implementing effective mitigation, together with diligent maintenance.
The cows are housed in a single span cubicle building with a central feed passage. An extension to the cow building was completed in 2011 but the end of the extension was left open above the access gates, even though space boarding and mitigation netting was in place everywhere else. This left them vulnerable to a starling infestation during the winter 2011/12. Many mitigation methods are used on this farm and were initiated because of a severe starling problem experienced 5-10 years ago. The farm is vigilant with mitigation at the beginning of the season and because of this the numbers of birds have not been a problem for a few years. However they are experiencing some predation on the calf feed and outside poultry feeders. The farm reported fewer birds this year (2012/13) than any other, and no birds recorded after February.
Methods included; covering maize silage face, netted buildings, scaring devices, shooting to scare and displaying dead birds (see Plate 8). The maize silage pit is kept covered with black plastic sheeting at all times. Netting used is small gauge gaps <28mm on all exposed areas i.e. the roof ridge, open areas above and below gates, ends with no weatherboarding and gate handle openings. Doors to the cow building are kept shut at all times which completes exclosure.
During the 2011/12 study period the starling problem (numbers) was assessed to be 1 (0 – 5, where 0 = no birds and 5 = heavy infestation), which meant almost total exclusion from the cow building and a score of 1 in the calves/youngstock buildings. The previous year was scored at 3 (see Kingshay 2012)
Before the 2012/13 starling season netting to the end of the building was completed for just £200, as there was some netting left over from previous maintenance. The netting is usually replaced every year at a cost of £2,000. Starling scores this year were assessed as 0 in the cow building and 1 for the calf area, although the farmer felt that there was no problem this year.
6.4 Farm CS 4 & 5
This is a mixed farm of 850 acres, growing 200 acres of wheat and maize, grass and Italian Ryegrass leys, and also producing early Dorset lambs from a flock of 600 ewes, and poultry. Situated between the two units is a traditional orchard, providing useful perching for the large starling flock sharing both farms as feeding sites. Starlings also use the telegraph wires for perching, alongside another orchard on the far side of the newer 180 cow unit. Grass fields surround both farms and these provide starlings with grazing for invertebrates and large
Plate 8 Netting to end gates (top), covered maize silage clamp

35
numbers are often observed grazing these fields, particular when the sheep are also grazing. Farm system details can be found at 4.2.
Cow health issues have been reported; Salmonella mbandaka has been identified on the farm by the vet and also found in screened starling droppings. Treatment in cows has proved successful if caught early enough, although a milk drop, sickness, shortened lactation and associated displaced Abomasums (DAs) have been linked with starlings. Fouling from starlings is a particular issue, winter dysentery occurs in the cows and calf scours are thought to be associated with starlings. Calves are reared in a new, well ventilated, open, purpose-built building, also suffering from starling depredation. As a consequence, the calves are fed concentrate at night only. Young beef animals are not fed maize.
The farmer has reported an interesting observation, reporting the presence of a rare albino starling two years running in 2009 and 2010, suggesting that the same birds return to a favoured farm year after year.
An uplift in milk production, of 2 – 3 litres per cow, has been observed after the starlings have left the farm for the spring migration. Last year (2011/12) feed loss and bird numbers were calculated to be the second highest of the participating farms with average feed loss of 8.5% and an average starling infestation of ~ 9,000 birds and an average mitigation score. The 2012/13 study has reported a similar average flock size and feed loss slightly less (6.5%).
6.4.1 CS4 Mitigation measures
Starlings are present on both inside and outside troughs, but more outside. None of the inside troughs, outside troughs or the buildings have proofing; they are open and therefore suffer from heavy starling depredation. Roller blinds are in place on the straights yard.
The main mitigation methods used on this farm are the bio-acoustic distress call devices, gas gun and shooting to scare. The buildings are not suitable for netting, although some areas could potentially have some coverage. The main feeding area for the milking cows is the outside troughs (Plate 4) with central passage. This area has a great deal of fouling and is visited regularly by large number of birds (>5,000 birds).
6.4.2 CS4 Recommendations
Potential mitigation for this area would be to extend the roof area to cover the whole yard and add gates either end of the yard with netting, Galebreaker doors or roller blinds, space boarding or ventilated cladding to the ends, i.e. enclosing the yard, but still providing tractor access.
The clamps can be covered with a sheet or net, however it was reported to be unnecessary last winter as starling depredation was less of a problem in this area of the farm than in previous years.
6.4.3 CS5 Mitigation measures
The building design on the two farms is significantly different, the modern unit with new parlour, cow building and handling equipment being built a couple of years ago. Some proofing of the cow buildings is in place on this farm which achieves relative exclusion with ridge netting, roller blinds, metal-framed meshed extensions (cost £200-300 per gate) to the end gates and newly installed covers to automatic scraper gaps(materials cost of ~£20 per gap, which do not entirely prevent starlings from getting into the building. Starlings enter the

36
building in large numbers when the feed passage doors are open for feeding. The ‘open’ milking parlour has parlour-feeders with close-fitting lids preventing starling access.
6.4.4 CS5 Recommendations
With better implemented mitigation on this farm, the numbers of birds having access to feed could be reduced. However this may be at the expense of the other farm (CS4) where it is not so easy to proof the feed troughs and buildings, potentially causing an increase in the number of birds there, as the feed source is shared by both farms. To be wholly effective, both farms need high levels of mitigation in place at the beginning of the season to reduce the attractiveness of the farm and to deter starlings from establishing the farms as a feed source.
6.5 Farm CS 6
This award-winning family farm was established in the early 1970s. The farm totals 1,600 acres, 1,000 of which are arable, with a main enterprise of a 500 head herd of high-yielding Holstein/Friesians and also poultry units of 2.4 million broilers. The housed all year round dairy herd is milked 3 times a day and yields almost 10,500 litres,
The farm does not have many trees around the farm, although a few have been planted along the farm track, near the dairy unit. These are still young and not as attractive for perching as they will be in a few years’ time. The farm has had a starling mitigation strategy for a few years, after experiencing a severe problem during the last decade.
The farm strategy for starling control aims to prevent starlings landing on the farm so that the response of feed site selection is never learned by the starlings. This has been very successful in reducing starling numbers to almost no birds at all.
Several mitigation methods are adopted before the starlings arrive and a concerted effort is made at the beginning of the season so the birds do not settle on the farm. A staff member takes on shooting duties, patrolling the farm every morning with shooting to scare under licence, at an annual cost of about £4,000. Bio-acoustic (auditory) scaring devices have been used but with little success, so the demonstration unit tested on site for a MGA (Maize Growers Association) meeting was not purchased, as they could not see the cost benefit of the product. Many rope bangers are used every morning, at random times and locations around the farm. The mitigation score allocated to this farm in the 2012 Kingshay study was 13, with a bird score of 0 (the total mitigation scores for participating farms ranged from 6 to 13, where scores of 1 -5 were applied for each mitigation method used, 1 = used and 5 = very effectively used). The combination of mitigation that this farm implements is both cost effective.
The nearest neighbouring dairy farm is only half a mile away but it also achieves complete starling exclusion with netted cow buildings. This dual strategy between close farms works well to deter starlings from the area.

37
7 Discussion
Although starlings are in decline, problems associated with a winter infestation are still experienced by dairy farmers across the UK. These include high costs from feed loss, loss of milk production and cow performance, estimated to be 3ppl (Kingshay 2012), as well as hidden costs of poor fertility and pathogenic disease.
The effectiveness of mitigation management practices and a product with potential to reduce starling infestations on farms was determined; the product BLAST® used as a flavouring additive on TMR for cows was shown to be ineffective, and putting the cow ration out in the afternoon, after starlings have left the farm, rather than the morning has been shown to be effective for reducing starling infestation losses.
Starlings are not likely to go away, and as long as they continue to migrate to the established winter roosts, they will trouble those dairy farms selected for feeding opportunities. The only option currently available to farmers is to make every effort to mitigate against the problem early, and preferably before the migration period begins, to prevent the farm from becoming an established winter feed source. Once winter feeding preference has been made by starlings it is very difficult to implement successful control measures, even though there are a multitude of products on the market claiming to provide a solution to the problem.
The effectiveness of mitigation methods very much depends on their suitability for the individual farm, together with timing and the level of diligence and persistency of implementation. Building design on the farm will not only influence the carrying capacity of the starling infestation but also the ability to implement adequate mitigation. Mitigation success will also depend on the attractiveness and availability of feed sources (other farms) in the locality or near the farm.
The most effective approach is to integrate the use of several methods of mitigation simultaneously or sequentially (Kingshay, 2012). An integrated approach using a variety of techniques is likely to be more effective and reduce habituation rates (Bishop et al, 2003). Individual control measures have varying levels of effectiveness if used on their own, and this is difficult to measure.
Changing feed times from the traditional morning feeding is a logical approach to reducing starlings and can often be implemented with no extra costs. The monetary value of savings made by changing to this system, for the combination of feed quality and volume losses, equates to approximately £44 per cow per 100 days of starling infestation (dependent on milk price and feed costs). Birds naturally require feed at the start of the day and are likely to be attracted to the feeding sites that provide the best opportunity to supply their nutrient requirements at this time of day. A low volume of feed availability, as cows clear up feed from the day before, is less attractive than a fresh feed with maximum volume and feed nutrients. This system has the potential to reduce the amount of faecal contamination by starlings on the cows’ feed as cows are able to have 16 hours of feeding time on fresh TMR before any bird contamination occurs.
The case studies detailed in this report show that success in reducing infestations is very much dependent on mitigation strategy and the ability to implement the necessary methods suitable for a particular farm and starling problem. All methods to deter starlings will have some element of success in the right situation although no one method has been found that will completely keep starlings away from a farm feeding maize.

38
8 Conclusions
Trial 1 in this study determined the effectiveness of the feed additive BLAST in reducing starling numbers on farms. Under the trial conditions BLAST had no effect on the number of birds present. It is difficult to see where this product could be successful under normal farm conditions, although some anecdotal evidence exists to support the product claims.
The trials to explore the effectiveness of feed time change to a once a day feeding system where a TMR is fed in the late afternoon showed some potential as a way of reducing starling numbers on farms. Trial 2 was started towards the end of the starling winter feeding season and the bird numbers were at their highest levels. Despite this some improvements were made towards reducing bird numbers and reducing TMR feed value and volume loss (an average reduction in loss of almost 1.5%). It is clear from this trial work that this feeding time change would benefit many farms suffering from high levels of starling infestation, and at little or no cost. Coupled with other mitigation methods this would reduce the cost to dairy farmers from feed losses and would reduce the potential cattle health risks resulting from contaminated feed.
From the research undertaken over the last 2 years for this report, it is clear that concerted efforts to restrict starlings can and do work. Each farm situation is different and what works in one scenario is not necessarily going to work in another. Cost effective mitigation is possible on all farms, although complete deterrence is only going to be possible, in most situations, by removing the attractive elements of the feed source i.e. maize silage or similar.

39
9 Recommendations
Reducing starling numbers is possible on all farms through the right selection of mitigation methods. This does not mean that eradication from a farm is possible and indeed is unlikely in certain areas of the UK with methods that are currently available. The following list provides recommendations to reduce starling numbers based on research undertaken for this report. 1. Key to reducing starling numbers is to employ mitigation methods as soon as migrating
birds are expected to arrive. Once starlings have selected their feeding sites for the winter it becomes increasingly difficult to change their feeding habits.
2. The most effective approach to reducing starlings is to integrate the use of several methods of mitigation simultaneously or sequentially.
3. Most methods will not apply to all situations and need to be selected for their appropriateness for the farm system, building design and the farm’s staff acceptance of change.
4. Netting buildings can be highly effective if buildings are suitable. Costs are not high compared to the benefits although attention to detail is required to maintain a good starling deterrent.
5. Maize silage is the main attractant to starlings for farm feeding but it is not the only feed they will take on a farm. Not feeding maize could be an option in some cases as this is likely to considerably reduce starling numbers. This may be a last resort and needs to be discussed with a good nutritionist to ensure that the desired cow performance is not compromised. Alternative feeds need to be considered carefully, as many feeds can encourage starlings e.g. fermented wholecrop, whereas it is thought that urea treated wholecrop is not attractive to starlings.
6. Changing feeding times from the morning to the afternoon will discourage early morning gathering of starlings. Feeding later in the day will also reduce the amount of faecal contamination of feed in a 24hour period.
7. Human deployment specifically to deter starlings is very effective if labour is available. Possibly not cost effective on small farms.
8. The use of hawks was found to be a good bird deterrent but requires a high degree of commitment and is probably best suited to larger farms or those with available labour.
9. Scaring devices such as bangers, guns, pop-up scarecrows etc. all have some potential to reduce the attractiveness of the feed site.
10. Audio devices can provide an effective secondary mitigation method. Frequent changes in device location & adjustments to the sounds are essential to reduce habituation. Auditory mitigation methods have not been found to work on their own for an extended period.
Other points to consider when managing starling infestations
1. New building design should consider the potential threat of starling infestation and mitigate against it at the design stage.
2. Birds can enter buildings through gaps as small as 28mm. Any larger gaps will need to be netted including space boarding if set at greater widths.
3. BLAST feed additive in its present formulation, as used in the trial described in this report, is unlikely to reduce bird numbers in most farm situations.
4. Consider making use of Catchment Sensitive Farming (CSF) grant funding (if within priority catchment areas) to cover outside feeding areas with roofing and enclose the sides with space boarding, <28mm netting, mesh, or ventilated steel cladding. For more details see the CSF website at http://www.naturalengland.org.uk/ourwork/farming/csf/default.aspx

40
5. Ensure that any product claims for starling control can be validated to ensure that there
is a cost benefit. 6. Starling faecal contamination may pose a hazard both to livestock and farm staff, and
also contaminate drinking water supplies, if roof water is put into the system. If recycled roof water is directed to livestock drinking water without treatment, cattle will be vulnerable to pathogenic diseases from the elevated bacterial counts and faecal coliform contamination.
7. Fouling may also compromise hygiene and food quality standards resulting in failure to comply with farm assurance schemes and relevant legislation. It is recommended that roof water is not used for drinking water, and that when cleaning and disinfecting a building of bird fouling, which should be undertaken annually, an appropriate respirator and personal protective equipment (PPE) are used.

41
10 References
Avery, M.L. & Matteson, R.E. (1993). Effectiveness of Dimethyl Anthranilate and eyespots for reducing feed consumption by starlings. Sixth Eastern Wildlife Damage Control Conference, 1993. Paper 3.
Bibby, C.J., Burgess, N.D., Hill, D.A. & Mustoe, S.H. (2000). Bird Census Techniques. 2nd Ed. London: Academic Press.
Bishop, J., McKay, H., Parrott, D. & Allen, J. (2003). Review of international research literature regarding the effectiveness of auditory bird scaring techniques and potential alternatives. DEFRA publications.
Both, C., te Marvelde, L. (2007) Climate change and timing of avian breeding and migration throughout Europe Climate Research, 35: 93-105. doi: 10.3354/cr00716.
Buse, A., Dury, S.J., Woodburn, R.J.W., Perrins, C.M. & Good, E.G. (1999) Effects of elevated temperature on multi-species interactions: the case of pedunculate oak, winter moth and tits. Functional Ecology 13 (Suppl. 1), 74–82.
Carlson, J.C., Franklin, A.B., hyatt, D.R., Pettit, S.E. and Linz, G.M. (2011) The role of starlings in the spread of Salmonella within concentrated animal feeding operations. Journal of Applied Ecology 48: 479-486.
Colles,F.M., McCarthy, N.D., Howe, J.C., Devereux, C.L., A G Gosler, A.G. and Maiden, M.C.J. (2009) Dynamics of Campylobacter colonization of a natural host, Sturnus vulgaris (European Starling). Environ Microbiol.; 11(1): 258–267
Coppack, T., & Pulido, F. (2004). Photoperiodic response and the adaptability of avian life-cycles to climate change. Adv. Ecol Res 35: 131-150.
Dawson, A. (2005). The effect of temperature on photoperiodically regulated gonadal maturation, regression and moult in starlings - potential consequences for climate change. Funct Ecol. 19: 995-1000.
Devereux, C., McKeever, C., Benton, T. & Whittingham, M. (2004). The effect of sward height and drainage on Common Starlings Sturnus vulgaris and Northern Lapwings Vanellus vanellus foraging in grassland habitats. Ibis, 146 (suppl. 2), 115-122.
Edwards A C, Kay D, McDonald A, Francis C, Watkins J, Wilkinson R J and Wyer M D (2008) Farmyards, an Overlooked Source for Highly Contaminated Runoff. J. Env. Mgmt. 87 (4): 551-9.
Erickson, W.A. and R.E. Marsh, R.E. (1992). High frequency sound devices lack efficacy in repelling birds. Proceedings of the 15th Vertebrate Pest Conference: 103-104.
Feare, C.J. and Wadsworth, J.T. (1981). Starling damage on farms using the complete diet system of feeding dairy cows. Animal Production, 32, pp 179-183. doi:10.1017/S0003356100024983.
Gaukler, S., Linz, G., Sherwood, J., Dyer, N., Bleier, W., Wannemuehler, Y., Nolan, L., and Logue, C. (2009) Escherichia coli, Salmonella, and Mycobacterium avium subsp. paratuberculosis in wild starlings at a Kansas cattle feedlot. Avian Diseases 53: 544-551.
Kingshay (2012). Starling infestations on the Somerset Levels and their impact on dairy farming: Participatory research into the practical management of starling infestations on the Somerset Levels. DairyCo.
LeJeune, J., Homan, J., Linz, G., and Pearl, D. (2008) Role of the European Starling in the transmission of E. coli 0157 on dairy farms. Proc. 23rd Vetebr. Pest Conf. Published at Univ. of Calif., Davis. 31-34.

42
Mason, J., Kare, R., and DeRovira, D. (1988) Mammalian livestock feed, mammalian livestock feed additive, and methods for using same. Patent application no. 4,790,990. Monell Chemistry Senses Center, Philadelphia.
Pérez-Garcia, J.M. (2012). The use of digital photography in censuses of large concentrations of pesserines: the case of a winter starling roost-site. Revista Catalana d’Ornitologia 28: 28-33.
Robinson, R.A., Siriwardena, G.M. & Crick, H.Q.P. (2005). Status and population trends of Starling Sturnus vulgaris. Bird Study 52, 252-260
RSPB http://www.rspb.org.uk/images/englishgrassland1_tcm9-133253.pdf accessed 02/03/2013
Smith, KW (2005) Has the reduction in nest-site competition from Starlings Sturnus vulgaris been a factor in the recent increase of Great Spotted Woodpecker Dendrocopos major numbers in Britain? RSPB Bird Study 52, 307–313
Sayre, R.W. & Clark, L. (2001) Effect of Primary and secondary repellents on European Starlings: an initial assessment. USDA National Wildlife Research Center – Staff Publications Paper 579.
Twedt, D.J. & Glahn, J.F. (1982) Reducing starling depredations at livestock feeding operations through changes in management practices. Proceedings of the 10th Vertebrate Pest Conference. Paper 46.
Visser, M.E., Both, C. Lambrechts M.M. (2004). Global climate change leads to mistimed avian reproduction. Adv. Ecol. Res. 35: 89-110.
Werner, S.J. & Clark, L. (2003). Understanding blackbird sensory systems & how repellent applications work. USDA National Wildlife Research Center - Staff Publications. Paper 287.

43
11 Appendices & photos
Appendix 1 Starling infestation cost breakdown
Cost per cow of starling infestations resulting from feed loss, feed quality and milk production loss
Note: Not all of these costs will be appropriate in all systems i.e. milk loss can be compensated for by in parlour feeding
TMR - loss in quality
Loss of ration ME (per kg DM), MJ/kg dry matter 0.60
Feed to compensate for loss in feed value, kg/cow 1.06
Cost of feed to compensate for feed value loss - £/cow/day £0.16
Cost of compensating feed per cow per 100 day starling infestation £15.92
TMR - Volume loss Feed weight loss % 6.00
Feed loss per day, kg DM per cow 1.38
Cost per day £0.28
Average cost from feed volume loss per cow per 100 days £28.00
Potential cost of lost milk
Potential lost milk - litres per cow from reduced quality of TMR 2.6
litres
Average milk price £0.30
Value of milk loss £0.78
Cost per cow per 100 day infestation £78.00

44
Appendix 2 Products available for starling mitigation:
Highlight – ventilated wall cladding for livestock
buildings
Type of Device Product Company Typical Cost (excl VAT)
Auditory: Gas gun Selectabang Astwells £340
Auditory: Gas gun Kitgun £338
Auditory: Gas gun Kitgun 2 £370
Auditory: Gas gun Vari-Scary Techneat £350
Auditory: rechargeable air horn Ecoblast www.aspli.com £28
Water repellant ScareCrow Contech (through Amazon) £29
Visual: hawk-shaped kite and pole Hawk and pole £119
Visual: helium balloon kite Helikite £98 - £119
Visual: electric inflatable scarecrow Scarey Man (basic) Claratts £320
Visual: hawk-shaped kite and pole Scare'm Hawk Kite Scare'm £70
Auditory, manual SkyBirds (10) £13
Auditory Rope Bangers (12) £27
Auditory: distress calls Compact 200/360 £635/£995
Auditory: distress calls Compact Solar-Powered £1,395
Auditory, manual: distress calls Patrol Two - Loudspeaker £882
Auditory: Gas gun Scatter Bird Mrk 3 Agricarstore.com £295
Auditory: distress calls Super BirdXPeller Pro Digital £365
Auditory: distress calls Super BirdXPeller Pro 4 Speaker £851
Auditory BS 6 Indoor Starling Scarer £239
Auditory: distress calls Predator Bird Scarer £289 - £922
Visual: robotic bird of prey Robop Robop Ltd £3,200
Visual: reflective predators eyes Flashing Hawkeye: ground mounted + post www.scaringbirds.com £145
Visual: reflective predators eyes Flashing Hawkeye: roof mounted+ brackets £175
Auditory Maxi Wailer (light sensor) £385
Auditory: electronic sounds 360° Wailer: self program 12v battery £509 + slave units £70/80
Auditory: electronic sounds 360° Bird Buzzer: ultrasonic starts at £304
Auditory, manual: distress calls Hand Held Type £657
Auditory: distress calls Pole Type £857
Auditory Sky Rockets EcoPro Ltd, Birdcare UK £158 for 100
Visual: balloon on stick with eyes Hawkeye Bird Scarer Portek (MVF) £17
Physical: 28mm net Starling netting birdstop.co.uk £1.07/m²
Physical: 19mm mesh Fruit Cage Net MVF £23.99 for 32m x 2m = 37p/m
Physical: galvanised metal mesh Mesh 10g x 8'x4' www.weld-mesh.com £39.53 each
Physical: welded wire rolls Wire net 900mm x 30metres x 25mm £79
Physical: welded wire rolls 1800mm x 15metres x 25mm £109
Physical: ventilated wall cladding Highlight - perforated steal cladding www.unitedroofingproducts.com £8.60/linear m
Physical: interlocking feed trough EasyFeeder Easyfix £75.00/linear m
Physical: protection & ventilation Range of roller screens, doors, netting, coversGalebreaker Products e.g fitted door 18'w £467.50
* Exclusion does not imply criticism
Wingaway
www.meshdirect.co.uk
Sutcliffe Electronics
Allsop Helikites Ltd
Portek (Agricarstore.com)
Scarecrow Bio-Acoustic
Systems Ltd (also Martin
Lishman)
Bird-X
Martley Electronics
www.scaringbirds.com

45
www.unitedroofingproducts.com
HIGHLIGHT is a perforated steel side cladding sheet that gives superb ventilation combined with natural light transmission. Manufactured from pre-galvanised steel coil that is polyester painted on both sides, grey externally and white internally. It is then perforated in a set pattern, profiled and cut to the customers required length. Highlight is made to order.
Price: £8.60 per linear meter + vat
e.g 100ft long building = £533.20 + vat + carriage
Galebreaker Products
www.galebreakeragri.com
A range of weather protection, ventilation and farm assurance solutions, including roller-screens, roller-doors, fitted doors and screens, ventilation systems, netting and graded mesh, PVC curtains and silage covers.
EasyFeeder from Easyfix
http://www.easyfix.ie/products/dairy-cows/easy-feeder
A plastic feed trough system, suitable for all diet feeders and mixer wagons. Could restrict bird access, reduce feed contamination and reduce feed losses by scattering of feed.
Features:
Interlocking plastic feed trough system
Each section measures 5’3’’ x 2’ x 2’ Sections can be interlocked to give the required length Manufactured from lightweight shatterproof plastic Adjustable width to suit feeding needs Suitable for use with all diet feeders and mixer wagons
Price: £75 per linear meter + vat.

46
A Hawk flying service for starling control
At present there are no laws preventing anyone owning a bird of prey, as long as it captive bred. Some birds are registered, most have an identifying mark (usually a ring) and an Article 10 document is necessary if bought, sold or otherwise used commercially. In 1970 there were 100 falconers in Britain, now there are estimated to be in excess of 28,000 hawk-keepers. The UK has 50% of the world’s falconers and 80-90% of the birds kept are Harris Hawks.
Nigel Penfold from North Devon offers a starling control service if the thought of owning a hawk does not appeal. The strategy is to fly the sparrowhawk outside to disrupt the formation of the flock, prior to the starlings building a critical mass and then going into the cattle buildings. The sparrowhawk is seen by the starlings at 50 meters causing them to fly away.
This was successful where he had been called early enough in the season (November). Depending on the farm situation, flying is carried out for about 2 hours a day, every day for a week.
Charges for the service are about £20 per hour and 50p per mile travelling, if several farms can be visited at the same time. A single farm location with hawk flying for a week (7 days) will cost about £520.
There is a difference in the control effectiveness of trained hawks and wild raptors. A trained hawk will be kept at the ideal flying weight, keen enough to fly in hot pursuit of the flock half a dozen times a morning. The wild raptor will chase a flock, catch a starling, take it off and eat it and not fly again for some time. A wild buzzard will not chase or catch starlings and the flock does not feel threatened by their presence. Buzzards and starlings have been observed perching in the same tree during this study.
There may be other falconers offering similar services in other parts of the country.
Plate 7 Sparrowhawk (top) and Harris Hawk flying
Table 11-2 Set up costs for flying a bird of prey

47
Appendix 3 Starling netting case study farm CS 2
NORTH EAST ELEVATION
4.00m
18.90m
4.17m

48
NORTH WEST ELEVATION
5.50m
4.00m
3.50m
3.66m
3.50m
5.00m 4.11m

49
SOUTH WEST ELEVATION
2.17m
6.10m mm
4.00m

50
SOUTH EAST ELEVATION
4.11m
3.50m
1.22m
4.00m
5.50m
Total 56.17m

51
VENTILATION GAPS
66.00m
2.00m
1.00m
1.00m
66.00m
66.0m
2.00m
66.00m
1.00m

52
Width (m) Height (m)
Length
(m) Area (m2) Quantity
Total netting
area (m2)
Cost to replace
Galebreaker screens
with doors
NORTH-WEST ELEVATION
2 x Metal doors to parlour 3.66 3.50 12.81 2 N/A
4 x 13.5ft wide Gale Breaker door 4.11 3.50 14.39 4 £805
4 x 16.5ft wide Gale Breaker door 5.00 3.50 17.50 4 £905
2 x 18ft wide Gale Breaker door 5.50 4.00 22.00 2 £935
Total area (m 2) 0.00 £2,645
SOUTH-EAST ELEVATION
3 x 16.5ft wide door 4.11 3.50 14.39 3 £905
2 x 18ft wide door 5.50 4.00 22.00 2 £935
Open gap between Yorkshire
boarding and concrete panels 56.17 1.22 68.53 1 68.53
Total area (m 2) 68.53 £1,840
SOUTH-WEST ELEVATION
Yorkshire boarded bays x 8 6.10 2.17 13.24 8 105.90
Door at end 6.10 4.00 24.40 1 £985
Total area (m 2) 105.90 £985
NORTH-EAST ELEVATION
Calving pens 18.90 4.00 75.60 1 75.60
Bays 30.48 4.17 127.10 1 127.10
Total area (m 2) 202.70
VENTILATION GAPS
2 x side gaps 2.00 66.00 132.00 2 264.00
3 x apex roof ridge 1.00 66.00 66.00 3 198.00
Total area (m 2 ) 462.00
TOTAL AREA TO COVER (m2) 839.13 £5,470
Netting CostGauge
(mm) Price/m² Total
Bird stop starling netting
black 28 £1.07 897.86£
stone 28 £1.07 897.86£
translucent 28 £1.07 897.86£
Mole Valley Farmers
Fruit cage net 16 x 2 £0.39 327.52£
32 x 2 £0.37 314.54£
Wire netting (height 1800mm) 1.8 x 0.025 x 50 20 £1.07 740.76£
1.8 x 0.025 x 25 20 £1.07 744.96£
1.8 x 0.05 x 50 19 £1.07 390.19£
1.8 x 0.05 x 25 19 £1.07 558.48£
Wire netting (height 1200mm) 1.2 x 0.05 x 10 19 £1.07 905.56£
1.2 x 0.025 x 50 20 £1.07 622.35£
1.2 x 0.025 x 25 20 £1.07 742.63£
1.2 x 0.05 x 25 19 £1.07 677.89£
1.2 x 0.05 x 50 19 £1.07 508.37£
1.2 x 0.025 x 10 20 £1.07 1,125.83£
1.2 x 0.013 x 10 22 £1.07 1,185.26£
Galavanised wire netting 1.05 x 0.031 x 50 19 £1.07 590.58£
Galebreaker Farmflex H 1m, 1.5m, 2m, 3m Min £3.95
Max £12.95
Price/ product
Galebreaker Birdnet 2.0m x 100m 14x12 £205.00 861.00£
NB: This ia an approximate figure and waste has not been considered in this calculation. This is therefore a minimum cost of
materials only, and labour charges on top. The mole valley products are an exact size and not made-to-measure and therefore not all
sizes will fit the gaps appropriately.
Table 18 Farm CS 2 Netting Costings
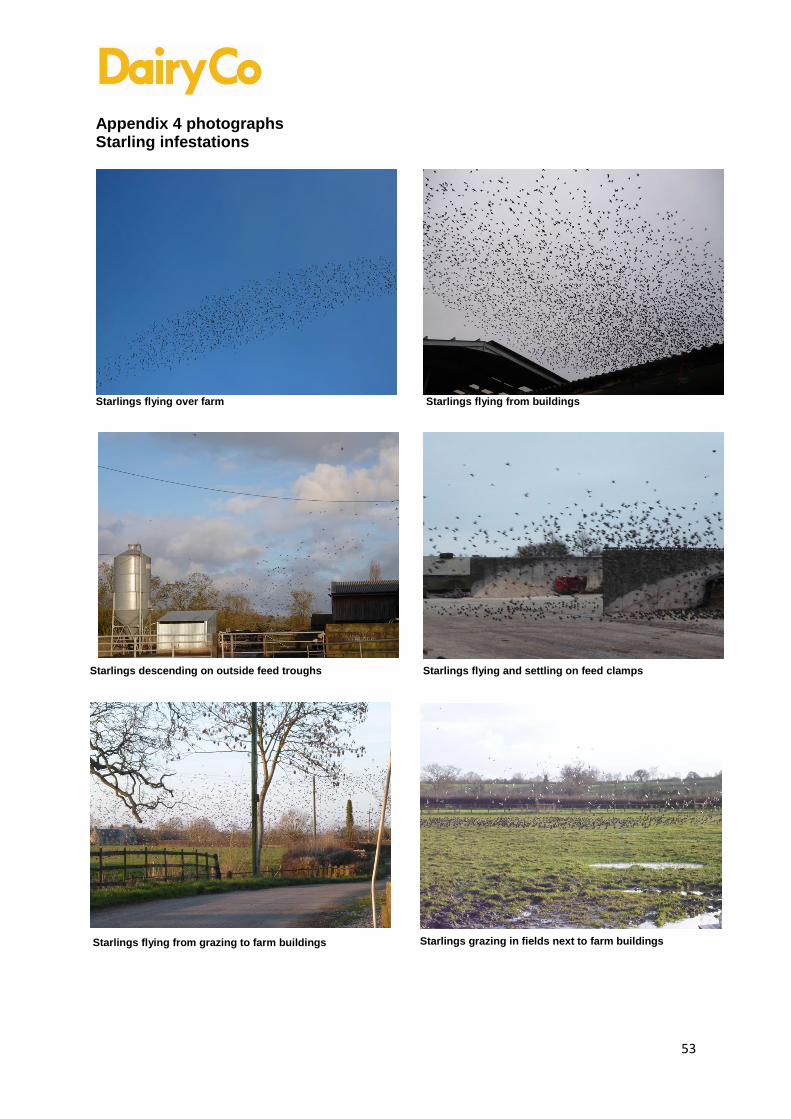
53
Appendix 4 photographs Starling infestations
Starlings flying over farm
Starlings descending on outside feed troughs Starlings flying and settling on feed clamps
Starlings flying from grazing to farm buildings Starlings grazing in fields next to farm buildings
Starlings flying from buildings
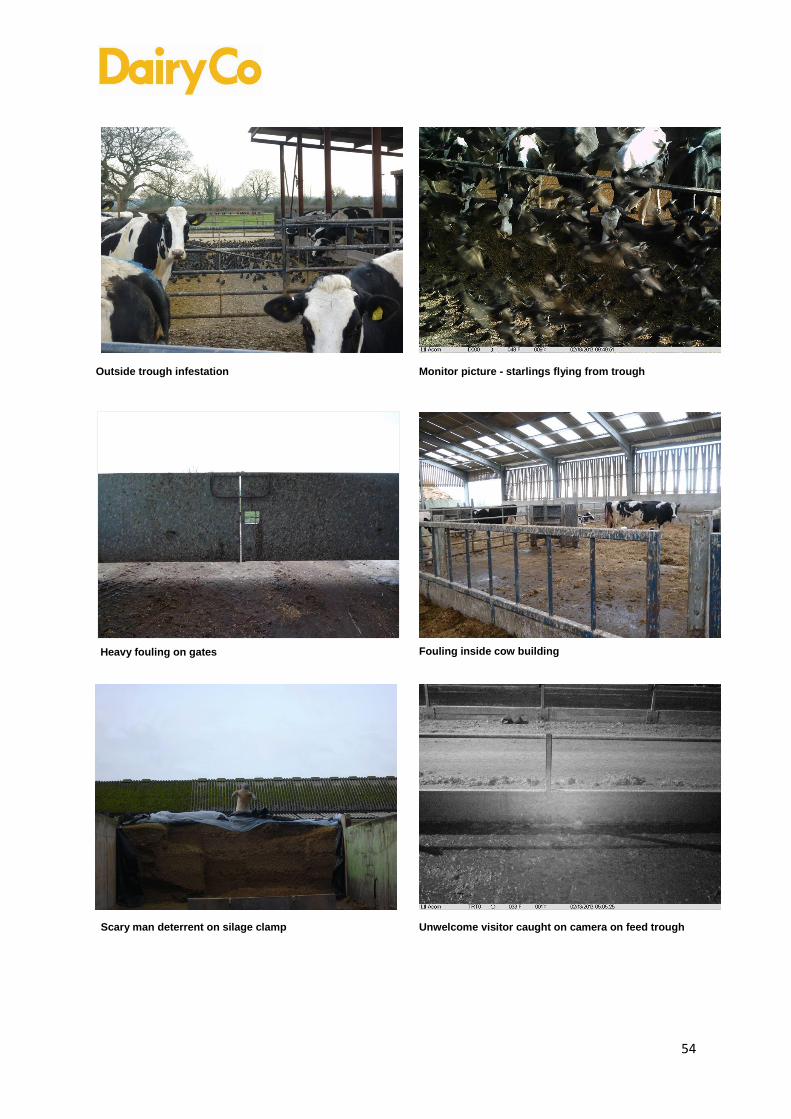
54
Outside trough infestation Monitor picture - starlings flying from trough
Heavy fouling on gates Fouling inside cow building
Scary man deterrent on silage clamp Unwelcome visitor caught on camera on feed trough

55
12 End Page
While the Agriculture and Horticulture Development Board, operating through its DairyCo division, seeks to ensure that the information contained within this document is accurate at the time of printing, no warranty is given in respect thereof and, to the maximum extent permitted by law, the Agriculture and Horticulture Development Board accepts no liability for loss, damage or injury howsoever caused (including that caused by negligence) or suffered directly or indirectly in relation to information and opinions contained in or omitted from this document. © Agriculture and Horticulture Development Board 2012. No part of this publication may be reproduced in any material form (including by photocopy or storage in any medium by electronic means) or any copy or adaptation stored, published or distributed (by physical, electronic or other means) without the prior permission in writing of the Agriculture and Horticulture Development Board, other than by reproduction in an unmodified form for the sole purpose of use as an information resource when DairyCo is clearly acknowledged as the source, or in accordance with the provisions of the Copyright, Designs and Patents Act 1988. All rights reserved. AHDB® is a registered trademark of the Agriculture and Horticulture Development Board. DairyCo® is a registered trademark of the Agriculture and Horticulture Development Board, for use by its DairyCo division. All other trademarks, logos and brand names contained in this publication are the trademarks of their respective holders. No rights are granted without the prior written permission of the relevant owners.
DairyCo Agriculture and Horticulture Development Board Stoneleigh Park Kenilworth Warwickshire CV8 2TL T: 024 7669 2051 E: [email protected] www.dairyco.org.uk DairyCo is a division of the Agriculture and Horticulture Development Board