prabir de and ajitava raychaudhuri - united nations escap no. 131.pdf · prabir de and ajitava...
TRANSCRIPT
Trade facilitation and poverty reduction in Asia and the Pacific: A case study of a South Asian Economic Corridor
Prabir De and Ajitava Raychaudhuri
ASIA-PACIFIC RESEARCH AND TRAINING NETWORK ON TRADE
Working Paper
NO. 131 | SEPTEMBER 2013
The Asia-Pacific Research and Training Network on Trade (ARTNeT) is an open
regional network of research and academic institutions specializing in international
trade policy and facilitation issues. IDRC, UNCTAD, UNDP, ESCAP and WTO, as core
network partners, provide substantive and/or financial support to the network. The
Trade and Investment Division of ESCAP, the regional branch of the United Nations for
Asia and the Pacific, provides the Secretariat of the network and a direct regional link to
trade policymakers and other international organizations.
The ARTNeT Working Paper Series disseminates the findings of work in progress to
encourage the exchange of ideas about trade issues. An objective of the series is to
publish the findings quickly, even if the presentations are less than fully polished.
ARTNeT Working Papers are available online at www.artnetontrade.org. All material in
the Working Papers may be freely quoted or reprinted, but acknowledgment is
requested, together with a copy of the publication containing the quotation or reprint.
The use of the working papers for any commercial purpose, including resale, is
prohibited.
Disclaimer:
The designations employed and the presentation of the material in this Working Paper
do not imply the expression of any opinion whatsoever on the part of the Secretariat of
the United Nations concerning the legal status of any country, territory, city or area, or of
its authorities, or concerning the delimitation of its frontiers or boundaries. Where the
designation ―country or area‖ appears, it covers countries, territories, cities or areas.
Bibliographical and other references have, wherever possible, been verified. The
United Nations bears no responsibility for the availability or functioning of URLs. The
views expressed in this publication are those of the author(s) and do not necessarily
reflect the views of the United Nations. The opinions, figures and estimates set forth in
this publication are the responsibility of the author(s), and should not necessarily be
considered as reflecting the views or carrying the endorsement of the United Nations.
Any errors are the responsibility of the author(s). Mention of firm names and commercial
products does not imply the endorsement of the United Nations.
© ARTNeT 2013
Trade facilitation and poverty reduction in Asia and the Pacific:
A case study of a South Asian Economic Corridor
Prabir De* and Ajitava Raychaudhuri†
*An earlier version of the paper was presented at the ARTNeT Conference on ‗Empirical and Policy Issues of Integration in Asia and the Pacific‘, held at Colombo on 1-2 November 2012, and also at the ESCAP Seminar on ‗Pro-poor Trade Facilitation and Measures in Developing Asian Countries‘, held at Bangkok on 26 March 2013. Authors would like to thank one anonymous referee, conference participants, Amrit Lagun, Rajan Ratna, Mia Mikic, and Yann Duval for their valuable comments on an earlier version of the paper. Authors are thankful to Sandip Singha Roy for field level data collection and Sreya Pan for research assistance. Support of ARTNeT/ESCAP is gratefully acknowledged. Views expressed by the authors are their personal. Usual disclaimers apply. * Senior Fellow, Research and Information System for Developing Countries (RIS), India Habitat Centre, Zone 4B, Fourth Floor, Lodhi Road, New Delhi 110 003, India; e-mail: [email protected]; [email protected] † Professor and Coordinator, Centre for Advanced Studies, Department of Economics, Jadavpur University, Kolkata
700032, India; e-mail: [email protected].
ASIA-PACIFIC RESEARCH AND TRAINING NETWORK ON TRADE
WORKING PAPER No. 131 | SEPTEMBER 2013
Please cite this paper as: De, Prabir and Ajitava Raychaudhuri (2013). Trade facilitation and poverty reduction in Asia and the Pacific: A case study of a South Asian economic corridor ARTNeT Working Paper Series No. 131, September, 2013, Bangkok, ESCAP. Available at www.artnetontrade.org

Abstract: Relation between trade, inequality and poverty within countries is not beyond
controversy. Under free trade and competitive conditions, trade promotes growth, and growth
reduces poverty. In general, trade liberalisation has long been seen as an important element of an
effective and sound economic policy and trade facilitation is a necessary step for achieving it. Trade
facilitation is aimed at ensuring the movement and clearance of goods across borders within the
shortest time at the minimum cost. Reducing trade costs can have a profound impact on trade and
therefore on poverty. Based on primary survey data, this study assesses the potential impact of trade
facilitation on poverty reduction in the region falling under SAARC Corridor 1, which is one of the
leading corridors in South Asia that handles considerably good amount of overland trade between
three major South Asian countries, namely, Bangladesh, India and Pakistan and also their global
trade. One of the conclusions of this study is that poverty reduction, in the perception of the
individuals connected with trade, depends on reduction in trade barriers through better trade
facilitation. However, in the perception of the trading firms, better infrastructure which facilitates more
trade is tagged with a positive response about decline of poverty.
Keywords: South Asia, Trade, Trade facilitation, Poverty, Economic Corridor
JEL codes: F14, F15
1
Contents
Introduction ................................................................................................................................. 3
1. Relevant literature ................................................................................................................. 5
2. Data and methodology ........................................................................................................ 14
3. India‘s trade with Bangladesh and Pakistan ........................................................................ 16
4. Trade facilitation and poverty: Major empirical findings ....................................................... 19
4.1 Individual respondents................................................................................................... 20
4.1.1. Quality of trade infrastructure ........................................................................... 20
4.1.2. Quality of governance ...................................................................................... 20
4.1.3 Individual perceptions about trade barriers ....................................................... 22
4.1.4 Opinions about trade, trade facilitation and poverty reduction ........................... 25
4.2 Opinions of firms ........................................................................................................... 27
4.2.1.Availability of trade infrastructure ...................................................................... 28
4.2.2.Opinions about logistics costs in SC 1 .............................................................. 28
4.2.3.Transaction time at border ................................................................................ 30
4.2.4.Perception of customs process ......................................................................... 31
4.2.5.Trade barriers identified by Indian exporters and importers .............................. 32
4.2.6.Opinions of firms about trade facilitation and poverty ........................................ 34
Conclusion ................................................................................................................................ 37
Annex 1..................................................................................................................................... 40
Annex 2..................................................................................................................................... 41
Annex 3..................................................................................................................................... 42
References ............................................................................................................................... 52

2
List of Figures
Figure 1: Sample size and distribution
Figure 2: Skill composition of individual respondents
Figure 3: Opinion of respondents about quality of trade infrastructure
Figure 4: Opinion of individual respondents on governance
Figure 5: Opinion of respondents on role of trade in poverty reduction
Figure 6: Distribution of firms in terms of trading partners
Figure 7: Skills composition in employment
Figure 8: Opinions on operational
Figure 9: Perception about poverty and trade facilitation
List of Tables
Table 1: India‘s trade with Pakistan
Table 2: India-Pakistan trade through the Attari-Wagah border
Table 3: Bangladesh trade with India
Table 4: India's exports through major ports
Table 5: Poverty rate, Tendulkar Methodology
Table 6: Marginal effects in elasticity of Ordered Probit Regression
Table 7: Logit regression results (individuals): Trade facilitation to reduce
poverty
Table 8: Physical and non-physical trade barriers at Indian borders with Bangladesh and
Pakistan
(a). Availability of facilities
(b). Non-availability of facilities
Table 9: Border transaction times
(a). Indian exports to Pakistan
(b). Indian exports to Bangladesh
Table 10: Perception about customs processing at border crossings
Table 11: Trade barriers faced by
(a). Indian exporters and importers with Pakistan
(b). Indian exporters and importers with Bangladesh
Table 12: Logit regression results (firms): Reduction of poverty by trade facilitation

3
Introduction
The relationship between trade, inequality and poverty within any country is not immune to
controversy. Under free trade and competitive conditions, trade promotes growth; that
growth, in turn, reduces poverty. Reducing trade costs can have a profound impact on
poverty (Winters and others, 2004). In general, trade liberalization has long been seen as an
important element of an effective and sound economic policy, and trade facilitation is a
necessary step towards achieving that objective (Winters, 2002). Trade facilitation is aimed at
ensuring the movement and clearance of goods across borders within the shortest possible
time at the minimum cost.
During the past two decades, import tariffs have decreased significantly and non-tariff
measures aimed at further reducing international transaction costs have gained more
importance in promoting trade across countries. Removal of non-tariff measures has been
shown as a significant element in easing a country‘s economic isolation (Arvis and others,
2012). Efficient transportation networks have become a more important factor in regional
cooperation, both in absolute and relative terms. Better trade and transportation infrastructure
(termed as economic corridors) would encourage fragmentation of production across
borders, enhance regional and global trade, and help in realizing the economic integration
process.1
Economic corridors became popular due to the Asian Development Bank (ADB) project in the
Greater Mekong Subregion (GMS). 2 An economic corridor can be national (e.g., the
Delhi-Mumbai Industrial Corridor), regional (e.g., GMS corridors) or even international (e.g.,
submarine telecommunication cables). In South Asia, the South Asian Association for
Regional Cooperation (SAARC) Regional Multimodal Transport Study (SRMTS) has
identified 10 highway corridors for the region; the SAARC Corridor 1 (hereinafter referred to
as SC 1) was selected for this study to assess the empirical relationship between trade
facilitation and poverty reduction.3
1 See, for example, Brooks and Stone (2010).
2 The economic corridor concept is one in which regions, covering two or more countries, are identified where
infrastructure is specially promoted to strengthen trade and economic integration. The basic idea behind this concept is not just the promotion of trade across borders, but also economic development along such trade routes (Wiemer, 2009). The main advantage of promoting economic corridors is realized when trade across such corridors is sufficiently liberalized and seamless, thus lowering the cost of cross-border trading. 3 It was necessary to select a SAARC Highway Corridor (SAARC Corridor) for this study as the region, unlike
GMS, does not yet have an economic corridor in operation. Annex 1 contains a map of SC 1, which originates in the State of Tripura, located in north-eastern India, passes through Bangladesh, re-enters India from the east and then moves north into Pakistan through India‘s western border.
4
Distinct economic corridors can have the following specific benefits:4
(a) Improvement of national and regional connectivity by making it faster, cheaper,
and easier for people and goods to move within and across borders;
(b) Aiding the reduction of poverty by improving poor people‘s access to economic
opportunities, lowering the cost of the goods and services that they consume, and
providing better access to essential infrastructure services such as electricity
supply.
For most developing economies, economic corridors are viewed as stocks of public capital,
thereby constituting a major constraint to growth. Shortages of economic corridors (i.e.,
infrastructure) cause congestion and, as a result, a strong tendency towards diminishing
returns on capital in industry. A consequent low rate of return acts as a disincentive to
investment and trade facilitation.
The issue of poverty reduction is always an important one, and trade facilitation may help in
the process since it enhances competitiveness of a country or a region.5 The objective of the
current study is to identify some causal factors that relate trade facilitation to poverty
reduction. It is important to assess the trade facilitation and poverty linkage, since it can help
countries to undertake policy reforms in order to facilitate trade (e.g., by making
improvements in trade logistics).
In particular, this study attempts to assess the potential impact of trade facilitation on poverty
reduction in SC 1. The focus of the study is on the Indian side of the corridor since India has
undertaken trade facilitation measures relatively more intensively than its neighbouring
countries who are connected by this corridor.6
Rest part of this study is structured as follows. Section 2 carries a literature review on
economic corridor, trade facilitation and poverty, and identifies the research gaps. Data and
methodology are briefed in section 3. Section 4 presents India‘s trade with Bangladesh and
Pakistan, more through land borders. The primary survey results and analysis are presented
in section 5, followed by the conclusion in section 6.
4 See to Srivastava and Kumar (2012), in which a detailed account is provided of the economic benefits of GMS
economic corridors. 5 See, for example, Bandara and others (2011).
6 The idea being that where India has undertaken many more unilateral trade facilitation measures than its
partners of the corridor, then those partners may enjoy the same gains if they accelerate their trade facilitation measures and vice versa. For example, India‘s Integrated Check Post (ICP) project has motivated its neighbours to develop their border infrastructure.
5
1. Relevant literature
The awareness of trade facilitation is as old as trade itself. Many of the international trade
agreements are designed to achieve this objective. Trade Facilitation as an independent
concept gained attention with the Doha Round of WTO negotiations. Trade facilitation is
aimed at ensuring the movement and clearance of goods across borders within the shortest
time at the minimum cost.7 The two elements which form the crux of the issue are time and
cost. Trade facilitation would mean addressing these issues and attempting ways and means
to minimize the cost and time taken for movement of import and export cargo.
The relation between trade, inequality and poverty has been dealt extensively in literature.
Most international trade economists have a perspective of a world in which countries
exchange goods, factors and ideas. Free trade in goods leads to equalization of factor prices
across countries according to the factor-price-equalization theorem. In the traditional
literature on neo-classical growth model, capital and labour play the central role as two main
factors of production. From the perspective of conventional one sector neo-classical growth
theory international linkages do not matter, but from the trade perspective they are the crucial
determinants.
Harrison et al (2010) presented a review of a detailed account of trade and inequality
literature, and indicated that trade can affect (and usually increase) income inequality mainly
because of within-industry effects due to heterogeneous firms; effects of offshoring of tasks;
effects of incomplete contracting; and effects of labour-market frictions.
Under free trade and competitive conditions, trade promotes growth, and growth reduces
poverty.8 In the literature on international trade, the issues of income distribution, growth as
well as distortions are more or less discussed in terms of endowments of capital and labour,
their growth and their relative prices. Countries that initially had a more regulated trade sector
experienced an increase in inequality where trade reform, however, does not appear to have
significantly affected changes in income distribution.9 In the income distribution literature, the
functional distribution of the two major factors of production again explains the movement of
7 The definition of trade facilitation in broader terms goes beyond what has been noted in the WTO. In literature,
trade facilitation has been identified as the means to move trade across borders which is not just restricted to dealing country‘s customs formalities. 8 The linkage between trade and growth has been dealt extensively in literature. For a thorough review of the
studies dealt the relationship between trade and growth, refer Singh (2010). 9 There is strong literature on trade and income distribution supporting the fact that trade liberalisation does not
necessarily lead to equality of income in the presence of trade distortion. See, for example, Edwards (1997), Slaughter (1997).
6
Trade Facilitation
Growth International Trade Government Revenue
inequality in income distribution over time.10 Although infrastructure (or trade facilitation)
plays the role of a very important catalyst, it gets virtually no explicit mention in the relevant
literature on trade and inclusive growth.11 In fact, one may say that more trade openness or
globalisation is potentially beneficial to all but requires appropriate policy designs to realize it.
Trade facilitation may be seen in this perspective.
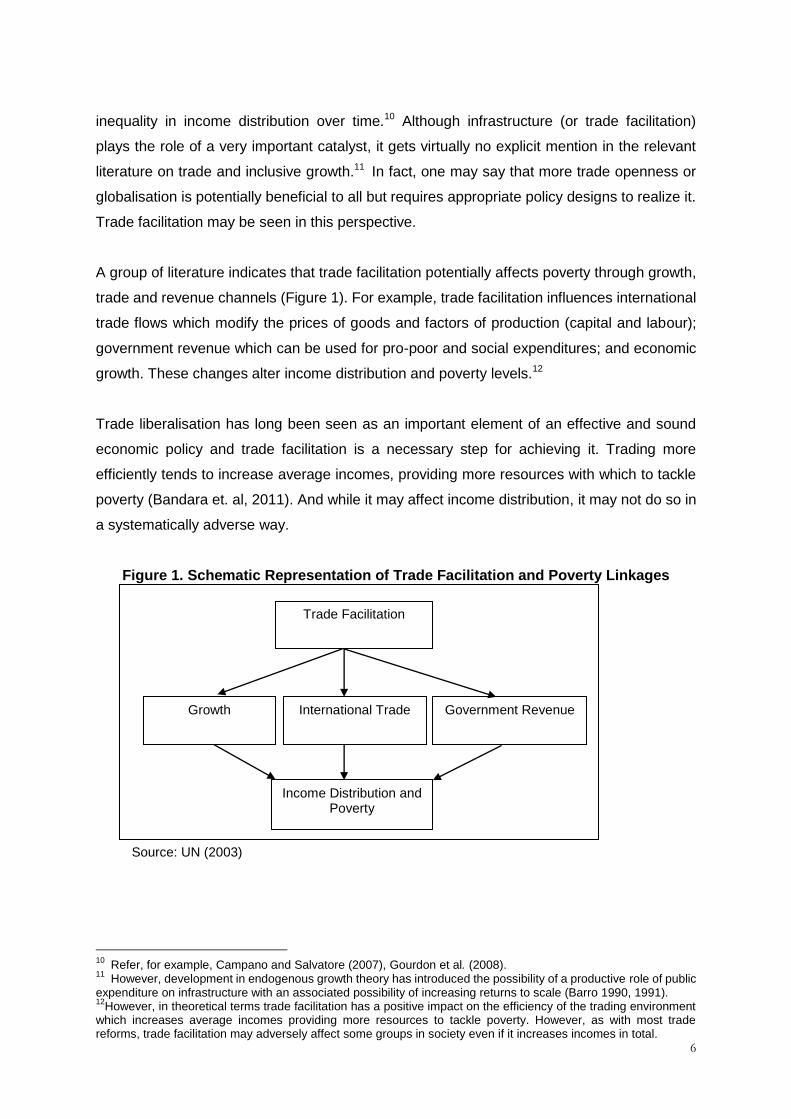
A group of literature indicates that trade facilitation potentially affects poverty through growth,
trade and revenue channels (Figure 1). For example, trade facilitation influences international
trade flows which modify the prices of goods and factors of production (capital and labour);
government revenue which can be used for pro-poor and social expenditures; and economic
growth. These changes alter income distribution and poverty levels.12
Trade liberalisation has long been seen as an important element of an effective and sound
economic policy and trade facilitation is a necessary step for achieving it. Trading more
efficiently tends to increase average incomes, providing more resources with which to tackle
poverty (Bandara et. al, 2011). And while it may affect income distribution, it may not do so in
a systematically adverse way.
Figure 1. Schematic Representation of Trade Facilitation and Poverty Linkages
Source: UN (2003)
10
Refer, for example, Campano and Salvatore (2007), Gourdon et al. (2008). 11
However, development in endogenous growth theory has introduced the possibility of a productive role of public expenditure on infrastructure with an associated possibility of increasing returns to scale (Barro 1990, 1991). 12
However, in theoretical terms trade facilitation has a positive impact on the efficiency of the trading environment which increases average incomes providing more resources to tackle poverty. However, as with most trade reforms, trade facilitation may adversely affect some groups in society even if it increases incomes in total.
Income Distribution and Poverty

7
Box 1. Trade Costs and Poverty in Rwanda
Increasing incomes in rural areas is necessary for poverty reduction in Rwanda since the majority of the poor live in rural areas. Improvements in returns to exportable commercial crops are the most direct and probably the most effective way of increasing the flow of cash into rural areas and so must lie at the heart of poverty reduction in Rwanda. Diop et al (2005) found that reducing trade costs can have a profound impact on poverty. The benefits of lower transport costs, if reflected in higher producer prices, will be realized by all coffee farmers, and indeed all commercial farmers. Reducing transport costs and providing access to transport to those who are currently remote is therefore a crucial element in the poverty reduction strategy. Similarly, this study has shown that the government‘s strategy of increasing returns by raising quality and therefore the market price of Rwandan produce will have a significant impact on poverty, particular if small farmers are targeted and assisted in improving the quality of their coffee crop. However, the success of this strategy requires effective rural logistics services and transport capacity, to ensure that coffee is washed in good time before its quality starts to deteriorate. This capacity is currently lacking. This study has found significant impacts on poverty while only considering the most direct reactions to changing prices. However, the effects will be considerably larger, since coffee farmers typically have a high propensity to spend on other products produced in the rural communities. Increasing returns to commercial farmers could have substantial multiplier effects within rural communities. The challenge is to provide an infrastructure and framework by which rural markets can develop and flourish. Given the current level of development in Rwanda it is clear that this will require a significant response and engagement from the international institutions and donors. Source: Diop et al (2005)
The neo-classical as well as new trade theories rely on a two-country, two-factor and
two-goods model (the 2x2x2 model). Thus, infrastructure (trade facilitation) appears as a
complementary factor that facilitates trade.13 This will visible in following ways: (a) it has a
strong positive influence on trade volume (Deardorff 2001), or (b), it might influence trade
cost (Anderson and van Wincoop 2004). Appendix 2 provides a schematic view of the links
between trade and poverty. Falling trade cost can have profound impact on poverty in
developing countries (see Box 1). Analyzing the importance of different channels that link
trade reforms and household welfare, Isik-Dikmelik (2006) in a case study on Vietnam
commented that trade reforms has benefited everybody but especially the poor.
Economic corridor like infrastructure might influence trade cost more than tariff and non-tariff
barriers, but measurement is probably more difficult. Infrastructure is a composite term, for
example, measured as an average of the density of the road network, the paved road
network, the rail network and the number of telephone main lines per person. The supposed
impact of tariff and non-tariff barriers may be less in magnitude compared to
inefficiency-related and enforcement-related costs of infrastructure. Although it is difficult to
measure it accurately and directly, according to Limao and Venables (2001) trade costs
13
In some literature, trade facilitation has been seen as a process to improve country‘s infrastructure. Refer, for example, Brooks and Stone (2010)

8
depended heavily on infrastructure. A similar conclusion was reached in some recent studies,
which showed that port infrastructure was the most important factor in the reduction of trade
costs for Asian countries, given the preponderance of sea freight in trade costs for Asian
countries (De 2009a; Brooks and Hummels 2009).
Although an OECD (2003) study on trade facilitation dealt mainly with the World Trade
Organization (WTO) definition of border-related trade transaction costs, it made the following
interesting observations. After analysing border process quality across 102 countries it found
that those countries with a higher per capita income generally scored better with regard to
border process quality than countries whose inhabitants were less well off. However, some
countries those were not particularly well off exhibited better border processing. The study
concluded that low-income countries did not necessarily have to wait until they became rich
before being able to adopt good border practices. Meschi and Vivarelli (2009) analysed
intra-country income differences taking 65 developing countries spanning over 1980-1999.
Using a dynamic panel data analysis of Arellano and Bond variety, the authors found that
trade really does not significantly influence income inequality within countries, although some
other control variables like education (through skill-formation) and inflation rate do have
significant impact.
While dealing with the relative importance of trade-mandated effects on industry wage
premia; industry and economy-wide skill premia; and employment flows in accounting for
changes in the wage distribution during the 1988-1995 trade liberalization, Ferreira et al
(2009) commented that unlike in other Latin American countries, trade liberalization has
appeared to have made a significant contribution towards a reduction in wage inequality in
Brazil. Raychaudhuri and De (2012) analysed the impact of increased trade in services in
India on inequality. They found that one major component of India‘s service sector growth
comprised information and communication technology (ICT) services. The study showed that
the ICT sector led the service trade in India. However, the sector is skill and infrastructure
intensive. The major IT and IT-enabled services are located in big metropolitan cities. As a
result, the sector does not support unskilled workers nor has it made its presence felt in the
rural areas. Thus, this type of increase in services trade has increased the inequality within
the urban regions of India as well as greater income divergence between rural and urban
incomes.
Reducing trade costs and facilitating transit is two of the key approaches to achieving a more
inclusive growth through trade, i.e., one that will reduce the gap between the economic core
and the outer periphery of each of the South Asian economies (De, 2009b). Doing so will

9
encourage economic activity at and across borders, eventually generating employment
through industrialization as well as benefiting the poor of the border areas and landlocked
countries. However, governments will also need to provide adequate education and
capacity-building opportunities for the people living in such areas so that they can effectively
engage in trade.
Box 2. Income Distribution Impact of Trade Facilitation in Developing Countries
Trade facilitation has an impact on income distribution and poverty in developing countries through its effects on international trade, economic growth and government revenue.
Small and medium sized enterprises (SMEs), the dominant actors in developing countries, are the main beneficiaries of trade facilitation, since trade transactions costs fall disproportionately on small firms.
While trade facilitation may or may not reduce income inequalities within developing countries, trade facilitation can enhance trade-induced growth, which increases average incomes providing more resources with which to tackle poverty.
Trade facilitation measures applied within a closed (or at least less liberal) trade environment can still have a positive impact on exports and foreign investment.
Trade facilitation may increase employment which may help some move out of poverty.
Improvements in infrastructure allow the poor to trade more easily and profitably in domestic as well as in international markets.
Trade facilitation can increase government revenue which can benefit the poor if used to finance social expenditures
Source: UN (2003)
Trade Facilitation and Poverty
Improved trade facilitation makes the trade efficient which tends to increase average
incomes, providing more resources to tackle poverty. And while it may affect income
distribution, it may not do so in a systematically adverse way (UN, 2003).14 Box 2 captures
some stylized facts on income distribution impact of trade facilitation in developing countries.
Noted in UN (2003),15 there are three main ways that trade facilitation initiatives can affect
the distribution of income, and hence aid poverty reduction in a society (Figures 1 and 2).
One, trade facilitation increases the volume and range of a country's international trade, by
reducing the transaction costs of trade, making exports more competitive, leading to increase
in wages and the numbers employed in the exporting sectors, and imports less expensive,
thereby also increasing real wages. One example of the direct effect of how an improvement
14
For example, in context of 14 Asia-Pacific countries, Raychaudhuri and De (2010) found strong influence of trade openness and infrastructure on income inequality but not the reverse one. Country-specific factors turned out to be important determinants of trade openness and income inequality. Further, this study also argued initial values of both income inequality and trade openness as important determinants in the evolution of these variables, apart from the positive influence of infrastructure as a determining variable. 15
Based on Overseas Development Institute (2003)

10
in the supply chain can help Lao PDR or Nepal to higher market access in ASEAN and
SAARC, respectively.
Two, trade facilitation can then contribute to economic growth, which in turn will lead to higher
incomes, greater employment and a positive effect on poverty. The process also generates a
number of by-products; firstly, as the economy becomes stronger, with a broader trading
base, it becomes less vulnerable to exogenous shocks. Secondly, an improved milieu for
trade changes the incentives to invest, leading to greater foreign direct investment and
increases in investment in human capital.
Three, the final way that trade facilitation can impact on income distribution and poverty
relates to the increase in government revenues, that is the concomitant of increased trade,
improved efficiency and reduced corruption, allowing greater expenditures on social
programmes.
Figure 2. Trade Facilitation Helps in the Reduction in Poverty
Source: Authors based on Raychaudhuri and De (2010)
Trade Facilitation
Hardware (e.g. national &
international infrastructure)
Software (e.g. customs,
transparency, etc.)
Area of Intervention
Productivity &
efficiency Quality of life Transaction
costs
Areas of
Influence
Indirect channel
Industrial
development
Trade
expansion
Human
development
Direct
channel
Employment
Real Income / Consumption of the Poor
Poverty Reduction
Areas of Concern
11
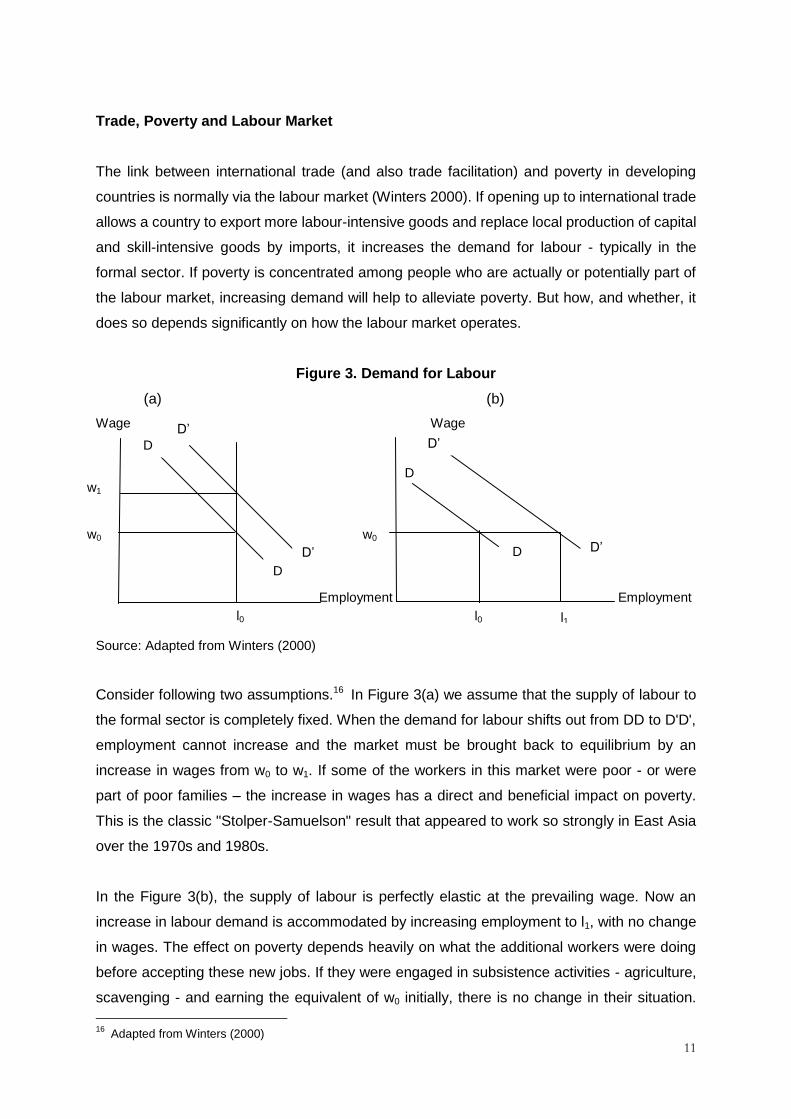
Trade, Poverty and Labour Market
The link between international trade (and also trade facilitation) and poverty in developing
countries is normally via the labour market (Winters 2000). If opening up to international trade
allows a country to export more labour-intensive goods and replace local production of capital
and skill-intensive goods by imports, it increases the demand for labour - typically in the
formal sector. If poverty is concentrated among people who are actually or potentially part of
the labour market, increasing demand will help to alleviate poverty. But how, and whether, it
does so depends significantly on how the labour market operates.
Figure 3. Demand for Labour
(a) (b)
Wage Wage
Employment Employment
Source: Adapted from Winters (2000)
Consider following two assumptions.16 In Figure 3(a) we assume that the supply of labour to
the formal sector is completely fixed. When the demand for labour shifts out from DD to D'D',
employment cannot increase and the market must be brought back to equilibrium by an
increase in wages from w0 to w1. If some of the workers in this market were poor - or were
part of poor families – the increase in wages has a direct and beneficial impact on poverty.
This is the classic "Stolper-Samuelson" result that appeared to work so strongly in East Asia
over the 1970s and 1980s.
In the Figure 3(b), the supply of labour is perfectly elastic at the prevailing wage. Now an
increase in labour demand is accommodated by increasing employment to l1, with no change
in wages. The effect on poverty depends heavily on what the additional workers were doing
before accepting these new jobs. If they were engaged in subsistence activities - agriculture,
scavenging - and earning the equivalent of w0 initially, there is no change in their situation.
16
Adapted from Winters (2000)
D‘ D‘
D‘ D‘
D
D
D
w1
w0
l0 l0 l1
w0
D

12
Only if the switch into this labour market was so great as to significantly reduce labour supply
to the subsistence sector and hence raise its "wage" there would be a poverty impact. In this
case, the increase would apply to all workers in formal and subsistence sectors and so
potentially would have very widespread benefits. However, the increase in labour demand
would have to be huge to have a material effect on the wage. This case is really no less than
the case of successful development, through which whole economies are transformed over a
period of decades. Trade liberalisation is probably an important part of the process, but it is
not the only one.
Figure 4. Trade Facilitation and Economic Outcomes
Source: CIE (2012)
Trade Facilitation and Economic Outcomes
Open policies and trade facilitation help in achieving economic outcomes, through which
poverty reduction (CIE, 2012). The most visible case is the development of economic
corridors in GMS subregion, where improvements in trade and transport facilitation have
Transport and trade facilitation Economy openness policies
Transport
infrastructure
Simplification
of formalities
Trade
liberalisation
Customs
efficiency
Investment
liberalisation
Services
liberalisation
Physical
connectivity
Access to
markets
• Reduce time and costs of
trade
• Efficient trade
• Reliable and transparent
trade system
• Trade flows grow
• Investment flows grow
Better use of skills
and resources
Access to technology Access to skills and
management techniques
• Productivity growth
• Exports competitiveness
• Savings to government
• Per person income growth
• Employment growth
• Cheaper and more products for consumers/
inputs for producers
GDP growth and poverty reduction
13
assisted the GMS region in further reducing poverty and improving living standards.17 Figure
4 illustrates the way in which trade facilitation policies complement open trade and
investment policies in enabling growth and poverty reduction.
Actions on the trade facilitation agenda may include improving physical connectivity through
transport infrastructure projects; easing the transit of vehicles, goods and people between
borders; simplifying processes and procedures to trade; making customs systems more
efficient and transparent through automation and sharing of information between crossing
points; among others. In a broad sense, these actions reduce transaction costs of trade,
making trade more efficient and reliable and stimulating its growth.18
Application of CGE and Gravity Models
There have been several studies attempting to estimate the benefits of trade facilitation. The
impact of trade facilitation activities is seen in view of reduced time and costs of trading
across borders stimulating trade and socio-economic outcomes.
There are two broad approaches for conducting the modelling. One is the use of gravity
models. These models predict bilateral trade flows according to the sizes of the economies
and the distance between the two countries analysed. Additional variables are included to
analyse the impact of policies in the international trade sphere such as preferential trade
agreements. These models have been useful for testing the relation between trade costs and
increases in the volume of trade.19 A second approach is the use of computable general
equilibrium (CGE) models which are more suited for explaining economy-wide effects of
policies. The use of the Global Trade Analysis Project (GTAP) model is common for capturing
such effects. This model incorporates relations between economic sectors and countries,
resource constrains and an economic framework that accounts for the behaviour of
consumers and firms. 20
17
Refer, for example, Warr et al (2009), Menon (2006), etc. 18
Refer, for example, Raychaudhuri and De (2013) 19
For example, Edmonds and Fujimura (2008) (gravity model and panel data) show lower transport cost along GMS corridors benefits trade directly and reduces poverty. 20
For example, Menon and Warr (2006) (CGE model) analyzed relationship between road improvement and poverty reduction in Lao PDR, and found strong correlation with reduced poverty incidence but important differences depending on type of roads and initial access conditions. This study shows importance of improving rural access to main GMS corridors to maximize inclusive impact. Besides, several ADB studies estimate transit costs reduction along EWC and the NSEC to range from 30-50 percent. In an another study (CGE model) on GMS, Stone et al (2010) found very significant improvement in welfare mainly originating in improved terms of trade and trade facilitation followed by allocative efficiency and transport.

14
GTAP is a modelling framework that assists in quantifying the impacts of policy issues and
has commonly being used for analysing impact of trade liberalization and trends. As with any
other model it simplifies the real world to allow for analysis and prediction of the impact of
policies on economic activity. It is a computable general equilibrium model that incorporates
multiple economic sectors and regions, capturing the links between them by modelling the
behaviour of and interaction between consumers, producers and government. The standard
GTAP model is supported by the GTAP database which includes 57 sectors and over 100
countries. The database take account of bilateral trade patterns, production, consumption
and intermediate use of commodities and services.
Finally, the foregoing discussion provides a synoptic view of the role of trade facilitation in
growth and income distribution. The point that is emphasised throughout this paper is that
trade facilitation basically appears as a complementary factor in the standard literature. The
positive impact of trade facilitation on income and poverty reduction is proved through growth;
however, the important point to note is that trade facilitation is a factor whose efficiency is as
equally important as its quantity. Possibly this applies to all factors of production, but for trade
facilitation this is emphasised time and again. The developing countries unambiguously show
this positive impact, unlike some of the developed countries.
Unfortunately, most of the studies do not address either trade or income distribution issues
due to complex relations more in an open economy framework. Causality is rather unknown.
The literature that deals with inclusive growth and poverty highlights the fact that accessibility
to infrastructure, like rural roads or electricity, does not benefit the poor much. Hence, the
result may be an unintended widening of income disparity. Therefore, a group of literature
suggests that the government has a stronger role to play in reducing poverty through
improved trade facilitation programmes. The GMS case shows that improved regional
connectivity is an important element in reducing poverty and making growth more inclusive
through expansion of trade. The literature indicates that while transport improvements bring
large benefits, improved trade facilitation has an even larger impact. This is where policy
priorities are for developing countries.
2. Data and methodology
This study is based on both secondary and primary data. Econometric methods were used
(e.g., ordered categorical regressions) to identify the existence of specific barriers to
facilitation and to make a quantitative assessment of the impact of trade facilitation on poverty
15
reduction. The analysis was based on field survey data, collected at selected places on the
Indian side of SC 1. Firms and individuals were both covered through primary survey. The
route of SC 1 (which is part of the Asian Highway 1) is via Lahore-New
Delhi-Kolkata-Dhaka-Agartala. It connects three SAARC countries, i.e., Bangladesh, India,
and Pakistan, and therefore carries a considerable amount of regional trade. Figure 5 shows
the survey region and corresponding sample sizes. The field survey was conducted through a
structured questionnaire (see annex 3) on a small scale (279 sample size) in the form of a
pilot survey. The primary objective was to gain information quickly on the empirical
relationship between trade facilitation and poverty reduction as well as to improve the
efficiency of the main survey if conducted in future.21
Figure 5. Sample size and distribution
Note: Numbers in parentheses are sample size and corresponding share of total. Total sample is 279, of
which samples of firms and individuals are 100 and 179, respectively.
Another objective for selecting SC 1 was that some of the industrial clusters connected by
this corridor supply intermediate products to regional/bilateral production networks in the
South Asia region. Exports of yarn from India's Ludhiana, India, to Dhaka, Bangladesh are a
case in point.22 As a large number of people are involved when international trade is
conducted along SC 1, their employment is directly linked with trade flows. The primary
21
The time and resources available for completing the project were sufficient for the pilot survey. This was exactly the purpose of this survey. A large-scale survey is possible now since the results from the pilot survey give a clearer vision of the role of trade facilitation in poverty reduction, based on perceptions of individuals and firms. However, a large-scale survey will need large-scale funding and sufficient time (for example, 24 months). 22
Exports of yarn from India to Bangladesh alone contributed about 35 per cent of India‘s total exports to Bangladesh in 2010. In 2010, India exported over US$ 1 billion textile goods including yarn to Bangladesh, where most of the yarn export originates at Ludhiana in Punjab state of India.
SC 1
Pakistan-India border India-Bangladesh border
Pakistan India India Bangladesh
Wagah Attari
Petrapole Benapole
Attari
(52.19%)
Amritsar
(49.18%)
Ludhiana
(52.19%)
Kolkata
(63,
23%)
Bongaon
(23.8%)
Petrapole
(18.6%)
Ghojadanga
(22.8%)

16
survey therefore looked at whether or not improvement in trade facilitation along SC 1 has
helped remove poverty.
Trade facilitation in SC 1 is therefore an important factor contributing not only to the
expansion of trade but also production fragmentation within or across countries such as
Bangladesh. With production processes and tasks becoming increasingly fragmented across
national borders, trade facilitation measures such as time-sensitive logistics services together
with information and communication technology are the key to assisting production networks
across borders. The primary survey data identify the barriers to trading with Bangladesh and
Pakistan along SC1.
3. India’s trade with Bangladesh and Pakistan
Bilateral trade between India and Pakistan witnessed an upward trend only in the second half
of the past decade, when it increased sharply owing much to the India-Pakistan ―Composite
Dialogue‖ in 2004. India‘s trade with Pakistan trebled in 2010 and reached an all-time record
of US$ 2.56 billion (table 1). India‘s exports to Pakistan increased much faster than imports
from the latter country, thereby increasing India‘s trade surplus from less than US$ 100
million at the beginning of the past decade to just over US$ 1.94 billion in the first year of the
ongoing decade (table 1). However, compared to their economic strength, trade between
India and Pakistan is negligible and much below potential.
Table 1. India’s trade with Pakistan
Year Exports Imports Total trade
(US$ million)
1990 43.49 44.86 88.35
1995 70.40 37.37 107.77
2000 163.33 65.05 228.38
2005 647.19 158.42 805.61
2010 2 252.89 310.44 2 563.33
CAGR (%)
1990-1999 9.22 9.88 9.56
2000-2009 27.45 17.32 25.18
Source: United Nations COMTRADE database.
The composition of Indian exports to Pakistan was primarily limited to about 14 commodities
in 2010-2011, and which on average accounted for some 78 per cent of the total Indian
exports to Pakistan. These commodities include sugar, raw cotton, synthetic fabrics, tea,
petroleum products and chemicals, reflecting India‘s more diversified industrial base. Shares
17
of both raw cotton and woven fabrics in India‘s exports to Pakistan increased from almost
zero in 2000 to more than 13 per cent in 2010, whereas the share of oil-cake and other solid
residues contracted from about 16 per cent to 3 per cent during the same period. The
composition of official major imports from Pakistan to India has been limited to 18
commodities, such as fruit and vegetables, wool and wool products, petroleum products,
chemicals, lead and, more recently, cement. These products together share about 88 per
cent of India‘s total import from Pakistan. In 2010, the sectors with large shares in Pakistan‘s
exports to India were fruit (19 per cent), followed by petroleum products (12 per cent), and
cement (11 per cent) (De and others, 2013).
Trade between India and Pakistan has never expanded to the extent that it would have been
in a normal trade environment due mainly to political disturbances. Until recently, the
restrictive trade policies of both countries, with a variety of embedded trade barriers aimed at
each other‘s market, did not allow bilateral trade to grow. Pakistan has 1,209 items on the
negative list that are likely to be phased out, and there will be no restriction on tradeable
items; this would encourage border trade between the two countries, particularly through
Attari and Wagah, along SC 1. Trade valued at about Rs 41.79 billion was carried out in
2010-2011 through the Attari-Wagah border (table 2); this is likely to increase in view of
Pakistan‘s proposal to India for most favoured nation (MFN) status and the dismantling of the
positive list of trade at the India-Pakistan land border.
Table 2. India-Pakistan trade through the Attari-Wagah border
(Unit: Rs billion)
Year Exports Imports Total
2007-2008 17.40 34.67 52.07
2008-2009 43.53 42.12 85.65
2009-2010 79.81 39.59 119.40
2010-2011 37.17 4.62 41.79
Source: Sahai and Laxmi, 2013, based on Indian customs data.
Trade by Bangladesh with India has been growing steadily. India is Bangladesh‘s primary
trading partner in South Asia, followed by Pakistan. Bangladesh has a high deficit in its trade
with India – having increased from US$ 44 million in 1981 to US$ 2.5 billion in 2009. The
10-year period of 2000-2009 saw the fastest rise in Bangladesh‘s exports to India (20.49 per
cent CAGR), while the growth of imports from India declined to 12.59 per cent per annum
(table 3). Nevertheless, Bangladesh exports account for only 1 per cent of India‘s total
imports and the range of products is small, comprising mostly fertilizers and jute products.
Ready-made garments form Bangladesh‘s major exports, but the share going to India is very
18
small, at least so far. A large part of India-Bangladesh trade passes through Petrapole (India)
and Benapole (Bangladesh) along SC 1.
Table 4 gives some idea about the trade that passes through this border along SC 1. It clearly
shows that land trade overwhelmingly outweighs sea trade, with the Petrapole border alone
contributing about 57 per cent of India‘s exports to Bangladesh. Hence, the importance of SC
1 in regional trade cannot be ignored. This fact alone was an important reason for selecting
this corridor for further investigation of the empirical relationship between trade facilitation
and poverty.
Table 3. Bangladesh trade with India (Unit: US$ million)
Year Exports Imports
1990 21.68 170.27
2000 50.13 945.45
2010 320.91 3 859.82 CAGR (1990s), (%) 9.61 22.06
CAGR (2000s), (%) 20.49 12.59 Source: United Nations COMTRADE database.
Table 4. India's exports through major ports
(Unit: Per cent)
1996-1997 2003-2004 2010-2011*
Land (road and rail) Petrapole (mainly road) 56.6 36.2 57.2 Ranaghat (Gede) (rail) 5.2 11.5 17.5
Radhikapur (rail) 0.6 1.9 2.4
Hili (Road) 2.9 5.9 6.1 Kotwaligate(Mohedipur by road)
4.3 6.9 2.8
Sea
Mumbai 9.3 1.3 0.6
Nhava Seva 3.3 5.3 7.1 Chennai 1.9 2.5 1.3
Tuticorin 1.8 1.5 0.7
Vishakapatnam 0.7 2.8 1.1 Kakinada 0.9 2.5 0.4
Others 12.5 21.7 2.8
Source: Calculated based on DGCIS, Ministry of Commerce, Government of India *Based on Indian Customs data.

19
As shown in table 5, SC 1 passes through six Indian States (table 5), of which two – Bihar
and Uttar Pradesh - have poverty rates that are higher than the national average.23 In
addition, in absolute numbers, the percentage of poor people is relatively higher in those two
States, compared to the other four States. Between 2004-2005 and 2009-2010 the rural
poverty rate in Bihar only declined marginally from 55.7 per cent to 55.3 per cent,
respectively. Therefore, trade facilitation in SC 1 is an important avenue for the lowering
poverty rate.
Table 5. Poverty rate, Tendulkar Methodology (Unit: Per cent)
State 2004-2005 2009-2010
Rural Urban Total Rural Urban Total
Bihar 55.7 43.7 54.4 55.3 39.4 53.5
Delhi 15.6 12.9 13.0 7.7 14.4 14.2
Haryana 24.8 22.4 24.1 18.6 23.0 20.1
Punjab 22.1 18.7 20.9 14.6 18.1 15.9
Uttar Pradesh
42.7 34.1 40.9 39.4 31.7 37.7
West Bengal 38.2 24.4 34.2 28.8 22.0 26.7
India 42.0 25.5 37.2 33.8 20.9 29.8
Source: ―Press Note on Poverty Estimates, 2009-10‖, Planning Commission, Government of India, 13 March 2012.
4. Trade facilitation and poverty: Major empirical findings
The primary survey was conducted among individuals residing near the borders at Attari
(India-Pakistan), and Petrapole and Ghojadanga (India-Bangladesh), and who were
dependent on trade with Bangladesh and Pakistan along SC 1. This section presents the
major findings of the field survey for two separate categories – individuals and firms.
23
The poverty rate developed by the Tendulkar Committee was followed here. The methodology uses implicit prices for estimating State-wise poverty lines for 2004-2005. Using these poverty lines and the distribution of monthly per capita consumption expenditure, based on a mixed reference period, the Tendulkar Committee estimated poverty ratios for 2004-2005. Implicit price indices (Fisher Price Index) have been computed from the 66th Round NSS (2009-2010) data on the Household Consumer Expenditure Survey. As per Tendulkar Committee recommendations, the State-wise urban poverty lines of 2004-2005 have been updated for 2009-2010 based on price rises during this period, using Fisher Price indices. The State-wise rural-urban price differential for 2009-2010 has been applied on State-specific urban poverty lines in order to get State-specific rural poverty lines. The head count ratio (HCR) is obtained using urban and rural poverty lines, which have been applied to the MPCE distribution of the States. The aggregated BPL population of the States has been used to obtain the final all-India HCR and poverty lines in rural and urban areas.
20
4.1 Individual respondents
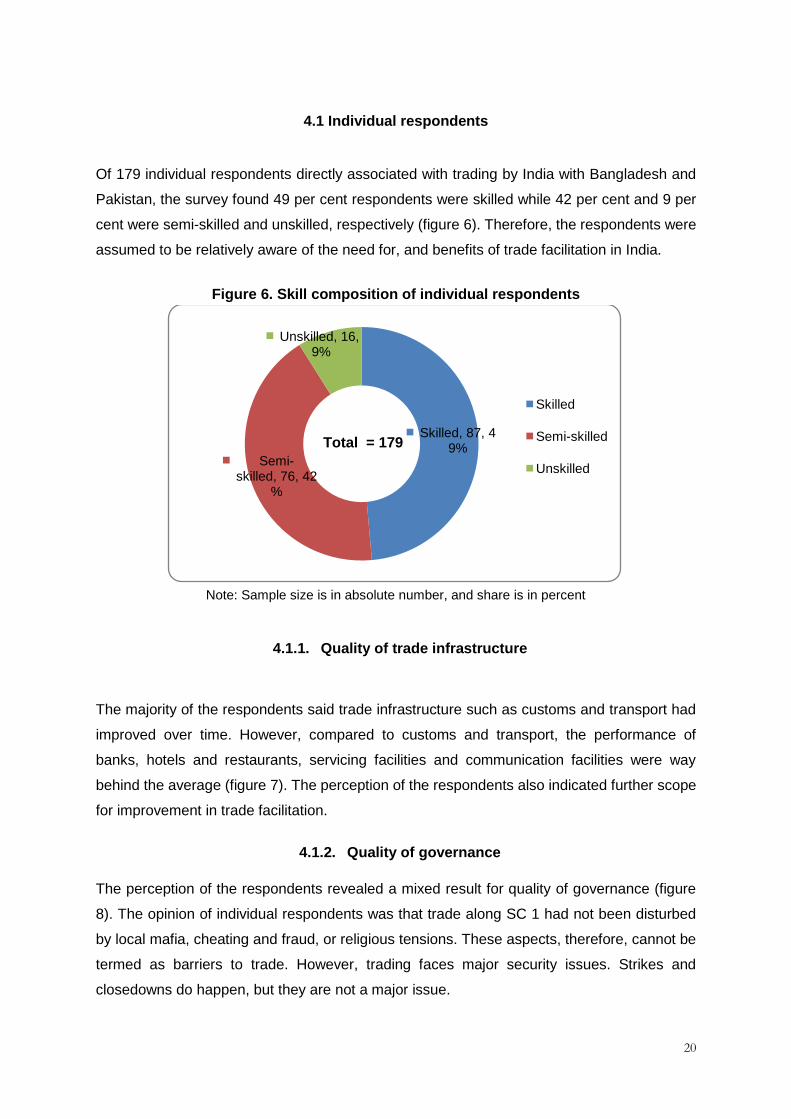
Of 179 individual respondents directly associated with trading by India with Bangladesh and
Pakistan, the survey found 49 per cent respondents were skilled while 42 per cent and 9 per
cent were semi-skilled and unskilled, respectively (figure 6). Therefore, the respondents were
assumed to be relatively aware of the need for, and benefits of trade facilitation in India.
Figure 6. Skill composition of individual respondents
Note: Sample size is in absolute number, and share is in percent
4.1.1. Quality of trade infrastructure
The majority of the respondents said trade infrastructure such as customs and transport had
improved over time. However, compared to customs and transport, the performance of
banks, hotels and restaurants, servicing facilities and communication facilities were way
behind the average (figure 7). The perception of the respondents also indicated further scope
for improvement in trade facilitation.
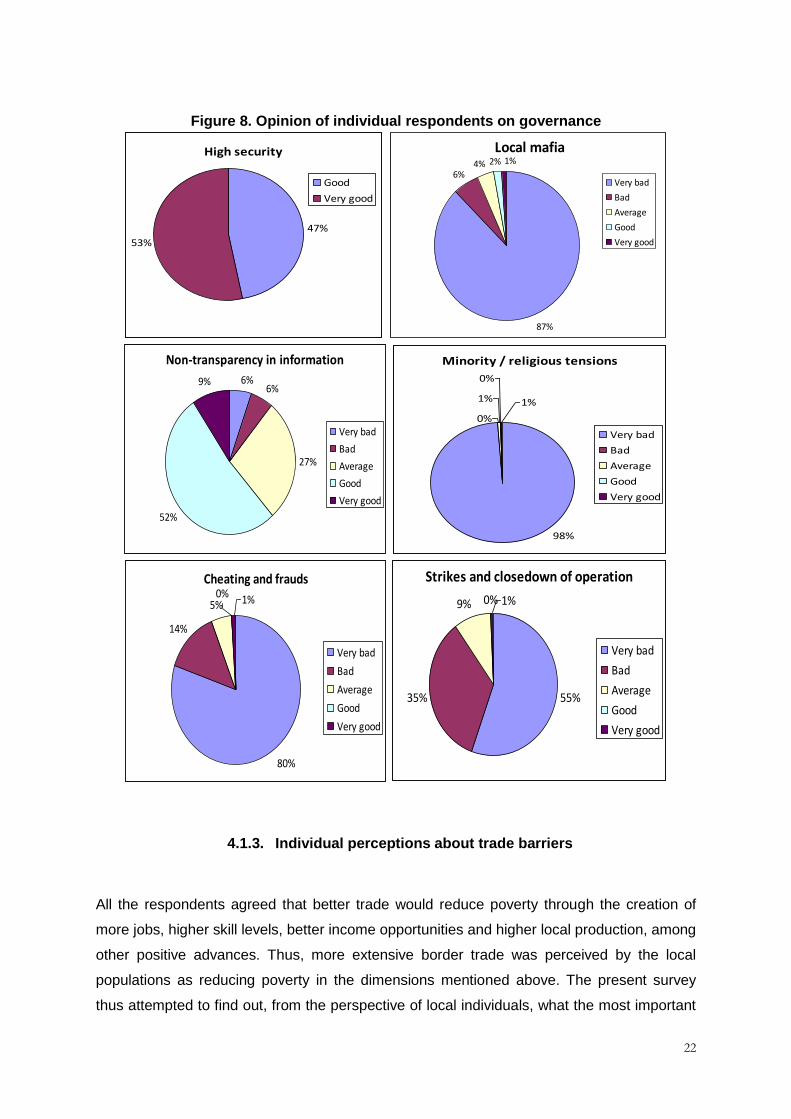
4.1.2. Quality of governance
The perception of the respondents revealed a mixed result for quality of governance (figure
8). The opinion of individual respondents was that trade along SC 1 had not been disturbed
by local mafia, cheating and fraud, or religious tensions. These aspects, therefore, cannot be
termed as barriers to trade. However, trading faces major security issues. Strikes and
closedowns do happen, but they are not a major issue.
Skilled, 87, 49%
Semi-skilled, 76, 42
%
Unskilled, 16,9%
Skilled
Semi-skilled
Unskilled
Total = 179

21
Figure 7. Opinion of respondents about quality of trade infrastructure
0% 0%
12%
57%
31%
Customs
Average
Good
Very good
31%
4%8%22%
35%
Transport infrastructure
Very bad
Bad
Average
Good
Very good
37%
23%5%
13%
22%
Banks
Very bad
Bad
Average
Good
Very good
29%
46%
1%6%
18%
Hotels and restaurants
Very bad
Bad
Average
Good
Very good
42%
24%
10%
7%
17%
Servicing facilities
Very bad
Bad
Average
Good
Very good
25%
37%
10%
12%
16%
Communications facilities
Very bad
Bad
Average
Good
Very good
22
Figure 8. Opinion of individual respondents on governance
4.1.3. Individual perceptions about trade barriers
All the respondents agreed that better trade would reduce poverty through the creation of
more jobs, higher skill levels, better income opportunities and higher local production, among
other positive advances. Thus, more extensive border trade was perceived by the local
populations as reducing poverty in the dimensions mentioned above. The present survey
thus attempted to find out, from the perspective of local individuals, what the most important
High security
47%
53%
Good
Very good
Local mafia
87%
6%4% 2% 1%
Very bad
Bad
Average
Good
Very good
Non-transparency in information
6%6%
27%
52%
9%
Very bad
Bad
Average
Good
Very good
Minority / religious tensions
0%
1%
0%
98%
1%
Very bad
Bad
Average
Good
Very good
Cheating and frauds
80%
14%
5%0% 1%
Very bad
Bad
Average
Good
Very good
Strikes and closedown of operation
55%35%
9% 0% 1%
Very bad
Bad
Average
Good
Very good
23
barriers were to increasing border trade between India and Pakistan as well as between
Pakistan and Bangladesh.
The methodology used for the survey was a detailed questionnaire that was given to 179
individuals connected with the border trade process. The respondents were asked about their
types of job (either skilled or unskilled), their experience and their annual income. All these
variables were taken as control variables. On the other hand, the perception of the individuals
was ranked on a scale of 1 to 5, with 1 representing the highest barrier and 5 as the least
barrier. The following categories of variables were taken as acting as barriers to trade (hence,
obstacles to poverty reduction through trade):
(a) A lack of infrastructure, i.e., customs, transport, banks, hotels and restaurants,
servicing facilities, communication;
(b) A lack of governance, i.e., security, mafia presence, non-transparency in
information, cheating and strikes.
Table 6. Marginal effects in elasticity of Ordered Probit Regression (Calculated at mean values)
Variables Skill levels
Experience Annual income
Customs 0.0730 -0.2238 0.1978** Transport -0.0453 0.0374 -0.0424 Banks -0.1446 -0.0716 0.1411 Hotels 0.0645 -0.2767 0.2609**
Servicing facilities -0.2052 -0.3206 0.1744 Communication -0.2171 -0.3736* 0.1734 Lack of security 0.2607 0.0760 0.0328 Mafia dominance 4.4633*** -1.6234 -0.4178 Lack of transparent information
-2.0745*** -0.5506* 0.1208
Cheating in transactions 4.0489*** 0.2563 -0.3357 Strikes by workers -2.1594** -0.0024 -0.4132 Notes: (a) The values are the changes in probability of having an outcome value of 5 in the ranking of the respective categorical variables. Thus, a negative sign indicates less area under that value in the probability of outcome curves, and opposite for a positive sign;
(b) The values are all elasticities, and a value greater than 1 indicates elastic and less than 1 implies inelastic;
(c) The asterisks denote significance levels, with * = 10 per cent, ** = 5 per cent and *** = 1 per cent significance
Although the survey involved a total of 179 respondents, the observations of only 143 were
actually used since the remaining respondents provided incomplete responses or, in some
cases, indicated income levels that were too high. An Ordered Probit Regression analysis
was made of the categorical variables on which the ordered responses were received. The
main purpose of the study was not to deliberate on the coefficients of the regression but on

24
the resulting marginal effects that showed the shift of the underlying probability distribution
consequent upon change in the levels of some of the control variables. The aim was to get an
estimate of the degree and sign of change in the perception of those individuals who
considered the respective barrier to be the least problematic. Table 6 summarises the
Ordered Probit regression results.
With regard to infrastructure barriers to trade, surprisingly none of the independent variables
affect the outcome probabilities significantly, except for (a) income, which affects customs
and hotels; and (b) experience, which affects communications. Those with higher incomes
considered customs and hotels to be lesser barriers. The respondents with more extensive
experience in their jobs considered communications to be more of a barrier. Other values
were not significant. Thus, perceptions of individuals about possible barriers were not
significantly related to either skill levels or experience, or even income levels, except in just
three cases. Further, the changes were not elastic, signifying a less dramatic response to
changes in the control variables.
With regard to governance-related issues, the skills variable is the most important. People
with more skills are likely to consider mafia dominance as well cheating as less of a problem.
Also, they consider a lack of transparent information and strikes by workers as more of a
hindrance to trade. These are all highly significant effects. At the same time, they are highly
elastic, signifying dramatic change in perception as a person moves up the skills ladder.
Experience significantly affects the perception of a lack of transparent information as a
possible barrier. Income levels do not affect perception significantly in these categories.
Looking at table 6, it can be seen that the type of job, i.e., skilled or less skilled, matters most
in the formation of differential perceptions about barriers. Thus, a loader on a truck or a
restaurant worker view mafia and cheating as hindering the trade more compared with the
perception of a clearing agent or exporter. Although this may appear disturbing it could point
towards a nexus between the latter and mafia and cheating practices. However, this can only
be established conclusively by larger and focused surveys. Experience in terms of the
number of years worked does matter, as the more experienced respondents complained
more about the lack of both communications and transparency in information.
Surprisingly, income levels play a comparatively moderate role. People with either higher or
lower incomes did not differ much in perception except with regard to customs and hotels.
Thus, the poor and the wealthy connected with trade in the border areas, indicated relatively
similar views of trade barriers. All the respondents believed that trade would reduce poverty
25
through the creation of more jobs and skills as well as more local production, and those at the
bottom of the income scale did not view possible trade barriers any differently from those at
the top of the scale. Therefore, poverty reduction, in the perception of the individuals
connected with trade along SC 1, depends on the reduction of trade barriers through better
trade facilitation. The type of trade facilitation that may help in reducing poverty does not
appear to differ according to whether a person is wealthy or poor.
4.1.4. Opinions about trade, trade facilitation and poverty reduction
When asked whether trade was one of the responsible factors in reducing poverty, 59 per
cent of the respondents agreed (figure 9). However, the other 41 per cent felt that trade had
not succeeded in reducing poverty. Therefore, in an attempt to understand whether or not the
opinions of respondents regarding trade facilitation showed any relationship with poverty
reduction, a Logit regression was employed to assess this point. There are two issues: (a)
trade reduces poverty; and (b) trade facilitation accelerates trade. In a logistic regression,
both cannot be there in the Odds Ratio. Assuming that the second issue is true by definition,
the logic of transitivity implies an Odds Ratio in terms of whether individuals or firms believe
trade reduces poverty allows the binary variable (trade reduces poverty, where 1 = Yes and 0
= No) can be regressed on categorical variables that are entirely trade facilitation variables.
Thus, it is possible to answer the question of whether it is likely, from the perception of those
who are involved in cross-border trade, that trade facilitation will reduce poverty.24
Figure 9. Opinion of respondents on role of trade in poverty reduction
24
A Logit analysis based on perception survey is not historical in nature. However, the significance of predictions is checked based on such surveys. Hence, in a sense it cannot be a prediction based on historical time-series or panel data. On the other hand, since this study takes the approach that higher trade facilitation promotes more trade, the Logit analysis does show a direct link between trade facilitation and poverty reduction.
Yes
59%
No
41%
26
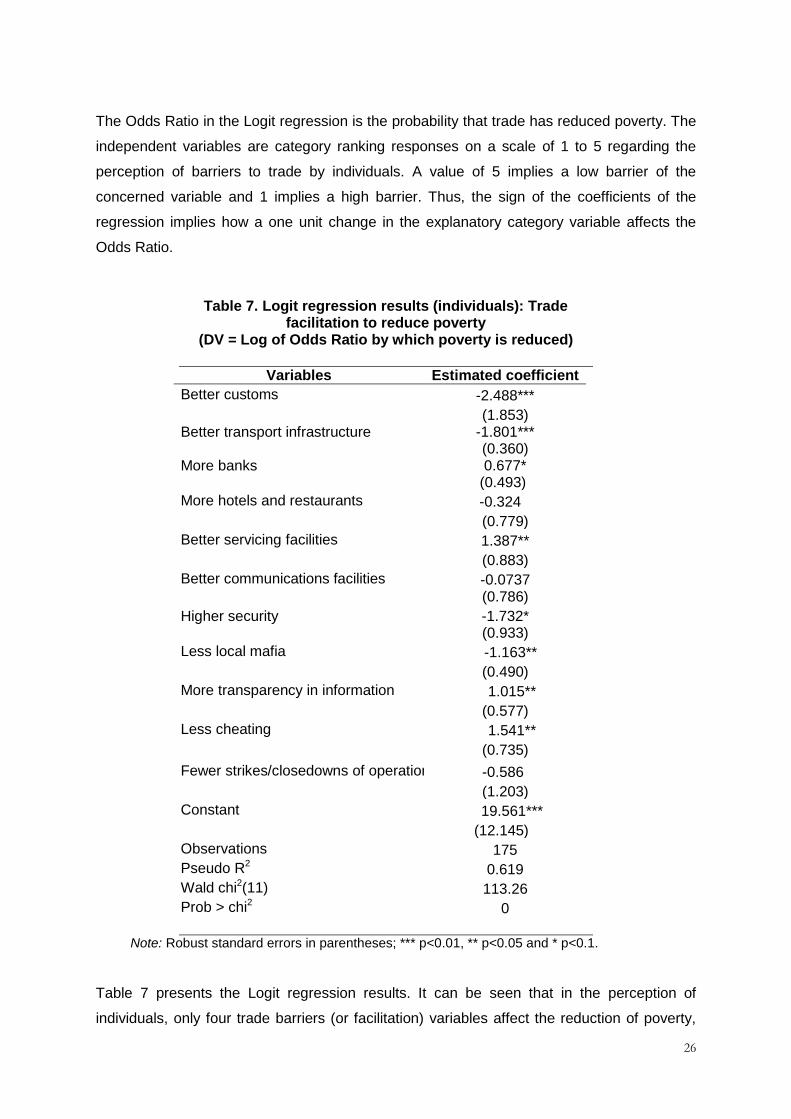
The Odds Ratio in the Logit regression is the probability that trade has reduced poverty. The
independent variables are category ranking responses on a scale of 1 to 5 regarding the
perception of barriers to trade by individuals. A value of 5 implies a low barrier of the
concerned variable and 1 implies a high barrier. Thus, the sign of the coefficients of the
regression implies how a one unit change in the explanatory category variable affects the
Odds Ratio.
Table 7. Logit regression results (individuals): Trade facilitation to reduce poverty
(DV = Log of Odds Ratio by which poverty is reduced)
Variables Estimated coefficient
Better customs -2.488***
(1.853) Better transport infrastructure -1.801*** (0.360) More banks 0.677* (0.493)
More hotels and restaurants -0.324
(0.779)
Better servicing facilities 1.387**
(0.883)
Better communications facilities -0.0737
(0.786)
Higher security -1.732* (0.933)
Less local mafia -1.163**
(0.490)
More transparency in information 1.015**
(0.577)
Less cheating 1.541**
(0.735)
Fewer strikes/closedowns of operation -0.586
(1.203)
Constant 19.561***
(12.145)
Observations 175
Pseudo R2 0.619
Wald chi2(11) 113.26
Prob > chi2 0
Note: Robust standard errors in parentheses; *** p<0.01, ** p<0.05 and * p<0.1.
Table 7 presents the Logit regression results. It can be seen that in the perception of
individuals, only four trade barriers (or facilitation) variables affect the reduction of poverty,

27
i.e., banks, servicing facilities, more transparency in information and less cheating in
transactions. These are all statistically significant variables. However, better facilitation in
terms of infrastructure variables such as customs or transport, and governance variables
such as local mafia or high security does not appear to be important in increasing the
probability of a positive response regarding poverty reduction. The usual caveat is that the
Logit regression result needs deeper introspection. In other words, in the view of individuals
engaged in trade along SC 1, trade facilitation alone may not create opportunities for poverty
reduction.
4.2 Opinions of firms
Interviews were held with 100 Indian firms doing business with Pakistan and Bangladesh,
mostly located along SC 1 in places such as Amritsar, Ludhiana and Kolkata, of which 58 per
cent are trading with Bangladesh, 21 per cent with Pakistan and the remaining 21 per cent
with other countries such as Afghanistan, Central Asia, the Middle East and Gulf States,
Europe and East Asia (figure 10). As of March 2012, the interviewed firms had generated
direct employment of 32,820 people, of whom 89 per cent were skilled employees and
remainder unskilled (figure 11). The surveyed firms were exporting and importing various
goods, including agricultural products, via SC 1. Such goods pass through Attari-Wagah
(trade with Pakistan) and Petrapole-Benapole (trade with Bangladesh).25
Figure 10. Distribution of firms in terms of trading partners
25
These traded items are not discussed here as that is beyond the scope of this study. However, a list of such items is available on request.
Trading with
Pakistan 21%
Trading with
Bangladesh 58%
Trading with
other countries
21%

28
Figure 11. Skills composition in employment
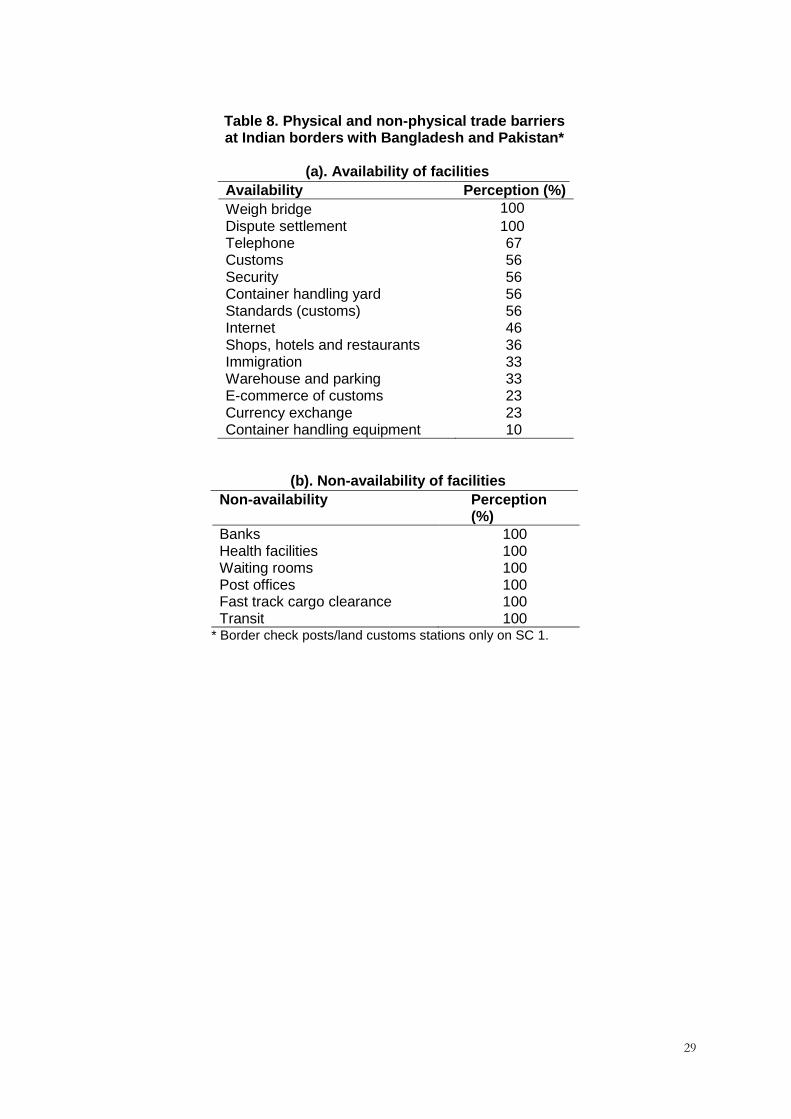
4.2.1. Availability of trade infrastructure
Table 8 presents the perception of the surveyed firms concerning the availability of trade
infrastructure. All the firms felt that dispute settlement arrangements and weigh bridge
facilities were available. However, regarding the availability of the remaining facilities and
services, perception varied across firms. While only 10 per cent of the respondents said
container handling equipment was available (90 per cent disagreed with this perception), 33
per cent firms said telephone facilities were not available (67 per cent disagreed with this
view). Nonetheless, all the firms said some facilities were not available at all such as transit
services, fast track cargo clearance, post offices, waiting rooms, health facilities and banks.
4.2.2. Opinions about logistics costs in SC 1
While the opinions of the majority of respondents indicated port and airport charges in India
were high, a large majority suggested that the rate of road and rail transportation charges as
well as warehouse and loading service charges were average (figure 12). Thus, logistics
costs (domestic) are a critical factor in facilitating trade with Bangladesh and Pakistan.
Unskilled,
3 641 (11%)
Skilled, 29 179
(89%)
29
Table 8. Physical and non-physical trade barriers at Indian borders with Bangladesh and Pakistan*
(a). Availability of facilities
Availability Perception (%)
Weigh bridge 100 Dispute settlement 100 Telephone 67 Customs 56 Security 56 Container handling yard 56 Standards (customs) 56 Internet 46 Shops, hotels and restaurants 36 Immigration 33 Warehouse and parking 33 E-commerce of customs 23 Currency exchange 23 Container handling equipment 10
(b). Non-availability of facilities
Non-availability Perception (%)
Banks 100 Health facilities 100 Waiting rooms 100 Post offices 100 Fast track cargo clearance 100 Transit 100
* Border check posts/land customs stations only on SC 1.

30
Figure 12. Opinions on operational logistics costs
4.2.3. Transaction time at border
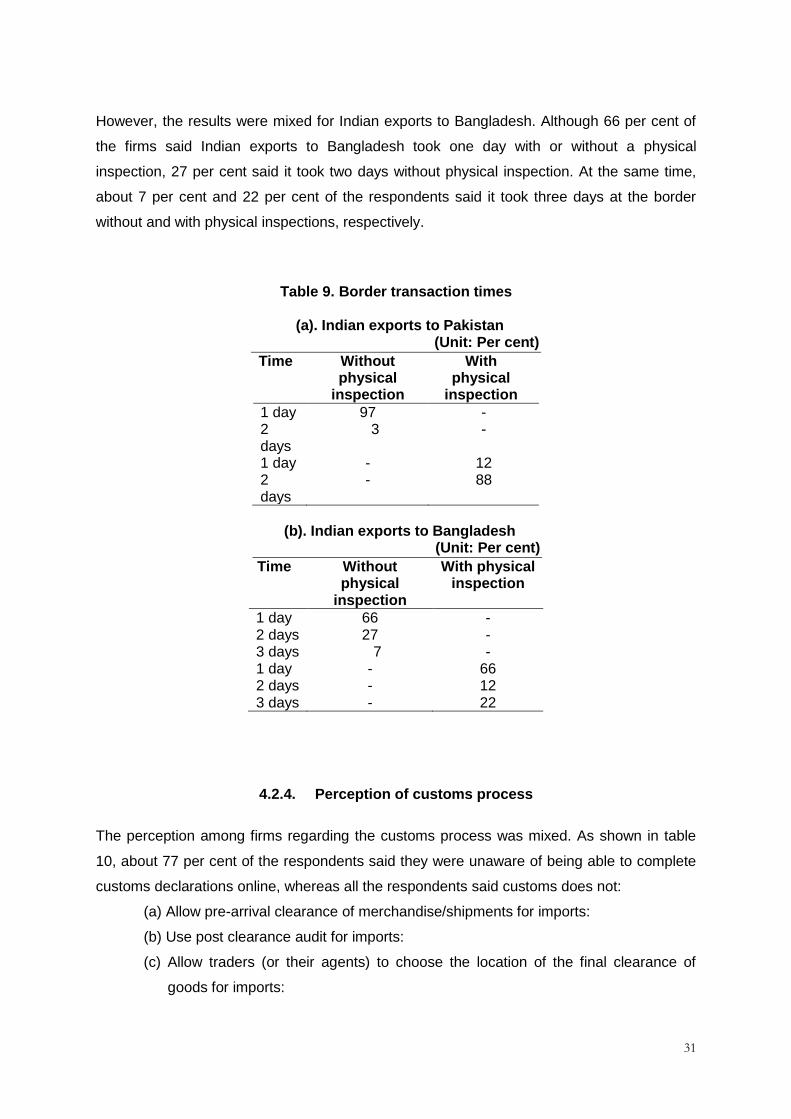
The opinions of firms indicate that the processing of India‘s exports to Pakistan take a shorter
time at the border compared with India‘s exports to Bangladesh. According to 97 per cent of
the respondents, India‘s exports to Pakistan take one day without physical inspection, while
88 per cent of the respondents said processing required two days with physical inspections
(table 9).
Port Charges
2%
80%
18%Very high
High
Average
Low
Very low
Airport Charges
4%
78%
18%
Very high
High
Average
Low
Very low
Road Transport Rates
29%
59%
12%
Very high
High
Average
Low
Very low
Rail Transport Rates
0% 10%
72%
18%0%
Very high
High
Average
Low
Very low
Warehouses/loading service charges
1%
19%
78%
2%
Very high
High
Average
Low
Very low
CHA Fees
11%
43%
46%
Very high
High
Average
Low
Very low
31
However, the results were mixed for Indian exports to Bangladesh. Although 66 per cent of
the firms said Indian exports to Bangladesh took one day with or without a physical
inspection, 27 per cent said it took two days without physical inspection. At the same time,
about 7 per cent and 22 per cent of the respondents said it took three days at the border
without and with physical inspections, respectively.
Table 9. Border transaction times
(a). Indian exports to Pakistan (Unit: Per cent)
Time Without physical
inspection
With physical
inspection 1 day 97 - 2 days
3 -
1 day - 12 2 days
- 88
(b). Indian exports to Bangladesh
(Unit: Per cent)
Time
Without physical
inspection
With physical inspection
1 day 66 - 2 days 27 - 3 days 7 - 1 day - 66 2 days - 12 3 days - 22
4.2.4. Perception of customs process
The perception among firms regarding the customs process was mixed. As shown in table
10, about 77 per cent of the respondents said they were unaware of being able to complete
customs declarations online, whereas all the respondents said customs does not:
(a) Allow pre-arrival clearance of merchandise/shipments for imports:
(b) Use post clearance audit for imports:
(c) Allow traders (or their agents) to choose the location of the final clearance of
goods for imports:

32
(d) Allow goods to be released pending final clearance against an accepted
guarantee.
At the same time, all the firms said that the customs code required importers to use a
licenced customs broker to clear goods, Customs does interact formally to discuss about
policy, and receive advance notification of binding changes with regard to tariff classification,
valuation or rules of origin from customs. In addition, about 35 per cent of the respondents
were unaware of the availability of a review/appeal procedure in cases of disputes with
Customs.
Table 10. Perception about customs processing at border crossings (Unit: Per cent)
Yes No Do not know
Can a customs declaration be submitted online? 23 77
Does customs allow for pre-arrival clearance of merchandise/shipments for import?
100
Does the custom code require importers to use a licenced custom broker to clear goods?
100
Does customs use a post-clearance audit for imports?
100
Are you and your customers able to choose the location of the final clearance of goods for imports?
100
Can goods be released pending final clearance against an accepted guarantee?
100
Are you and your peers invited for dialogue by Customs through a formal process (periodic meetings, consultative forums or committees etc.)?
100
In cases of disputes with customs or other border agencies, is a review/appeal procedure available?
65 35
Do you receive advance notification of binding changes with regard to tariff classification, valuation or rules of origin?
100
4.2.5. Trade barriers identified by Indian exporters and importers
During the survey, 40 per cent of the interviewed firms identified some barriers that they had
faced while exporting and importing with Bangladesh and Pakistan. Tables 11(a) and 11(b)
contain lists of barriers and relevant regulators. These barriers are a mixture of physical and
non-physical bottlenecks, and cover many issues ranging from the repair and development of
roads and highways to slow access to the Electronic Data Interchange (EDI) system.
Subnational cases such as value-added tax (VAT) were also identified as a barrier to trade.
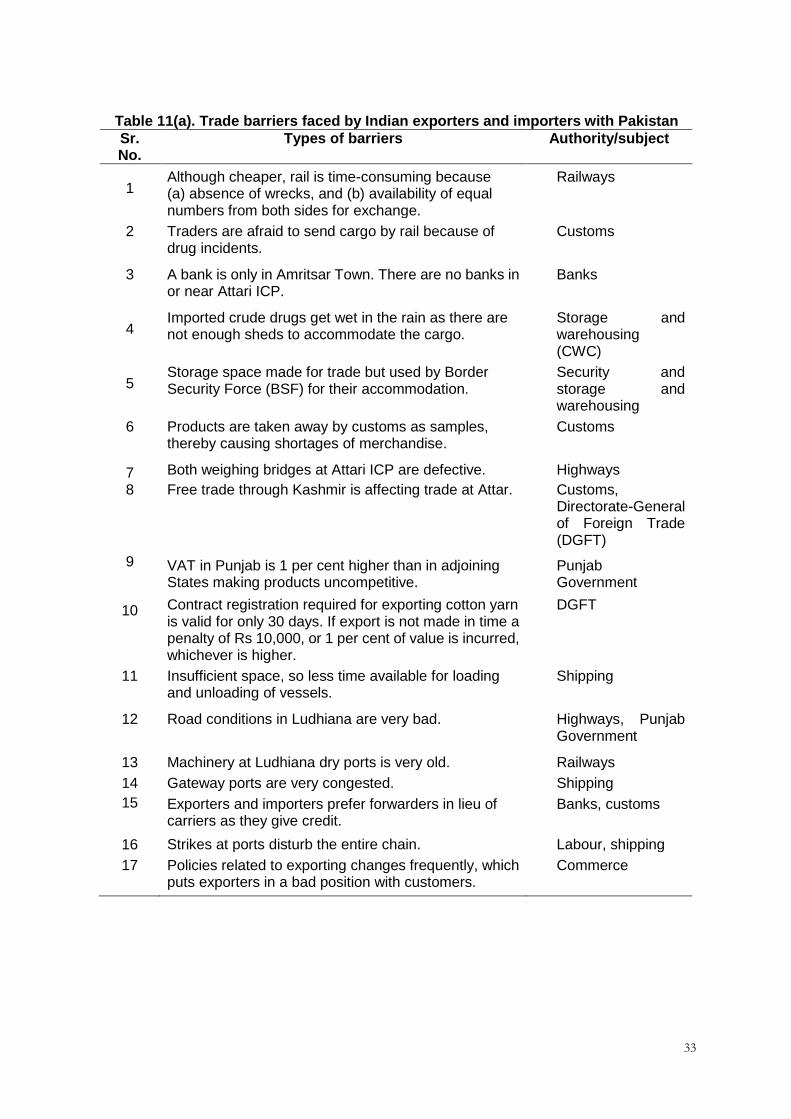
33
Table 11(a). Trade barriers faced by Indian exporters and importers with Pakistan
Sr. No.
Types of barriers Authority/subject
1
Although cheaper, rail is time-consuming because (a) absence of wrecks, and (b) availability of equal numbers from both sides for exchange.
Railways
2
Traders are afraid to send cargo by rail because of drug incidents.
Customs
3
A bank is only in Amritsar Town. There are no banks in or near Attari ICP.
Banks
4
Imported crude drugs get wet in the rain as there are not enough sheds to accommodate the cargo.
Storage and warehousing (CWC)
5
Storage space made for trade but used by Border Security Force (BSF) for their accommodation.
Security and storage and warehousing
6
Products are taken away by customs as samples, thereby causing shortages of merchandise.
Customs
7 Both weighing bridges at Attari ICP are defective. Highways
8
Free trade through Kashmir is affecting trade at Attar. Customs, Directorate-General of Foreign Trade (DGFT)
9
VAT in Punjab is 1 per cent higher than in adjoining States making products uncompetitive.
Punjab Government
10
Contract registration required for exporting cotton yarn is valid for only 30 days. If export is not made in time a penalty of Rs 10,000, or 1 per cent of value is incurred, whichever is higher.
DGFT
11
Insufficient space, so less time available for loading and unloading of vessels.
Shipping
12
Road conditions in Ludhiana are very bad. Highways, Punjab Government
13 Machinery at Ludhiana dry ports is very old. Railways
14 Gateway ports are very congested. Shipping
15
Exporters and importers prefer forwarders in lieu of carriers as they give credit.
Banks, customs
16 Strikes at ports disturb the entire chain. Labour, shipping
17
Policies related to exporting changes frequently, which puts exporters in a bad position with customers.
Commerce
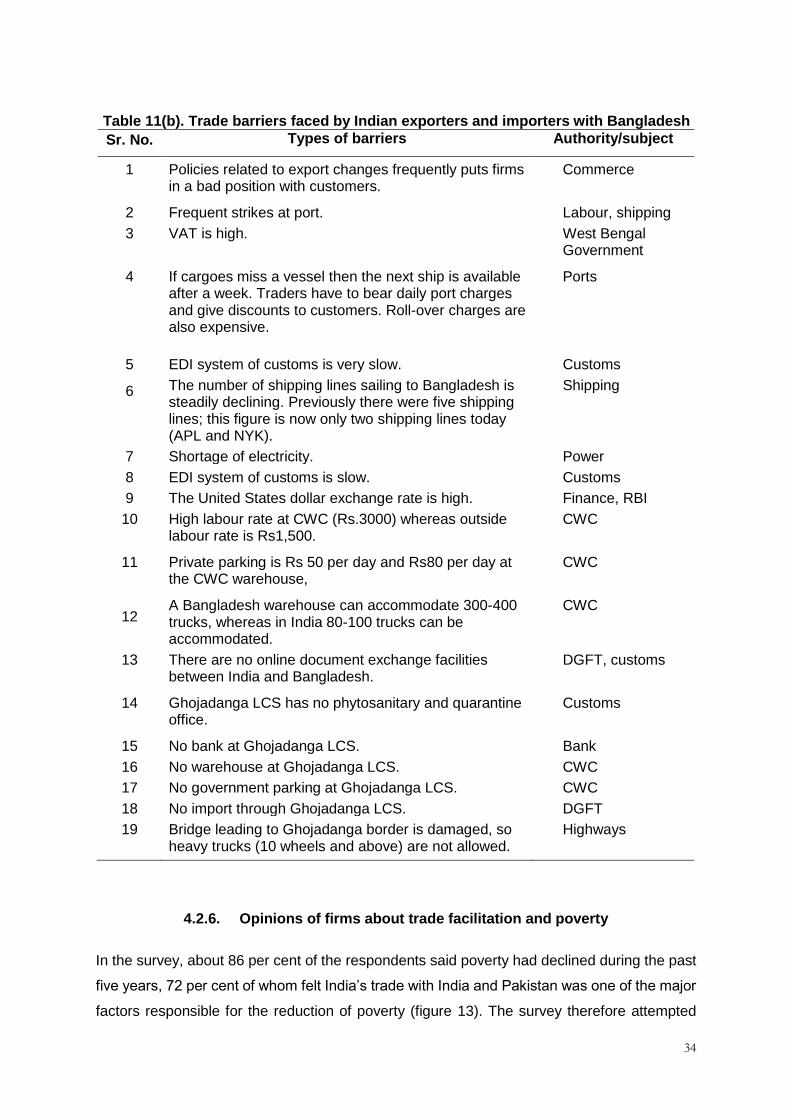
34
Table 11(b). Trade barriers faced by Indian exporters and importers with Bangladesh
Sr. No. Types of barriers Authority/subject
1
Policies related to export changes frequently puts firms in a bad position with customers.
Commerce
2 Frequent strikes at port. Labour, shipping
3
VAT is high. West Bengal Government
4
If cargoes miss a vessel then the next ship is available after a week. Traders have to bear daily port charges and give discounts to customers. Roll-over charges are also expensive.
Ports
5 EDI system of customs is very slow. Customs
6
The number of shipping lines sailing to Bangladesh is steadily declining. Previously there were five shipping lines; this figure is now only two shipping lines today (APL and NYK).
Shipping
7 Shortage of electricity. Power
8 EDI system of customs is slow. Customs
9 The United States dollar exchange rate is high. Finance, RBI
10
High labour rate at CWC (Rs.3000) whereas outside labour rate is Rs1,500.
CWC
11
Private parking is Rs 50 per day and Rs80 per day at the CWC warehouse,
CWC
12
A Bangladesh warehouse can accommodate 300-400 trucks, whereas in India 80-100 trucks can be accommodated.
CWC
13
There are no online document exchange facilities between India and Bangladesh.
DGFT, customs
14
Ghojadanga LCS has no phytosanitary and quarantine office.
Customs
15 No bank at Ghojadanga LCS. Bank
16 No warehouse at Ghojadanga LCS. CWC
17 No government parking at Ghojadanga LCS. CWC
18 No import through Ghojadanga LCS. DGFT
19
Bridge leading to Ghojadanga border is damaged, so heavy trucks (10 wheels and above) are not allowed.
Highways
4.2.6. Opinions of firms about trade facilitation and poverty
In the survey, about 86 per cent of the respondents said poverty had declined during the past
five years, 72 per cent of whom felt India‘s trade with India and Pakistan was one of the major
factors responsible for the reduction of poverty (figure 13). The survey therefore attempted

35
with the help of Logit regression to assess whether or not there was any empirical
relationship between trade facilitation and poverty reduction from the perspective of exporters
and importers.
Figure 13. Perception about poverty and trade facilitation
Table 12. Logit regression results (firms): Reduction of poverty by trade facilitation
(DV = Log of Odds Ratio by which poverty is reduced)
Variables Estimated
coefficients
Better infrastructure at checkpoints
9.59*** (1.413)
Better transportation infrastructure for accessing checkpoints
31.70***
(1.552)
Better telecommunications infrastructure at checkpoints
-6.76***
(0.518)
Less bureaucracy and red-tape at checkpoints
47.09***
(2.863)
Less corruption and bribery at checkpoints
-15.87***
(1.035)
Faster handling equipment
27.96***
(1.577)
Less lengthy paper work at checkpoints
-79.31***
(1.526)
Observations 100
Pseudo R2 0.869
Wald chi2 (Prob > chi2) 70.91 (0) Note: Robust standard errors in parentheses; ***p<0.01, **p<0.05 and *p<0.1.
Do You Think Poverty Has Gone Down
over the Last 5 years?
No
14%
Yes
86%
If Yes, Do You Think Trade with Pakistan
and Bangladesh is One of the Major
Responsible Factor for Reduction of
Poverty?
No
28%
Yes
72%

36
Table 12 presents the Logit regression results. As discussed above, the Logit regression
presents the probability that trade has reduced poverty. The opinions of firms towards poverty
and trade facilitation are considered here. The independent variables are categorical ranking
responses on a scale of 1 to 5 with regard to perception of barriers to trade by the firms. A
value of 5 implies the lowest barrier of the concerned variable as in the individual regression
while 1 implies a very high barrier. Thus, the sign of the coefficients of the regression implies
how one unit changes in the explanatory variable affects the Odds Ratio (outcome variable).
It was found that four trade barrier (or facilitation) variables were perceived as affecting
reduction of poverty, i.e., less bureaucracy and red-tape, better infrastructure, better
transportation and faster handling equipment. These variables are statistically significant at
the 1 per cent level. With 87 per cent Pseudo R2, regression is also robust. However, poor
border telecommunications infrastructure, less corruption and bribery at checkpoints and
lengthy paperwork do not appear to be significantly important in increasing the probability of a
positive response regarding poverty reduction.
The results obtained from the survey are quite startling. This may be due to the pooled
regression of firms operating at the two borders – Wagah at the India-Pakistan border and
Petrapole at the India-Bangladesh border. Although the infrastructure at Wagah has
improved considerably in the past few years, the same is not the case at Petrapole. More
firms operating on the Bangladesh border believe that poverty has declined despite the
inadequate trade-related infrastructure. In the case of governance-related variables, there is
not much difference. Thus, poor transportation or inadequate infrastructure may be
hampering cross-border trade, especially between India and Bangladesh, but that has not
prevented firms from believing that poverty is getting less over time.
With regard to governance-related variables, the survey shows that even if firms believe that
less corruption and bribery or less lengthy paperwork may facilitate trade, they have not
influenced the firms‘ perception of poverty reduction. In other words, in general, the
perception of firms engaged in trade along SC 1 is that trade facilitation may create
opportunities for reduction of poverty. However, the perception is mixed and the connection
of the variables to poverty alleviation needs to be clarified through follow-up surveys of the
specific variables. Thus, the usual caveat is that the Logit regression result needs more
detailed assessment.

37
Conclusion
The major findings of the study are presented in two separate categories – individuals and
firms. The majority of the individual respondents noted that trade infrastructure quality such
as customs and transport had improved over time. However, compared to customs and
transport, the respondents indicated that the performance of banks, hotels and restaurants,
servicing facilities and communication facilities were much below average. They also
indicated that a there was further scope for improvement in trade facilitation.
However, trading faces the issue of heavy security.
With regard to the quality of trade governance, of the reactions of the individual respondents
was mixed. They indicated that trade along SC 1 had not been disturbed by the local mafia,
cheating and fraud or religious tension. These issues therefore cannot be termed as
barriers to trade in the present context. Although strikes and closedowns occur, they are also
not a major issue. However, trading faces the issue of heavy security. The individual
respondents all agreed that better trade would reduce poverty through the creation of more
jobs, higher skills, better income opportunities and higher local production, among other
benefits. Thus, expansion of border trade was perceived as helping to reduce poverty within
the dimensions discussed in this study.
Regarding infrastructure barriers to trade, surprisingly none of the independent variables had
affected the outcome probabilities significantly with the exceptions of income, which had
affected customs and hotels, and experience, which had affected communications. Those
with higher incomes considered customs and hotels to be lesser barriers. People with more
experience in jobs considered communications as a more significant barrier. Other values
were not found to be significant. Thus, the perceptions of individuals about possible barriers
were not significantly related to either skill levels or experience, or even income levels, except
in just three cases. In addition, the changes are not elastic signifying a less dramatic
response to changes in the control variables.
With regard to governance-related issues, it was found that the skills variable was found to be
the most important. People with better skills were to be more likely to consider mafia
dominance and cheating as less of a problem. Instead, they considered a lack of transparent
information and strikes by workers to be more of a problem hampering trade. These are all
highly significant effects and are highly elastic, signifying dramatic changes in perception
while moving up the skill ladder. Likewise, experience significantly affected the perception of
38
a lack of transparent information as a possible barrier. Income levels, however, did not
significantly affect perception of these categories.
It can be concluded that the type of job, i.e., skilled or less-skilled, matters most in forming
perceptions about barriers. Thus, a loader on a truck or a restaurant worker view mafia and
cheating as hampering trade more compared with the perception of a clearing agent or
exporter. While this may appear disturbing it might point towards a nexus between the latter
and both the mafia and cheating practices; but this can only be confirmed by larger and
focused surveys. However, experience, in terms of the number of working years, does matter
as the more experienced respondents placed greater emphasis on complains about the lack
of communications and transparency in information.
Surprisingly, income levels were found to play a comparatively minor role. Respondents with
higher or lower income levels differed little in perception except in the case of customs and
hotels. Thus, the poor and the wealthy connected with trading in the border areas had similar
views of trade barriers. All believed that trade facilitation reduced poverty through more jobs
and skills creation, and increased local production. Thus, in the opinion of those individuals
connected with border trade, poverty reduction depended on a reduction of trade barriers
through better trade facilitation. Also, whether a respondent was wealthy or poor, there was
generally little difference in the perception of the type of trade facilitation that might help to
reduce poverty.
On the question of whether trade was one of the factors responsible for the reduction of
poverty, 59 per cent of the respondents gave an affirmative reply. However, the other 41 per
cent felt that trade had not succeeded to reduce poverty so far. This study shows that in the
perception of the individuals, only four trade barriers (or facilitation) variables affect the
reduction of poverty, i.e., banks, servicing facilities, more transparency in information and
less cheating in transactions. These are all statistically significant. On the other hand, better
facilitation in terms of infrastructure variables (such as customs and transportation) and
governance variables (such as local mafia or high security) did not appear to be important in
increasing the probability of a positive response regarding poverty reduction.
A similar exercise carried out with firms revealed that 86 per cent believed poverty had
declined and 72 per cent saw trade as major catalyst for that result. It is important to note that
the India-Pakistan border trade infrastructure was found to be much better than that for
India-Bangladesh border trade. In terms of governance variables (such as mafia, security and
bribery), the difference in perception was much less. However, for the Logit regression to
39
assess the link between trade facilitating variables and poverty reduction in the perception of
the firms, a pooled regression was taken in order to provide a reasonable sample size. This
might have even out the responses to a certain extent. In general, in the perception of the
firms, better infrastructure that encouraged more trade was also seen as facilitating a decline
in poverty. However, the same was not true with the perception of some governance
variables, such as cheating or extensive paperwork requirements.
The pilot survey described here is on cross-border trade. It must be kept in mind that a major
proportion of the income earners covered by the survey are employed in unskilled and
semi-skilled jobs on an informal contract basis. However, it was almost impossible to get any
official historical data about these workers and the analysis was thus unable to progress any
further. So, the perception survey appears to be the best alternative. Large-scale surveys
spanning a wide region can certainly be an alternative.
The results, for both individual and firms, need more in-depth examination as, in the
perception of those firms engaged in trade along SC 1, simply facilitating more trade may not
create opportunities for the reduction of poverty; it may be necessary to do so together with
better governance. The perception is mixed and the connection of the perception variables to
poverty alleviation needs to be clarified through follow-up surveys that focus on the specific
variables.
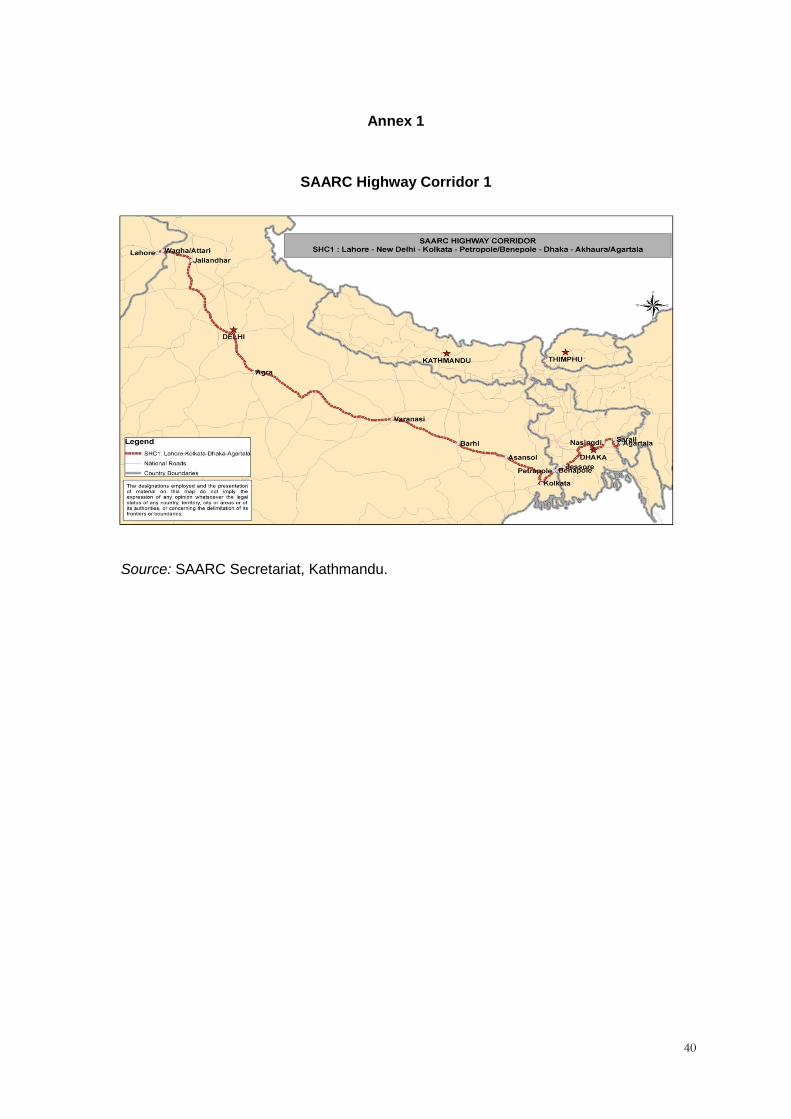
40
Annex 1
SAARC Highway Corridor 1
Source: SAARC Secretariat, Kathmandu.
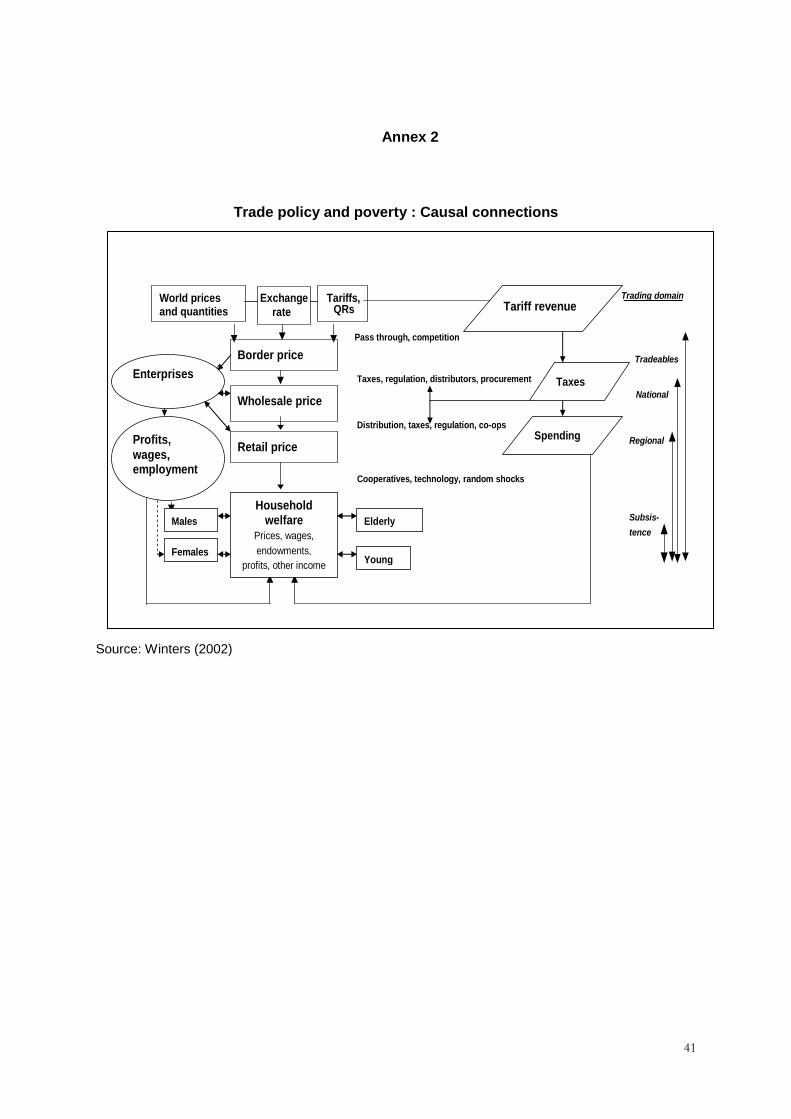
41
Annex 2
Trade policy and poverty : Causal connections
Source: Winters (2002)
Trading domain
Tradeables
Pass through, competition
National
Taxes, regulation, distributors, procurement
Regional
Distribution, taxes, regulation, co-ops
Cooperatives, technology, random shocks
Subsis-
tence
World prices
and quantities
Border price
Wholesale price
Tariffs, QRs
Retail price
Tariff Revenue
Welfare
Exchange
rate
elderly
Household welfare
Prices, wages,
endowments,
profits, other income
Elderly
Young
Males
Females
Enterprises
Profits,
wages, employment
Tariff revenue
Taxes
Spending
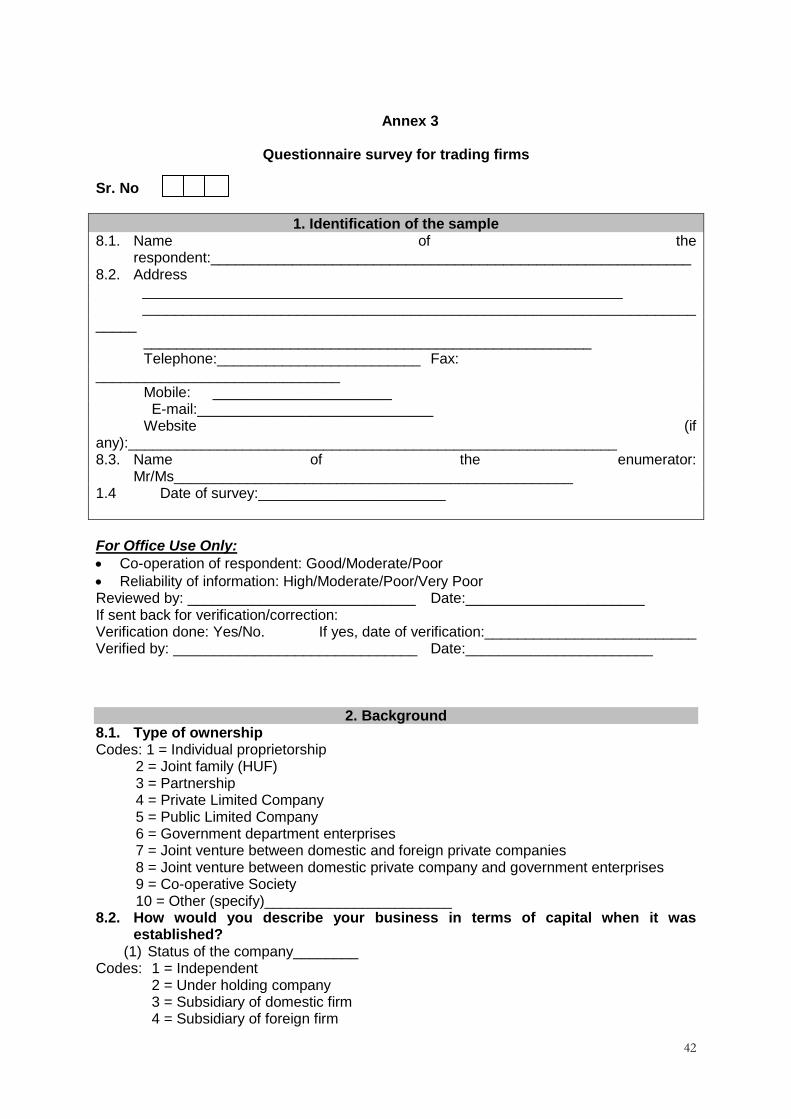
42
Annex 3
Questionnaire survey for trading firms
Sr. No
1. Identification of the sample 8.1. Name of the
respondent:___________________________________________________________ 8.2. Address
___________________________________________________________ ____________________________________________________________________
_____ _______________________________________________________ Telephone:_________________________ Fax:
______________________________ Mobile: ______________________
E-mail:_____________________________ Website (if
any):____________________________________________________________ 8.3. Name of the enumerator:
Mr/Ms_________________________________________________ 1.4 Date of survey:_______________________
For Office Use Only:
Co-operation of respondent: Good/Moderate/Poor
Reliability of information: High/Moderate/Poor/Very Poor Reviewed by: ____________________________ Date:______________________ If sent back for verification/correction: Verification done: Yes/No. If yes, date of verification:__________________________ Verified by: ______________________________ Date:_______________________
2. Background 8.1. Type of ownership Codes: 1 = Individual proprietorship
2 = Joint family (HUF) 3 = Partnership 4 = Private Limited Company 5 = Public Limited Company 6 = Government department enterprises 7 = Joint venture between domestic and foreign private companies 8 = Joint venture between domestic private company and government enterprises 9 = Co-operative Society 10 = Other (specify)_______________________
8.2. How would you describe your business in terms of capital when it was established?
(1) Status of the company________ Codes: 1 = Independent 2 = Under holding company
3 = Subsidiary of domestic firm 4 = Subsidiary of foreign firm
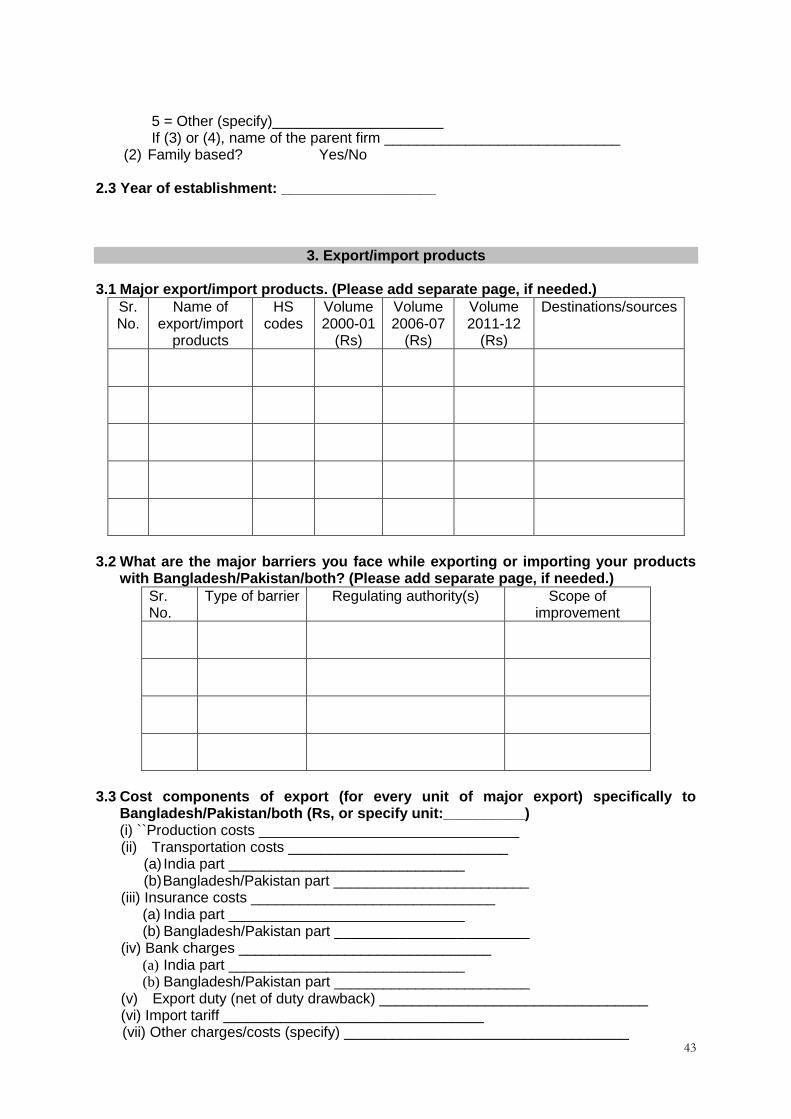
43
5 = Other (specify)_____________________ If (3) or (4), name of the parent firm _____________________________
(2) Family based? Yes/No 2.3 Year of establishment: ___________________
3. Export/import products 3.1 Major export/import products. (Please add separate page, if needed.)
Sr. No.
Name of export/import
products
HS codes
Volume 2000-01
(Rs)
Volume 2006-07
(Rs)
Volume 2011-12
(Rs)
Destinations/sources
3.2 What are the major barriers you face while exporting or importing your products
with Bangladesh/Pakistan/both? (Please add separate page, if needed.)
Sr. No.
Type of barrier Regulating authority(s) Scope of improvement
3.3 Cost components of export (for every unit of major export) specifically to
Bangladesh/Pakistan/both (Rs, or specify unit:__________) (i) ``Production costs ________________________________ (ii) Transportation costs ___________________________
(a) India part _____________________________ (b) Bangladesh/Pakistan part ________________________
(iii) Insurance costs ______________________________ (a) India part _____________________________ (b) Bangladesh/Pakistan part ________________________
(iv) Bank charges _______________________________ (a) India part _____________________________ (b) Bangladesh/Pakistan part ________________________
(v) Export duty (net of duty drawback) _________________________________ (vi) Import tariff ________________________________
(vii) Other charges/costs (specify) ___________________________________
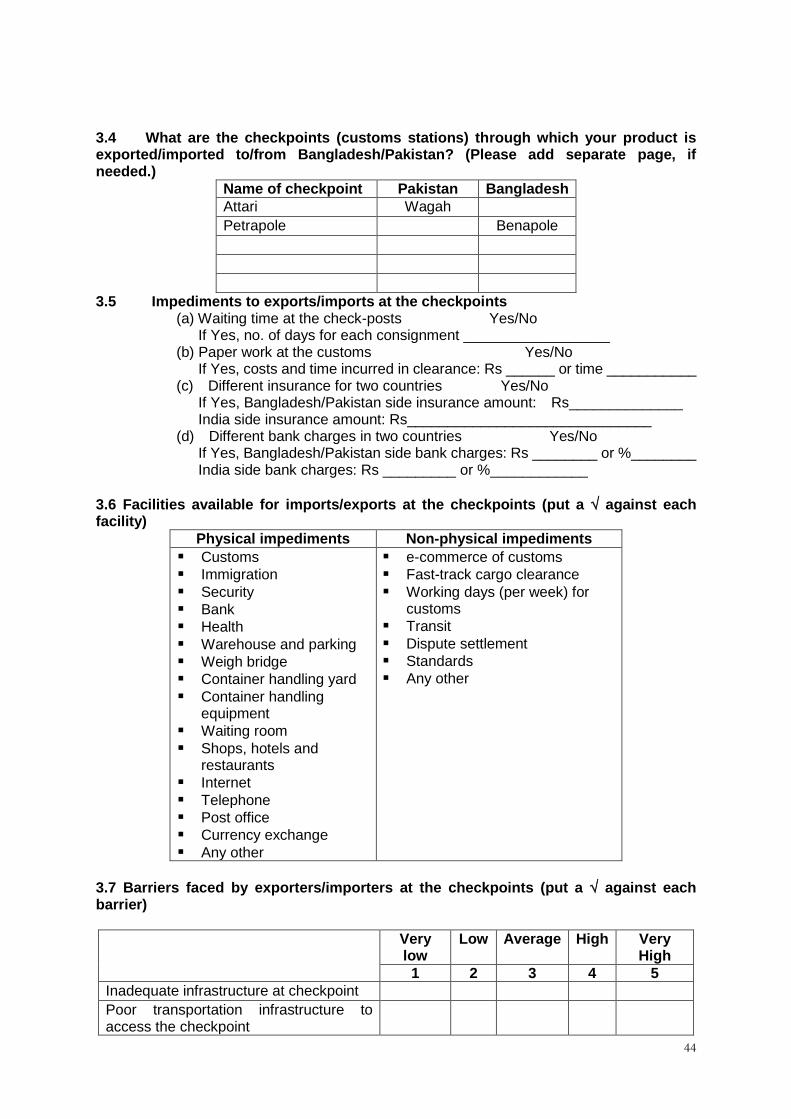
44
3.4 What are the checkpoints (customs stations) through which your product is exported/imported to/from Bangladesh/Pakistan? (Please add separate page, if needed.)
Name of checkpoint Pakistan Bangladesh Attari Wagah Petrapole Benapole
3.5 Impediments to exports/imports at the checkpoints (a) Waiting time at the check-posts Yes/No If Yes, no. of days for each consignment __________________ (b) Paper work at the customs Yes/No If Yes, costs and time incurred in clearance: Rs ______ or time ___________ (c) Different insurance for two countries Yes/No If Yes, Bangladesh/Pakistan side insurance amount: Rs______________ India side insurance amount: Rs______________________________ (d) Different bank charges in two countries Yes/No If Yes, Bangladesh/Pakistan side bank charges: Rs ________ or %________ India side bank charges: Rs _________ or %____________
3.6 Facilities available for imports/exports at the checkpoints (put a against each facility)
Physical impediments Non-physical impediments Customs Immigration Security Bank Health Warehouse and parking Weigh bridge Container handling yard Container handling
equipment Waiting room Shops, hotels and
restaurants Internet Telephone Post office Currency exchange Any other
e-commerce of customs Fast-track cargo clearance Working days (per week) for
customs Transit Dispute settlement Standards Any other
3.7 Barriers faced by exporters/importers at the checkpoints (put a against each barrier)
Very low
Low Average High Very High
1 2 3 4 5 Inadequate infrastructure at checkpoint Poor transportation infrastructure to access the checkpoint
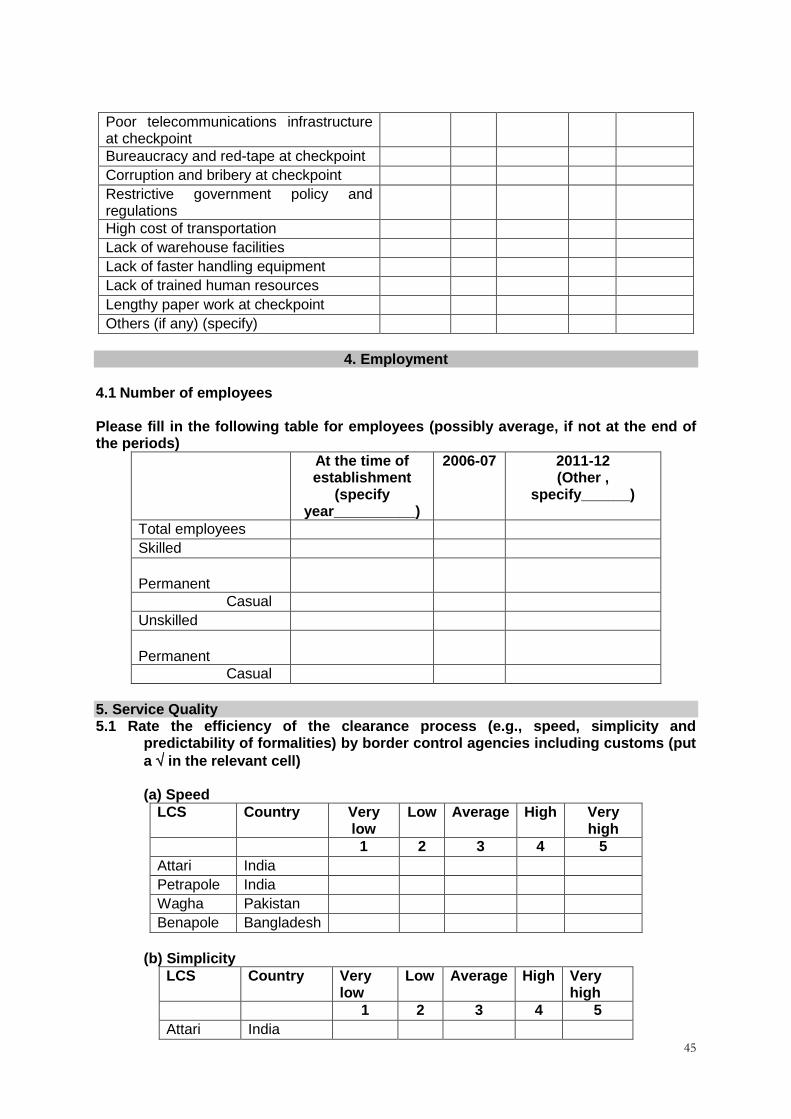
45
Poor telecommunications infrastructure at checkpoint
Bureaucracy and red-tape at checkpoint Corruption and bribery at checkpoint Restrictive government policy and regulations
High cost of transportation Lack of warehouse facilities Lack of faster handling equipment Lack of trained human resources Lengthy paper work at checkpoint Others (if any) (specify)
4. Employment
4.1 Number of employees Please fill in the following table for employees (possibly average, if not at the end of the periods)
At the time of establishment
(specify year__________)
2006-07 2011-12 (Other ,
specify______)
Total employees Skilled Permanent
Casual Unskilled Permanent
Casual 5. Service Quality 5.1 Rate the efficiency of the clearance process (e.g., speed, simplicity and
predictability of formalities) by border control agencies including customs (put
a in the relevant cell) (a) Speed
LCS Country Very low
Low Average High Very high
1 2 3 4 5
Attari India Petrapole India Wagha Pakistan Benapole Bangladesh
(b) Simplicity
LCS Country Very low
Low Average High Very high
1 2 3 4 5
Attari India

46
Petrapole Pakistan Wagha Bangladesh Benapole
(c) Adherence to rules
LCS Country Very low
Low Average High Very high
1 2 3 4 5
Attari India Petrapole Pakistan Wagha Bangladesh Benapole
5.2 Evaluate the quality of services in trade and transport related infrastructure (i.e.
airports, ports, railways, roads, information technologies, etc) (put a in the relevant cell)
(a) Airport
Very low
Low Average High Very high
1 2 3 4 5
India Pakistan Bangladesh
(b) Rail
Very low
Low Average High Very high
1 2 3 4 5
India Pakistan Bangladesh
(c) Road
Very low
Low Average High Very high
1 2 3 4 5
India Pakistan Bangladesh
(d) Ports
Very low
Low Average High Very high
1 2 3 4 5
India Pakistan Bangladesh
(e) Information technology
Very low
Low Average High Very high
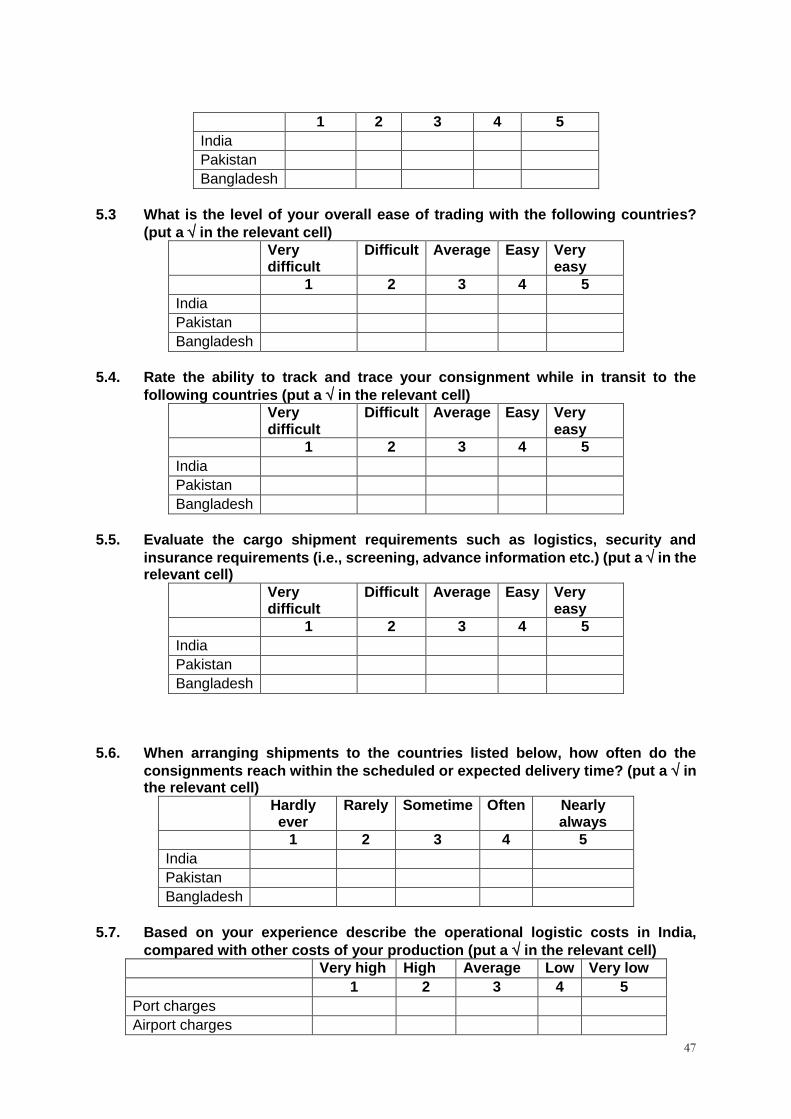
47
1 2 3 4 5
India Pakistan Bangladesh
5.3 What is the level of your overall ease of trading with the following countries?
(put a in the relevant cell)
Very difficult
Difficult Average Easy Very easy
1 2 3 4 5
India Pakistan Bangladesh
5.4. Rate the ability to track and trace your consignment while in transit to the
following countries (put a in the relevant cell)
Very difficult
Difficult Average Easy Very easy
1 2 3 4 5
India Pakistan Bangladesh
5.5. Evaluate the cargo shipment requirements such as logistics, security and
insurance requirements (i.e., screening, advance information etc.) (put a in the relevant cell)
Very difficult
Difficult Average Easy Very easy
1 2 3 4 5
India Pakistan Bangladesh
5.6. When arranging shipments to the countries listed below, how often do the
consignments reach within the scheduled or expected delivery time? (put a in the relevant cell)
Hardly ever
Rarely Sometime Often Nearly always
1 2 3 4 5
India Pakistan Bangladesh
5.7. Based on your experience describe the operational logistic costs in India,
compared with other costs of your production (put a in the relevant cell)
Very high High Average Low Very low
1 2 3 4 5
Port charges Airport charges

48
Road transport rates Rail transport rates Warehouses/translation service charges
Agent fees Other (specify)
5.8 Evaluate the quality of trade and transport-related infrastructure (i.e., ports,
railways, roads, information technologies etc.) in India (put a in the relevant cell)
Very low Low Average
High Very high
1 2 3 4 5
Port Airport Road Rail Warehouses/trans-loading facilities
Telecommunications infrastructure and IT services
5.9 Evaluate the competence and quality of services delivered by the following in
India (put a in the relevant cell)
Very low Low Average
High Very high
1 2 3 4 5
Road transport services provider Rail transport services provider Air transport services provider Maritime transport services provider Warehouses/trans-loading and distribution operators
Freight forwarding Customs agents Quality/standards inspection agencies Health/SPS (Sanitary Phytosanitary) agencies
Trade and transport related associations
Consignees or shippers 5.10 How many documents do you submit to border-related government agencies
involved in the clearance process for export and imports including customs?
Number of documents
Pakistan (Attari) Bangladesh (Petrapole)
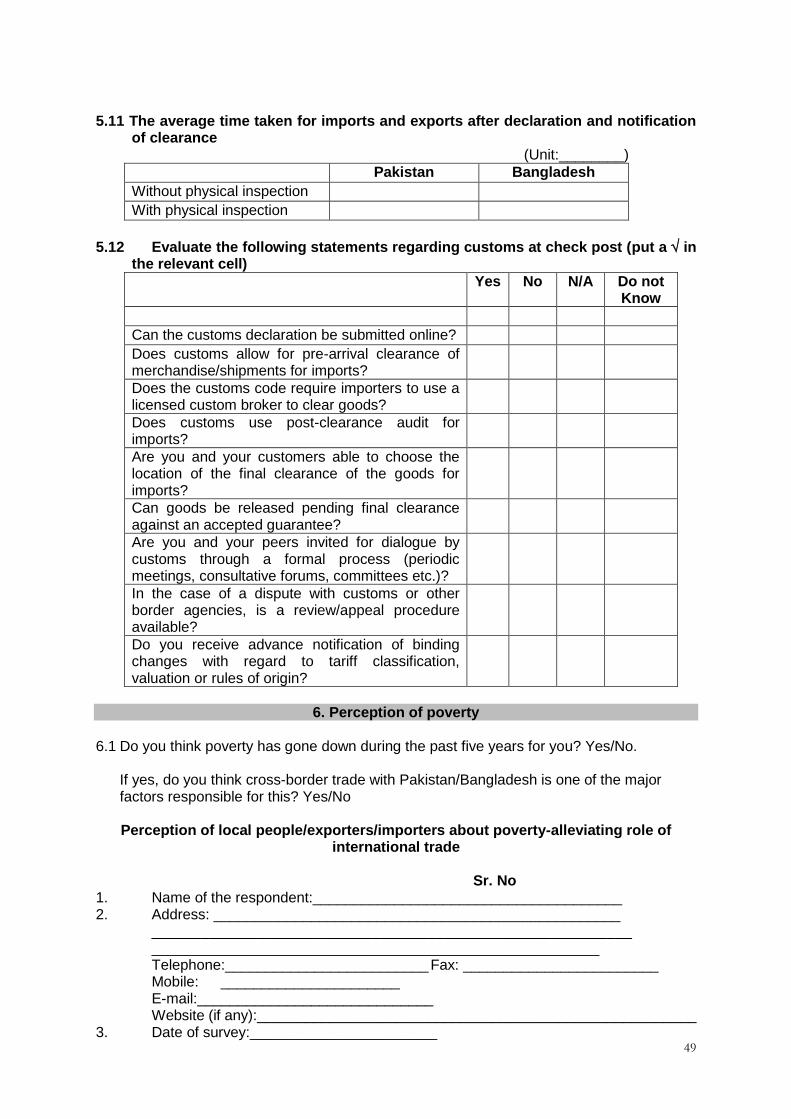
49
5.11 The average time taken for imports and exports after declaration and notification of clearance
(Unit:________)
Pakistan Bangladesh
Without physical inspection With physical inspection
5.12 Evaluate the following statements regarding customs at check post (put a in the relevant cell)
Yes No N/A Do not Know
Can the customs declaration be submitted online? Does customs allow for pre-arrival clearance of merchandise/shipments for imports?
Does the customs code require importers to use a licensed custom broker to clear goods?
Does customs use post-clearance audit for imports?
Are you and your customers able to choose the location of the final clearance of the goods for imports?
Can goods be released pending final clearance against an accepted guarantee?
Are you and your peers invited for dialogue by customs through a formal process (periodic meetings, consultative forums, committees etc.)?
In the case of a dispute with customs or other border agencies, is a review/appeal procedure available?
Do you receive advance notification of binding changes with regard to tariff classification, valuation or rules of origin?
6. Perception of poverty
6.1 Do you think poverty has gone down during the past five years for you? Yes/No.
If yes, do you think cross-border trade with Pakistan/Bangladesh is one of the major factors responsible for this? Yes/No
Perception of local people/exporters/importers about poverty-alleviating role of
international trade
Sr. No 1. Name of the respondent:______________________________________ 2. Address: __________________________________________________
___________________________________________________________ _______________________________________________________ Telephone:_________________________ Fax: ________________________ Mobile: ______________________ E-mail:_____________________________ Website (if any):______________________________________________________
3. Date of survey:_______________________

50
4. Type of ownership:
Codes: 1 = Exporter 2 = Importer 3 = Individual 4 = Other (specify):_____________ 5. How are you related to this trade?
Transporter Foreign exchange dealer Helper in loading/unloading of cargo Local trade agent Repair mechanic Dhaba worker Dhaba employer Hotel operator Any other (please mention)
6. In which year did you join in this service? 7. How much do you earn from this trade activity?
First year (2000-01)
2006-07 2011-12
Daily (in Rs) Weekly (in Rs) Monthly (in Rs)
8. Do you want trade to rise? Yes/No
If Yes, what are the impediments to an increase in trade activity? (a) Lack of infrastructure (on a scale of 1 to 5)
Very bad
Bad Average Good Very good
1 2 3 4 5
Customs Transport infrastructure
Banks Hotels and restaurants
Servicing facilities
Communications facilities
(b) Poor governance (on a scale of 1 to 5)
Very bad
Bad Average Good Very good
1 2 3 4 5
High security Local mafia Lack of transparency in information
Minority/religious tensions
Cheating

51
Strikes and closedown of operation
If no, specify the reasons:
9. Exporters/importers (i) Do you think better trade will reduce poverty locally? Yes or No. If Yes, rank the following on a scale of 1 to 5, where 5 is agree and 1 is disagree. More jobs Higher income Better skills Better knowledge about income opportunities Expansion of local production (ii) Do you think improvement of trade facilitation at borders will reduce poverty locally?
Yes or No. If Yes, rank the following on a scale 1 to 5 where 5 is agree and 1 is disagree. More jobs Higher income Better skills Better knowledge about income opportunities Expansion of local production
(iii) Do you think upgrading skills has created improvements? Yes or No. If Yes, rank the following on a scale of 1 to 5 where 5 is agree and 1 is disagree.
Faster cargo handling
Well informed/quality decision at work
More professionalism at work
Honesty and integrity at work
Better communications
10. Do you think poverty has gone down during the past five years for you? Yes/No.
If Yes, do you think cross-border trade is one of the major responsible factors for this? Yes/No

52
References
Anderson, J. E. and E. van Wincoop (2004). ―Trade costs‖, Journal of Economic Literature,
vol. 42, No. 3; pp. 691-751.
Arvis, J. F., Y. Duval, B. Shepherd and C. Utoktham (2012). ―Trade costs in the developing
world: 1995-2010‖, ARTNeT Working Paper No. 121, ESCAP, Bangkok.
Available online at www.artnetontrade.org.
Bandara, J. S., P. Athukorala and S. Kelegama (eds.) (2011). Trade Liberalisation and
Poverty in South Asia, Routledge, Oxford, United Kingdom.
Barro, R. J. (1990). ―Government spending in a simple model of endogenous growth‖, Journal
of Political Economy, Vol. 98, No. 5, pp. S102- S125.
Barro, R. J. (1991). ―Economic growth in a cross-section of countries‖, Quarterly Journal of
Economics, Vol. 106, pp. 407-443.
Brooks, D. H. and D. Hummels (eds.) (2009). Infrastructure’s Role in Reducing Asia’s Trade
Costs: Building for Trade. Edward Elgar, Cheltenham, United Kingdom and
Massachusetts, United States, and Asian Development Bank Institute, Tokyo.
Brooks, D. H. and S. F. Stone (eds.) (2010). Trade Facilitation and Regional Cooperation in
Asia. Edward Elgar, Cheltenham, United Kingdom, and Asian Development Bank
Institute, Tokyo.
Campano, F. and D. Salvatore. (2007). ―Economic development and income distribution‖,
Journal of Policy Modeling, Vol. 29, pp. 553-566.
CIE (2012) ―Economic benefits of trade facilitation in the Greater Mekong Subregion‖, Centre
for International Economics, Canberra and Sydney.
De, P. S. Raihan, and E. Ghani (2013) ―What does MFN trade mean for India and Pakistan?
can MFN be a Panacea?‖, Policy Research Working Paper Series 6483, World
Bank, Washington, D.C.
De, P. (2009a). ―Empirical estimates of transportation costs: Options for enhancing Asia‘s
trade‖, in D. H. Brooks and D. Hummels (eds.), Infrastructure’s Role in Lowering
Asia’s Trade Costs: Building for Trade. Edward Elgar, Cheltenham, United
Kingdom.
——— (2009b). ―Inclusive growth and trade facilitation: Insights from South Asia‖, ARTNeT
Policy Brief No. 16. ESCAP, Bangkok.
Deardorff, A. V. (2001). ―International provision of trade services, trade, and fragmentation‖,
Review of International Economics, vol. 9, No. 2; pp. 233-248.

53
Diopa, N., P. Brentona and Y. Asarkayab (2005) ―Trade costs, export development and
poverty in Rwanda‖, Working Paper # WPS3784, The World Bank, Washington,
D.C.
Edwards, S. (1997). ―Trade policy, growth, and income distribution‖, American Economic
Review, vol. 87, No. 2; pp. 205-210.
Ferreira Francisco H.G., Phillippe G. Leite and Matthew Wai-Poi (2007) ―Trade liberalization,
employment flows and wage inequality in Brazil‖, Policy Research Working Paper
4108, The World Bank, Washington, D.C.
Edmonds, C., and M. Fujimura. 2008. ―Road Infrastructure and Regional Economic
Integration: Evidence from the Mekong‖, in D. Brooks and J. Menon (eds.)
Infrastructure and Trade in Asia, Cheltenham: Edward Elgar.
Gourdon, J., N. Maystre, and J de Melo. (2008). ―Openness, inequality and poverty:
endowments matter‖, The Journal of International Trade and Economic
Development, Vol. 17, No. 3, pp. 343-378
Harrison, A., J. McLaren, and M. S. McMillan (2010). ―Recent Findings on Trade and
Inequality‖, Working Paper 16425, National Bureau of Economic Research
(NBER), Cambridge
Isik-Dikmelik, Aylin (2006) ―Trade Reforms and Welfare: An Ex-Post Decomposition of
Income in Vietnam‖, Policy Research Working Paper 4049, The World Bank,
Washington, D.C.
Limao, N. and A. J. Venables (2001). ―Infrastructure, geographical disadvantage, transport
costs and trade‖, World Bank Economic Review, vol. 15, pp. 451-479.
Washington, D.C.
Menon, J (2006). ―Does Road Improvement Reduce Poverty? A General Equilibrium Analysis
for Lao PRD‖, IDB Publications 44320, Inter-American Development Bank (IDB),
New York.
Menon J. and P. Warr (2006) ―Does Road Improvement Reduce Poverty? A General
Equilibrium Analysis for Lao PDR‖, Asian Development Bank Institute (ADBI),
Tokyo
Meschi, E. and M. Vivarelli (2009). ―Trade and income inequality in developing countries‖,
World Development, vol. 37, No. 2; pp. 287-302.
Overseas Development Institute (2003) ―Income Distribution Impact of Trade Facilitation in
Developing Countries‖, Background Paper Prepared for the International Forum in
Trade Facilitation, Geneva, 14/15th May, 2003.
Organisation for Economic Co-operation and Development (2003). ―Quantitative assessment
of the benefits of trade facilitation‖, TD/TC/WP(2003)31/FINAL. Paris.

54
Raychaudhuri, A. and P. De. (2010). :Trade, Infrastructure and Income Inequality in Selected
Asian Countries: An Empirical Analysis‖, ARTNeT Working Paper 82, ESCAP,
Bangkok
Raychaudhuri, A. and P. De. (2012). International Trade in Services in India: Implications for
Growth and Inequality in a Globalizing World, Oxford University Press, New Delhi.
Raychaudhuri, A and P. De (2013) ―Economic Corridors, Trade Costs, and Regional
Production Networks in South Asia‖, in Prabir De and Kavita Iyengar (eds.)
Developing Economic Corridors in South Asia, Asian Development Bank (ADB),
Manila.
Sahai, P. S., and V. Laxmi (2013) ―Transit and trade facilitation across South Asian corridors:
India-Pakistan land connectivity‖, in P. De and K. Iyengar (eds.), Developing
Economic Corridors in South Asia. Asian Development Bank, Manila.
Singh, Tarlok (2010) ―Does International Trade Cause Economic Growth? A Survey‖, The
World Economy, Vol. 33, Issue 11, pp. 1517–1564
Slaughter, M. J. (1997) ―Per capita income convergence and the role of international trade‖,
American Economic Review, Vol. 87, No. 2, pp. 194-199.
Stone, S., A. Strutt, and T. Hertel,(2010) "Assessing Socioeconomic Impacts of Transport
Infrastructure Projects in the Greater Mekong Subregion," ADBI Working
Papers 234, Asian Development Bank Institute (ADBI), Tokyo
Srivastava, P. and U. Kumar (eds.) (2012). Trade and Trade Facilitation in the Greater
Mekong Subregion. Asian Development Bank, Manila. United Nations (2003)
Income Distribution Impact of Trade Facilitation in Developing Countries,
Background Paper for the 2nd International Forum on Trade Facilitation,
organized by the Committee for Trade, Industry and Enterprise Development
(CTIED) and the United Nations Centre for Trade Facilitation and Electronic
Business (UN/CEFACT) on 14 and 15 May 2003 in Geneva, Economic
Commission of Europe, Geneva
Warr, P (2007) ―How do infrastructure projects benefit the poor?‖, in Clem Tisdell
(ed.), Poverty, Poverty Alleviation and Social Disadvantage: Analysis, Case
Studies and Policies, Serials Publications, New Delhi, India, pp. 88-103.
Warr, Peter, J. Menon, and A. A. Yusuf (2009). ―Regional Economic Impacts of Cross-Border
Infrastructure: A General Equilibrium Application to Thailand and Lao PDR‖,
Working Papers on Regional Economic Integration 35, Asian Development Bank,
Manila.
55
Wiemer, C. (2009). ―Economic Corridors for the Greater Mekong Subregion‖, EAI
Background Brief No. 479, East Asian Institute, National University Singapore,
Singapore.
Winters, A. L., N. McCulloch and A. McKay (2004). ―Trade Liberalization and poverty: The
evidence so far‖, Journal of Economic Literature, vol. 42, No. 1; pp. 72-115.
Winters, Alan, L (2000a) ―Trade Liberalisation and Poverty‖, PRUS Working Paper 7, Poverty
Research Unit at Sussex, University of Sussex, Sussex
Winters, Alan, L. (2000b) ―Trade, Trade Policy and Poverty: What are the Links?‖, CEPR
Discussion Paper No. 2382, London.
Winters, A. L. (2002). ―Trade liberalisation and poverty: What are the links?‖ World Economy,
vol. 25, No. 9; pp. 1339-1367.

56
ARTNeT Working Paper Series
is available at www.artnetontrade.org
ARTNeT Secretariat
United Nations
Economic and Social Commission
for Asia and the Pacific
Trade and Investment Division
United Nations Building
Rajadamnern Nok Avenue
Bangkok 10200, Thailand
Tel: +66 (0)2-288-2251
Fax: +66(0)2-288-1027
Email: [email protected]
Website: www.artnetontrade.org