pra tools. informing outsiders merely let people know about projects to be undertaken consulting...
TRANSCRIPT

PRA TOOLS


Informing Outsiders merely let people know about projects to be undertaken
Consulting Villagers are given the opportunity to express their concerns and suggestions
Partnership Exchange and sharing of benefits as well as responsibilities to achieve a common goal. Outsiders and villagers are partners.
Self-Management
People take initiative and collective action for their own development
Source: DSE, 2001
Four Levels of Participation

Village Map
A drawing that identifies community boundaries and major bio-physical land use patterns, landmarks and infrastructure within the community.

Social Map
A drawing indicating the spatial distribution of households in the community. Marks on specific houses are used to indicate social status and well-being of different community members.

Village Transect
A diagram which provides a cross-sectional views of the distribution and boundaries of major resource units. For each resource unit, the crops grown, animals, soil characteristics, topography and other information are indicated.

Time Line
A chronological description of important events which occurred in the community’s past and how such has influenced its development.

Trend Analysis
A visual documentation of the past, present and future directions or patterns of changes in the community’s life. It examines the implications and causes of such changes.

Seasonal Calendar
An illustration of schedules of various household activities, events, farming variables or climatic conditions over a particular time frame, usually one year.
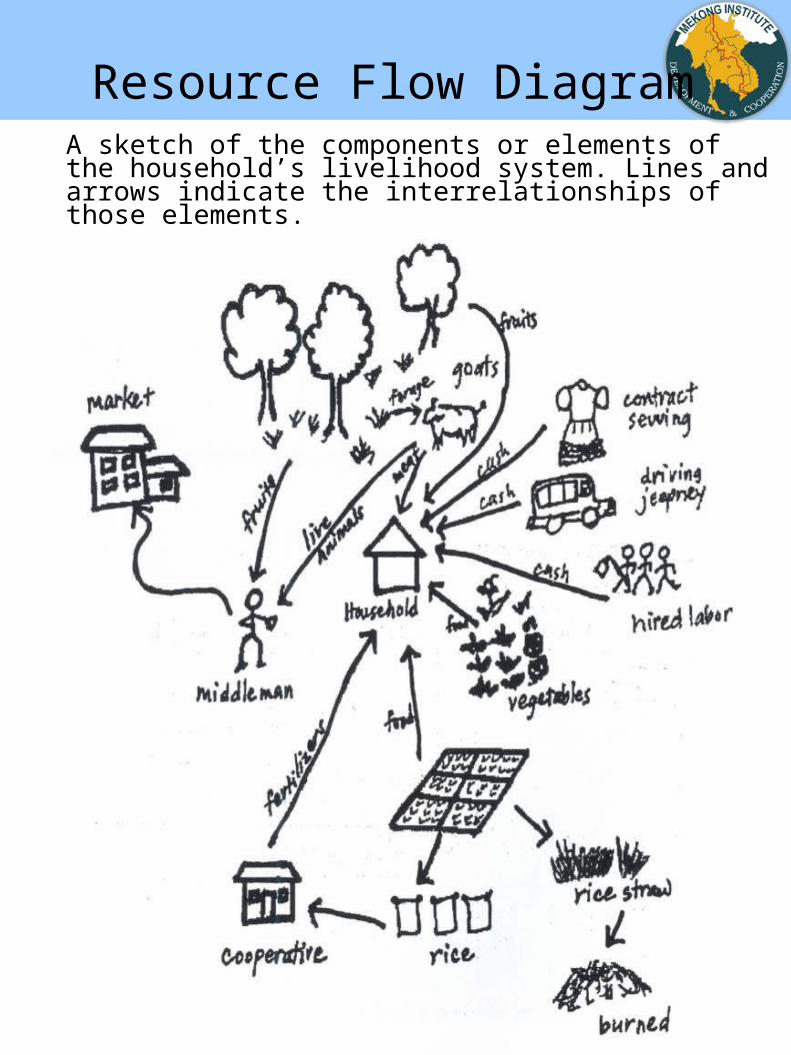
Resource Flow DiagramA sketch of the components or elements of the household’s livelihood system. Lines and arrows indicate the interrelationships of those elements.
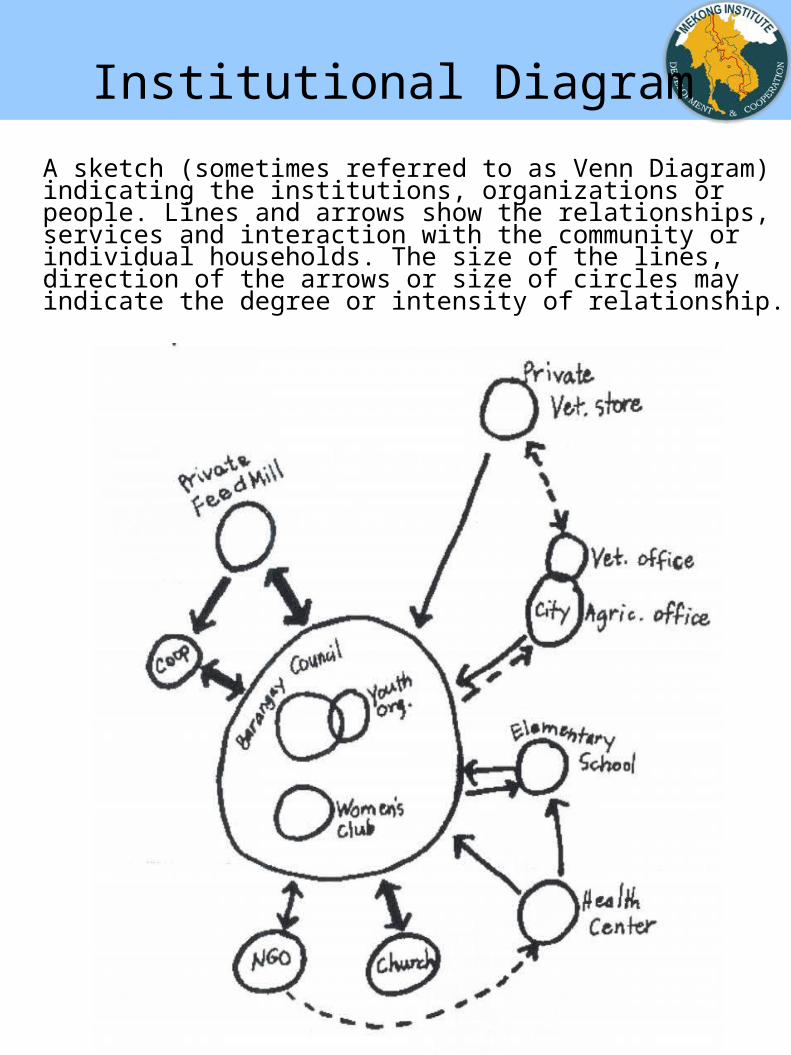
Institutional Diagram
A sketch (sometimes referred to as Venn Diagram) indicating the institutions, organizations or people. Lines and arrows show the relationships, services and interaction with the community or individual households. The size of the lines, direction of the arrows or size of circles may indicate the degree or intensity of relationship.

Problem Ranking
A matrix that identifies, compares and prioritizes main problems of villagers. It serves as basis for focusing recommendations, alternative options or possible solutions.

Problem Cause Diagram
A diagram which traces and diagnoses the root causes of certain problems in the community or household.

Possible Solution Ranking
A matrix that identifies, compares and prioritizes the best possible solutions to overcome identified priority problems.