pr3+ doping at the a-site of la0.67ba0.33mno3
TRANSCRIPT

RSC Advances
PAPER
Ope
n A
cces
s A
rtic
le. P
ublis
hed
on 1
5 A
ugus
t 201
9. D
ownl
oade
d on
12/
31/2
021
9:32
:51
AM
. T
his
artic
le is
lice
nsed
und
er a
Cre
ativ
e C
omm
ons
Attr
ibut
ion
3.0
Unp
orte
d L
icen
ce.
View Article OnlineView Journal | View Issue
Pr3+ doping at th
aLaboratory of Physical Chemistry of Mat
University of Monastir, 5019 Monastir, TunbUEMA/CCT, Universidade Federal de Campi
BrazilcInstitut Neel, CNRS, Universite J. Fourier, B
Cite this: RSC Adv., 2019, 9, 25627
Received 9th May 2019Accepted 5th August 2019
DOI: 10.1039/c9ra03494c
rsc.li/rsc-advances
This journal is © The Royal Society of C
e A-site of La0.67Ba0.33MnO3
nanocrystalline material: assessment of therelationship between structural and physicalproperties and Bean–Rodbell model simulation ofdisorder effects
Ma. Oumezzine, *a Herbet Bezerra Sales,b Ahmed Selmia and E. K. Hlilc
Bulk nanocrystalline samples of (La1�xPrx)0.67Ba0.33MnO3 (0.075# x # 0.30) manganites with a fixed carrier
concentration are prepared by the sol–gel based Pechini method. Rietveld refinement of the X-ray
diffraction patterns, shows the formation of single-phase compositions with rhombohedral symmetry.
Upon Pr3+ doping at the A-site, the unit cell volume and the B–O–B bond angles are reduced. FTIR
spectra present a prominent absorption peak of the in-phase stretching mode (B2g mode) rising from the
vibration of the Mn–O bond. Raman spectra at room temperature reveal a gradual shift toward lower
frequencies in (Eg) phonon mode with increasing Pr3+ concentration. The M(T) measurements shows
a clear ferromagnetic (FM)–paramagnetic (PM) phase transition with increasing temperature. An increase
in resistivity and activation energy and a decrease in the metal–semiconductor transition (TM–SC) and
Curie temperatures (TC) was observed as a consequence of Pr3+ doping. The results are discussed
according to the change of A-site-disorder effect caused by the systematic variations of the A-site
average ionic radius hrAi and A-site-cation mismatch s2, resulting in the narrowing of the bandwidth and
the decrease of the mobility of eg electrons. The magneto-transport behavior in the whole measured
temperature and a magnetic field can be described by a percolation model, which is in agreement with
the limited experimental data of the samples for x ¼ 0.075, 0.15 and 0.30. The experimental results
confirm that A-site substitution with Pr3+ destroys the Mn3+–O2�–Mn4+ bridges and weakens the double
exchange (DE) interaction between the Mn3+ (t32ge1g, S ¼ 2) and Mn4+ (t32ge
0g, S ¼ 3/2) ions. On the other
hand, the Bean and Rodbell model has been successfully used to simulate the magnetization data of the
samples with x ¼ 0.15 and x ¼ 0.22. The random replacement of La3+ by Pr3+ is shown to induce more
disorder in the system, which is reflected in the increase of the fitted disorder parameter and spin value
fluctuation. At a temperature close to room temperature, the maximum magnetic entropy change
(DSMax) and the relative cooling power (RCP) of La0.52Pr0.15Ba0.33MnO2.98 are found to be, respectively,
1.34 J kg�1 K�1 and 71 J kg�1 for a 1.5 T field change.
1 Introduction
The doped perovskite manganites with the general formulaR1�xAxMnO3 (where R and A are trivalent rare earth and divalentalkaline earth ions, respectively) stimulate great scienticresearch because of their rich physical properties. In particular,these materials exhibit a remarkably rich variety of structural,magnetic, and transport properties because of couplings betweenspin and orbital moments.1–4 Doped lanthanum based
erials, Faculty of Sciences of Monastir,
isia. E-mail: [email protected]
na Grande – UFCG, Campina Grande, PB,
.P. 166, 38042 Grenoble, France
hemistry 2019
manganites have been used in an enormous number of techno-logical applications, including magnetic recording, high-densitydata storage, hard disks, magnetic sensors, spin-electronicdevices, and magnetic refrigerants.5–7 These materials are ofparticular interest because of their chemical stability, thetunability of their Curie temperatures (TC) through doping, andtheir low synthesis cost. Barium-substituted lanthanum manga-nite (La1�x BaxMnO3) is among the existing colossal magnetore-sistance (CMR) manganites displaying ferromagnetic behavior ina wide concentration range x with a maximum TC well aboveroom temperature for x ¼ 0.33.8 Hence, the structure of La1�x
BaxMnO3 can be derived from the cubic perovskite by tilting alloxygen octahedra about the [111] pseudo-cubic axes (a–a–a– tiltsystem). This system can be strongly modied by replacinga fraction x of the La3+ ions by the larger Ba2+ ions, resulting in
RSC Adv., 2019, 9, 25627–25637 | 25627

RSC Advances Paper
Ope
n A
cces
s A
rtic
le. P
ublis
hed
on 1
5 A
ugus
t 201
9. D
ownl
oade
d on
12/
31/2
021
9:32
:51
AM
. T
his
artic
le is
lice
nsed
und
er a
Cre
ativ
e C
omm
ons
Attr
ibut
ion
3.0
Unp
orte
d L
icen
ce.
View Article Online
a reduction of the Mn–O bond length (dMn–O) and an increase ofthe Mn–O–Mn bond angle (qMn–O–Mn) towards 180�. Due tocharge neutrality, replacing La by Ba causes the conversion ofMn3+ (t32ge
1g, S ¼ 2) into Mn4+ (t32ge
0g, S ¼ 3/2), which in turn
introduces mobile eg electrons in the manganite oxides. Themobile electrons are closely related to the ferromagnetic (FM)interactions betweenMn3+ andMn4+ (i.e., the formation ofMn3+–O2�–Mn4+ networks) according to the double exchange (DE)interaction model,9–11 which is one of the mechanisms used toexplain the magnetic and transport properties of thesecompounds. The signicant changes in structure, magnetic andmagnetoresistive (MR) properties of manganites can be achievedby varying particle size,12–14 oxygen stoichiometry15 andsubstituting cations at the A- or the B-sites.4,16,17
There are various methods to synthesize the manganitescompounds involving solid state reaction, hydrothermalsynthesis and Pechini sol–gel method. Pechini method has beenused successfully to produce high-quality specimens due to thesepotential advantages such as better homogeneities, lower pro-cessing temperatures, short annealing times, high purity ofmaterials and improved material properties.18 La0.67Ba0.33MnO3
(LBMO) has been one of the most appealing manganites, and inits bulk form, it has been found to exhibit byMn-site substitution(B-site) in perovskite oxides, with other transitionmetal ions,8,17,18
a second order of magnetic phase transition. Besides, paststudies on substituting praseodymium at the A-site of manganiteare focused on polycrystalline ceramics.19,20
The objective of this work was to synthesize nanocrystallinesamples of (La1�xPrx)0.67Ba0.33MnO3 with an extended dopinglevels up to x ¼ 0.30 and study the inuence of praseodymiumsubstitution at A-site on the crystal structural, magnetic,magneto-transport properties and magnetocaloric effect. Also,we aim to emphasize the interplay between experimental resultsand theoretical aspects of magnetization using Bean–Rodbellmodel and electrical resistivity adopting the percolation model.
2 Experimental details2.1. Synthesis of samples
Nanocrystalline samples of (La1�xPrx)0.67Ba0.33MnO3 (0.075 # x #
0.30) were synthesized using the Pechini sol–gel technique usinghighly pure metal nitrates as starting materials (>99.99% purity):La(NO3)3$6H2O, Pr(NO3)3$6H2O, Ba(NO3)2 and Mn(NO3)2$4H2O.The initial solution was prepared bymixing distilled water, nitrates(properly weighed according to the specic composition), citricacid (CA) (99.5% purity) and ethylene glycol (EG) (99.5% purity) inthe following molar proportion 1 : 5 : 4 : 3. The resulting solutionwas heated by constant stirring at temperatures of 80 �C. Aer theevaporation of water at 80–100 �C, the viscosity of the solutionincreased and further heating led to the formation of polymericresin. The resin was pre-calcined (673 K for 3 h) to eliminate theorganic material, ground and calcined again (1073 K for 4 h) toeliminate the residual organic material. The obtained blackpowder was cold-pressed into pellets with a diameter of 13 mmand thickness of about 2–3mmunder a pressure of 5 tons per cm2.Subsequently, the powder was sintered at 1323 K for 12 hours inair.
25628 | RSC Adv., 2019, 9, 25627–25637
2.2. Characterizations
2.2.1. X-ray diffraction (XRD). The samples were charac-terized using X-ray diffraction (XRD) to conrm the crystallinity,purity and single-phase formation of the samples of presentinvestigation. The XRD patterns were further analyzed byemploying Rietveld renement technique (using Fullprofprogram), to estimate the lattice parameters, space groups, typeof crystal system, Bragg reections and other related statistics ofthe samples. Structural characterization using a ‘‘Panalytical Xpert Pro’’ diffractometer with Cu Ka radiation (k ¼ 1.5406 A).Data for Rietveld renement were collected in the range of 2qfrom 10� to 120� with a step size of 0.017� and a counting time of18 s per step.
2.2.2. Iodometric titration. The Iodometric titrationmethod was performed to estimate the Mn4+/Mn3+ ratio andoxygen stoichiometry of samples. Powders were weighed (about100 mg) and dissolved in a mixture of 10 ml of 10 mass%potassium iodide aqueous solution and 2.5 ml of 2 M hydro-chloric acid. Liberated iodine was titrated against standardsodium thiosulfate (0.04 N) solution using starch as anindicator.
2.2.3. Surface morphology (FE-SEM). The morphologicalproperties of the samples were investigated by scanning elec-tron microscopy (SEM) on a JSM-6400 apparatus working at 20kV.
2.2.4. DC electrical resistivity. Electrical resistivitymeasurements were carried out by standard four-probe methodin the temperature range 5–300 K up to 5.0 T. The measure-ments were performed using the DC resistivity option ina Quantum Design physical property measurement system(PPMS).
2.2.5. Magnetic measurement. The magnetization wasmeasured in a eld-cooled (FC) mode between 5 K and 400 K,under a magnetic eld of 500 Oe, using a Quantum DesignSQUID susceptometer, model MPMS-XL5. The isothermals Mversus H at various temperatures around TC have beenmeasuredin applied elds up to 5 T. These isothermals are corrected bya demagnetization factor D that has been determined bya standard procedure from low-eld dc magnetizationmeasurement at low temperatures (H ¼ Happ � DM). Theisothermal magnetization was performed aer the sample washeated well above TC for a long enough time, then cooled underzero eld to the objective temperature.
3 Results3.1. Structure and morphology studies
The XRD patterns at room temperature for the (La1�xPrx)0.67-Ba0.33MnO3 (x ¼ 0.075, x ¼ 0.15 and x ¼ 0.22) samples areshown in Fig. 1(a). It is evidence that all samples show typicalreections of the perovskite structure with rhombohedralsymmetry and R�3c (Z ¼ 2) as a space group, no. 167. Hence,sharp peaks are clearly seen in all XRD patterns, indicating thestudied samples to be highly crystalline. No traces of secondaryphases were detectable, within the sensitivity limits of theexperiment. The diffraction data were rened using the FullProf
This journal is © The Royal Society of Chemistry 2019

Fig. 1 (a) XRD patterns of (La1�xPrx)0.67Ba0.33MnO3 (x ¼ 0.075, 0.15 and x ¼ 0.22) compounds at room temperature. (b) Rietveld refinementprofile of La0.57Pr0.10Ba0.33MnO3 performed using FULLPROF. Open circles correspond to experimental data and the lines are fits. Vertical barsrepresent the Bragg reflections for the space group R3�c. The difference pattern between the observed data and fits is shown at the bottom. Theright inset shows the FE-SEM image of x ¼ 0.15 sample. (c) Crystal structure of La0.57Pr0.10Ba0.33MnO3 at room temperature in space group R3�c.
Paper RSC Advances
Ope
n A
cces
s A
rtic
le. P
ublis
hed
on 1
5 A
ugus
t 201
9. D
ownl
oade
d on
12/
31/2
021
9:32
:51
AM
. T
his
artic
le is
lice
nsed
und
er a
Cre
ativ
e C
omm
ons
Attr
ibut
ion
3.0
Unp
orte
d L
icen
ce.
View Article Online
program by employing Rietveld powder diffraction technique.21
Background Rietveld renements were tted with a polynomialfunction; a pseudo-Voigt function was employed to model thepeak shape. As a representative of the series, the renementdata of x ¼ 0.15 composition is depicted in Fig. 1(b). Thecalculated results are shown in Table 1. Very good agreementbetween the calculated and the observed data is obtained. Itmay be seen that for all samples the residual factor is Rp # 3.02,the weight residual factor is Rwp # 3.71 and the goodness-of-tfactor is c2 # 2.85. These parameters conrm that the rene-ments are acceptable and the samples compositions are thesame as their nominal compositions, including that the oxygencontent was close to 3 for all the samples.22 The three equivalentpositions (6a (0, 0, 1/4), 6b (0, 0, 0), and 18e (x, 0, 1/4)) in therhombohedral unit cell are occupied by 6a (La3+, Pr3+, Ba2+), 6b(Mn3+, Mn4+), and 18e O2� respectively. Fig. 1(c) shows crystal
This journal is © The Royal Society of Chemistry 2019
structure of La0.57Pr0.10Ba0.33MnO3 showing MnO6 octahedralgenerated with the help of program Diamond using rened cellparameters, space group and positional parameters of atoms.Detailed crystallographic parameters are listed in Table 1,where a and c are the hexagonal cell parameters, V is the unitcell volume, Biso is the isotropic thermal parameter, q(Mn–O–Mn)
is the bond angle, dMn�O is the bond length and x is the oxygenposition. It is clearly noticeable that the average A-site radiusand the cell parameters of the rhombohedral compounds arefound to decrease with increase Pr doping concentration on theA-site as shown in Table 1. The average A-site ionic radius hasbeen calculated using nine coordinated ionic radii given byShannon.23 The observed behavior might be attributed to thefact that the substitution of a smaller Pr3+ ion (1.179 A) at siteLa3+ ion (1.216 A) compresses the unit cell in all the threedirections, thus decreasing its volume. These lattice effects are
RSC Adv., 2019, 9, 25627–25637 | 25629

Table 1 Detailed results of Rietveld refinement of (La1�xPrx)0.67Ba0.33MnO3 (0 # x # 0.30) samples at room temperature
Sample 0 (ref. 18) 0.075 0.15 0.22 0.30Structure type Rhombohedral Rhombohedral Rhombohedral Rhombohedral RhombohedralSpace group R�3c R�3c R�3c R�3c R�3cLattice parametera (A) 5.5304 (3) 5.5365 (3) 5.5371 (1) 5.5377 (1) 5.5385 (1)c (A) 13.5553 (3) 13.5034 (9) 13.4998 (5) 13.4965 (3) 13.4931 (3)V (A3) 359.06 (3) 358.47 (4) 358.45 (2) 358.44 (1) 358.42 (2)dMn–O (A) 1.9531 (1) 1.9594 (6) 1.9647 (7) 1.9658 (4) 1.9711 (1)q(Mn–O–Mn)(�) 176.50 (4) 172.06 (3) 168.42 (3) 167.77 (2) 164.11 (4)W 0.0960 0.0950 0.0935 0.0933 0.0921tg 0.985 0.982 0.979 0.976 0.972hrAi (A) 1.396 1.387 1.378 1.370 1.356
La/Bax 0.000 0.000 0.000 0.000 0.000y 0.000 0.000 0.000 0.000 0.000z 0.25 0.25 0.25 0.25 0.25Biso (A
2) 0.84 (0) 0.36 (1) 1.08 (2) 0.60 (1) 0.68 (2)
Prx — 0.000 0.000 0.000 0.000y — 0.000 0.000 0.000 0.000z — 0.000 0.000 0.000 0.000Biso (A
2) — 0.168 (1) 0.889 (2) 0.410 (1) 0.517 (3)
Mnx 0.000 0.000 0.000 0.000 0.000y 0.000 0.000 0.000 0.000 0.000z 0.000 0.000 0.000 0.000 0.000Biso (A
2) 0.99 (3) 0.10 (2) 0.86 (3) 0.21 (2) 0.66 (3)
Ox 0.480 (6) 0.524 (2) 0.535 (1) 0.462 (7) 0.495 (6)y 0.000 0.000 0.000 0.000 0.000z 0.25 0.25 0.25 0.25 0.25Biso (A
2) 2.60 (1) 1.76 (1) 1.39 (9) 0.50 (1) 0.63 (2)DW–H (nm) — 75 95 80 93Strain 3 (%) — 2.01 � 10�3 2.07 � 10�3 2.26 � 10�3 2.41 � 10�3
s2 (10�2 A2) 0.267 0.547 0.726 0.878 1.058Mn4+/Mn3+ 0.468 0.463 0.472 0.466 —Oxygen content 3.08 3.05 3.02 2.98 —
Discrepancy factors (%)Rwp (%) 8.71 3.53 3.71 4.03 3.91Rp (%) 5.87 2.65 2.79 3.02 2.89RF (%) 4.85 0.60 1.41 1.20 1.07c2 (%) 3.59 2.02 1.91 2.85 2.72
RSC Advances Paper
Ope
n A
cces
s A
rtic
le. P
ublis
hed
on 1
5 A
ugus
t 201
9. D
ownl
oade
d on
12/
31/2
021
9:32
:51
AM
. T
his
artic
le is
lice
nsed
und
er a
Cre
ativ
e C
omm
ons
Attr
ibut
ion
3.0
Unp
orte
d L
icen
ce.
View Article Online
similar to those observed in previous studies on the same A-sitesubstitution with praseodymium.19,24 It should also be pointedout that a strong correlation exists between hrAi and the Gold-schmidt's tolerance factor tg dened as:
tg ¼ hrAi þ hrOiffiffiffi2
p ðhrBi þ hrOiÞ(1)
where hrAi, hrBi and hrOi are respectively the average ionic radiiof A and B perovskite sites and of the oxygen anions. When hrAidecreases, tg also decreases and gives a lower symmetryarrangement by the tilting of the MnO6 octahedra. It is well-known that an orthorhombic structure is realized for tg < 0.96,rhombohedral for 0.96 < tg < 1, and cubic as tg moves close to 1.
25630 | RSC Adv., 2019, 9, 25627–25637
In present study, it is found that tg decreases from 0.9985 tonearly 0.9591 with increasing x, consistent with the experi-mental observation that the crystal structure of studiedcompounds is rhomobohedral. The decrease of q(Mn–O–Mn) bondangles (Table 1) increases the distortion of MnO6 octahedra thatdiminishes the strength of magnetic exchange interactionbetween the Mn3+ and Mn4+ ions. This could disfavor the long-range ferromagnetic order that results in shi of Curietemperature (TC) to lower temperature, which is comprehen-sively discussed in the next section. As a representation, theeld emission scanning electron microscopy (FE-SEM)morphology for x ¼ 0.22 is displayed in the inset of Fig. 1(b).The average grain size (GS)25,26 estimated is approximately
This journal is © The Royal Society of Chemistry 2019
Paper RSC Advances
Ope
n A
cces
s A
rtic
le. P
ublis
hed
on 1
5 A
ugus
t 201
9. D
ownl
oade
d on
12/
31/2
021
9:32
:51
AM
. T
his
artic
le is
lice
nsed
und
er a
Cre
ativ
e C
omm
ons
Attr
ibut
ion
3.0
Unp
orte
d L
icen
ce.
View Article Online
100 nm (�10 nm). From the iodometric titration method, theaverage ratio of Mn3+/Mn4+ is found to be xed with an accuracyof �0.03, while the oxygen content is close to stoichiometry (seeTable 1).
X-ray line prole analysis is a powerful and simple tool toidentify the presence of dopant ion in the host lattice andquantify the microstructural parameters like size and latticestrain. Williamson–Hall (W–H) had proposed that the crystallitesize and strain contributions to line broadening are indepen-dent to each other and it can be deduce in the followingmathematical expression:27
bhkl cos q ¼ kl
DW�H
þ 43 sin q (2)
where bhkl is the integral breadth (in radians). The b parameterwas corrected for instrumental broadening. l is the wavelengthof the X-rays (Cu Ka radiation, l ¼ 1.5406 A), q is Braggdiffraction angle, 3 is the lattice strain and k is the shape factor(k ¼ 0.9). A plot is drawn by taking 4 sin q along X-axis andbhkl cos q along Y-axis (not shown). The strain present in thematerial and the crystallite size are, respectively, extracted fromthe slope and the intercept of the linear t made to the plot. Theestimated values of the strain (3) and the crystallite size (DW–H)are given in Table 1. It is clear from the table that the averagecrystallite size values are found to be in the range of 75–93 nm.
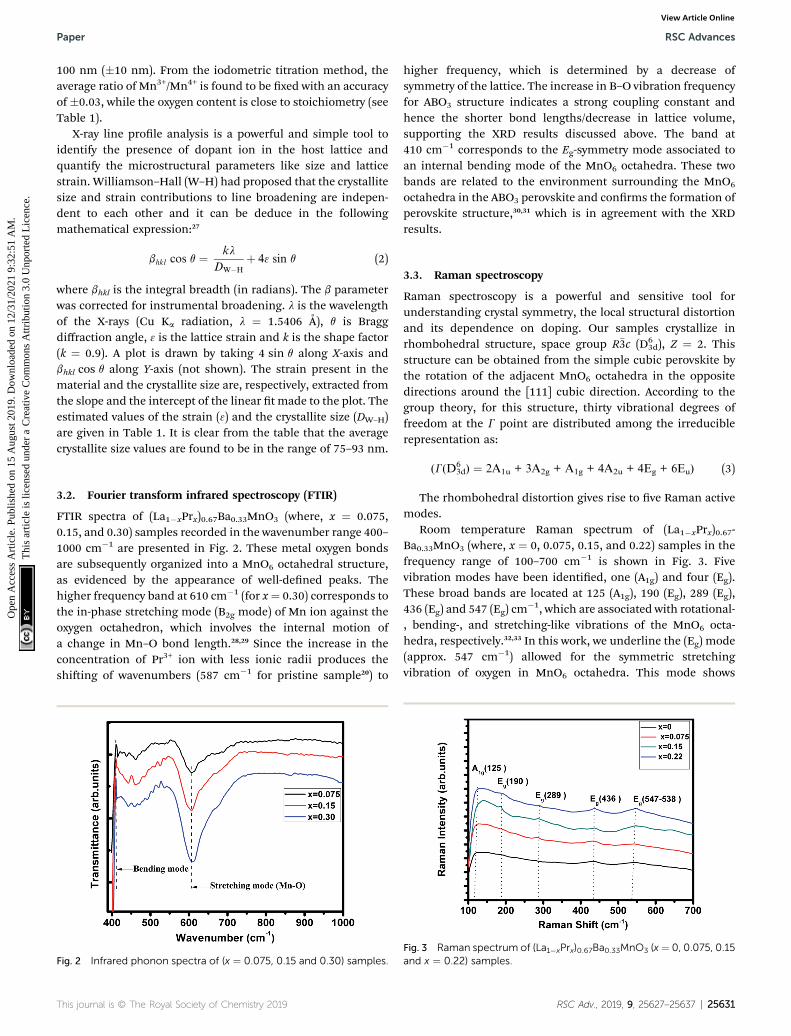
3.2. Fourier transform infrared spectroscopy (FTIR)
FTIR spectra of (La1�xPrx)0.67Ba0.33MnO3 (where, x ¼ 0.075,0.15, and 0.30) samples recorded in the wavenumber range 400–1000 cm�1 are presented in Fig. 2. These metal oxygen bondsare subsequently organized into a MnO6 octahedral structure,as evidenced by the appearance of well-dened peaks. Thehigher frequency band at 610 cm�1 (for x¼ 0.30) corresponds tothe in-phase stretching mode (B2g mode) of Mn ion against theoxygen octahedron, which involves the internal motion ofa change in Mn–O bond length.28,29 Since the increase in theconcentration of Pr3+ ion with less ionic radii produces theshiing of wavenumbers (587 cm�1 for pristine sample20) to
Fig. 2 Infrared phonon spectra of (x ¼ 0.075, 0.15 and 0.30) samples.
This journal is © The Royal Society of Chemistry 2019
higher frequency, which is determined by a decrease ofsymmetry of the lattice. The increase in B–O vibration frequencyfor ABO3 structure indicates a strong coupling constant andhence the shorter bond lengths/decrease in lattice volume,supporting the XRD results discussed above. The band at410 cm�1 corresponds to the Eg-symmetry mode associated toan internal bending mode of the MnO6 octahedra. These twobands are related to the environment surrounding the MnO6
octahedra in the ABO3 perovskite and conrms the formation ofperovskite structure,30,31 which is in agreement with the XRDresults.
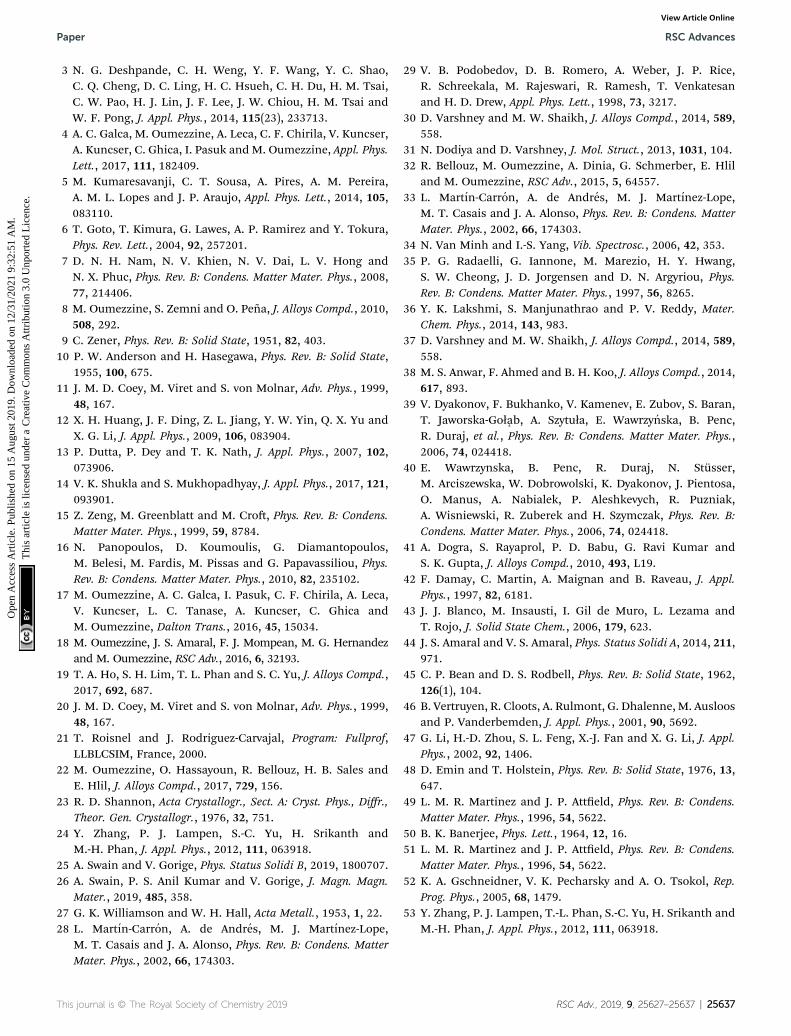
3.3. Raman spectroscopy
Raman spectroscopy is a powerful and sensitive tool forunderstanding crystal symmetry, the local structural distortionand its dependence on doping. Our samples crystallize inrhombohedral structure, space group R�3c (D6
3d), Z ¼ 2. Thisstructure can be obtained from the simple cubic perovskite bythe rotation of the adjacent MnO6 octahedra in the oppositedirections around the [111] cubic direction. According to thegroup theory, for this structure, thirty vibrational degrees offreedom at the G point are distributed among the irreduciblerepresentation as:
(G(D63d) ¼ 2A1u + 3A2g + A1g + 4A2u + 4Eg + 6Eu) (3)
The rhombohedral distortion gives rise to ve Raman activemodes.
Room temperature Raman spectrum of (La1�xPrx)0.67-Ba0.33MnO3 (where, x ¼ 0, 0.075, 0.15, and 0.22) samples in thefrequency range of 100–700 cm�1 is shown in Fig. 3. Fivevibration modes have been identied, one (A1g) and four (Eg).These broad bands are located at 125 (A1g), 190 (Eg), 289 (Eg),436 (Eg) and 547 (Eg) cm
�1, which are associated with rotational-, bending-, and stretching-like vibrations of the MnO6 octa-hedra, respectively.32,33 In this work, we underline the (Eg) mode(approx. 547 cm�1) allowed for the symmetric stretchingvibration of oxygen in MnO6 octahedra. This mode shows
Fig. 3 Raman spectrum of (La1�xPrx)0.67Ba0.33MnO3 (x ¼ 0, 0.075, 0.15and x ¼ 0.22) samples.
RSC Adv., 2019, 9, 25627–25637 | 25631

Fig. 4 Temperature dependence of the magnetization for (La1�x-Prx)0.67Ba0.33MnO3 (x¼ 0, 0.075 and x¼ 0.15)measured in field cooling(FC) mode at an applied magnetic field of m0H ¼ 500 Oe andtemperature dependence of the inverse of magnetic susceptibility 1/cfor selected samples with x ¼ 0, 0.075 and x ¼ 0.15. The red linepresents the linear fit at high temperature. Left inset shows thetemperature derivative dM/dT. Right inset: zoomed-in view ofmagnetization above TC.
RSC Advances Paper
Ope
n A
cces
s A
rtic
le. P
ublis
hed
on 1
5 A
ugus
t 201
9. D
ownl
oade
d on
12/
31/2
021
9:32
:51
AM
. T
his
artic
le is
lice
nsed
und
er a
Cre
ativ
e C
omm
ons
Attr
ibut
ion
3.0
Unp
orte
d L
icen
ce.
View Article Online
a substantial shi toward lower frequencies (a downshi ofabout 10 cm�1) as a function of Pr concentration. These shisare related to the change in the average Mn–O distance.34
3.4. Magnetic properties
To investigate the magnetic properties of (La1�xPrx)0.67-Ba0.33MnO3 (0 # x # 0.30) nanocrystalline, we performedtemperature dependent eld cooled magnetization measure-ments (M–T) from 400 K to 5 K at 500 Oemagnetic eld (Fig. 4). Atransition from a low-temperature ferromagnetic phase to a hightemperature paramagnetic phase is evident. The Curie tempera-ture TC is the temperature at which the absolute value of dM/dT ismaximum (see the le inset of Fig. 4), are summarized in Table 2.The �337 K transition for the pristine compound is shiedtoward room temperature with increasing Pr concentration, untilin the x¼ 0.30 composition occurs at TC ¼ 309 K. The effective egbandwidth W,35 determined by the overlapping of Mn 3d and O2p orbitals, strongly depends on ionic radii and the structuraldistortion. In this work, both Pr3+ and La3+ are trivalent positiveions, the substitution of La3+ by Pr3+ does not change the chargecarrier density. As we know, the smaller average ionic radius hrAidecreases the Mn–O–Mn bond angles and increases the Mn–Obond lengths,36,37 which weakens the hopping integral of egelectrons and attenuates the DE interaction. The initial decreaseof TC (see Table 2) is related to the reduce of the bandwidth. Onthe one hand, we can see in Fig. 4 that the magnitude ofmagnetization in the ferromagnetic region is decreased (i.e.,when Pr3+ content increases, as discussed above), which is
mtheffðmBÞ ¼
ffiffiffiffiffiffiffiffiffiffiffiffiffiffiffiffiffiffiffiffiffiffiffiffiffiffiffiffiffiffiffiffiffiffiffiffiffiffiffiffiffiffiffiffiffiffiffiffiffiffiffixPr3þ
hmtheffðPr3þÞ
i2þ xMn3þ
r
25632 | RSC Adv., 2019, 9, 25627–25637
consistent with results reported earlier.38–40 Moreover, otherstudies of A-site doped manganites41,42 also reveal that themismatch in the size of the A-cation (s2) inuences the TC. Thus,we have to consider s2, which is dened by the relations:
s2 ¼Pxir2i � hrAi2 (4)
where xi
�Pixi ¼ 1
�is the fractional occupancy and rA is
calculated as: rA ¼ 0.67 � (1 � x) � rLa3+ + 0.67 � x � rPr3+ + 0.33
� rBa2+. The substitution of smaller Pr3+ for larger La3+ cations
causes a decrease in the average A-site cationic radius, while s2
increases (the intrinsic size disorder) (see Table 1). Thisenhancement in the mismatch in the crystal structure inducesa lattice strain by causing a random displacement of oxygenatoms from their average crystallographic positions, therebyresulting in a distortion of the MnO6 octahedra, and hence theeg electrons are localized. So, these changes lead to decrease inTC value of the compounds by weakening double-exchangeinteraction. To get a clear knowledge about the magneticinteraction for (La1�xPrx0.67Ba0.33MnO3 series, the inversesusceptibility (1/c) versus temperature (T) curves are plotted asshown in Fig. 4. A typical Curie–Weiss behaviour is observedabove the TC where 1/c is changing almost linearly with the
temperature which can be tted by1c¼ ðT � qpÞ=C, where C is
the Curie constant and qp is the paramagnetic Curie–Weisstemperature. By tting the linear region, the Curie–Weisstemperatures qp, which are an indication of the nature andstrength of coupling in the structure, and C were obtained. It isevident that qp is always positive for all three samples, indi-cating the existence of FM exchange interaction between spins.Next, the experimental effective paramagnetic momentsmexpeff , are derived for each sample using the following equation:
mexp2
eff ¼ 3kBMmC
NAmB2
(5)
where kB ¼ 1.38016 � 10�23 J K�1 is the Boltzmann constant, NA
¼ 6.023 � 1023 mol�1 is Avogadro's number, Mm is the molec-ular weight and mB ¼ 9.274� 10�21 emu is the Bohr magnetron.These values, together with the Curie–Weiss temperature, arelisted in Table 2. The theoretical effective paramagneticmoment is calculated based on the chemical formula of(La1�xPrx)
3+0.67Ba
2+0.33Mn3+
0.67Mn4+0.33O
2�3 , using the following
expression:
The spin-only magnetic moments for free Mn3+, Mn4+ andPr3+ are 4.89mB, 3.87mB, 3.58mB, respectively. Thus, both theexperimental mexpeff and theoretical mtheff values of the effectivemoment are given in Table 2. As it can be seen from the Table 2,
ffiffiffiffiffiffiffiffiffiffiffiffiffiffiffiffiffiffiffiffiffiffiffiffiffiffiffiffiffiffiffiffiffiffiffiffiffiffiffiffiffiffiffiffiffiffiffiffiffiffiffiffiffiffiffiffiffiffiffiffiffiffiffiffiffiffiffiffiffiffiffiffiffiffiffihmtheffðMn3þÞ
i2þ xMn4þ
hmtheffðMn4þÞ
i2(6)
This journal is © The Royal Society of Chemistry 2019

Paper RSC Advances
Ope
n A
cces
s A
rtic
le. P
ublis
hed
on 1
5 A
ugus
t 201
9. D
ownl
oade
d on
12/
31/2
021
9:32
:51
AM
. T
his
artic
le is
lice
nsed
und
er a
Cre
ativ
e C
omm
ons
Attr
ibut
ion
3.0
Unp
orte
d L
icen
ce.
View Article Online
the experimental (mexpeff ) values are in the range of �6.03–6.72mB,and thus are little larger than the theoretical values. Sucha difference in (meff) values may be ascribed to the appearance ofshort-range FM interactions in the paramagnetic state (aboveTC), which is commonly observed in manganites.18,20,43
3.5. The Bean–Rodbell model
In order to study the nature of the magnetic transition, we haveapplied the Bean–Rodbell model to our magnetization data for(La1�xPrx)0.67Ba0.33MnO3 (x ¼ 0.15, and 0.22). Manganitematerials18,44 with second- and rst-order phase transition havebeen adequately interpreted using this model, which describesin particular the magnetovolume interactions.45 The model
Table 2 Values of the Curie temperature TC, the Curie constant C, theeffective paramagnetic moment (mexpeff ) and (mtheff) for (La1�xPrx)0.67Ba0.33M
(La1�xPrx)0.67Ba0.33MnO3 Tc (K) qCW (K)
0.00 337 3400.075 330 3330.15 328 3300.22 319 3230.30 309 308
Fig. 5 (La1�xPrx)0.67Ba0.33MnO3 (x ¼ 0.10 and x ¼ 0.15) experimentamagnetization as a function of applied magnetic field, at the indicated tem
This journal is © The Royal Society of Chemistry 2019
considers the dependence of the exchange interaction on theinteratomic distance. This dependence is phenomenologicallydescribed by considering the dependence of the criticalmagnetic phase-transition temperature on the volume changein the following way:
TC ¼ T0
�1þ b
ðn� v0Þv0
�; (7)
where n is the volume and n0 is the equilibrium volume obtainedin the absence of magnetic interaction. T0 is the magneticordering temperature in the absence of deformations. Theparameter b represents the slope of the dependence of the Curietemperature (TC) on the cell deformation.
Curie–Weiss temperature qCW and the experimental and theoreticalnO3 (0 # x # 0.30)
C (emu mol�1 Oe�1 K) mtheff (mB) mexpeff (mB)
3.60 4.58 6.033.96 4.64 5.633.30 4.72 5.144.42 4.78 5.955.64 4.85 6.72
l (black lines) and simulated (red dots) curves showing ((a) and (c))perature values and ((b) and (d)) correspondingH/M vs. M2 Arrott plots.
RSC Adv., 2019, 9, 25627–25637 | 25633

RSC Advances Paper
Ope
n A
cces
s A
rtic
le. P
ublis
hed
on 1
5 A
ugus
t 201
9. D
ownl
oade
d on
12/
31/2
021
9:32
:51
AM
. T
his
artic
le is
lice
nsed
und
er a
Cre
ativ
e C
omm
ons
Attr
ibut
ion
3.0
Unp
orte
d L
icen
ce.
View Article Online
Considering a material with compressibility K, spin J andspin density N, one denes the h parameter:
h ¼ 5
2NkbKT0b
2
"4JðJ þ 1Þ2
ð2J þ 1Þ4 � 1
#; (8)
where kb is the Boltzmann constant. Bean and Rodbell proved thatin this model this parameter governs the nature of the magneticphase transition. In the absence of external pressure, for 0# h < 1the transition is second order type while for h > 1 the transition ispurely rst order type,45 with coupled volume and magnetizationdiscontinuities at specic eld and temperature values. Note that,themodel is a modied form of the Bean–Rodbell model extendedto include spin clustering via the parameter J. The experimentaldata can only be well described if a Gaussian distribution of valueswith variable full width at half maximum (FWHM), accounting forsample inhomogeneity, is incorporated into the model. Theparameters h, J, T0, and its FWMH, are tuned in order to providea best t to experimental curves such asM vs. H,M vs. T, and, H/Mvs. M2.18 Fig. 5 shows examples data for (La1�xPrx)0.67Ba0.33MnO3 (x¼ 0.15, and 0.22) and best t curves. We see a good match espe-cially at high eld and highmagnetization betweenmeasurementsand simulated data. As the model assumes a homogeneous andisotropic system, effects such as magnetic domains, anisotropy,and demagnetization are not taken into account, justifying thehigher deviation between experimental data and simulations atlower elds.46 Table 3 shows the parameters obtained from thesesimulations. The second-order transition of our samples isconrmed by their h parameter value (h < 1).45 The partial substi-tution of La3+ by magnetic ions Pr3+ does not alter the ratio ofMn3+/Mn4+ ions but results in a more distorted structure. Thesechanges lead to suppression of the ferromagnetism which affectthe long-range ferromagnetic order. To our knowledge, the rela-tionship between the Pr3+ doping at A-site of lanthanum manga-nite and disorder effects has not been reported before inmanganites. From Table 3, it can be observed that Pr3+ dopinginduces more disorder in the system, as it can be seen from theevolution of the disorder parameter and spin value uctuation.
3.6. Prediction of the magneto-transport properties usingpercolation model
To investigate the effect of substitution with magnetic ions (i.e.,case of Pr3+) at A-site on the electronic transport properties of thesamples, the temperature dependence of electrical resistivitymeasured both in presence and in absence of magnetic eld (up to5.0 T) on (La1�xPrx)0.67Ba0.33MnO3 (x ¼ 0.075, 0.15 and 0.30)samples are shown in Fig. 6(a–c). All the studied samples exhibit
Table 3 Parameters extracted from Bean–Rodbell based analysis for La
Composition La0.60Pr0
Mean-eld and Bean–Rodbell analysisMSat 88.80Tc (K) 329h 0.38Magnetic spin clustering (no. ions) 4.90Tc FWHM disorder (K) 10
25634 | RSC Adv., 2019, 9, 25627–25637
metallic behavior below the metal–semiconductor transitiontemperature (TM–SC) and semiconductor-like features above TM–SC.For the pristine sample, the metal–semiconductor transition isobserved at the temperature (TM–SC) of about 340 K.18 The values ofTM–SC are found to decrease by 50% with increasing Pr3+ concen-tration (with x up to x ¼ 0.30), supporting the XRD and magneticresults discussed above. Resistivity in the entire temperature rangeincreases with increase in Pr3+ concentration, which can beattributed to the weakening of the DE interaction between theMn3+
(t32ge1g, S ¼ 2) and Mn4+ (t32ge
0g, S ¼ 3/2) via the intervening oxygen.
On the other hand, the resistivity at a given temperature is found todecrease with increasing eld and that TM–SC values (see Table 4)are found to move towards high temperature side with increasingmagnetic eld. Praseodymium substitution at A-site may favor thecharge carrier delocalization induced by the magnetic eld, whichsuppresses the resistivity and consequently leads to the localordering of the electron spins. Due to this ordering, the ferro-magnetic metallic (FM-M) state may suppress the paramagneticsemiconducting (P-SC) regime resulting in complete polarization ofconduction electrons (e1g) inside the magnetic domains and, thusare easily transferred between the pairs Mn3+ and Mn4+ via oxygen.To elucidate the carrier transport behavior in the whole measuredtemperature and amagnetic eld, we attempted to t themagneto-resistance of (La1�xPrx)0.67Ba0.33MnO3 (x ¼ 0.075, 0.15 and 0.30)samples according to the percolationmodel.47 This model assumesthe materials to be composed of ferromagnetic and paramagneticregions and semiconductor-like transport properties are exhibitedin the paramagnetic region, whereas metallic transport alwaysshow up in the ferromagnetic region. The relationship applied inthe prediction of themagneto-transport can be expressed as follows
r ¼ �r0 þ r2T2 þ r4:5T
4:5� 1
1þ exp
�U0
1� T
TmodC
!
kBT
0BBBB@
1CCCCA
þ BT exp ðEa=kBTÞ
exp
�U0
1� T
TmodC
!
kBT
0BBBB@
1CCCCA
1þ exp
�U0
1� T
TmodC
!
kBT
0BBBB@
1CCCCA
(9)
0.60Pr0.07Ba0.33MnO3.02 and La0.52Pr0.15Ba0.33MnO2.98
.07Ba0.33MnO3.02 La0.52Pr0.15Ba0.33MnO2.98
88.573200.415.7022
This journal is © The Royal Society of Chemistry 2019

Paper RSC Advances
Ope
n A
cces
s A
rtic
le. P
ublis
hed
on 1
5 A
ugus
t 201
9. D
ownl
oade
d on
12/
31/2
021
9:32
:51
AM
. T
his
artic
le is
lice
nsed
und
er a
Cre
ativ
e C
omm
ons
Attr
ibut
ion
3.0
Unp
orte
d L
icen
ce.
View Article Online
where TmodC (adjustable parameter) means a temperature in the
vicinity of what the resistivity has a maximum value.47 All otherparameters, viz., r0, r2, r4.5, and Ea are kept xed to theirrespective values obtained independently for the metallic-ferromagnetic (T < TM–SC) and semiconductor-paramagnetic (T> TM–SC) regions (see Table 4). The experimental data in Fig. 6were tted using eqn (9). Fitting lines are shown in Fig. 6 andthe results are presented in Table 4. The results calculated fromeqn (9) agree well with the experimental data. However, theactivation energy (Ea) in the absence of an external magneticeld of the samples is extracted in the semiconductor-likeconducting temperature region (well above TM–SC) in terms ofa magnetic polaron picture48 (see Fig. 7). It was further observedthat Ea in the transport process of the carriers increases withdecreasing hrAi and/or tg, implying the decrease of the locali-zation length and the reduction of the carrier mobility, which isintimately related to the localization of carriers and thedestruction of DE interaction arising from Pr-doping at A-site.Thus, are in accordance with the structural and magneticproperties discussed in the previous sections.
Fig. 6 Temperature dependence of the resistivity r (T,H) at without andwith different applied magnetic fields for (La1�xPrx)0.67Ba0.33MnO3 with x¼ 0.075, 0.15 and x ¼ 0.30. Red solid line corresponds to fit by eqn (9).
3.7. Magnetocaloric effect of La0.52Pr0.15Ba0.33MnO2.98
MCE is an intrinsic property of magnetic materials. It is theresponse of the material toward the application or removal ofa magnetic eld. This response is maximized when the materialis near its magnetic ordering temperature. The magnetizationM as a function of the applied magnetic eld, at varioustemperatures, is shown in Fig. 8(a). At the lowest temperatures,the magnetization saturates rapidly due to an easy orientationof the spins under the action of the applied eld. No magnetichysteresis is found around the transition temperature, sug-gesting that the material is a so ferromagnetic. To assess thenature of magnetic phase transitions, Arrott plots49 (m0H/Mversus M2) were constructed based on the M–H data (Inset ofFig. 8(a)). All of the M2 vs. m0H/M curves show positive slopeswithout inexion points, which is characteristic of second ordertransitions according to the Banerjee criterion.50 This feature isin agreement with Bean–Rodbell model analysis. The magneticentropy changes, DSM, of La0.52Pr0.15Ba0.33MnO2.98 has beencalculated using the Maxwell relation51 and is plotted inFig. 8(b) as a function of temperature and eld. The maximumvalue of magnetic entropy change DSMax is found to be aroundTC and it increases with increasing the magnetic applied elddue to the enhancement of FM interactions.
Table 4 Best fit parameters of the electrical resistivity r (T,H) for (La1�xPrx)0.67Ba0.33MnO3 (x ¼ 0.075, 0.15 and x ¼ 0.30) using (eqn (9)). Metal–semiconductor transition temperature TM–SC, and correlation factors R2
Sample
x ¼ 0.075 x ¼ 0.15 x ¼ 0.30
0 T 2 T 5 T 0 T 2 T 5 T 0 T 2 T 5 T
r0 (U cm) 0.017 0.014 0.011 0.788 0.544 0.362 2.32 1.62 1.48r2 (U cm K�2) 5.44 � 10�6 5.22 � 10�6 5.08 � 10�6 8.72 � 10�5 5.96 � 10�5 3.53 � 10�5 5.43 � 10�4 3.88 � 10�4 1.65 � 10�4
r4.5 (U cm K�4.5) 2.95 � 10�13 2.35 � 10�13 1.74 � 10�13 7.76 � 10�12 4.66 � 10�12 2.94 � 10�12 6.19 � 10�12 2.43 � 10�12 1.63 � 10�12
TM–SC (K) 256 266 270 201 211 215 171 201 206R2 (%) 0.998 0.995 0.997 0.972 0.961 0.988 0.998 0.968 0.988
This journal is © The Royal Society of Chemistry 2019 RSC Adv., 2019, 9, 25627–25637 | 25635

Fig. 7 Activation energy vs. the tolerance factor tg and the averageionic radius of the A-site hrAi for (La1�xPrx)0.67Ba0.33MnO3 (0 # x #
0.30).
RSC Advances Paper
Ope
n A
cces
s A
rtic
le. P
ublis
hed
on 1
5 A
ugus
t 201
9. D
ownl
oade
d on
12/
31/2
021
9:32
:51
AM
. T
his
artic
le is
lice
nsed
und
er a
Cre
ativ
e C
omm
ons
Attr
ibut
ion
3.0
Unp
orte
d L
icen
ce.
View Article Online
At a DSM of 5 T, the maximum value of the magnetic entropychange DSM is found to be about 3.39 J kg�1 K�1 (1.34 J kg�1 K�1
for 1.5 T) and the estimated relative cooling power (RCP), whichis considered as the efficiency of magnetocaloric materialsbased on the magnetic entropy change, is found to be 251 J kg�1
Fig. 8 (a) Isothermalmagnetization versusmagnetic field around TC ofLa0.52Pr0.15Ba0.33MnO2.98. Inset shows Arrott plot of m0H/M vs. M2 atdifferent temperatures. (b) The temperature dependence of themagnetic entropy change (DSM) under different applied magneticfields.
25636 | RSC Adv., 2019, 9, 25627–25637
(71 J kg�1 for 1.5 T). The RCP value is calculated from theproduct of the peak entropy change times the full width at halfmaximum. These values are about 61% of those of pure Gd, theprototype magnetic refrigerant material (RCP ¼ 410 J kg�1).52
For comparison, the obtained values are higher than theobserved in manganite polycrystalline, La0.40 Pr0.30Sr0.30MnO3
(ref. 53) and La0.55 Pr0.15Sr0.30MnO3.53 From these results, wecan estimate that our material is potential candidates tomagnetic refrigeration applications around room temperature.
4 Conclusion
The inuence of praseodymium substituting at La-site in(La1�xPrx)0.67Ba0.33MnO3 (0.075 # x # 0.30) has been investi-gated, in structural, magnetic and electrical transport proper-ties. The samples were synthesized using the Pechini sol–gelmethod. Rietveld renement of XRD patterns shows that allsamples crystallized in a rhombohedral structure with R�3cspace group. FTIR and Raman measurements conrms theperovskite structure of all the samples. The substitution of Pr3+
changes A-site average cationic radius and decreases the latticeparameters, Curie temperatures (TC), metal–semiconductortransition (TM–SC), and the magnitude of magnetization in theferromagnetic region. It is observed that doping of Pr inducesan increase in polaron activation energy. This fact indicates thatPr doping enhances electronic localization. Numerical simula-tions, in the framework of the molecular mean eld modelincorporating the Bean–Rodbell magnetovolume coupling wereperformed. We have found that Pr3+ doping on A-site leads tomore chemical/structural disorder in second-order magneticsystem. On the other hand, the behavior of r (T,H) of thesesamples in a wide range of temperatures and magnetic eldscan be explained using the phenomenological model based onthe phase segregation mechanism (percolation model).
Around room temperature, the La0.52Pr0.15Ba0.33MnO2.98
sample exhibit a sizable magnetic entropy change of 1.34 J kg�1
K�1 and a RCP of 71 J kg�1 under a magnetic eld change of 1.5T, making this compound a suitable candidate for activemagnetic refrigeration.
Conflicts of interest
There are no conicts to declare.
Acknowledgements
Dr Marwene Oumezzine acknowledges Dr Joao Amaral fromUniversidade de Aveiro.
References
1 W. Zhang, A. Chen, F. Khatkhatay, C. F. Tsai, Q. Su, L. Jiao,X. Zhang and H. Wang, ACS Appl. Mater. Interfaces, 2013, 5,3995.
2 K. Chahara, T. Ohno, M. Kasai and Y. Kozono, Appl. Phys.Lett., 1993, 63, 1990.
This journal is © The Royal Society of Chemistry 2019
Paper RSC Advances
Ope
n A
cces
s A
rtic
le. P
ublis
hed
on 1
5 A
ugus
t 201
9. D
ownl
oade
d on
12/
31/2
021
9:32
:51
AM
. T
his
artic
le is
lice
nsed
und
er a
Cre
ativ
e C
omm
ons
Attr
ibut
ion
3.0
Unp
orte
d L
icen
ce.
View Article Online
3 N. G. Deshpande, C. H. Weng, Y. F. Wang, Y. C. Shao,C. Q. Cheng, D. C. Ling, H. C. Hsueh, C. H. Du, H. M. Tsai,C. W. Pao, H. J. Lin, J. F. Lee, J. W. Chiou, H. M. Tsai andW. F. Pong, J. Appl. Phys., 2014, 115(23), 233713.
4 A. C. Galca, M. Oumezzine, A. Leca, C. F. Chirila, V. Kuncser,A. Kuncser, C. Ghica, I. Pasuk and M. Oumezzine, Appl. Phys.Lett., 2017, 111, 182409.
5 M. Kumaresavanji, C. T. Sousa, A. Pires, A. M. Pereira,A. M. L. Lopes and J. P. Araujo, Appl. Phys. Lett., 2014, 105,083110.
6 T. Goto, T. Kimura, G. Lawes, A. P. Ramirez and Y. Tokura,Phys. Rev. Lett., 2004, 92, 257201.
7 D. N. H. Nam, N. V. Khien, N. V. Dai, L. V. Hong andN. X. Phuc, Phys. Rev. B: Condens. Matter Mater. Phys., 2008,77, 214406.
8 M. Oumezzine, S. Zemni and O. Pena, J. Alloys Compd., 2010,508, 292.
9 C. Zener, Phys. Rev. B: Solid State, 1951, 82, 403.10 P. W. Anderson and H. Hasegawa, Phys. Rev. B: Solid State,
1955, 100, 675.11 J. M. D. Coey, M. Viret and S. von Molnar, Adv. Phys., 1999,
48, 167.12 X. H. Huang, J. F. Ding, Z. L. Jiang, Y. W. Yin, Q. X. Yu and
X. G. Li, J. Appl. Phys., 2009, 106, 083904.13 P. Dutta, P. Dey and T. K. Nath, J. Appl. Phys., 2007, 102,
073906.14 V. K. Shukla and S. Mukhopadhyay, J. Appl. Phys., 2017, 121,
093901.15 Z. Zeng, M. Greenblatt and M. Cro, Phys. Rev. B: Condens.
Matter Mater. Phys., 1999, 59, 8784.16 N. Panopoulos, D. Koumoulis, G. Diamantopoulos,
M. Belesi, M. Fardis, M. Pissas and G. Papavassiliou, Phys.Rev. B: Condens. Matter Mater. Phys., 2010, 82, 235102.
17 M. Oumezzine, A. C. Galca, I. Pasuk, C. F. Chirila, A. Leca,V. Kuncser, L. C. Tanase, A. Kuncser, C. Ghica andM. Oumezzine, Dalton Trans., 2016, 45, 15034.
18 M. Oumezzine, J. S. Amaral, F. J. Mompean, M. G. Hernandezand M. Oumezzine, RSC Adv., 2016, 6, 32193.
19 T. A. Ho, S. H. Lim, T. L. Phan and S. C. Yu, J. Alloys Compd.,2017, 692, 687.
20 J. M. D. Coey, M. Viret and S. von Molnar, Adv. Phys., 1999,48, 167.
21 T. Roisnel and J. Rodriguez-Carvajal, Program: Fullprof,LLBLCSIM, France, 2000.
22 M. Oumezzine, O. Hassayoun, R. Bellouz, H. B. Sales andE. Hlil, J. Alloys Compd., 2017, 729, 156.
23 R. D. Shannon, Acta Crystallogr., Sect. A: Cryst. Phys., Diffr.,Theor. Gen. Crystallogr., 1976, 32, 751.
24 Y. Zhang, P. J. Lampen, S.-C. Yu, H. Srikanth andM.-H. Phan, J. Appl. Phys., 2012, 111, 063918.
25 A. Swain and V. Gorige, Phys. Status Solidi B, 2019, 1800707.26 A. Swain, P. S. Anil Kumar and V. Gorige, J. Magn. Magn.
Mater., 2019, 485, 358.27 G. K. Williamson and W. H. Hall, Acta Metall., 1953, 1, 22.28 L. Martın-Carron, A. de Andres, M. J. Martınez-Lope,
M. T. Casais and J. A. Alonso, Phys. Rev. B: Condens. MatterMater. Phys., 2002, 66, 174303.
This journal is © The Royal Society of Chemistry 2019
29 V. B. Podobedov, D. B. Romero, A. Weber, J. P. Rice,R. Schreekala, M. Rajeswari, R. Ramesh, T. Venkatesanand H. D. Drew, Appl. Phys. Lett., 1998, 73, 3217.
30 D. Varshney and M. W. Shaikh, J. Alloys Compd., 2014, 589,558.
31 N. Dodiya and D. Varshney, J. Mol. Struct., 2013, 1031, 104.32 R. Bellouz, M. Oumezzine, A. Dinia, G. Schmerber, E. Hlil
and M. Oumezzine, RSC Adv., 2015, 5, 64557.33 L. Martın-Carron, A. de Andres, M. J. Martınez-Lope,
M. T. Casais and J. A. Alonso, Phys. Rev. B: Condens. MatterMater. Phys., 2002, 66, 174303.
34 N. Van Minh and I.-S. Yang, Vib. Spectrosc., 2006, 42, 353.35 P. G. Radaelli, G. Iannone, M. Marezio, H. Y. Hwang,
S. W. Cheong, J. D. Jorgensen and D. N. Argyriou, Phys.Rev. B: Condens. Matter Mater. Phys., 1997, 56, 8265.
36 Y. K. Lakshmi, S. Manjunathrao and P. V. Reddy, Mater.Chem. Phys., 2014, 143, 983.
37 D. Varshney and M. W. Shaikh, J. Alloys Compd., 2014, 589,558.
38 M. S. Anwar, F. Ahmed and B. H. Koo, J. Alloys Compd., 2014,617, 893.
39 V. Dyakonov, F. Bukhanko, V. Kamenev, E. Zubov, S. Baran,T. Jaworska-Gołab, A. Szytuła, E. Wawrzynska, B. Penc,R. Duraj, et al., Phys. Rev. B: Condens. Matter Mater. Phys.,2006, 74, 024418.
40 E. Wawrzynska, B. Penc, R. Duraj, N. Stusser,M. Arciszewska, W. Dobrowolski, K. Dyakonov, J. Pientosa,O. Manus, A. Nabialek, P. Aleshkevych, R. Puzniak,A. Wisniewski, R. Zuberek and H. Szymczak, Phys. Rev. B:Condens. Matter Mater. Phys., 2006, 74, 024418.
41 A. Dogra, S. Rayaprol, P. D. Babu, G. Ravi Kumar andS. K. Gupta, J. Alloys Compd., 2010, 493, L19.
42 F. Damay, C. Martin, A. Maignan and B. Raveau, J. Appl.Phys., 1997, 82, 6181.
43 J. J. Blanco, M. Insausti, I. Gil de Muro, L. Lezama andT. Rojo, J. Solid State Chem., 2006, 179, 623.
44 J. S. Amaral and V. S. Amaral, Phys. Status Solidi A, 2014, 211,971.
45 C. P. Bean and D. S. Rodbell, Phys. Rev. B: Solid State, 1962,126(1), 104.
46 B. Vertruyen, R. Cloots, A. Rulmont, G. Dhalenne, M. Ausloosand P. Vanderbemden, J. Appl. Phys., 2001, 90, 5692.
47 G. Li, H.-D. Zhou, S. L. Feng, X.-J. Fan and X. G. Li, J. Appl.Phys., 2002, 92, 1406.
48 D. Emin and T. Holstein, Phys. Rev. B: Solid State, 1976, 13,647.
49 L. M. R. Martinez and J. P. Atteld, Phys. Rev. B: Condens.Matter Mater. Phys., 1996, 54, 5622.
50 B. K. Banerjee, Phys. Lett., 1964, 12, 16.51 L. M. R. Martinez and J. P. Atteld, Phys. Rev. B: Condens.
Matter Mater. Phys., 1996, 54, 5622.52 K. A. Gschneidner, V. K. Pecharsky and A. O. Tsokol, Rep.
Prog. Phys., 2005, 68, 1479.53 Y. Zhang, P. J. Lampen, T.-L. Phan, S.-C. Yu, H. Srikanth and
M.-H. Phan, J. Appl. Phys., 2012, 111, 063918.
RSC Adv., 2019, 9, 25627–25637 | 25637