pptra payment schedule spring billers tax …€¦ · 1,147,225.98 : 489,868.21 ... amount...
TRANSCRIPT
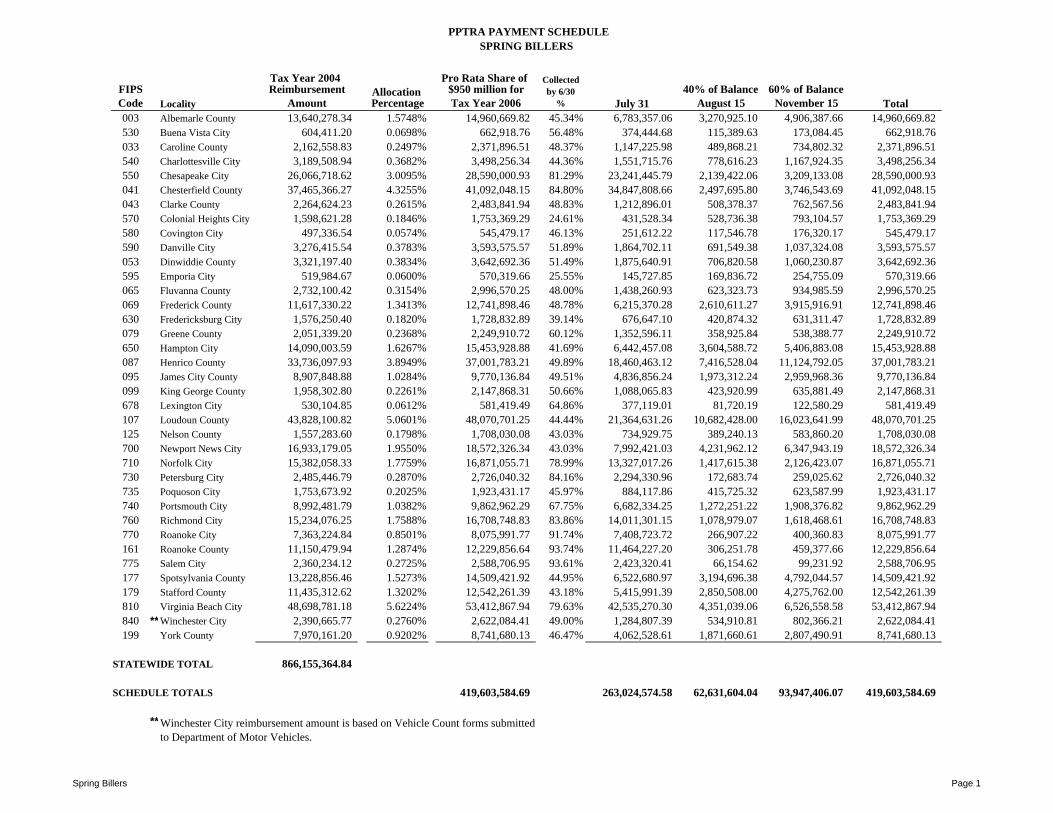
PPTRA PAYMENT SCHEDULE SPRING BILLERS
Tax Year 2004 Pro Rata Share of Collected FIPS Code Locality
Reimbursement Amount
Allocation Percentage
$950 million for Tax Year 2006
by 6/30 % July 31
40% of Balance August 15
60% of Balance November 15 Total
003 Albemarle County 13,640,278.34 1.5748% 14,960,669.82 45.34% 6,783,357.06 3,270,925.10 4,906,387.66 14,960,669.82 530 Buena Vista City 604,411.20 0.0698% 662,918.76 56.48% 374,444.68 115,389.63 173,084.45 662,918.76 033 Caroline County 2,162,558.83 0.2497% 2,371,896.51 48.37% 1,147,225.98 489,868.21 734,802.32 2,371,896.51 540 Charlottesville City 3,189,508.94 0.3682% 3,498,256.34 44.36% 1,551,715.76 778,616.23 1,167,924.35 3,498,256.34 550 Chesapeake City 26,066,718.62 3.0095% 28,590,000.93 81.29% 23,241,445.79 2,139,422.06 3,209,133.08 28,590,000.93 041 Chesterfield County 37,465,366.27 4.3255% 41,092,048.15 84.80% 34,847,808.66 2,497,695.80 3,746,543.69 41,092,048.15 043 Clarke County 2,264,624.23 0.2615% 2,483,841.94 48.83% 1,212,896.01 508,378.37 762,567.56 2,483,841.94 570 Colonial Heights City 1,598,621.28 0.1846% 1,753,369.29 24.61% 431,528.34 528,736.38 793,104.57 1,753,369.29 580 Covington City 497,336.54 0.0574% 545,479.17 46.13% 251,612.22 117,546.78 176,320.17 545,479.17 590 Danville City 3,276,415.54 0.3783% 3,593,575.57 51.89% 1,864,702.11 691,549.38 1,037,324.08 3,593,575.57 053 Dinwiddie County 3,321,197.40 0.3834% 3,642,692.36 51.49% 1,875,640.91 706,820.58 1,060,230.87 3,642,692.36 595 Emporia City 519,984.67 0.0600% 570,319.66 25.55% 145,727.85 169,836.72 254,755.09 570,319.66 065 Fluvanna County 2,732,100.42 0.3154% 2,996,570.25 48.00% 1,438,260.93 623,323.73 934,985.59 2,996,570.25 069 Frederick County 11,617,330.22 1.3413% 12,741,898.46 48.78% 6,215,370.28 2,610,611.27 3,915,916.91 12,741,898.46 630 Fredericksburg City 1,576,250.40 0.1820% 1,728,832.89 39.14% 676,647.10 420,874.32 631,311.47 1,728,832.89 079 Greene County 2,051,339.20 0.2368% 2,249,910.72 60.12% 1,352,596.11 358,925.84 538,388.77 2,249,910.72 650 Hampton City 14,090,003.59 1.6267% 15,453,928.88 41.69% 6,442,457.08 3,604,588.72 5,406,883.08 15,453,928.88 087 Henrico County 33,736,097.93 3.8949% 37,001,783.21 49.89% 18,460,463.12 7,416,528.04 11,124,792.05 37,001,783.21 095 James City County 8,907,848.88 1.0284% 9,770,136.84 49.51% 4,836,856.24 1,973,312.24 2,959,968.36 9,770,136.84 099 King George County 1,958,302.80 0.2261% 2,147,868.31 50.66% 1,088,065.83 423,920.99 635,881.49 2,147,868.31 678 Lexington City 530,104.85 0.0612% 581,419.49 64.86% 377,119.01 81,720.19 122,580.29 581,419.49 107 Loudoun County 43,828,100.82 5.0601% 48,070,701.25 44.44% 21,364,631.26 10,682,428.00 16,023,641.99 48,070,701.25 125 Nelson County 1,557,283.60 0.1798% 1,708,030.08 43.03% 734,929.75 389,240.13 583,860.20 1,708,030.08 700 Newport News City 16,933,179.05 1.9550% 18,572,326.34 43.03% 7,992,421.03 4,231,962.12 6,347,943.19 18,572,326.34 710 Norfolk City 15,382,058.33 1.7759% 16,871,055.71 78.99% 13,327,017.26 1,417,615.38 2,126,423.07 16,871,055.71 730 Petersburg City 2,485,446.79 0.2870% 2,726,040.32 84.16% 2,294,330.96 172,683.74 259,025.62 2,726,040.32 735 Poquoson City 1,753,673.92 0.2025% 1,923,431.17 45.97% 884,117.86 415,725.32 623,587.99 1,923,431.17 740 Portsmouth City 8,992,481.79 1.0382% 9,862,962.29 67.75% 6,682,334.25 1,272,251.22 1,908,376.82 9,862,962.29 760 Richmond City 15,234,076.25 1.7588% 16,708,748.83 83.86% 14,011,301.15 1,078,979.07 1,618,468.61 16,708,748.83 770 Roanoke City 7,363,224.84 0.8501% 8,075,991.77 91.74% 7,408,723.72 266,907.22 400,360.83 8,075,991.77 161 Roanoke County 11,150,479.94 1.2874% 12,229,856.64 93.74% 11,464,227.20 306,251.78 459,377.66 12,229,856.64 775 Salem City 2,360,234.12 0.2725% 2,588,706.95 93.61% 2,423,320.41 66,154.62 99,231.92 2,588,706.95 177 Spotsylvania County 13,228,856.46 1.5273% 14,509,421.92 44.95% 6,522,680.97 3,194,696.38 4,792,044.57 14,509,421.92 179 Stafford County 11,435,312.62 1.3202% 12,542,261.39 43.18% 5,415,991.39 2,850,508.00 4,275,762.00 12,542,261.39 810 Virginia Beach City 48,698,781.18 5.6224% 53,412,867.94 79.63% 42,535,270.30 4,351,039.06 6,526,558.58 53,412,867.94 840 ** Winchester City 2,390,665.77 0.2760% 2,622,084.41 49.00% 1,284,807.39 534,910.81 802,366.21 2,622,084.41 199 York County 7,970,161.20 0.9202% 8,741,680.13 46.47% 4,062,528.61 1,871,660.61 2,807,490.91 8,741,680.13
STATEWIDE TOTAL 866,155,364.84
SCHEDULE TOTALS 419,603,584.69 263,024,574.58 62,631,604.04 93,947,406.07 419,603,584.69
** Winchester City reimbursement amount is based on Vehicle Count forms submitted to Department of Motor Vehicles.
Spring Billers Page 1

PPTRA PAYMENT SCHEDULE LOCALITIES RECEIVING MORE THAN $20 MILLION PER YEAR
FIPS Code 510 013 059 153
LocalityAlexandria City Arlington County Fairfax County Prince William County
Tax Year 2004 Reimbursement
Amount 21,497,548.09 28,493,910.29
192,663,901.47 49,496,244.85
Allocation Percentage
2.4820% 3.2897%
22.2436% 5.7145%
Pro Rata Share of $950 million for Tax Year 2006
23,578,530.50 31,252,146.99
211,313,944.16 54,287,526.83
50% August 15
45% November 15
11,789,265.25 10,610,338.73 15,626,073.50 14,063,466.15
105,656,972.08 95,091,274.87 27,143,763.42 24,429,387.07
3% February 15
707,355.92 937,564.41
6,339,418.32 1,628,625.80
2% May 15 471,570.60 625,042.93
4,226,278.89 1,085,750.54
Total 23,578,530.50 31,252,146.99
211,313,944.16 54,287,526.83
STATEWIDE TOTAL 866,155,364.84
SCHEDULE TOTALS 320,432,148.48 160,216,074.25 144,194,466.82 9,612,964.45 6,408,642.96 320,432,148.48
More than 20M Per YR Page 1

PPTRA PAYMENT SCHEDULE
LOCALITIES RECEIVING LESS THAN $20 MILLION PER YEAR
Tax Year 2004 Pro Rata Share of FIPS Reimbursement Allocation $950 million for 5% 75% 15% 5% Code Locality Amount Percentage Tax Year 2006 August 15 November 15 February 15 May 15 Total 001 Accomack County 2,785,563.64 0.3216% 3,055,208.76 152,760.44 2,291,406.57 458,281.31 152,760.44 3,055,208.76 005 Alleghany County 1,468,641.99 0.1696% 1,610,807.88 80,540.39 1,208,105.91 241,621.18 80,540.40 1,610,807.88 007 Amelia County 929,259.77 0.1073% 1,019,212.97 50,960.65 764,409.73 152,881.95 50,960.64 1,019,212.97 009 Amherst County 2,004,938.46 0.2315% 2,199,018.35 109,950.92 1,649,263.76 329,852.75 109,950.92 2,199,018.35 011 Appomattox County 933,293.14 0.1078% 1,023,636.77 51,181.84 767,727.58 153,545.52 51,181.83 1,023,636.77 015 Augusta County 3,916,839.35 0.4522% 4,295,993.00 214,799.65 3,221,994.75 644,398.95 214,799.65 4,295,993.00 017 Bath County 36,721.00 0.0042% 40,275.63 2,013.78 30,206.72 6,041.34 2,013.79 40,275.63 515 Bedford City 255,877.80 0.0295% 280,647.01 14,032.35 210,485.26 42,097.05 14,032.35 280,647.01 019 Bedford County 5,548,911.49 0.6406% 6,086,051.22 304,302.56 4,564,538.42 912,907.68 304,302.56 6,086,051.22 021 Bland County 323,268.47 0.0373% 354,561.15 17,728.06 265,920.86 53,184.17 17,728.06 354,561.15 023 Botetourt County 3,116,460.75 0.3598% 3,418,137.01 170,906.85 2,563,602.76 512,720.55 170,906.85 3,418,137.01 520 Bristol City 660,092.49 0.0762% 723,990.05 36,199.50 542,992.54 108,598.51 36,199.50 723,990.05 025 Brunswick County 1,236,082.00 0.1427% 1,355,735.87 67,786.79 1,016,801.90 203,360.38 67,786.80 1,355,735.87 027 Buchanan County 1,457,063.35 0.1682% 1,598,108.42 79,905.42 1,198,581.32 239,716.26 79,905.42 1,598,108.42 029 Buckingham County 1,036,573.06 0.1197% 1,136,914.28 56,845.71 852,685.71 170,537.14 56,845.72 1,136,914.28 031 Campbell County 3,150,993.87 0.3638% 3,456,012.97 172,800.65 2,592,009.73 518,401.95 172,800.64 3,456,012.97 035 Carroll County 958,744.36 0.1107% 1,051,551.69 52,577.58 788,663.77 157,732.75 52,577.59 1,051,551.69 036 Charles City County 629,980.23 0.0727% 690,962.90 34,548.15 518,222.18 103,644.44 34,548.13 690,962.90 037 Charlotte County 626,284.98 0.0723% 686,909.94 34,345.50 515,182.46 103,036.49 34,345.49 686,909.94 045 Craig County 310,954.48 0.0359% 341,055.16 17,052.76 255,791.37 51,158.27 17,052.76 341,055.16 047 Culpeper County 3,070,573.86 0.3545% 3,367,808.23 168,390.41 2,525,856.17 505,171.23 168,390.42 3,367,808.23 049 Cumberland County 794,798.68 0.0918% 871,735.92 43,586.80 653,801.94 130,760.39 43,586.79 871,735.92 051 Dickenson County 745,761.53 0.0861% 817,951.93 40,897.60 613,463.95 122,692.79 40,897.59 817,951.93 057 Essex County 961,132.55 0.1110% 1,054,171.06 52,708.55 790,628.30 158,125.66 52,708.55 1,054,171.06 600 Fairfax City 2,825,494.92 0.3262% 3,099,005.42 154,950.27 2,324,254.07 464,850.81 154,950.27 3,099,005.42 610 Falls Church City 1,842,520.22 0.2127% 2,020,877.87 101,043.89 1,515,658.40 303,131.68 101,043.90 2,020,877.87 061 Fauquier County 12,453,943.63 1.4378% 13,659,496.82 682,974.84 10,244,622.62 2,048,924.52 682,974.84 13,659,496.82 063 Floyd County 844,037.69 0.0974% 925,741.31 46,287.07 694,305.98 138,861.20 46,287.06 925,741.31 620 Franklin City 956,323.61 0.1104% 1,048,896.61 52,444.83 786,672.46 157,334.49 52,444.83 1,048,896.61 067 Franklin County 2,394,799.06 0.2765% 2,626,617.81 131,330.89 1,969,963.36 393,992.67 131,330.89 2,626,617.81 640 Galax City 209,711.81 0.0242% 230,012.11 11,500.61 172,509.08 34,501.82 11,500.60 230,012.11 071 Giles County 1,119,492.35 0.1292% 1,227,860.24 61,393.01 920,895.18 184,179.04 61,393.01 1,227,860.24 073 Gloucester County 2,533,403.90 0.2925% 2,778,639.73 138,931.99 2,083,979.80 416,795.96 138,931.98 2,778,639.73 075 Goochland County 2,601,212.04 0.3003% 2,853,011.76 142,650.59 2,139,758.82 427,951.76 142,650.59 2,853,011.76 077 Grayson County 399,149.34 0.0461% 437,787.36 21,889.37 328,340.52 65,668.10 21,889.37 437,787.36 081 Greensville County 971,387.79 0.1121% 1,065,419.02 53,270.95 799,064.27 159,812.85 53,270.95 1,065,419.02 083 Halifax County 1,370,562.46 0.1582% 1,503,234.17 75,161.71 1,127,425.63 225,485.13 75,161.70 1,503,234.17 085 Hanover County 13,678,640.37 1.5792% 15,002,745.33 750,137.27 11,252,059.00 2,250,411.80 750,137.26 15,002,745.33 660 Harrisonburg City 1,388,203.40 0.1603% 1,522,582.76 76,129.14 1,141,937.07 228,387.41 76,129.14 1,522,582.76 089 Henry County 1,615,450.97 0.1865% 1,771,828.11 88,591.41 1,328,871.08 265,774.22 88,591.40 1,771,828.11 091 Highland County 152,308.53 0.0176% 167,052.14 8,352.61 125,289.11 25,057.82 8,352.60 167,052.14 670 Hopewell City 1,475,226.37 0.1703% 1,618,029.64 80,901.48 1,213,522.23 242,704.45 80,901.48 1,618,029.64 093 Isle of Wight County 4,664,374.73 0.5385% 5,115,890.49 255,794.52 3,836,917.87 767,383.57 255,794.53 5,115,890.49
Less than 20M Per YR Page 1
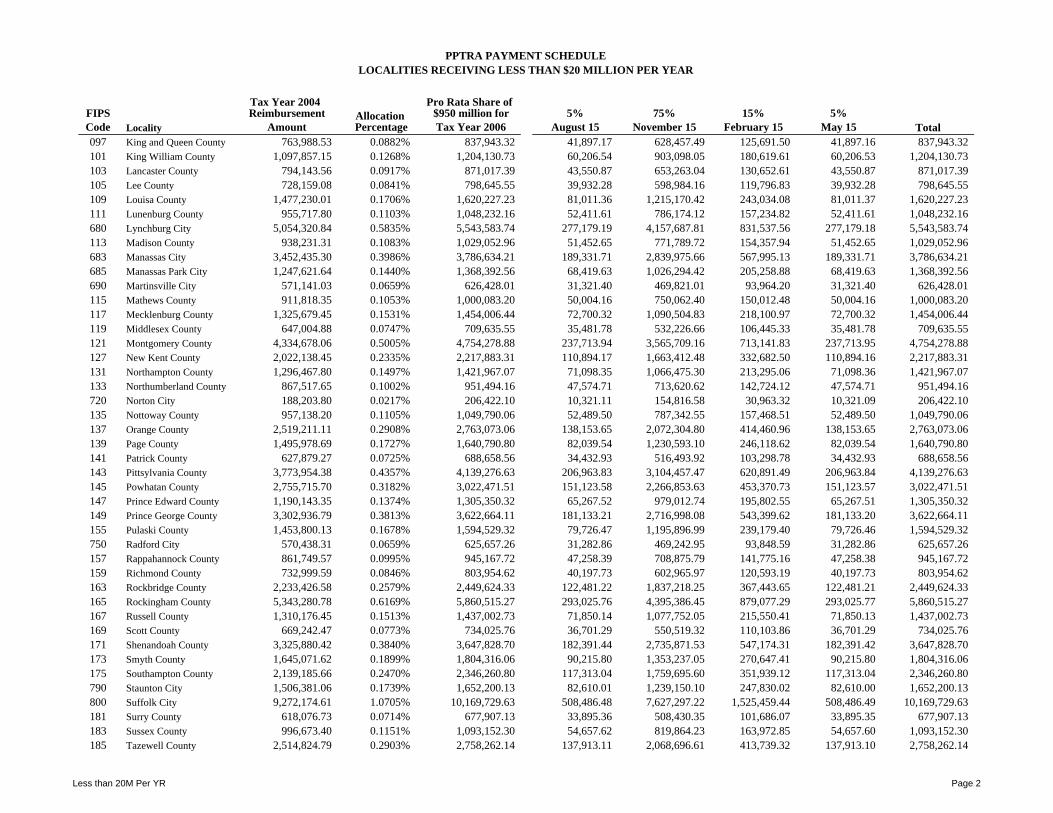
PPTRA PAYMENT SCHEDULE
LOCALITIES RECEIVING LESS THAN $20 MILLION PER YEAR
Tax Year 2004 Pro Rata Share of FIPS Reimbursement Allocation $950 million for 5% 75% 15% 5% Code Locality Amount Percentage Tax Year 2006 August 15 November 15 February 15 May 15 Total 097 King and Queen County 763,988.53 0.0882% 837,943.32 41,897.17 628,457.49 125,691.50 41,897.16 837,943.32 101 King William County 1,097,857.15 0.1268% 1,204,130.73 60,206.54 903,098.05 180,619.61 60,206.53 1,204,130.73 103 Lancaster County 794,143.56 0.0917% 871,017.39 43,550.87 653,263.04 130,652.61 43,550.87 871,017.39 105 Lee County 728,159.08 0.0841% 798,645.55 39,932.28 598,984.16 119,796.83 39,932.28 798,645.55 109 Louisa County 1,477,230.01 0.1706% 1,620,227.23 81,011.36 1,215,170.42 243,034.08 81,011.37 1,620,227.23 111 Lunenburg County 955,717.80 0.1103% 1,048,232.16 52,411.61 786,174.12 157,234.82 52,411.61 1,048,232.16 680 Lynchburg City 5,054,320.84 0.5835% 5,543,583.74 277,179.19 4,157,687.81 831,537.56 277,179.18 5,543,583.74 113 Madison County 938,231.31 0.1083% 1,029,052.96 51,452.65 771,789.72 154,357.94 51,452.65 1,029,052.96 683 Manassas City 3,452,435.30 0.3986% 3,786,634.21 189,331.71 2,839,975.66 567,995.13 189,331.71 3,786,634.21 685 Manassas Park City 1,247,621.64 0.1440% 1,368,392.56 68,419.63 1,026,294.42 205,258.88 68,419.63 1,368,392.56 690 Martinsville City 571,141.03 0.0659% 626,428.01 31,321.40 469,821.01 93,964.20 31,321.40 626,428.01 115 Mathews County 911,818.35 0.1053% 1,000,083.20 50,004.16 750,062.40 150,012.48 50,004.16 1,000,083.20 117 Mecklenburg County 1,325,679.45 0.1531% 1,454,006.44 72,700.32 1,090,504.83 218,100.97 72,700.32 1,454,006.44 119 Middlesex County 647,004.88 0.0747% 709,635.55 35,481.78 532,226.66 106,445.33 35,481.78 709,635.55 121 Montgomery County 4,334,678.06 0.5005% 4,754,278.88 237,713.94 3,565,709.16 713,141.83 237,713.95 4,754,278.88 127 New Kent County 2,022,138.45 0.2335% 2,217,883.31 110,894.17 1,663,412.48 332,682.50 110,894.16 2,217,883.31 131 Northampton County 1,296,467.80 0.1497% 1,421,967.07 71,098.35 1,066,475.30 213,295.06 71,098.36 1,421,967.07 133 Northumberland County 867,517.65 0.1002% 951,494.16 47,574.71 713,620.62 142,724.12 47,574.71 951,494.16 720 Norton City 188,203.80 0.0217% 206,422.10 10,321.11 154,816.58 30,963.32 10,321.09 206,422.10 135 Nottoway County 957,138.20 0.1105% 1,049,790.06 52,489.50 787,342.55 157,468.51 52,489.50 1,049,790.06 137 Orange County 2,519,211.11 0.2908% 2,763,073.06 138,153.65 2,072,304.80 414,460.96 138,153.65 2,763,073.06 139 Page County 1,495,978.69 0.1727% 1,640,790.80 82,039.54 1,230,593.10 246,118.62 82,039.54 1,640,790.80 141 Patrick County 627,879.27 0.0725% 688,658.56 34,432.93 516,493.92 103,298.78 34,432.93 688,658.56 143 Pittsylvania County 3,773,954.38 0.4357% 4,139,276.63 206,963.83 3,104,457.47 620,891.49 206,963.84 4,139,276.63 145 Powhatan County 2,755,715.70 0.3182% 3,022,471.51 151,123.58 2,266,853.63 453,370.73 151,123.57 3,022,471.51 147 Prince Edward County 1,190,143.35 0.1374% 1,305,350.32 65,267.52 979,012.74 195,802.55 65,267.51 1,305,350.32 149 Prince George County 3,302,936.79 0.3813% 3,622,664.11 181,133.21 2,716,998.08 543,399.62 181,133.20 3,622,664.11 155 Pulaski County 1,453,800.13 0.1678% 1,594,529.32 79,726.47 1,195,896.99 239,179.40 79,726.46 1,594,529.32 750 Radford City 570,438.31 0.0659% 625,657.26 31,282.86 469,242.95 93,848.59 31,282.86 625,657.26 157 Rappahannock County 861,749.57 0.0995% 945,167.72 47,258.39 708,875.79 141,775.16 47,258.38 945,167.72 159 Richmond County 732,999.59 0.0846% 803,954.62 40,197.73 602,965.97 120,593.19 40,197.73 803,954.62 163 Rockbridge County 2,233,426.58 0.2579% 2,449,624.33 122,481.22 1,837,218.25 367,443.65 122,481.21 2,449,624.33 165 Rockingham County 5,343,280.78 0.6169% 5,860,515.27 293,025.76 4,395,386.45 879,077.29 293,025.77 5,860,515.27 167 Russell County 1,310,176.45 0.1513% 1,437,002.73 71,850.14 1,077,752.05 215,550.41 71,850.13 1,437,002.73 169 Scott County 669,242.47 0.0773% 734,025.76 36,701.29 550,519.32 110,103.86 36,701.29 734,025.76 171 Shenandoah County 3,325,880.42 0.3840% 3,647,828.70 182,391.44 2,735,871.53 547,174.31 182,391.42 3,647,828.70 173 Smyth County 1,645,071.62 0.1899% 1,804,316.06 90,215.80 1,353,237.05 270,647.41 90,215.80 1,804,316.06 175 Southampton County 2,139,185.66 0.2470% 2,346,260.80 117,313.04 1,759,695.60 351,939.12 117,313.04 2,346,260.80 790 Staunton City 1,506,381.06 0.1739% 1,652,200.13 82,610.01 1,239,150.10 247,830.02 82,610.00 1,652,200.13 800 Suffolk City 9,272,174.61 1.0705% 10,169,729.63 508,486.48 7,627,297.22 1,525,459.44 508,486.49 10,169,729.63 181 Surry County 618,076.73 0.0714% 677,907.13 33,895.36 508,430.35 101,686.07 33,895.35 677,907.13 183 Sussex County 996,673.40 0.1151% 1,093,152.30 54,657.62 819,864.23 163,972.85 54,657.60 1,093,152.30 185 Tazewell County 2,514,824.79 0.2903% 2,758,262.14 137,913.11 2,068,696.61 413,739.32 137,913.10 2,758,262.14
Less than 20M Per YR Page 2
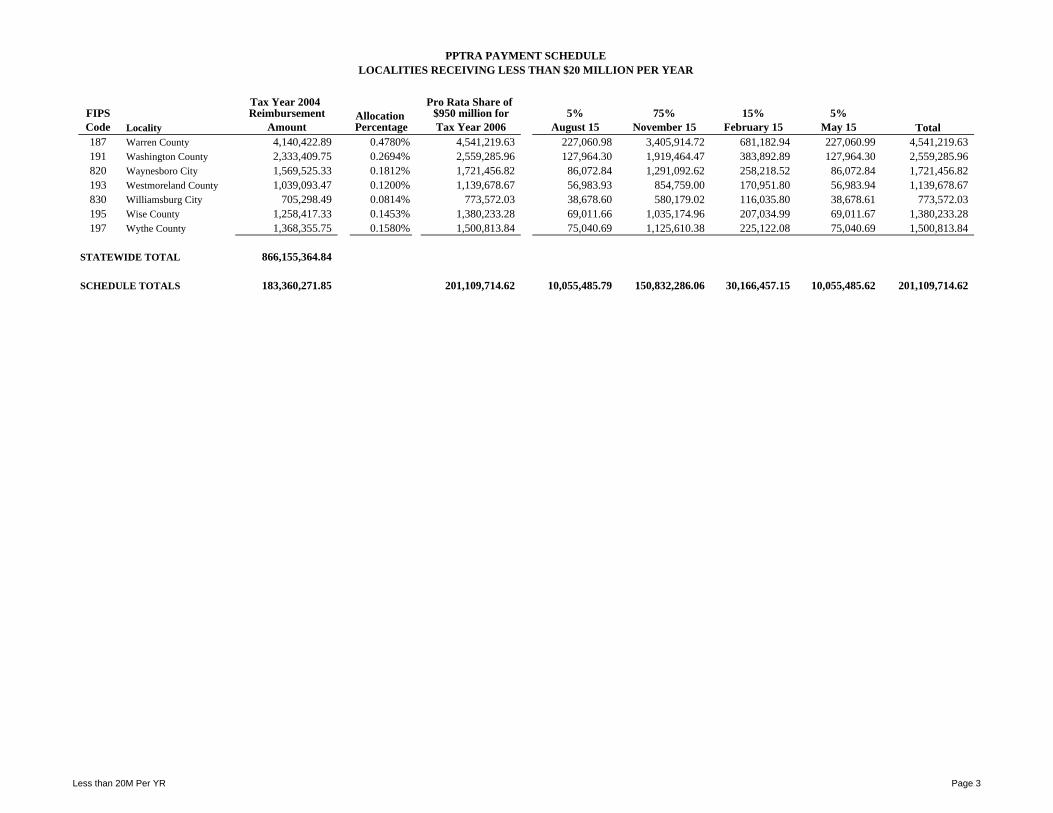
PPTRA PAYMENT SCHEDULE
LOCALITIES RECEIVING LESS THAN $20 MILLION PER YEAR
FIPS Code 187 191 820 193 830 195 197
LocalityWarren County Washington County Waynesboro City Westmoreland County Williamsburg City Wise County Wythe County
Tax Year 2004 Reimbursement
Amount 4,140,422.89 2,333,409.75 1,569,525.33 1,039,093.47
705,298.49 1,258,417.33 1,368,355.75
Allocation Percentage
0.4780% 0.2694% 0.1812% 0.1200% 0.0814% 0.1453% 0.1580%
Pro Rata Share of $950 million for Tax Year 2006
4,541,219.63 2,559,285.96 1,721,456.82 1,139,678.67
773,572.03 1,380,233.28 1,500,813.84
5% August 15
227,060.98 127,964.30
86,072.84 56,983.93 38,678.60 69,011.66 75,040.69
75% November 15
3,405,914.72 1,919,464.47 1,291,092.62
854,759.00 580,179.02
1,035,174.96 1,125,610.38
15% February 15
681,182.94 383,892.89 258,218.52 170,951.80 116,035.80 207,034.99 225,122.08
5% May 15 227,060.99 127,964.30
86,072.84 56,983.94 38,678.61 69,011.67 75,040.69
Total 4,541,219.63 2,559,285.96 1,721,456.82 1,139,678.67
773,572.03 1,380,233.28 1,500,813.84
STATEWIDE TOTAL 866,155,364.84
SCHEDULE TOTALS 183,360,271.85 201,109,714.62 10,055,485.79 150,832,286.06 30,166,457.15 10,055,485.62 201,109,714.62
Less than 20M Per YR Page 3
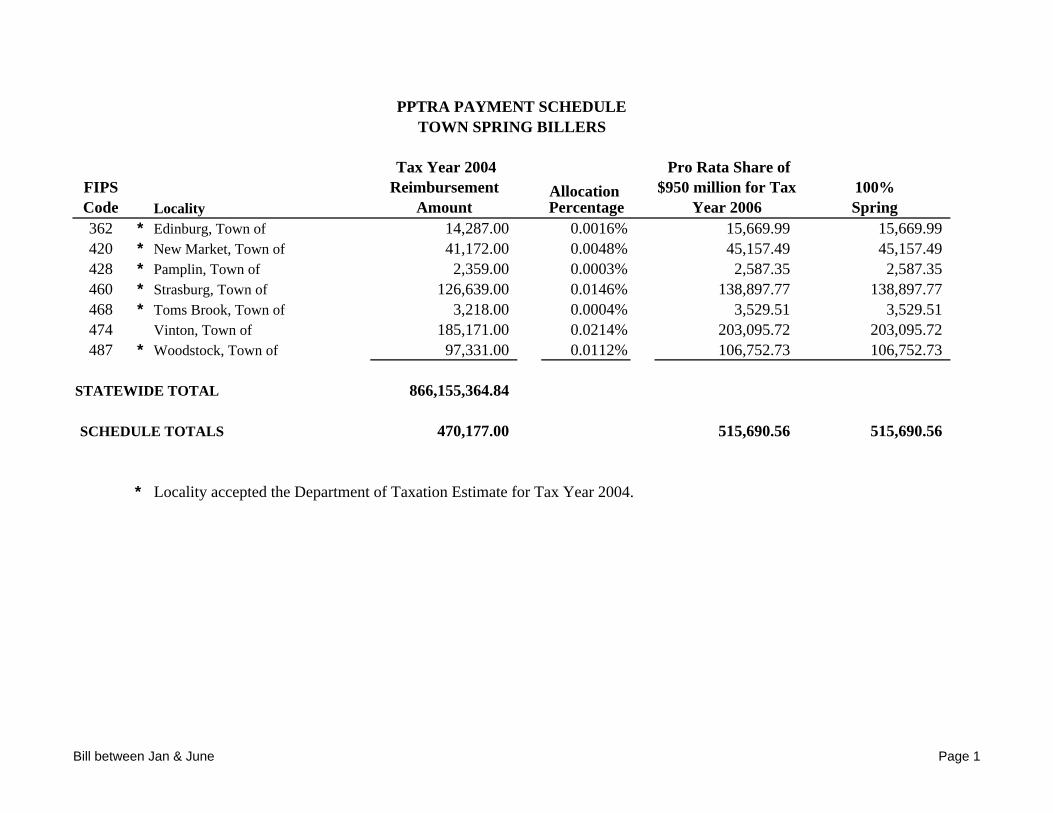
PPTRA PAYMENT SCHEDULE
TOWN SPRING BILLERS
Tax Year 2004 Pro Rata Share of
FIPS Reimbursement Allocation $950 million for Tax 100%
Code Locality Amount Percentage Year 2006 Spring
362 * Edinburg, Town of 14,287.00 0.0016% 15,669.99 15,669.99 420 * New Market, Town of 41,172.00 0.0048% 45,157.49 45,157.49 428 * Pamplin, Town of 2,359.00 0.0003% 2,587.35 2,587.35 460 * Strasburg, Town of 126,639.00 0.0146% 138,897.77 138,897.77 468 * Toms Brook, Town of 3,218.00 0.0004% 3,529.51 3,529.51 474 Vinton, Town of 185,171.00 0.0214% 203,095.72 203,095.72 487 * Woodstock, Town of 97,331.00 0.0112% 106,752.73 106,752.73
STATEWIDE TOTAL 866,155,364.84
SCHEDULE TOTALS 470,177.00 515,690.56 515,690.56
* Locality accepted the Department of Taxation Estimate for Tax Year 2004.
Bill between Jan & June Page 1
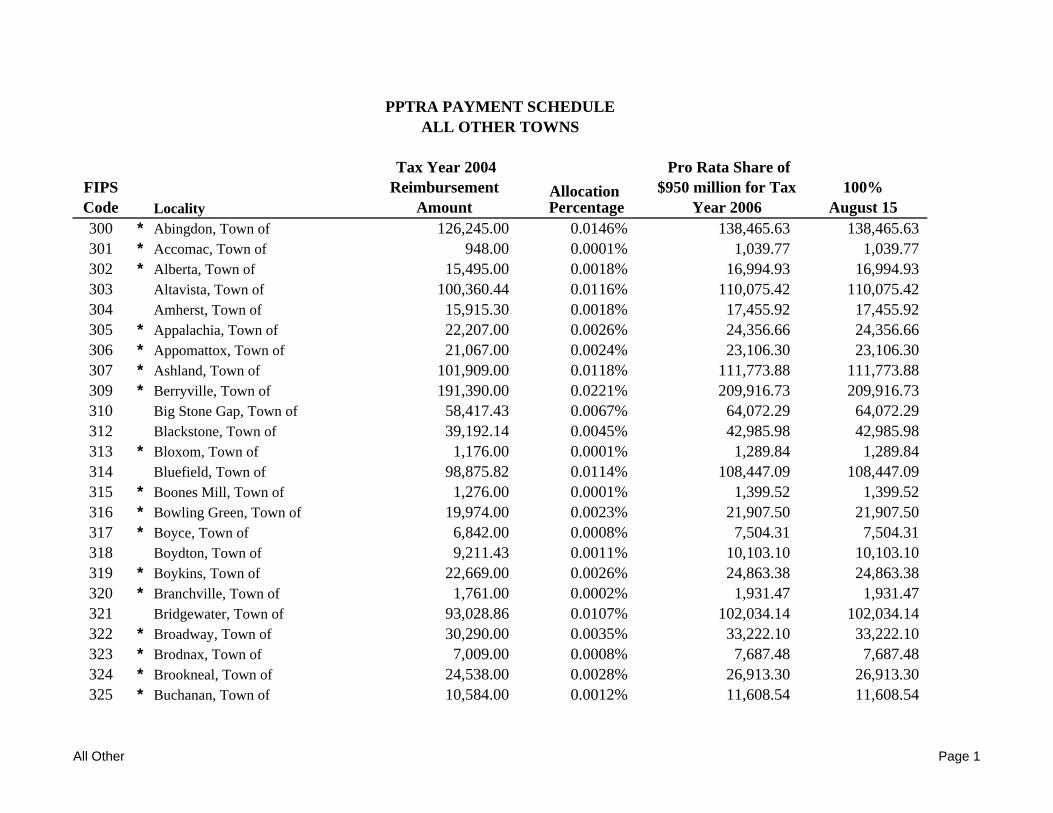
PPTRA PAYMENT SCHEDULE
ALL OTHER TOWNS
Tax Year 2004 Pro Rata Share of FIPS Reimbursement Allocation $950 million for Tax 100% Code Locality Amount Percentage Year 2006 August 15 300 * Abingdon, Town of 126,245.00 0.0146% 138,465.63 138,465.63 301 * Accomac, Town of 948.00 0.0001% 1,039.77 1,039.77 302 * Alberta, Town of 15,495.00 0.0018% 16,994.93 16,994.93 303 Altavista, Town of 100,360.44 0.0116% 110,075.42 110,075.42 304 Amherst, Town of 15,915.30 0.0018% 17,455.92 17,455.92 305 * Appalachia, Town of 22,207.00 0.0026% 24,356.66 24,356.66 306 * Appomattox, Town of 21,067.00 0.0024% 23,106.30 23,106.30 307 * Ashland, Town of 101,909.00 0.0118% 111,773.88 111,773.88 309 * Berryville, Town of 191,390.00 0.0221% 209,916.73 209,916.73 310 Big Stone Gap, Town of 58,417.43 0.0067% 64,072.29 64,072.29 312 Blackstone, Town of 39,192.14 0.0045% 42,985.98 42,985.98 313 * Bloxom, Town of 1,176.00 0.0001% 1,289.84 1,289.84 314 Bluefield, Town of 98,875.82 0.0114% 108,447.09 108,447.09 315 * Boones Mill, Town of 1,276.00 0.0001% 1,399.52 1,399.52 316 * Bowling Green, Town of 19,974.00 0.0023% 21,907.50 21,907.50 317 * Boyce, Town of 6,842.00 0.0008% 7,504.31 7,504.31 318 Boydton, Town of 9,211.43 0.0011% 10,103.10 10,103.10 319 * Boykins, Town of 22,669.00 0.0026% 24,863.38 24,863.38 320 * Branchville, Town of 1,761.00 0.0002% 1,931.47 1,931.47 321 Bridgewater, Town of 93,028.86 0.0107% 102,034.14 102,034.14 322 * Broadway, Town of 30,290.00 0.0035% 33,222.10 33,222.10 323 * Brodnax, Town of 7,009.00 0.0008% 7,687.48 7,687.48 324 * Brookneal, Town of 24,538.00 0.0028% 26,913.30 26,913.30 325 * Buchanan, Town of 10,584.00 0.0012% 11,608.54 11,608.54
All Other Page 1

PPTRA PAYMENT SCHEDULE
ALL OTHER TOWNS
Tax Year 2004 Pro Rata Share of FIPS Reimbursement Allocation $950 million for Tax 100% Code Locality Amount Percentage Year 2006 August 15 326 * Burkeville, Town of 8,903.00 0.0010% 9,764.82 9,764.82 327 Cape Charles, Town of 32,297.20 0.0037% 35,423.60 35,423.60 328 * Capron, Town of 5,567.00 0.0006% 6,105.89 6,105.89 329 * Cedar Bluff, Town of 8,409.00 0.0010% 9,223.00 9,223.00 330 * Charlotte Court House, Town of 5,476.00 0.0006% 6,006.08 6,006.08 331 * Chase City, Town of 60,083.00 0.0069% 65,899.09 65,899.09 332 * Chatham, Town of 37,587.00 0.0043% 41,225.46 41,225.46 334 * Chilhowie, Town of 9,035.00 0.0010% 9,909.60 9,909.60 335 * Chincoteague, Town of 117,839.00 0.0136% 129,245.92 129,245.92 336 Christiansburg, Town of 208,381.34 0.0241% 228,552.85 228,552.85 337 * Claremont, Town of 7,613.00 0.0009% 8,349.95 8,349.95 338 * Clarksville, Town of 49,559.00 0.0057% 54,356.36 54,356.36 339 * Cleveland, Town of 1,449.00 0.0002% 1,589.26 1,589.26 493 Clifton Forge, Town of 288,697.50 0.0333% 316,643.68 316,643.68 344 * Coeburn, Town of 16,235.00 0.0019% 17,806.56 17,806.56 345 * Colonial Beach, Town of 219,107.00 0.0253% 240,316.76 240,316.76 347 * Courtland, Town of 33,656.00 0.0039% 36,913.93 36,913.93 349 * Crewe, Town of 48,746.00 0.0056% 53,464.66 53,464.66 350 * Culpeper, Town of 204,325.00 0.0236% 224,103.85 224,103.85 351 * Damascus, Town of 4,279.00 0.0005% 4,693.21 4,693.21 354 * Dillwyn, Town of 1,921.00 0.0002% 2,106.95 2,106.95 355 * Drakes Branch, Town of 5,206.00 0.0006% 5,709.95 5,709.95 357 * Dublin, Town of 23,479.00 0.0027% 25,751.79 25,751.79 361 * Eastville, Town of 898.00 0.0001% 984.93 984.93
All Other Page 2
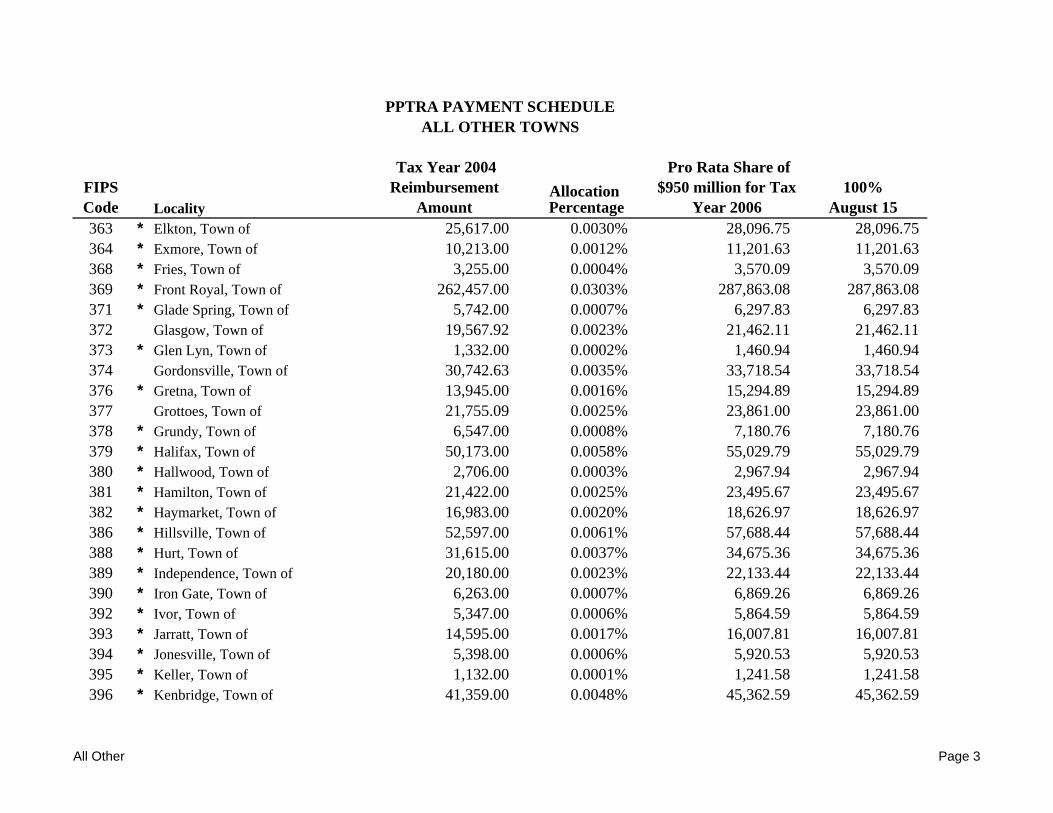
PPTRA PAYMENT SCHEDULE
ALL OTHER TOWNS
Tax Year 2004 Pro Rata Share of FIPS Reimbursement Allocation $950 million for Tax 100% Code Locality Amount Percentage Year 2006 August 15 363 * Elkton, Town of 25,617.00 0.0030% 28,096.75 28,096.75 364 * Exmore, Town of 10,213.00 0.0012% 11,201.63 11,201.63 368 * Fries, Town of 3,255.00 0.0004% 3,570.09 3,570.09 369 * Front Royal, Town of 262,457.00 0.0303% 287,863.08 287,863.08 371 * Glade Spring, Town of 5,742.00 0.0007% 6,297.83 6,297.83 372 Glasgow, Town of 19,567.92 0.0023% 21,462.11 21,462.11 373 * Glen Lyn, Town of 1,332.00 0.0002% 1,460.94 1,460.94 374 Gordonsville, Town of 30,742.63 0.0035% 33,718.54 33,718.54 376 * Gretna, Town of 13,945.00 0.0016% 15,294.89 15,294.89 377 Grottoes, Town of 21,755.09 0.0025% 23,861.00 23,861.00 378 * Grundy, Town of 6,547.00 0.0008% 7,180.76 7,180.76 379 * Halifax, Town of 50,173.00 0.0058% 55,029.79 55,029.79 380 * Hallwood, Town of 2,706.00 0.0003% 2,967.94 2,967.94 381 * Hamilton, Town of 21,422.00 0.0025% 23,495.67 23,495.67 382 * Haymarket, Town of 16,983.00 0.0020% 18,626.97 18,626.97 386 * Hillsville, Town of 52,597.00 0.0061% 57,688.44 57,688.44 388 * Hurt, Town of 31,615.00 0.0037% 34,675.36 34,675.36 389 * Independence, Town of 20,180.00 0.0023% 22,133.44 22,133.44 390 * Iron Gate, Town of 6,263.00 0.0007% 6,869.26 6,869.26 392 * Ivor, Town of 5,347.00 0.0006% 5,864.59 5,864.59 393 * Jarratt, Town of 14,595.00 0.0017% 16,007.81 16,007.81 394 * Jonesville, Town of 5,398.00 0.0006% 5,920.53 5,920.53 395 * Keller, Town of 1,132.00 0.0001% 1,241.58 1,241.58 396 * Kenbridge, Town of 41,359.00 0.0048% 45,362.59 45,362.59
All Other Page 3
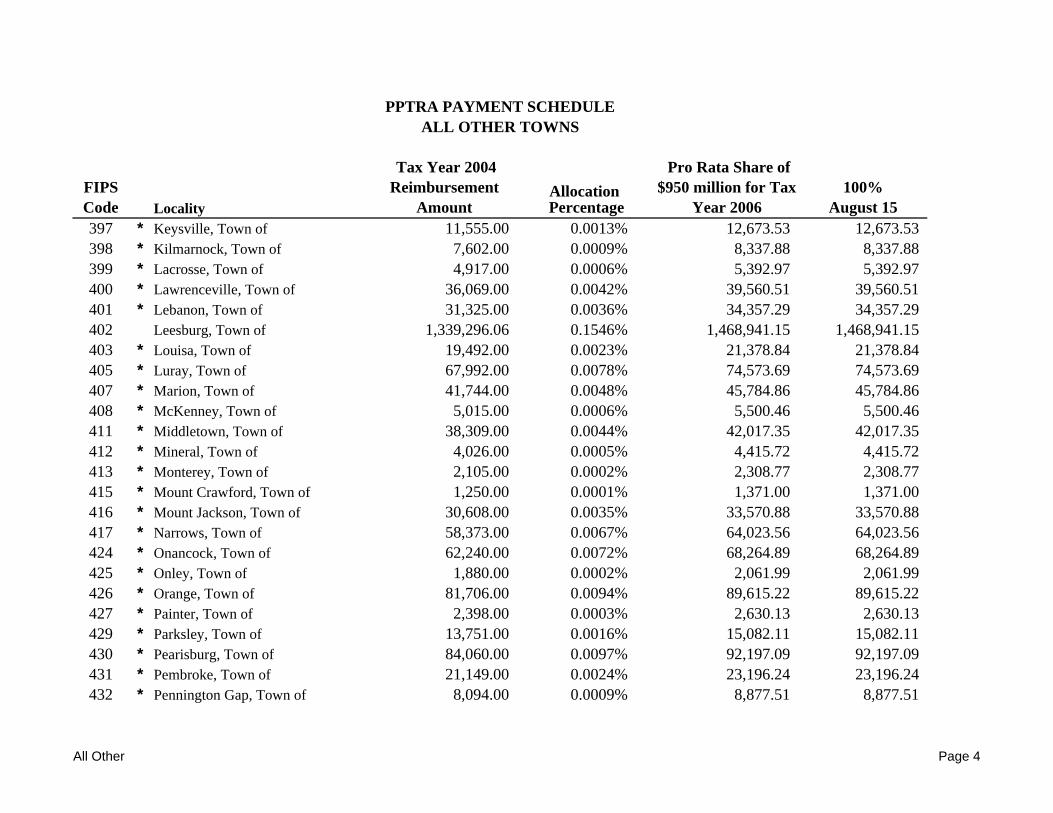
PPTRA PAYMENT SCHEDULE
ALL OTHER TOWNS
Tax Year 2004 Pro Rata Share of FIPS Reimbursement Allocation $950 million for Tax 100% Code Locality Amount Percentage Year 2006 August 15 397 * Keysville, Town of 11,555.00 0.0013% 12,673.53 12,673.53 398 * Kilmarnock, Town of 7,602.00 0.0009% 8,337.88 8,337.88 399 * Lacrosse, Town of 4,917.00 0.0006% 5,392.97 5,392.97 400 * Lawrenceville, Town of 36,069.00 0.0042% 39,560.51 39,560.51 401 * Lebanon, Town of 31,325.00 0.0036% 34,357.29 34,357.29 402 Leesburg, Town of 1,339,296.06 0.1546% 1,468,941.15 1,468,941.15 403 * Louisa, Town of 19,492.00 0.0023% 21,378.84 21,378.84 405 * Luray, Town of 67,992.00 0.0078% 74,573.69 74,573.69 407 * Marion, Town of 41,744.00 0.0048% 45,784.86 45,784.86 408 * McKenney, Town of 5,015.00 0.0006% 5,500.46 5,500.46 411 * Middletown, Town of 38,309.00 0.0044% 42,017.35 42,017.35 412 * Mineral, Town of 4,026.00 0.0005% 4,415.72 4,415.72 413 * Monterey, Town of 2,105.00 0.0002% 2,308.77 2,308.77 415 * Mount Crawford, Town of 1,250.00 0.0001% 1,371.00 1,371.00 416 * Mount Jackson, Town of 30,608.00 0.0035% 33,570.88 33,570.88 417 * Narrows, Town of 58,373.00 0.0067% 64,023.56 64,023.56 424 * Onancock, Town of 62,240.00 0.0072% 68,264.89 68,264.89 425 * Onley, Town of 1,880.00 0.0002% 2,061.99 2,061.99 426 * Orange, Town of 81,706.00 0.0094% 89,615.22 89,615.22 427 * Painter, Town of 2,398.00 0.0003% 2,630.13 2,630.13 429 * Parksley, Town of 13,751.00 0.0016% 15,082.11 15,082.11 430 * Pearisburg, Town of 84,060.00 0.0097% 92,197.09 92,197.09 431 * Pembroke, Town of 21,149.00 0.0024% 23,196.24 23,196.24 432 * Pennington Gap, Town of 8,094.00 0.0009% 8,877.51 8,877.51
All Other Page 4
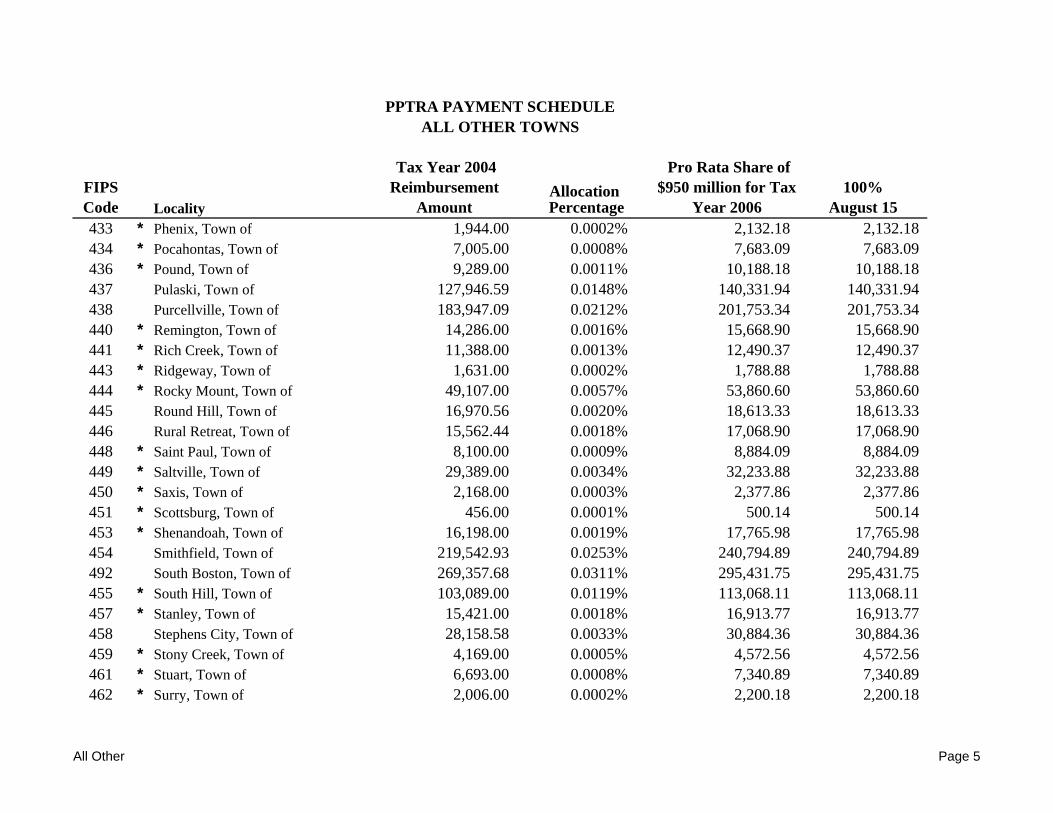
PPTRA PAYMENT SCHEDULE
ALL OTHER TOWNS
Tax Year 2004 Pro Rata Share of FIPS Reimbursement Allocation $950 million for Tax 100% Code Locality Amount Percentage Year 2006 August 15 433 * Phenix, Town of 1,944.00 0.0002% 2,132.18 2,132.18 434 * Pocahontas, Town of 7,005.00 0.0008% 7,683.09 7,683.09 436 * Pound, Town of 9,289.00 0.0011% 10,188.18 10,188.18 437 Pulaski, Town of 127,946.59 0.0148% 140,331.94 140,331.94 438 Purcellville, Town of 183,947.09 0.0212% 201,753.34 201,753.34 440 * Remington, Town of 14,286.00 0.0016% 15,668.90 15,668.90 441 * Rich Creek, Town of 11,388.00 0.0013% 12,490.37 12,490.37 443 * Ridgeway, Town of 1,631.00 0.0002% 1,788.88 1,788.88 444 * Rocky Mount, Town of 49,107.00 0.0057% 53,860.60 53,860.60 445 Round Hill, Town of 16,970.56 0.0020% 18,613.33 18,613.33 446 Rural Retreat, Town of 15,562.44 0.0018% 17,068.90 17,068.90 448 * Saint Paul, Town of 8,100.00 0.0009% 8,884.09 8,884.09 449 * Saltville, Town of 29,389.00 0.0034% 32,233.88 32,233.88 450 * Saxis, Town of 2,168.00 0.0003% 2,377.86 2,377.86 451 * Scottsburg, Town of 456.00 0.0001% 500.14 500.14 453 * Shenandoah, Town of 16,198.00 0.0019% 17,765.98 17,765.98 454 Smithfield, Town of 219,542.93 0.0253% 240,794.89 240,794.89 492 South Boston, Town of 269,357.68 0.0311% 295,431.75 295,431.75 455 * South Hill, Town of 103,089.00 0.0119% 113,068.11 113,068.11 457 * Stanley, Town of 15,421.00 0.0018% 16,913.77 16,913.77 458 Stephens City, Town of 28,158.58 0.0033% 30,884.36 30,884.36 459 * Stony Creek, Town of 4,169.00 0.0005% 4,572.56 4,572.56 461 * Stuart, Town of 6,693.00 0.0008% 7,340.89 7,340.89 462 * Surry, Town of 2,006.00 0.0002% 2,200.18 2,200.18
All Other Page 5
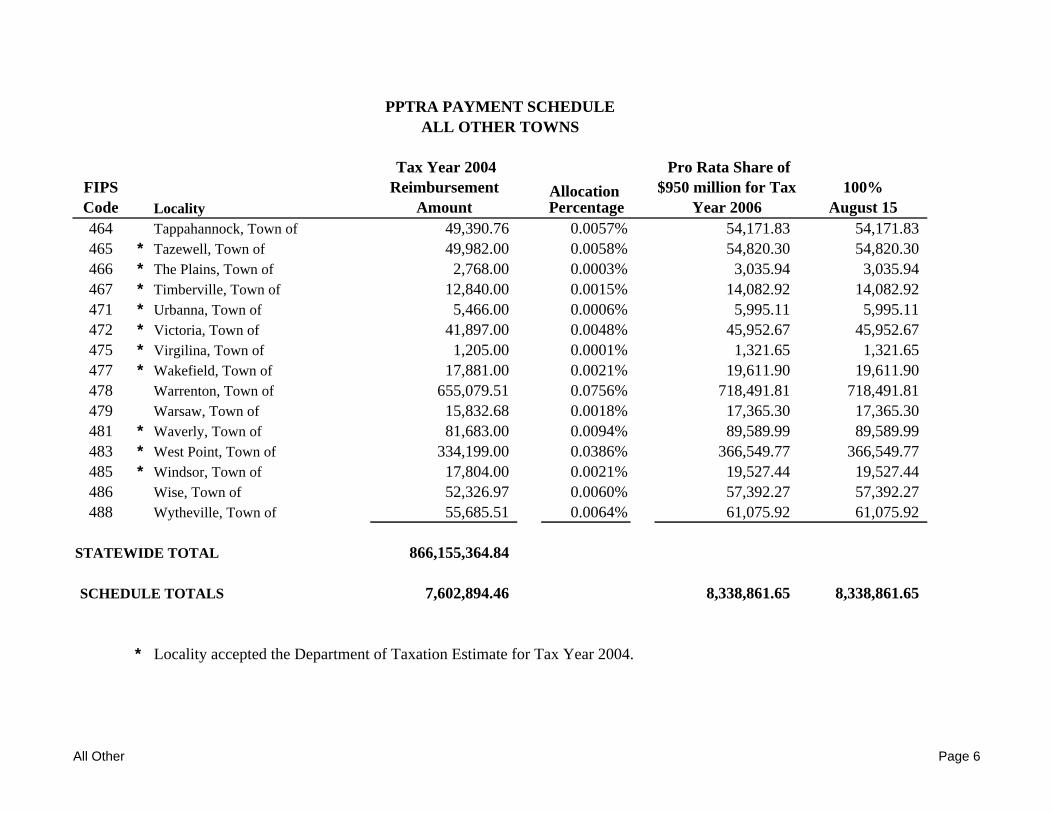
PPTRA PAYMENT SCHEDULE
ALL OTHER TOWNS
Tax Year 2004 Pro Rata Share of FIPS Reimbursement Allocation $950 million for Tax 100% Code Locality Amount Percentage Year 2006 August 15 464 Tappahannock, Town of 49,390.76 0.0057% 54,171.83 54,171.83
465 * Tazewell, Town of 49,982.00 0.0058% 54,820.30 54,820.30
466 * The Plains, Town of 2,768.00 0.0003% 3,035.94 3,035.94
467 * Timberville, Town of 12,840.00 0.0015% 14,082.92 14,082.92
471 * Urbanna, Town of 5,466.00 0.0006% 5,995.11 5,995.11
472 * Victoria, Town of 41,897.00 0.0048% 45,952.67 45,952.67
475 * Virgilina, Town of 1,205.00 0.0001% 1,321.65 1,321.65
477 * Wakefield, Town of 17,881.00 0.0021% 19,611.90 19,611.90
478 Warrenton, Town of 655,079.51 0.0756% 718,491.81 718,491.81
479 Warsaw, Town of 15,832.68 0.0018% 17,365.30 17,365.30
481 * Waverly, Town of 81,683.00 0.0094% 89,589.99 89,589.99
483 * West Point, Town of 334,199.00 0.0386% 366,549.77 366,549.77
485 * Windsor, Town of 17,804.00 0.0021% 19,527.44 19,527.44
486 Wise, Town of 52,326.97 0.0060% 57,392.27 57,392.27
488 Wytheville, Town of 55,685.51 0.0064% 61,075.92 61,075.92
STATEWIDE TOTAL 866,155,364.84
SCHEDULE TOTALS 7,602,894.46 8,338,861.65 8,338,861.65
* Locality accepted the Department of Taxation Estimate for Tax Year 2004.
All Other Page 6