ppt physics p3(2013).docx
TRANSCRIPT
7/27/2019 PPT PHYSICS P3(2013).docx
http://slidepdf.com/reader/full/ppt-physics-p32013docx 1/16
4531/3
Physics
Paper 3
MEI 20__
1 ½ hours
SEKOLAH MENENGAH KEBANGSAAN
MID YEAR EXAM 2013
PHYSICS-PAPER 3
FORM 41 HOUR 30 MINUTES
DO NOT OPEN THIS QUESTION BOOKLET UNTIL BEING TOLD TO DO SO
PREPARED BY, CHECKED BY, CERTIFIED BY,
------------------------------------- --------------------------------- ----------------------------
( ) ( ) ( )
NAME:……………………………………………………………… CLASS:………………………
1. Kertas soalan ini mengandungi dua bahagian : Bahagian A danBahagian B .
2. Jawab semua soalan dalam Bahagian A.Tuliskan jawapan bagi
Bahagian A dalam ruang yang disediakan dalam kertas soalan.
3. Jawab satu soalan daripada Bahagian B .Tuliskan jawapan
Bahagian B pada ruangan yang disediakan.. Jawab Bahagian B
dengan lebih terperinci.Jawapan mestilah jelas dan logik.
4. Tunjukkan kerja mengira, ini membantu anda mendapat markah.
5 Gambarajah yang mengiringi soalan tidak dilukis mengikut skala
kecuali dinyatakan.
6. Markah yang diperuntukkan bagi setiap soalan atau ceraian soalan
ditunjukkan dalam kurungan.
7 Anda dibenarkan menggunakan kalkulator saintifik yang tidak bolehdi programkan.
8 Masa yang dicadangkan untuk menjawab Bahagian A
ialah 60 minit dan Bahagian B ialah 30 minit.
9 Serahkan semua kertas jawapan anda di akhir
peperiksaan.

7/27/2019 PPT PHYSICS P3(2013).docx
http://slidepdf.com/reader/full/ppt-physics-p32013docx 2/16
CONFIDENTIAL 4531/3
2
Section A
Bahagian A
[28 marks]
Answer all questions in this section. Jawab semua soalan dalam bahagian ini.
1. A student carries out an experiment to investigate the relationship between the length, l , of a simple
pendulum and the period of oscillation, T .The apparatus set-up for this experiment is shown in Diagram
1.1. / Seorang pelajar menjalankan satu eksperimen untuk mengkaji hubungan antara panjang, l, satu bandul
ringkas dan tempoh ayunan, T. Radas set-up bagi eksperimen ini ditunjukkan dalam Rajah 1.1.
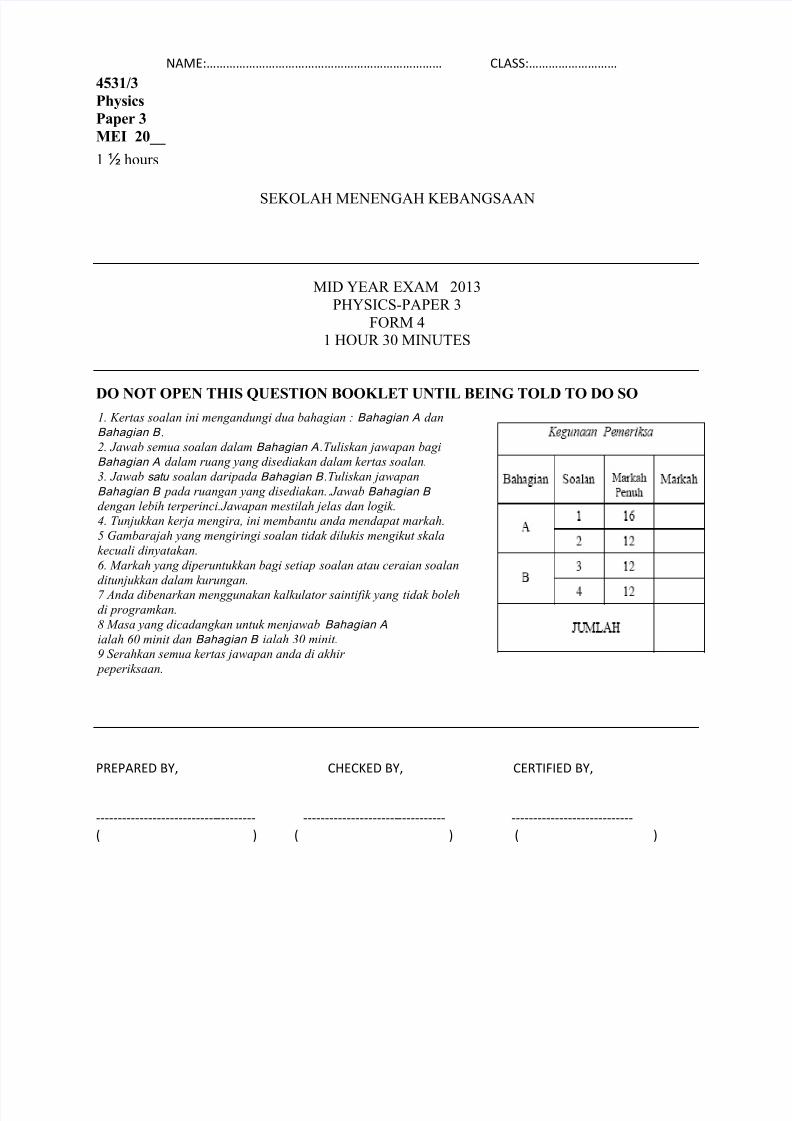
The student starts the experiment with a pendulum length of 300cm.The pendulum bob is displaced and
then released so that it oscillates. The time taken, t, for 10 complete oscillations is recorded.The
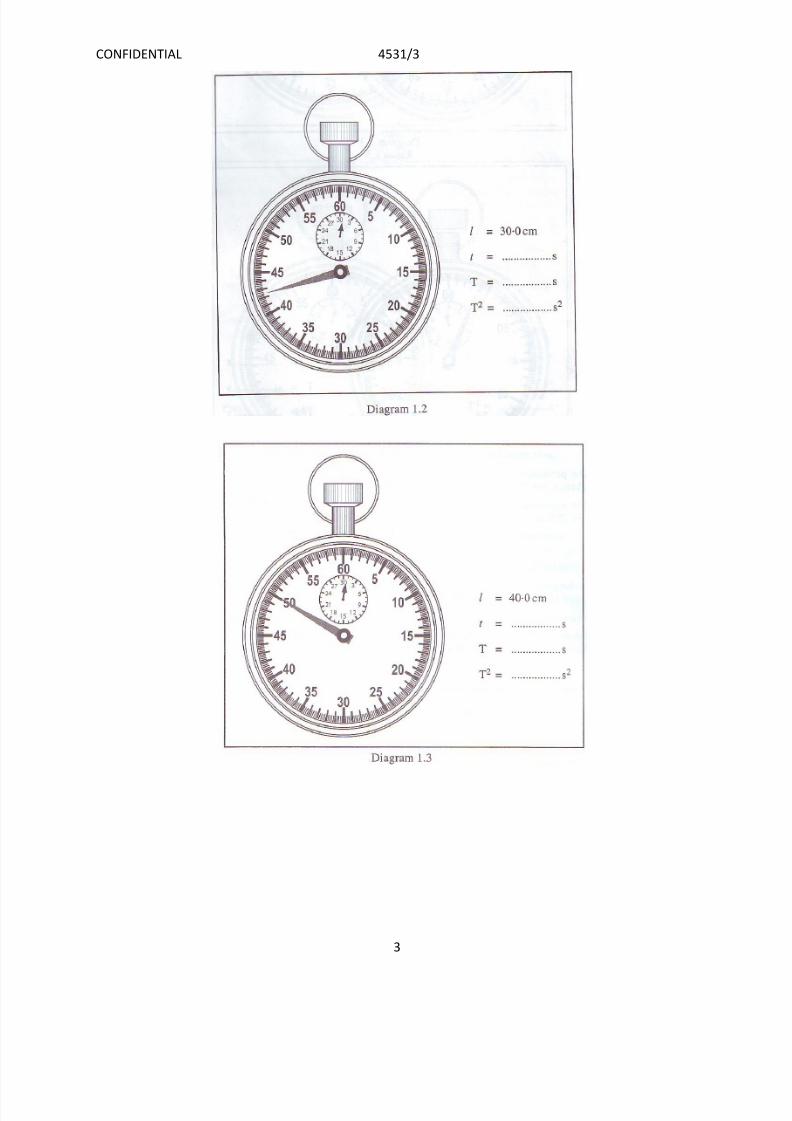
experiment is repeated with pendulum lengths of 40.0 cm, 50.0 cm, 60.0cm and 70.0 cm.The
corresponding stopwatch readings for 10 complete oscillations are shown in Diagrams 1.2, 1.3, 1.4, 1.5
and 1.6 on pages 3, 4 and 5.
Bebola pendulum disesarkan dan kemudian dikeluarkan supaya ia berputar. Masa yang diambil, t, 10 putaran yang
lengkap akan direkodkan. Percubaan diulang dengan tekanan 40.0 cm, 50.0 cm, 60.0cm dan 70.0 cm. Bacaan jam
randik yang sepadan bagi 10 putaran yang lengkap adalah seperti yang ditunjukkan dalam Rajah 1.2, 1.3, 1.4, 1.5
dan 1.6 pada halaman 3, 4 dan 5.
7/27/2019 PPT PHYSICS P3(2013).docx
http://slidepdf.com/reader/full/ppt-physics-p32013docx 3/16
CONFIDENTIAL 4531/3
3
7/27/2019 PPT PHYSICS P3(2013).docx
http://slidepdf.com/reader/full/ppt-physics-p32013docx 4/16
CONFIDENTIAL 4531/3
4
7/27/2019 PPT PHYSICS P3(2013).docx
http://slidepdf.com/reader/full/ppt-physics-p32013docx 5/16
CONFIDENTIAL 4531/3
5
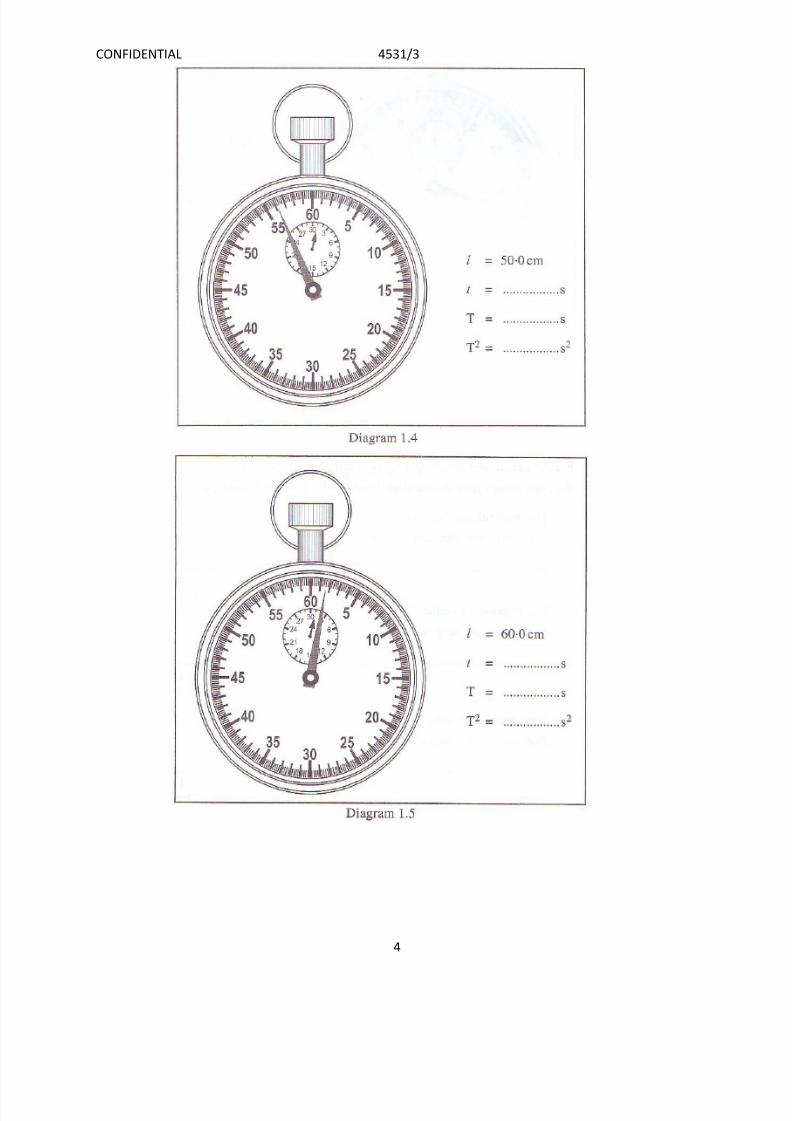
(a) For the experiment described on pages 2, 3, 4 and 5, identify: / Untuk eksperimen pada muka surat
2,3,4,5,kenalpasti:
(i) The manipulated variable/ Pemboleh ubah dimanipulasikan :
....................................................................................................................... [1 mark]
(ii) The responding variable/ Pemboleh ubah bergerakbalas :
.......................................................................................................................... [1 mark]
(ii) The constant variable / Pemboleh ubah dimalarkan :
........................................................................................................................ [1 mark]
(b) For this part of the question, write your answers in the spaces provided in the corresponding
diagrams. Your answers must be correct to two decimal places. / Pada bahagian soalan ini, tulis jawapan anda dalam ruang yang disediakan di dalam Rajah yang sama. Jawapan anda mestilah betul
kepada dua tempat perpuluhan.
Based on Diagrams 1.2, 1.3, 1.4, 1.5 and 1.6 on pages 3, 4 and 5: / Berdasarkan rajah 1.2, 1.3, 1.4,
1.5 dan 1.6 pada muka surat 3, 4 dan 5 :
(i) Record the readings, t, of the stopwatch. / Bacaan pada jam randek di rekodkan. [2 marks]

7/27/2019 PPT PHYSICS P3(2013).docx
http://slidepdf.com/reader/full/ppt-physics-p32013docx 6/16
CONFIDENTIAL 4531/3
6
(ii) For each value of tin 1(b)(i), calculate the period of oscillation, T, of the pendulum
using the following equation:/ Bagi setiap nilai timah (ii), mengira tempoh oscillation, T, daripada
tekanan yang menggunakan persamaan berikut:
10
t T
Record the value of T./ Nilai T di rekodkan. [1 mark]
(iii) Calculate T² for each value of T in 1(b)(ii). Record the value of T² .
[2 marks]
(c) Tabulate your results in a table for all values of l , T and T² in the space below.
[2 marks]
(d) On the graph paper given, plot a graph of T² against l .
[5 marks]
(e) Based on your graph in 1(d), state the relationship between T² and l .
............................................................................................................................................ [1 mark]
7/27/2019 PPT PHYSICS P3(2013).docx
http://slidepdf.com/reader/full/ppt-physics-p32013docx 7/16
CONFIDENTIAL 4531/3
7
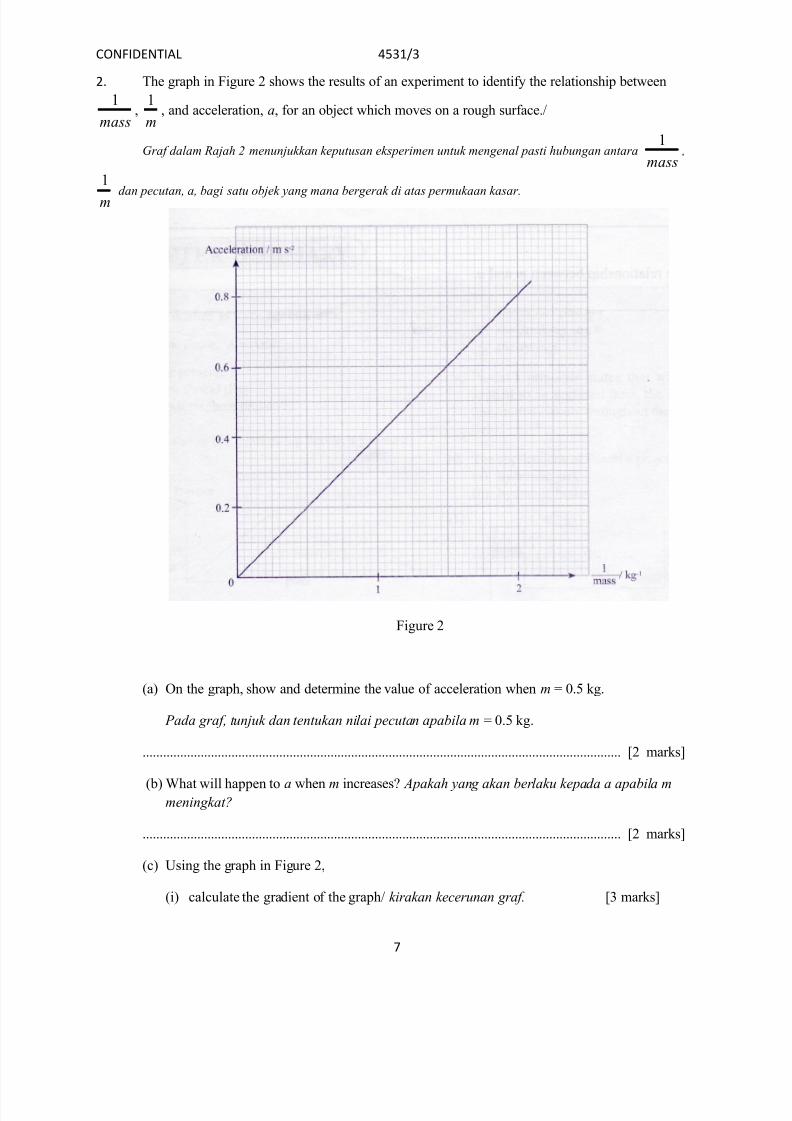
2. The graph in Figure 2 shows the results of an experiment to identify the relationship between
mass
1,m
1, and acceleration, a, for an object which moves on a rough surface./
Graf dalam Rajah 2 menunjukkan keputusan eksperimen untuk mengenal pasti hubungan antaramass
1 ,
m
1
dan pecutan, a, bagi satu objek yang mana bergerak di atas permukaan kasar.
Figure 2
(a) On the graph, show and determine the value of acceleration when m = 0.5 kg.
Pada graf, tunjuk dan tentukan nilai pecutan apabila m = 0.5 kg.
............................................................................................................................................ [2 marks]
(b) What will happen to a when m increases? Apakah yang akan berlaku kepada a apabila mmeningkat?
............................................................................................................................................ [2 marks]
(c) Using the graph in Figure 2,
(i) calculate the gradient of the graph/ kirakan kecerunan graf. [3 marks]
7/27/2019 PPT PHYSICS P3(2013).docx
http://slidepdf.com/reader/full/ppt-physics-p32013docx 8/16
CONFIDENTIAL 4531/3
8
(ii) Name the physical quantity that represents the value of the gradient in (c)(i)./ Namakan
kuantiti fizikal yang mewakili nilai kecerunan dalam (c)(i).
............................................................................................................................................ [1 mark]
(iii) Determine the value of m when a = 0.5 m s-2
. Show on the graph how you determine thevalue. / Tentukan nilai m apabila a = 0.5 m s -2. Tunjukkan pada graf bagimana anda menentukan
nilai itu.
............................................................................................................................................ [2 marks]
(d) Write the relationship between m and a / Tulis hubungan antara m dan a.
............................................................................................................................................ [2 marks]
Section B Bahagian B
[12 marks]Answer any one question from this section
Jawab mana-mana satu soalan daripada bahagian ini.
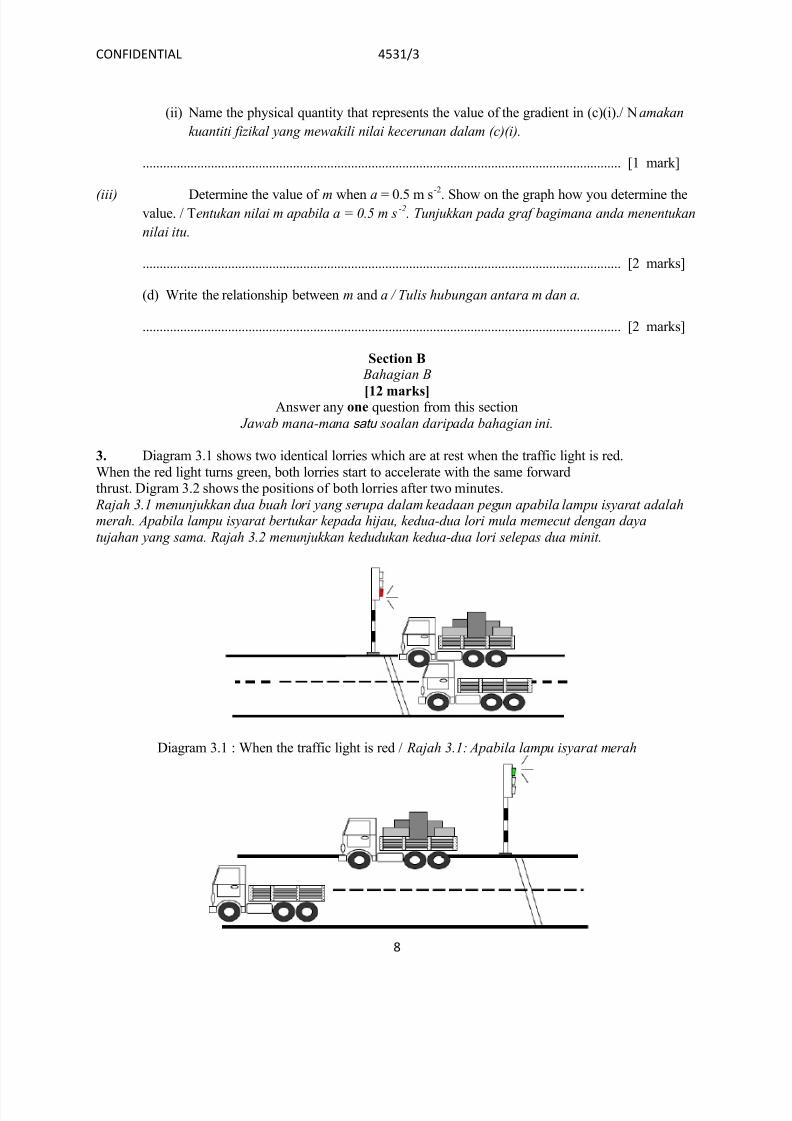
3. Diagram 3.1 shows two identical lorries which are at rest when the traffic light is red.
When the red light turns green, both lorries start to accelerate with the same forwardthrust. Digram 3.2 shows the positions of both lorries after two minutes.
Rajah 3.1 menunjukkan dua buah lori yang serupa dalam keadaan pegun apabila lampu isyarat adalahmerah. Apabila lampu isyarat bertukar kepada hijau, kedua-dua lori mula memecut dengan daya
tujahan yang sama. Rajah 3.2 menunjukkan kedudukan kedua-dua lori selepas dua minit.
Diagram 3.1 : When the traffic light is red / Rajah 3.1: Apabila lampu isyarat merah

7/27/2019 PPT PHYSICS P3(2013).docx
http://slidepdf.com/reader/full/ppt-physics-p32013docx 9/16
CONFIDENTIAL 4531/3
9
Diagram 3.2 : After 2 minutes accelerating. / Rajah 3.2: Selepas 2 minit memecut
Based on the information and observation,/ Berdasarkan maklumat dan pemerhatian tersebut,
(a) State one suitable inference.
Nyatakan satu inferens yang sesuai. [1mark]
(b) State one appropriate hypothesis that could be investigated. Nyatakan satu hipotesis yang sesuai dan boleh disiasat.
[1mark]
(c) With the use of apparatus such as a trolley, ticker timer, rubber band and other apparatus, describe one experiment framework to investigate the hypothesis statedin 3(b).
Dengan menggunakan radas seperti troli, jangkamasa detik, gelang getah dan lain-lain radas,terangkan satu rangka kerja eksperimen untuk menyiasat hipotesis yang dinyatakan di 3 (b).
In your description, state clearly the following: Dalam penerangan anda, jelaskan perkara berikut :
(i) The aim of the experiment. / Tujuan eksperimen.
(ii) The variables in the experiment. / Pembolehubah dalam eksperimen.
(iii) The list of apparatus and materials. / Senarai radas dan bahan.
(iv) The arrangement of the apparatus. / Susunan radas.
(v) The procedure of the experiment which should include one method of controlling the manipulated
variable and one method of measuring the responding variable. Prosedur eksperimen yang mesti termasuk satu kaedah mengawal pembolehubahdimanipulasikan dan satu kaedah mengukur pembolehubah bergerak balas.
(vi) The way you tabulate the data. / Cara anda menjadualkan data.
(v) The way you analyse the data. / Cara anda menganalisis data.
[10 marks]
7/27/2019 PPT PHYSICS P3(2013).docx
http://slidepdf.com/reader/full/ppt-physics-p32013docx 10/16
CONFIDENTIAL 4531/3
10
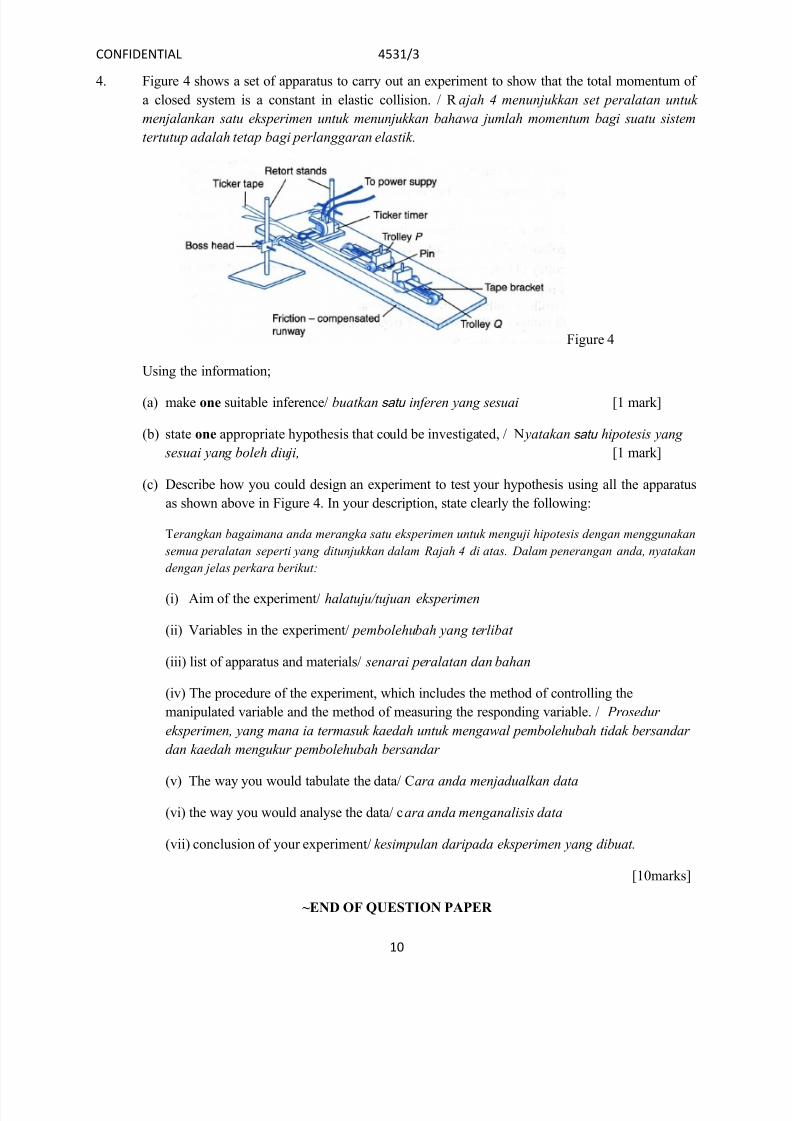
4. Figure 4 shows a set of apparatus to carry out an experiment to show that the total momentum of
a closed system is a constant in elastic collision. / R ajah 4 menunjukkan set peralatan untuk
menjalankan satu eksperimen untuk menunjukkan bahawa jumlah momentum bagi suatu sistem
tertutup adalah tetap bagi perlanggaran elastik.
Figure 4
Using the information;
(a) make one suitable inference/ buatkan satu inferen yang sesuai [1 mark]
(b) state one appropriate hypothesis that could be investigated, / N yatakan satu hipotesis yang
sesuai yang boleh diuji, [1 mark]
(c) Describe how you could design an experiment to test your hypothesis using all the apparatus
as shown above in Figure 4. In your description, state clearly the following:
Terangkan bagaimana anda merangka satu eksperimen untuk menguji hipotesis dengan menggunakan
semua peralatan seperti yang ditunjukkan dalam Rajah 4 di atas. Dalam penerangan anda, nyatakan
dengan jelas perkara berikut:
(i) Aim of the experiment/ halatuju/tujuan eksperimen
(ii) Variables in the experiment/ pembolehubah yang terlibat
(iii) list of apparatus and materials/ senarai peralatan dan bahan
(iv) The procedure of the experiment, which includes the method of controlling the
manipulated variable and the method of measuring the responding variable. / Prosedur
eksperimen, yang mana ia termasuk kaedah untuk mengawal pembolehubah tidak bersandar
dan kaedah mengukur pembolehubah bersandar
(v) The way you would tabulate the data/ Cara anda menjadualkan data
(vi) the way you would analyse the data/ cara anda menganalisis data
(vii) conclusion of your experiment/ kesimpulan daripada eksperimen yang dibuat.
[10marks]
~END OF QUESTION PAPER
7/27/2019 PPT PHYSICS P3(2013).docx
http://slidepdf.com/reader/full/ppt-physics-p32013docx 11/16
CONFIDENTIAL 4531/3
11
ANSWER SCHEME:
Paper 3
Section A
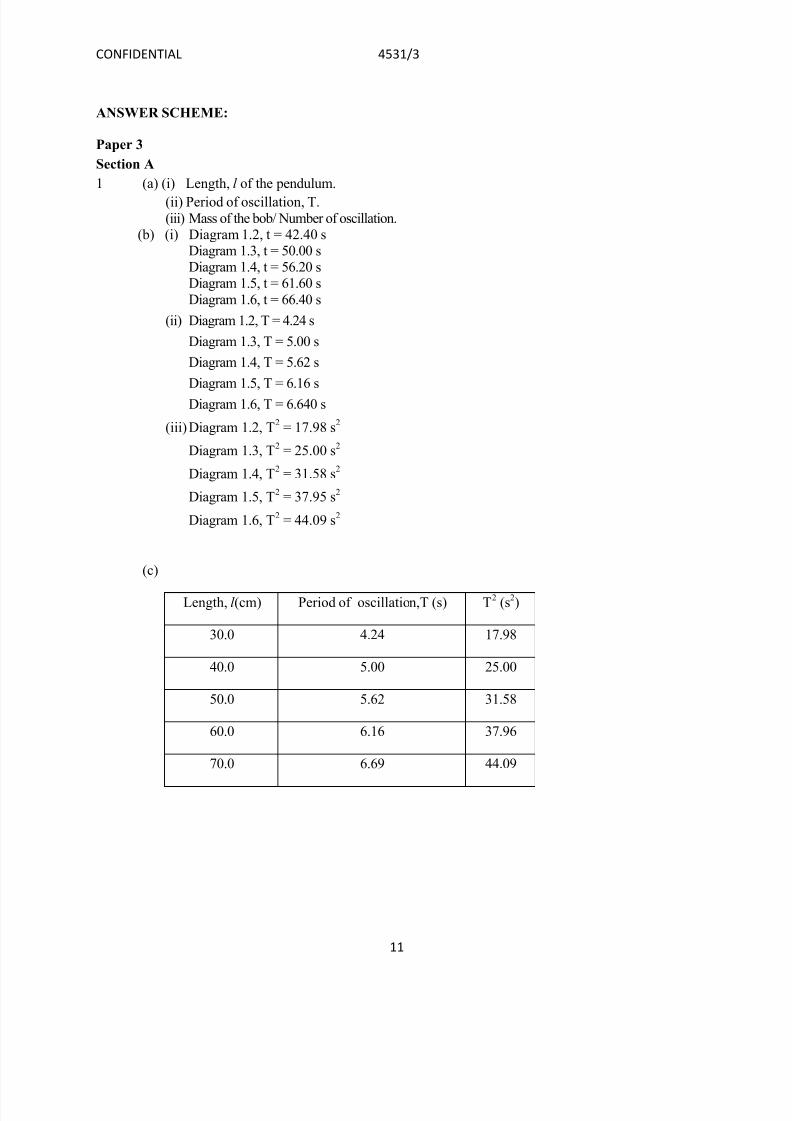
1 (a) (i) Length, l of the pendulum.
(ii) Period of oscillation, T.
(iii) Mass of the bob/ Number of oscillation.(b) (i) Diagram 1.2, t = 42.40 s
Diagram 1.3, t = 50.00 sDiagram 1.4, t = 56.20 sDiagram 1.5, t = 61.60 s
Diagram 1.6, t = 66.40 s
(ii) Diagram 1.2, T = 4.24 s
Diagram 1.3, T = 5.00 s
Diagram 1.4, T = 5.62 s
Diagram 1.5, T = 6.16 s
Diagram 1.6, T = 6.640 s
(iii) Diagram 1.2, T2
= 17.98 s2
Diagram 1.3, T2 = 25.00 s2
Diagram 1.4, T2
= 31.58 s2
Diagram 1.5, T2 = 37.95 s2
Diagram 1.6, T2 = 44.09 s2
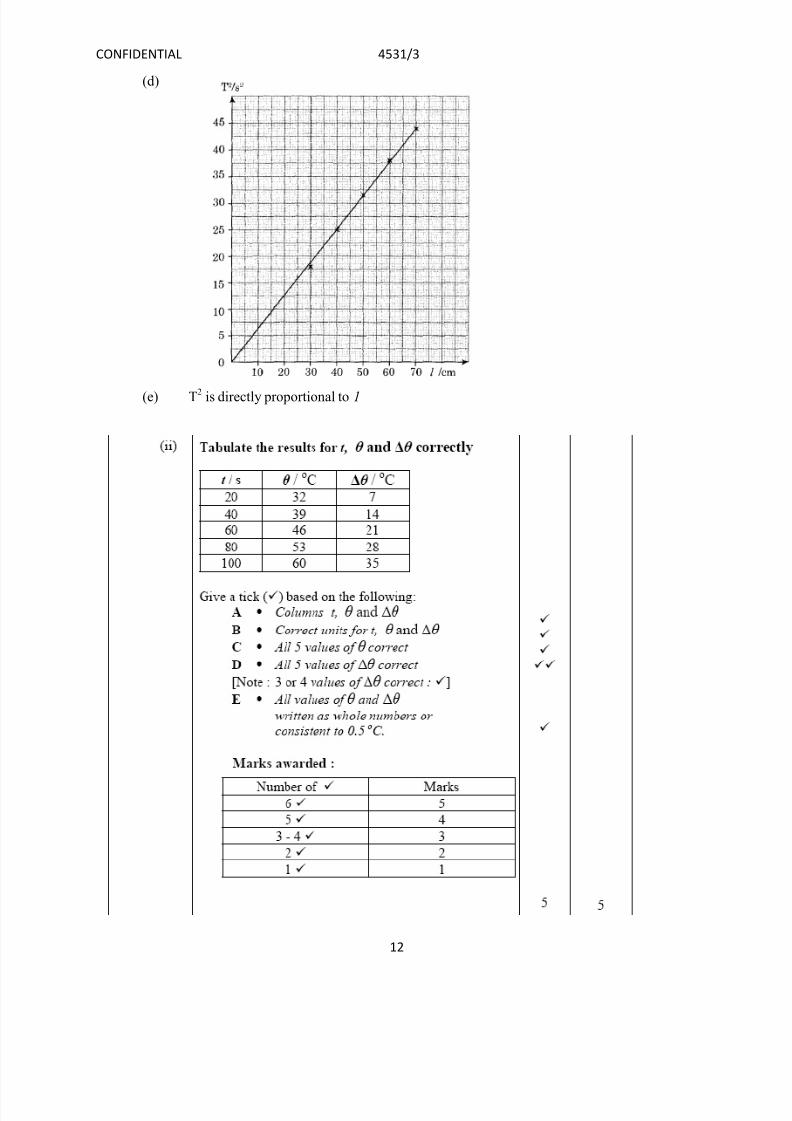
(c)
Length, l (cm) Period of oscillation,T (s) T2 (s2)
30.0 4.24 17.98
40.0 5.00 25.00
50.0 5.62 31.58
60.0 6.16 37.96
70.0 6.69 44.09
7/27/2019 PPT PHYSICS P3(2013).docx
http://slidepdf.com/reader/full/ppt-physics-p32013docx 12/16
CONFIDENTIAL 4531/3
12
(d)
(e) T2 is directly proportional to 1

7/27/2019 PPT PHYSICS P3(2013).docx
http://slidepdf.com/reader/full/ppt-physics-p32013docx 13/16

7/27/2019 PPT PHYSICS P3(2013).docx
http://slidepdf.com/reader/full/ppt-physics-p32013docx 14/16
CONFIDENTIAL 4531/3
14
(d) m is inversely proportional to a. [1 mark]
3 (a) Inference -Acceleration for the lorry to start moving is influenced by mass/
A bigger a masswill be more difficult to move
(b) Hypothesis -The bigger the mass the longer the slower the lorry start to move/ The inertia of
body increases when its mass increases.
(c)
i Aim To investigate the relationship between mass and inertia
ii Variable Manipulated: mass
Responding : period of oscillation (inertia)
Fixed: Length of hacksaw blade / number of oscillations
iii Apparatus Mass balance , srop watch , plasticine , G clamp
iv Diagram
v Procedure a. Plasticine with the mass of 50.0 g is clamped to the end of the hacksaw
blade b. The time for 10 complete oscillations is recorded. The period of
oscillation is calculatedc. Repeat the previous steps using plasticine of masses 100.0g , 150.0g,
200.0g and 250.0 g.
vi Data Mass/g Time for 10 complete of
oscillation/s
Period of oscillation/s
T= t/10
7/27/2019 PPT PHYSICS P3(2013).docx
http://slidepdf.com/reader/full/ppt-physics-p32013docx 15/16
CONFIDENTIAL 4531/3
15
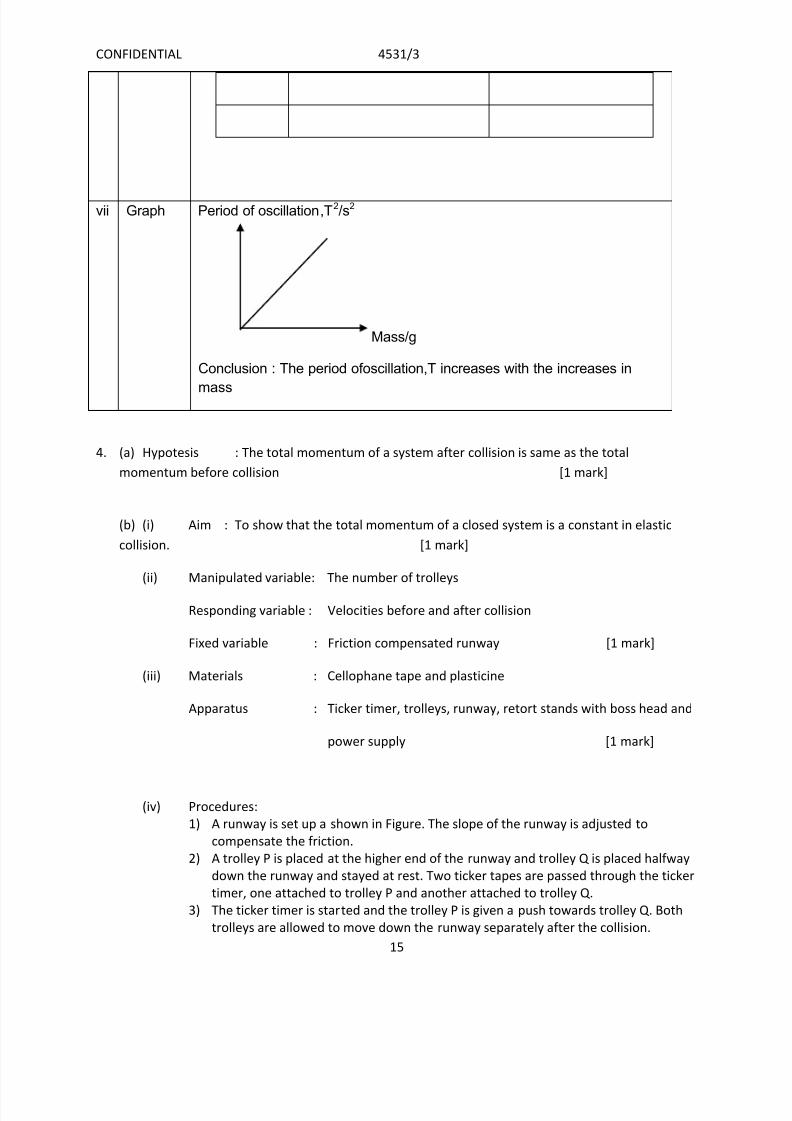
vii Graph Period of oscillation,T2/s2
Mass/g
Conclusion : The period ofoscillation,T increases with the increases in
mass
4. (a) Hypotesis : The total momentum of a system after collision is same as the total
momentum before collision [1 mark]
(b) (i) Aim : To show that the total momentum of a closed system is a constant in elastic
collision. [1 mark]
(ii) Manipulated variable: The number of trolleys
Responding variable : Velocities before and after collision
Fixed variable : Friction compensated runway [1 mark]
(iii) Materials : Cellophane tape and plasticine
Apparatus : Ticker timer, trolleys, runway, retort stands with boss head and
power supply [1 mark]
(iv) Procedures:
1) A runway is set up a shown in Figure. The slope of the runway is adjusted to
compensate the friction.
2) A trolley P is placed at the higher end of the runway and trolley Q is placed halfway
down the runway and stayed at rest. Two ticker tapes are passed through the ticker
timer, one attached to trolley P and another attached to trolley Q.
3) The ticker timer is started and the trolley P is given a push towards trolley Q. Both
trolleys are allowed to move down the runway separately after the collision.
7/27/2019 PPT PHYSICS P3(2013).docx
http://slidepdf.com/reader/full/ppt-physics-p32013docx 16/16
CONFIDENTIAL 4531/3
16
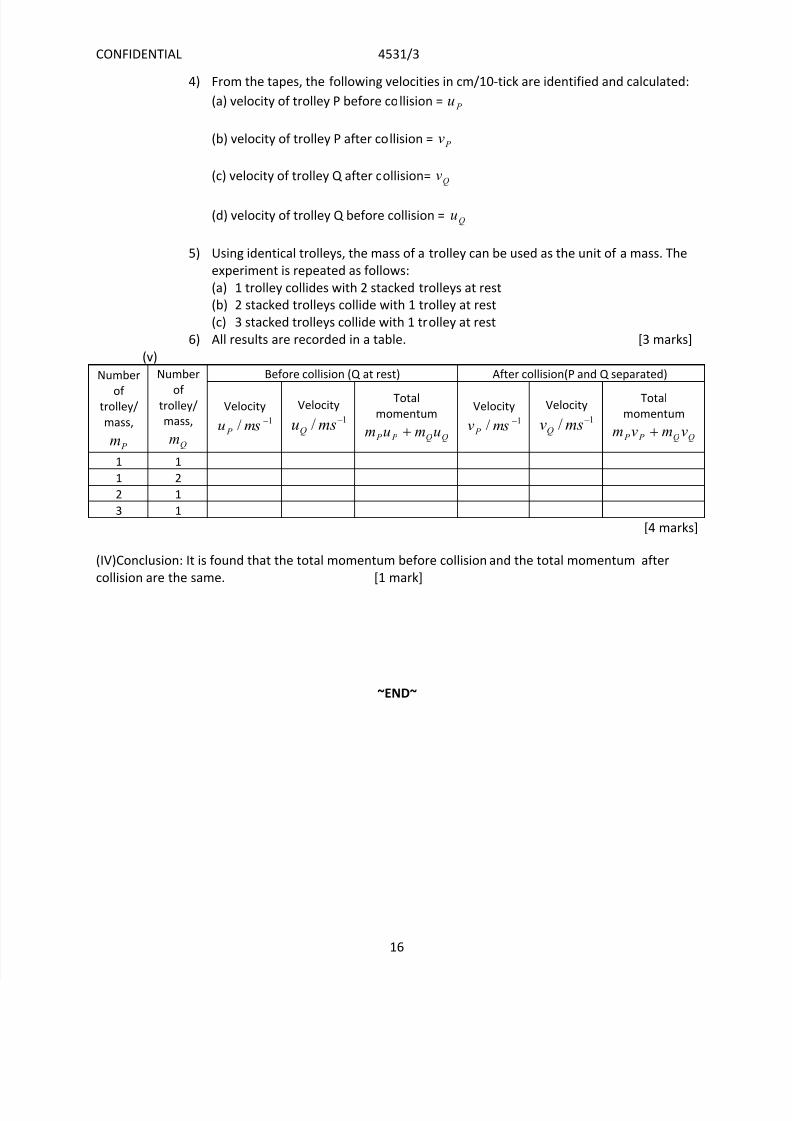
4) From the tapes, the following velocities in cm/10-tick are identified and calculated:
(a) velocity of trolley P before collision = P
u
(b) velocity of trolley P after collision = P v
(c) velocity of trolley Q after collision= Qv
(d) velocity of trolley Q before collision = Qu
5) Using identical trolleys, the mass of a trolley can be used as the unit of a mass. The
experiment is repeated as follows:
(a) 1 trolley collides with 2 stacked trolleys at rest
(b) 2 stacked trolleys collide with 1 trolley at rest
(c) 3 stacked trolleys collide with 1 trolley at rest
6) All results are recorded in a table. [3 marks]
(v)
Number
of trolley/
mass,
P m
Number
of trolley/
mass,
Qm
Before collision (Q at rest) After collision(P and Q separated)
Velocity1
/msu P
Velocity1
/msuQ
Total
momentum
QQ P P umum
Velocity1
/msv P
Velocity1
/msvQ
Total
momentum
QQ P P vmvm
1 1
1 2
2 1
3 1
[4 marks]
(IV)Conclusion: It is found that the total momentum before collision and the total momentum after
collision are the same. [1 mark]
~END~