pps integrated report 2017€¦ · pps in the future 24 our strategy 24 pps group consolidated...
TRANSCRIPT

INTEGRATED REPORT
2017

PPS offers unique financial solutions to select graduate professionals with a 4-year degree. PPS is an authorised Financial Services Provider.
Financial Planning Short-Term Insurance Medical AidInvestmentsLife Insurance
PPS members enjoy more than just professional cover. In 2017, our members enjoyed their share of R3.7 billion allocated to their unique Profit-Share Accounts, further reinforcing our passion for mutuality. In fact, in the past financial year, our group assets* accumulated to R35.3 billion, proving that success is better, shared.
Discover our shared success in our financial report.
Visit PPS.co.za
*Excluding unit trusts for third parties.
SUCCESS IS BETTER,SHARED.

Highlights for 2017 2Who we are 4
Our mission 4Our values 5Our strategy 5
Why is PPS unique? 5The mutual ethos 5Focus on the graduate professional market 5Long-term mindset 5
Members’ returns 5Governance 5
Group structure 6Chairman's statement 8CEO's message 10Group performance at a glance 14
PPS Insurance 15PPS Investments 17PPS Short-Term Insurance 18PPS Financial Planning 19PPS Healthcare Administrators 20
Key performance indicators 22How PPS addresses principal risks and uncertainties 23
Risks 23PPS in the future 24
Our strategy 24PPS Group Consolidated Statement of Financial Position 25PPS Group Consolidated Statement of Profit or Loss and Comprehensive Income 26Human capital 27Social and relationship capital 30
Investing in the future 30Full circle 31PPS Foundation & PPS Educational Trust 31Employee and member volunteerism 33
Intellectual capital 34PPS Holdings Trust board of trustees 36PPS Insurance Company Limited board of directors 38PPS Group Executive committee 40PPS Investments board of directors 42PPS Short-Term Insurance board of directors 43PPS Healthcare Administrators board of directors 44Corporate Governance Report 46Annual Financial Statements 2017 68Action required by members in regard to the 2018 annual general meeting 166Notice to the members of the annual general meeting and CV’s of candidates standing for election 167Form of proxy 177Administrative information 179
CONTENTS
1

PPSMILLIONAIRES
MORE THAN
MEMBERS HAVEACCUMULATED
MORE THAN
IN THEIR PPS PROFIT-SHARE ACCOUNTS
4 400
R1 million*Including negative investment returns as a result of the global financial crisis
Bill
ion
ZA
R
200
8
200
9
2010
2011
2012
2013
2014
2015
2016
2017
-0.3
* 2.3
4.3
6.0
8.9
13.1
16.3
18.5
21.2
25.0
R25 bn cumulatively allocated over the last 10 years
TOTAL ALLOCATIONS TO MEMBERS
R3.7 billion
PPS HIGHLIGHTSFOR 2017
R2.9 billion
18.8%
TOTALBENEFITS PAID
SICKNESS R 473.4 MILLION
PERMANENT INCAPACITY R 410.4 MILLION
LIFE COVER R 607.5 MILLION
CRITICAL ILLNESS R 160.8 MILLION
LUMP SUM DISABILITY R 109.0 MILLION
PROFIT-SHARE PAY OUT R 1 018.0 MILLION
MOTOR & HOUSEHOLD R 98.0 MILLION
PPS INTEGRATED REPORT 20172

3

Since its founding in 1941, PPS is the only mutual financial services company in South Africa that has focused exclusively on graduate professionals, providing tailor-made insurance, investment and healthcare solutions to our members.
PPS exists to take care of the financial interests of its members, by providing advice, products and services for the optimal creation, protection and management of the wealth of its members throughout their lives.
WHO WE ARE
Life Insurance Short-Term Insurance Investments Financial Planning Medical Aid
PPS operates under the ethos of mutuality and all PPS profits are allocated to PPS members with qualifying products on an annual basis by way of allocations to their PPS Profit-Share Accounts. PPS believes in the power of professional thinking and how it can change the world for the better.
OUR MISSIONTo be an exclusive organisation of graduate professionals, belonging to its members, which provides exceptional insurance benefits and a range of financial services to members, their families and associates.
We further strive to provide peace of mind, security and consequently wealth for our members during their working lives and in retirement.
PPS INTEGRATED REPORT 20174

OUR VALUESAt PPS, we believe that what we value internally will drive our behaviour externally. We live by the following values:
• We have enduring financial strength through a long-term focus.
• We recognise the uniqueness of our members by providing them with products to meet their specific needs.
• We deliver service excellence to our members.
• We conduct our business with the highest standards of governance, integrity, fairness and respect for all stakeholders.
OUR STRATEGYThe needs of the graduate professional have been central to our strategic intent for the last 76 years. We have designed our products and service models accordingly and believe that the mutual model provides long-term benefits to our members that cannot be matched.
Our strategy therefore focuses on:
• mutuality and growing membership
• group sustainability
• distribution.
WHY IS PPS UNIQUE?THE MUTUAL ETHOS
Unlike most financial services providers in South Africa, PPS is not listed on the stock exchange and has no external shareholders – instead, PPS operates under the ethos of mutuality and all profits are allocated to PPS members with qualifying products on an annual basis by way of allocations to their PPS Profit-Share Accounts.
This means that all the profits and investment returns generated by the PPS Group are allocated to its qualifying members.
Mutuality is central to our success. Profits and investment returns are reinvested, with a long-term mindset, on members’ behalf. These funds accumulate in our members’ PPS Profit-Share Accounts, (irrespective of their claims) and vest free of tax at retirement, resignation from PPS or death. This benefit has no rival in South Africa.
FOCUS ON THE GRADUATE PROFESSIONAL MARKET
PPS stands apart from all other financial service providers, distinguished by:
• Only qualifying graduate professionals who meet our criteria
• A business model based on mutuality – our members are the de facto shareholders.
As such, member interests inform all our decisions and actions. PPS has operated according to this model since our founding 76 years ago – and will continue doing so.
LONG-TERM MINDSET
PPS is not focused on delivering short-term returns to shareholders. PPS is focused on creating and sustaining long-term growth and wealth, recognising that there is an alignment of the interests of policyholders – unique to the insurance industry in South Africa.
The mutual structure allows our stable management team and the Board to adopt a long-term approach to running the business, deploying sustainable long-term strategies, which make the most efficient use of capital, and benefit all the generations of professionals we serve.
MEMBERS’ RETURNSPPS members shared in over R3.7 billion (2016: R2.7 billion) of PPS profits and investment returns during the year.
PPS has shared a total of R16 billion in profits and investment returns with its members over the last five years, and R25 billion over the last ten years.
Once members retire from their PPS Insurance products, the profits they have accumulated over the course of their membership through their PPS Profit-Share Account will vest. The profits will become accessible via the Vested PPS Profit-Share Account, irrespective of whether they had claimed or not and vests at retirement from age 60. This is a unique statistic in the South African insurance sector. The Vested PPS Profit-Share Account allows members to keep their PPS Profit-Share Account assets invested for longer to generate further returns and supplement their retirement savings.
GOVERNANCE
PPS Insurance is a registered insurer and is subject to the same governance requirements as a listed insurer. A unique additional layer of governance is the fact that our members and professional associations are represented at the PPS Holding Trust Board level – the ultimate control structure of the Group.
There is no other insurance company in South Africa where policyholders are specifically represented at Board level.
5

GROUP STRUCTURE
MEMBERS
Note: membership is the primary gateway to all products of affiliates
100%
The Professional Provident Society Holdings Trust
Professional Provident Society Insurance Company Limited
OPERATING SUBSIDIARIES
Professional Provident Society Healthcare
Administrators (Pty) Limited
100% 51% 100% 100% 74%
AFFILIATES
Profmed Medical Scheme
Professional Provident Society Retirement Annuity Fund
Professional Provident Society Beneficiaries Trust
Professional Provident Society Preservation Provident Fund
Indicates an affiliation
Indicates ownership
Professional Provident Society Preservation Pension Fund
Professional Provident Society Personal Pension Retirement Annuity Fund
PPS Mutual Limited (Australia) and operating subsidiary
Professional Provident Society
Insurance Company (Namibia) Limited
Professional Provident Society
Short-Term Insurance Company Limited
The PPS Property Fund Trust
The Professional Provident Society Foundation Trust
The Professional Provident Society Educational Trust
Professional Provident Society Training Academy (Pty) Limited
Professional Provident Society
Investments (Pty) Limited
PPS INTEGRATED REPORT 20176

LEADERSHIPCOMMENTARY
7

CHAIRMAN’S STATEMENT
Writing this 2017 chairman’s report was a genuine pleasure, with PPS once again reporting positive returns and membership growth. In the broader context, I sense an atmosphere of renewed optimism about South Africa’s political stability and economic prospects.
Our country’s economic indicators have turned positive after years of stagnant growth and a technical recession that impacted on all sectors of our society, including the community of graduate professionals that make up the PPS membership base. Actual forecasts still vary, with the South Africa Reserve Bank (SARB) conservatively estimating a 2018 growth rate of 0.9%, whereas Goldman Sachs, the global investment bank, is forecasting national growth at 2.8%. Goldman Sachs views South Africa as an emerging economy highlight for 2018, as it rates our local credit and currency markets as being undervalued relative to other emerging markets.
A significant strengthening of the Rand would, to a certain extent, mitigate against the negative effects of credit ratings downgrades and may likely reduce the costs of borrowing for both the private and public sectors.
A renewed commitment to good governance in the public and private sectors bodes well for the future of South Africa.
Collectively, these positive developments augur well for our economic growth and the concomitant wealth creation required for achieving that fair and just society envisaged by South Africa's constitution - a vision no doubt shared by our members.
Despite South Africa’s challenges in 2017, PPS recorded a 12% increase in revenue, with our gross premium income exceeding R4bn for the first time. Because of this strong performance, we were able to transfer R3.7 billion to the member profit sharing account, while paying out R2.9 billion in claims and benefits. During the year in review tight cost controls, investment growth and a low member lapse rate, ensured that PPS remained well-financed and highly sustainable.
In our previous integrated report for the 2016 financial year, we mentioned innovative projects that PPS had embarked upon, including robo-marketing, opening an Australian business and launching a short-term insurance business. In addition the short-term insurance is growing steadily as part of the end-to-end bouquet of risk and investment products that PPS can make available to members.
PPS INTEGRATED REPORT 20178
The original PPS Insurance, the product upon which the PPS group is founded and still our foundation business, has continued to excel under the chairmanship of Charles Erasmus, a widely respected insurance industry veteran. Erasmus has the support of a highly respected board and management team, which continues delivering the results that make it our baseline business.
Like all businesses active in the financial services sector, PPS is challenged by a radically changing regulatory environment that includes Solvency Assessment Management (SAM), which is scheduled for implementation the second half of 2018. After some years, the ‘Twin Peaks’ legislation has passed its parliamentary hurdles and awaits implementation by the regulators. This legislation is intended to migrate prudential regulation, including financial soundness, governance and public disclosure, to SARB and a market conduct authority that will be housed within the current Financial Services Board (FSB). As a group, we are well into the process of preparing for regulatory changes and also mandatory audit firm rotation and the introduction of new accounting standards.
The financial industry, including the banking sector, is being massively disrupted by the march of technology, which enables innovative business models and new entrants to enter into financial services at significantly lower barriers to entry than the past. Platform-based interfaces and business models appear to be having the greatest impact at this time.
PPS has the will, expertise and resources to innovate, with the strategic advantage of many decades in the industry. We embrace disruption of the industry as the ‘new normal‘ rather than a one-off event. Our leadership has the vision and ability to drive innovation continuously to create a more fulfilling, community orientated and immersive experience for our members.
As the custodian of the financial interests of thousands of graduate professionals, PPS is committed to the highest standards of corporate governance, ethical values and sustainable business practices. We comply with the King Code of Corporate Governance and are in the process of upgrading our corporate governance practices to align with the King IV Code principles.
The PPS organisational structure includes several boards and their subcommittees. All boards and the committees operate
within the parameters of approved charters and terms of reference, which are reviewed periodically. Furthermore, all boards and committees are supported by the company secretary and a well resourced company secretarial office.
I take this opportunity to record my deep indebtedness to Dr Sybil Seoka, the deputy-chairman of the PPS Holdings Trust, for her ongoing support, counsel, a strong work ethic and the leadership attributes she brings to the PPS board.
Charles Erasmus, chairman of PPS Insurance, continues to enhance the PPS value proposition through his outstanding leadership, commitment, counsel and energy.
Likewise, to all board and committee members within the PPS group, I record my unqualified appreciation for your guidance, input and on-going support, as well as your deep commitment to unwavering corporate governance. I look forward to continuing working together with you in 2018 to hold PPS high as the natural first choice for graduate professionals.
On behalf of our board of trustees and the PPS group entities, I record my sincere gratitude to Izak Smit, the CEO of the PPS group, for his outstanding leadership and stewardship. He has been ably supported by his executive management; PPS staff members and our intermediaries. Collectively, their joint efforts have energised the growth, prosperity and sustainability of PPS. Their efforts have solidified the PPS brand positioning as the preferred provider of premium risk, financial and investment products to the professional community.
Last and by no means least, there would not be a PPS at all without the active subscription and support of our members. Your participation and enthusiasm motivates us to keep on aiming for higher service levels, better products and new tools for interacting.
I am looking forward to seeing what we can collectively achieve in 2018.
Ebi Moolla Chairman
28 March 2018
9

CEO MESSAGE FOR INTEGRATED REPORT
OVERVIEW 2017 was another challenging year for South Africa. We contended with economic, political and environmental challenges that suppressed commercial activity and business confidence. Many of these challenges are South Africa specific, locally generated, at a time when most of the rest of the world is finally shrugging off the effects of the financial crises of a decade ago and returning to growth and fuller employment. In the financial services environment, times like this in South Africa make signing up new business difficult and insurance claims inevitably rise.
Despite these headwinds, the PPS team rose to the challenge and recorded a solid operating profit for our members. I applaud this result as a real achievement within the current operating environment.
In this year of review, we grew our membership numbers across all the group businesses, while our investments performed above expectations.
In mid-2017 we established a new support unit offering fiduciary services such as drafting wills and winding up deceased estates. With this service in place, PPS is now one of few South African financial services providers presenting an end-to-end portfolio of solutions, and indeed the only one that focuses exclusively on the unique needs of professionals. Our offering ranges across healthcare administration, fiduciary services, short and long-term insurance to financial planning and investments.
Over the next year we will launch digital tools and other initiatives to simplify and speed up intermediary and member interactions with PPS, as expected by an increasingly technological literate member base.
STRATEGYAn anomaly is that many of our members do not yet use many of the PPS solutions. Now that we have rolled out a complete across-the-board range of financial and healthcare services, we can increase awareness of our services across the membership base. In the spirit of mutuality, these will benefit our members as much as the PPS Group, which is constituted to return its profits to those very members.
PPS INTEGRATED REPORT 201710

PPS is taking a pioneering approach in this interconnected age by tapping into the spirit and collegiality of the academic years to create a community environment for our members. By going back to our tertiary education roots, we intend being as much an interactive forum for professionals as a provider of financial services.
In recent years newly graduated or younger professionals often did not see the immediate value in joining PPS, as their profit-sharing rewards seemed so far into the future. We have launched PPS recruitment campaigns at universities to explain how PPS can look after their financial interests throughout their careers and beyond, with the profit-sharing payout as the cherry on top. Younger people have started joining in numbers and the age demographic within PPS is swinging steadily towards the millennial generation.
Millennials often prefer digital communication as a precursor to face-to-face consultation, while the preceding baby boomers would generally opt for a personal discussion first. The self-help digital channels we are rolling out are designed to familiarise younger graduates with financial advice and good investing habits as they grow their investment portfolios. We expect these members to supplement these self-help channels with personal discussions in future as their portfolios and personal circumstances develop to become more mature.
The 2018 financial year will be about rolling out a PPS digital engagement strategy in line with global best practices. We are developing digital platforms and apps for members, intermediaries and agents to easily access their financial planning, evaluate investment opportunities and calculate tax. Later in 2018 we aim to launch digital tools for members to also evaluate their life and insurance policies.
PERFORMANCEDuring the year under review, we made certain management changes and recruited additional top-level skills. We also identified unnecessary costs in our distribution system and phased out management levels that had become redundant. The management team is now settled and energised by the new growth strategy that has been put in place.
PPS recorded a healthy profit this year, despite the unfavourable business climate. Although claims increased considerably, PPS is well provisioned for paying out claims and was able to set aside a worthwhile distribution for members.
In 2017 PPS won the long-term insurance category at the prestigious Financial Intermediary Association (FIA) awards - a major vote of confidence in the business, as the ‘judges’ are financial intermediaries themselves. Given our strong focus on a narrow market segment - the professionals - winning this award when being judged against rivals operating in multiple market segments was especially pleasing.
SNAPSHOT OF DIVISIONAL PERFORMANCES• PPS Short-Term Insurance’s performance shows that
professionals in general continue to manage their risks responsibly. Claims received were well within budgeted assumptions, supporting our belief that our members are a better risk pool, which bodes well for the future in terms of premiums and profit. This new unit’s cash reserves remain substantial.
• PPS Investments performed particularly well and grew assets under administration to R28.6 billion, with the number of individual members participating increasing by over 5,300. This growth is particularly pleasing as many rival asset managers have stopped growing in the current environment. This unit’s excellent performance was underpinned by prudent expense management.
• PPS Financial Planning supports our members and their financial advisors with specialised interventions and advice. The model is fee-based, which enables our consultants to provide professional advice in a non-sales environment. We deliver on two fundamental promises: (1) being advised by competent professionals, (2) without pressure to purchase specific products. Any necessary product implementations are typically referred back to the member’s broker or agent, who implements decisions competently.
• PPS Healthcare Administrators’ recent investments into systems upgrades have sharply improved operational efficiencies. These are now paying off in heightened service levels and reduced costs.
• PPS Mutual (Australia) was launched in February 2016 after a rigorous viability study, was able to make its first profit distribution to its members in 2017. The costs of operating our Australian business are reduced by running much of its back-office administration through our Johannesburg facility. It also supports profit generation for our South African members.
11

CONCLUSIONClaims exceeded our projections, a factor which often emerges when economies slow down. However, it is in times like this that we remind ourselves of our purpose: to assist our members in times of need and help them live the lives that they want to live.
PPS has evolved from a ‘graduation to retirement’ provider to an end-to-end ‘graduation to grave’ financial partner to our members. When members retire they are encouraged to invest their profit share payouts into PPS products that will bolster post-retirement income. Members who prudently re-invest the cash will continue gaining from profit share through their investments until they decide they need the cash.
THANKSIn my first full financial year as CEO I am privileged to have the support of a strong and diverse board that understands the business and is fully behind our updated strategy. Both chairmen, Ebi Moolla of PPS Holdings Trust and Charles Erasmus of the PPS Insurance board, have been inspiring sources of support and of industry insights. There is a deep mutual trust at board level.
The PPS management team and our staff members have worked hard to pull PPS through a challenging year. The fruits of their efforts are shown in our healthy results. I have the deepest gratitude to all of them.
Management at PPS realise the importance of our culture. People enjoying their workplace experiences provide better service to members and stakeholders. We are developing leadership throughout the business and empowering people to take charge of their areas of expertise, building trust and collaboration. In PPS, people don’t need titles to be leaders. I am inspired by how our PPS people have committed so energetically to our refreshed internal culture.
Izak SmitGroup CE
28 March 2018
PPS INTEGRATED REPORT 201712

GROUP OVERVIEW
13

GROUP PERFORMANCE AT A GLANCE
THE PPS GROUP KEY INDICATORS 2017 FIVE-YEAR REVIEW
PROFIT-SHARE ALLOCATIONS AND BENEFIT PAYMENTS
Through its unique mutual model, all the profits are ultimately attributable to our members. This is achieved by allocating operating profit and investment returns to the members' PPS Profit-Share Account™, which is available to members on retirement, or to their beneficiaries on death.
Annual gross benefits paid to members
R2.9 billion Cumulative profit-share allocations for the last
five yearsR16.0 billion
Annual profit-share allocations
R3.7 billion
Annual gross benefits paid to members and
profit-share allocations R6.6 billion
2013 20172016201520140
0.5
1.0
1.5
2.0
2.5
3.0
R’bn
2013 20172016201520140
5
10
15
20
R’bn
2013 20172016201520140
1
2
3
4
5
R’bn
2013 20172016201520140
2
4
6
8
R’bn
PPS INTEGRATED REPORT 201714

PPS INSURANCE Since inception PPS has catered only to postgraduate professionals, which is a niche market with a distinct risk profile. Our 76 years unwavering focus on this group has unlocked the deep insights that enable PPS to design and offer superior products that remain cost competitive.
Another fundamental differentiator is that PPS is the only major financial services provider that has retained the principle of ‘mutuality’ at the core of our member value proposition. In effect, 100% of the net profits are returned to members in accordance with a ratio determined by their contributions.
Other financial services providers competing for graduate professionals are invariably profit and shareholder-driven, which prevents them from offering 100% profit sharing and inevitably means there are different interests between the shareholder and policyholder. Our rivals simply cannot compete on overall returns.
What we do
The PPS sickness and disability cover – our flagship product – offers more than the traditional income protector package of most other insurers. PPS disability cover pays out if a member falls ill for a period of time, without having to prove loss of earnings. Unlike certain competitors, we do not deduct from the payment should the member receive any remuneration during the period of disability.
PPS also offers Life Cover, Lump Sum Disability, Accidental Death and Education Cover products that are all intrinsically superior, due to PPS’s built-in profit-share benefit.
Besides profit sharing, other main differentiators are:
• International cover without loading or exclusions
• No discounting on disability payments or limits to number of claims
• Automatic cover for potentially hazardous pursuits such as scuba diving, flying private airplanes and motorcycle racing. We have factored in that many graduates enjoy stimulating pursuits outside of their professional lives.
As PPS membership has always been based on educational levels, we reviewed our entry criteria against education systems and standards. Our updated criteria provides more clarity and transparency.
Performance
Membership numbers, market share and broker support all improved in the year of review. Gross premiums from long-term insurance products grew by 12%, while PPS policy lapse rates remain the lowest in the industry.
Prospects
PPS is introducing new technology to our member interfaces in 2018 to make engagement more seamless and intuitive for all parties. These will include an automated membership eligibility tool to speed up the process of adding new members and a projection calculator to enable members to calculate future values of their profit share, including variations from buying more products or cancelling existing products.
In 2018, proposed legislation for the financial services industry that has been in the pipeline for long is scheduled to start being rolled out. This legislation will doubtless affect certain facets of our business – distribution in particular - but PPS has prepared thoroughly for potential impacts.
In the broader macro-economic context, South Africa’s troubled political and economic environment adversely affected consumer confidence levels which was detrimental to new business volumes in the life insurance industry during the year. Whilst PPS was not immune to this trend in 2017, we performed well in the second half of the year, and ended the year more or less on par with 2016 in terms of new business inflow.
We did, however, see an increase in claims, which is not unusual during economically challenging times. Fortunately, these have remained well within actuarially determined limits.
15
2013 20172016201520140
10
20
30
40
R’bn
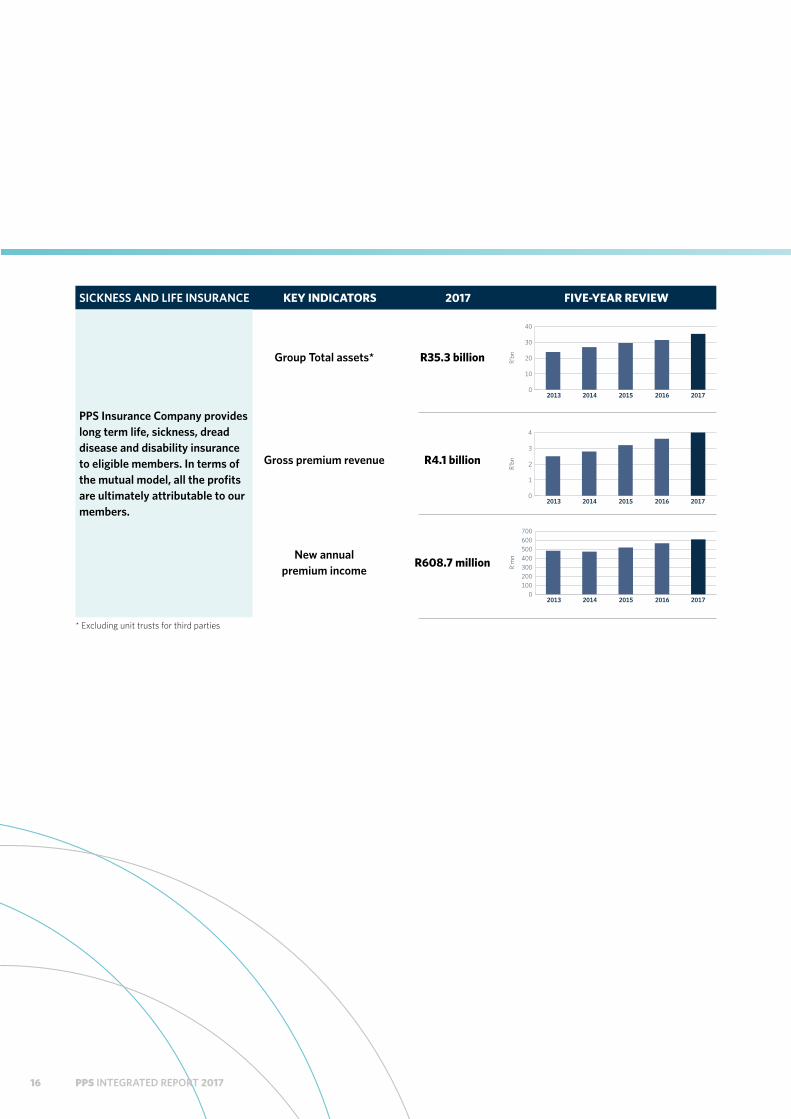
SICKNESS AND LIFE INSURANCE KEY INDICATORS 2017 FIVE-YEAR REVIEW
PPS Insurance Company provides long term life, sickness, dread disease and disability insurance to eligible members. In terms of the mutual model, all the profits are ultimately attributable to our members.
Group Total assets* R35.3 billion Gross premium revenue R4.1 billion
New annual premium income
R608.7 million * Excluding unit trusts for third parties
2013 20172016201520140
1
2
3
4
R’bn
2013 20172016201520140
100200300400500600700
R’mn
PPS INTEGRATED REPORT 201716

PPS INVESTMENTS
PPS Investments (PPSI) is the only investment business in South Africa that returns its profits to investors. Profit sharing, together with a proven track record, makes PPSI the investment provider of choice for graduate professionals. Our proposition is focussed deliberately around the needs of members which has assisted us in avoiding unnecessary product proliferation that we find ourselves surrounded by. With assets under administration approaching R30 billion, our members collectively own an investment business of significant scale. They need to look no further than PPSI for all their investment needs.
What we do
PPSI provides a carefully selected range of unit trusts to house member investments. We also utilise a multi-manager approach to consistently deliver on our stated portfolio objectives. We conduct thorough research before selecting the best combination of asset managers to operate funds that are diversified across investment strategies.
PPSI offers tax-structured products that include living and retirement annuity funds, personal pension funds, preservation funds and investment accounts. While most investment houses may offer similar portfolios, PPSI uniquely links investment options to the PPS Profit-Share Account, so that members can maximise and prolong the growth of their profit-sharing portions.
Performance
Despite disappointing industry-wide figures for new business, we increased our new business value by 14% to reach R4 billion. Assets under administration increased 14% year-on-year to close at R28.6 billion. The PPS specialised distribution model distinguishes the group from other financial services firms and continues to be a perennial driver of growth and profits.
Key performance indicatorsPPSI's two key performance indicators (KPIs) are to achieve the investment performances we targeted and to grow the proportion of PPS members who save and invest with PPSI. Despite challenging investment conditions towards the end of 2017, our various investment portfolios performed satisfactorily and PPSI recorded the fastest growth of individual clients within the PPS group, approaching the 40 000 mark during the year.
Opportunities and challengesSouth Africa’s volatile politics and linked investment ratings downgrades hindered the investment market throughout 2017. Reviving economic growth in South Africa is set to be a major challenge for the corporate world and government. Nevertheless, opportunities for worthwhile returns are out there and we strongly encourage investors to entrust their assets to us. Our members should also seriously consider retirement annuity structures or investment accounts that South African Revenue Services (SARS) has exempted from tax to grow national savings. Time-and-again, maintaining a disciplined savings plan through periods of market uncertainty has proven to effectively create wealth over the medium to long term.
Investing via smartphoneThe recently introduced PPS member smartphone app has been widely acclaimed. This in-house developed app enables members to interact with and manage their investments through a smartphone interface. Similarly, by year end, some 35% of our investors had registered for our digital services, which we expect to be increasingly utilised by time-pressured professionals.
Prospects
As 2018 unfolds, the PPS group is extending and refining our member value proposition to further distinguish PPS, where every policyholder is effectively a shareholder, from our shareholder-owned competitors. PPSI’s role is to continue delivering the consistent investment returns and product integrity that characterised our first decade of trading.
This year we are revamping our back-office systems to further optimise service standards for investors and financial advisors. By end-2018, members should be able to access a dashboard view of their entire relationship with PPS products and services.
At PPSI, we aim to double our number of investors over the next five years, based on innovative digital tools and by upskilling the independent financial advisers we utilise.
As a leading and responsible investment firm, PPSI will continue imparting the need for personal financial accountability and fiscal discipline to the incoming generations of professionals. Expertly designed investment and savings plans through economic cycles is the key to lifelong self-sufficiency for our members.
17

PPS SHORT-TERM INSURANCE Most professionals in South Africa will require some form of short-term insurance. Although PPS launched its short-term insurance just two years ago, this business is showing clear signs of being a major contributor to growing the PPS profit pool.
PPS Short Term Insurance (STI) is a fully-fledged insurance company rather than a brokerage. We customise our own bespoke offerings to the individual risk profiles of our members and have control over the claims experience.
What we do
PPS only insures graduate professionals. As graduate professionals have a specific risk profile, we can design and price our offerings to align with each member’s individual needs. PPS STI offerings are superior to the generic products marketed by other insurers.
PPS has partnered with market leading Santam to design products and a pricing model. Our client claims are managed through Santam’s sophisticated claims processing centre.
Performance
STI's net income increased by 46% over the prior year to R148.6 million. We again managed the business within budget and achieved a better-than-expected claim-loss ratio.
In 2017, our second year of existence, we fell marginally behind growth targets. Nevertheless, STI still recorded better than budget results due to prudent management.
Prospects
Market conditions were exceptionally constrained due to South Africa's underperforming economy and higher reinsurance premiums resulting from 2017 catastrophes such as the Knysna fires and Western Cape storms. A more favourable economic and political climate in 2018 will be a boon for PPS and our members.
As PPS STI products have been in the market for just two years and in a weak economy, adoption by brokers has been slow off a zero base. We are encouraged that each month we see adoption by brokers climb steadily.
PPS INVESTMENTS KEY INDICATORS 2017 FIVE-YEAR REVIEW
PPS Investments is a 100% owned investment company that offers investment, retirement and savings products to PPS members.
Total assets under administration
R28.6 billion New business: flows R4.0 billion
2013 20172016201520140
5
10
15
20
25
30
R’bn
2013 20172016201520140
1
2
3
4
R’bn
PPS INTEGRATED REPORT 201718

PPS FINANCIAL PLANNING Our financial planning division plays an increasingly vital role as PPS adds new products and services to its portfolio of offerings. We advise PPS members on how to select and integrate our offerings to best reach their financial goals.
PPS Financial Planning has gained certain key insights regarding client planning needs:
• Our members are willing to pay for financial planning services as they would for an attorney or accountant.
• They have moved beyond simply requiring assistance with products. Members require advisors who can optimise their portfolios and provide related services such as drawing up budgets.
• Financial planning solutions must be tailored to individuals and their specific needs.
We have separated payment for financial planning from product commissions, to ensure that members are not talked into purchasing products they may not need. PPS Financial Planning bills fairly for drawing up the plan, which the member can implement through PPS or elsewhere.
All PPS financial advisors are post-graduate professionals, with most being qualified attorneys or accountants. Almost all PPS financial advisers have obtained, or are in the process of obtaining, their Certified Financial Planner (CFP) qualification.
What we do
Our services are:
• Financial advice and planning as a separate service from product sales
• Individualised financial plans that may, or may not, include PPS products and can be implemented by PPS or any service provider the member chooses
• Fast and efficient implementation of member decisions.
The mid-2017 launch of our fiduciary services unit introduced estate planning and the drafting of wills, trusts, and safe custody to our portfolio. PPS is currently developing apps that will enable our members to easily implement their financial planning.
Performance
In South Africa, PPS is leading the way in providing financial services, advice, and support to independent financial advisors (IFAs). Many IFAs lack expertise in specific disciplines such as estate planning. Getting IFAs to plug into PPS expertise enables them to assist their clients in aspects where they lack knowledge. PPS does not charge IFAs for this advice, which is building up the support and respect of the IFA community.
Key performance indicators for PPS Financial Planning are:
• The number of members taking up plans
• The average amount charged per plan
• How many members we expose to additional PPS products and services.
Prospects
PPS is presently developing interactive digital apps for our members by moving financial planning online for those who prefer digital engagement. Proprietary video conferencing through smartphones or computers will enable members to interact with PPS financial advisors remotely and at times they decide.
The financial advisory community is facing severe challenges from technology, changing expectations from the younger generation, and incoming legislation that will have a major impact.
Government’s implementation of the Treating Customers Fairly (TCF) initiative and the long-planned Retail Distribution Review (RDR) will, in our opinion, benefit consumers and greatly improve public trust in our industry.
We have identified what members and potential members would want and are working hard to provide a more individualised financial planning experience in a market that is still overly complicated and product-oriented.
19

PPS HEALTHCARE ADMINISTRATORS PPS Healthcare Administrators (PPSHA) is a wholly-owned subsidiary of PPS Insurance. PPSHA administers three medical aid schemes:
• Profmed: a closed scheme for graduates meeting certain criteria
• Key Health: an open medical scheme servicing government employees and growing numbers of private members
• Regular Force Medical Continuation Fund (RFMCF): a prefunded medical scheme that mainly provides medical, dental and hospital treatment for retired members of the South African Defence Force.
Each scheme caters to specific needs, allowing us to tailor make our health solutions rather than offering a one-size-fits-all model.
What we do
PPSHA is one of 11 medical scheme administrators serving South Africa’s private sector. The top three administrators, being Discovery, MMI and Medscheme, control 80% of the market. PPSHA is the fourth largest administrator, with a healthy share of the remaining 20%.
The Council for Medical Schemes (CMS) has recognised that our administration charges are similar to those of competitors and our non-healthcare costs remain well below the legally required 10% threshold.
We intend growing our customer base through superior services and seamless interactions. As a result, PPSHA has invested heavily in system upgrades over the last two years, which contributed significantly to PPSHA exceeding targeted profit margins throughout the year of review.
Over the past year, Profmed interacted continually with contracted medical specialists. These interactions included discussions on hospital bed nights per patient, compiling and circulating reports on industry matters and offering peer-reviewed quality assurance by fellow specialists.
In this period, Key Health introduced networks of hospitals and healthcare providers that members may utilise. This practice is being adopted by open medical schemes around the world to manage and reduce risk. Key Health met with some resistance from members, but was able to minimise annual contribution increases by passing on cost savings. Key Health’s claims ratio
improved due to discounts being awarded from hospitals and healthcare providers selected for the network.
A new Key Health incentive that was particularly well received is a rewards scheme for maintaining healthy lifestyles.
The PPSHA’s solid financial performance was boosted by introducing an alternative reimbursement model for selected hospital groups and specialists servicing all three schemes. Alternative reimbursement in place of the traditional ‘fee-for-service’ approach is gaining popularity in healthcare around the world.
Performance
Medical scheme competitiveness is measured through solvency levels and claims ratios derived from member contributions versus the number of claims paid. PPSHA’s claims ratio remains aligned with the industry standard of approximately 90%.
PPSHA is working to consistently reduce claims ratios to below 90%, so that all claims are paid and funds kept in reserve for unusual events or unusually high cost claims.
Prospects
The healthcare administration sector is highly regulated and the Council for Medical Schemes (CMS) is known for frequent rule changes. This volatile regulatory environment is partly responsible for the number of active medical schemes falling from 124 schemes in 2006 to 82 schemes in 2016.
Regulatory changes to solvency and claims ratios, among others, are compelling medical schemes to merge, making it difficult for PPSHA and other administrators to acquire new medical schemes.
PPSHA’s growth strategy for 2018 is to increase membership in existing schemes under our administration.
Broker fees remain an issue in growing membership, as these fees are lower than for selling insurance products.
Industry risksAlthough seemingly years away from full implementation, the impending National Health Insurance (NHI) will profoundly impact medical aid schemes and private healthcare over time, though these institutions will continue playing key roles in national healthcare. At this time we foresee a piecemeal rollout of elements of the NHI until a funding model is finalised and the actual funds become available.
PPS INTEGRATED REPORT 201720

PPS HEALTHCARE ADMINISTRATORS KEY INDICATORS 2017 FIVE-YEAR REVIEW
PPS Healthcare Administrators is a 100% owned company specialising in the administration of medical schemes.
Administration fees received
R237.4 million Operating profit R41.9 million 2013 2017201620152014
0
10
20
30
40
50
R’mn
2013 20172016201520140
50
100
150
200
250
R’mn
21

KEY PERFORMANCE INDICATORS (KPI’S)
The performance of our management and staff is measured on a balanced scorecard basis with an equal weighting for both financial and non-financial measures.
The KPI’s are categorised under mutuality, financial stability, service and staff, which in turn tie back to our key strategic priorities for the Group.
HOW DID WE DO IN 2017?
OUR KEY KPI'S Unit of
measure2017
PERFORMANCE2017
GOAL COMMENTARY
FINANCIAL STABILITY
Gross premium income
Rand billions
4.1 3.6G Gross premium income (long-term & short-term) exceeded expectations and moved above the R4 billion level for the first time.
Total assets* Rand billions
35.3 34.8G Total asset growth expectation is measured over a three year rolling period. Market movements for the year resulted in total assets being ahead of expectations.
Efficiency ratio % 14.0 15.2G Cost control remains an imperative of the
Group.
New annual premiums
Rand millions
737.8 774.6Y New premiums are up 5% on prior year, but below the internal target. The economic environment in South Africa has proven to be challenging for the consumer in 2017.
New investment inflows
Rand billions
4.0 4.4Y Performance is up 14% on prior year, but below the internal target.
MEMBERSHIP Number of new members recruited during the year
Individuals 7 348 8 191Y New member recruitment performed below target in 2017.
SERVICE Claims processed within Service Level Agreement
% 99.1 97.5G PPS aims to provide members with world-class service. Claims processing targets were exceeded during the year.
Customer satisfaction survey results
Rating 92 > 80G Customers are generally satisfied with our service. The rating is based on two important levers of service: professionalism and first time resolution.
STAFF Training spend as a percentage of payroll
% 5.1 > 4.0G Training spend is ahead of target.
* Excluding assets in unit trusts for third parties.
G Achieved
Y Partly achieved
R Not achieved
PPS INTEGRATED REPORT 201722

HOW PPS ADDRESSES PRINCIPAL RISKS AND UNCERTAINTIES
RISKS PPS exists to take care of the financial interests of its members, by providing advice, products and services for the optimal creation, protection and management of the wealth of its members throughout their lives and their legacies. The principles of mutuality as well as the objectives to operate ethically, responsibly and within the confines of applicable legislation are key considerations which determine our risk appetite.
PPS is cognisant of the key business risks, as outlined below, which may have a material impact on our operations. Strategies are in place to mitigate these risks wherever possible.
Risk table:
RISK MANAGEMENT ACTIONS
1. Slow economic growth • Grow our brand awareness
• Continuously enhance group product and service offerings
• Grow distribution reach
2. Membership growth • Build member community
• Digital engagement
• Profit-Share Account benefits
3. Market risk and volatile investment return • Long-term investment horizon
• Balanced portfolios with international exposure
• Multiple asset managers
4. Sustainability • Strategic opportunities
• Exploit efficiencies
23

PPS IN THE FUTURE
OUR STRATEGYThe PPS distribution strategy has evolved over time as the business has evolved from a single insurance product provider to a multiple business group. The strategy has served the business well with the continued growth in the life insurance business and the establishment of the subsidiary businesses such as investments, short-term insurance and health administration.
OUR STRATEGIC PRIORITIES KEY INITIATIVES
Mutuality Continue to grow our brand awareness amongst new professionals. Simplify mutuality concept for members
Engage with members using multi-channel approaches
Group sustainability Meet our members’ insurance and savings needs by offering a full suite of products
Drive organic growth in all our subsidiaries
Ensure that the group remains compliant with regulation
Distribution Launch of Digital initiatives
Focus on growing our share of the independent broker market business
Establish own brokerage
PPS INTEGRATED REPORT 201724

2017 2016 Change R’000 R’000 R’000 DESCRIPTION OF INDIVIDUAL ITEMS
ASSETS
Property and equipment 593 445 546 196 47 249 Fixed assets. These include PPS' head office
premises, furniture, equipment, computers and vehicles.
Investment property 381 869 356 469 25 400 Properties which are held for the purpose of rental income and capital appreciation.
Intangible asset 89 941 73 187 16 754 PPS Internally developed insurance software.
Other non-current assets 41 395 493 37 149 710 4 245 783 Assets backing insurance liabilities. These mainly include investments in equities and bonds, which assets are managed by investment managers who act in accordance with investment mandates set by the board of directors of PPS Insurance.
Current assets 3 530 857 2 382 905 1 147 952 Primarily cash resources of PPS Group.
Total assets 45 991 605 40 508 467 5 483 138
EQUITY AND LIABILITIES Total equity 449 414 400 086 49 328 Statutory capital requirement of the
insurance entities, revaluation reserve of owner-occupied properties, certain reserves of subsidiaries, and minority interest.
Insurance policy liabilities 31 417 920 28 216 448 3 201 472 Policyholders' funds consisting of (a) capital held to settle future insurance claims, and (b) PPS Profit-Share Accounts of members.
Investment contract liabilities 1 876 916 1 464 986 411 930 Funds of members invested in PPS living annuities and endowment products.
Liabilities to unit trust holders 10 709 000 9 088 757 1 620 243 Value of outsiders' investments in unit trusts in which PPS owns a majority stake.
Other liabilities 1 538 355 1 338 190 200 165 Primarily short-term liabilities.
Total equity and liabilities 45 991 605 40 508 467 5 483 138
PPS GROUP CONSOLIDATED STATEMENT OF FINANCIAL POSITIONas at 31 December 2017
25

2017 2016 Change R’000 R’000 % DESCRIPTION OF INDIVIDUAL ITEMS
Net insurance premium revenue 3 858 384 3 413 766 13% Premiums received from policyholders net of reinsurance premiums paid to reinsurers.
Other income 437 165 369 232 18% Administration fees: Long- and short-term insurance, medical aid and retirment annuity. Short-term insurance commissions. Fees earned for asset management.
Investment income and net revaluation profits on financial assets held at fair value through profit or loss
4 594 132 2 275 380 102% Interest, dividends, and realised & unrealised growth on investment assets.
Attributable to unit trust holders (966 613) (476 512) 103% Third-party unit trust holders' share of revaluation profits.
Total revenue 7 923 068 5 581 866 42% Gross insurance benefits and claims 2 877 157 2 422 710 19% Gross benefits paid to members.
Reinsurance claims recoveries (177 198) (160 042) 11% Insurance benefits recovered from reinsurers.
Increase in fair value of policyholder liabilities under investment contracts
140 060 15 296 816% Investment income, net of expenses, relating to the underlying assets linked to the investment policyholder contracts.
Expenses 1 596 492 1 507 437 6% Group operating expenses, commissions paid on new business written, and multi- manager fees paid by PPS Investments.
Profit before movement in insurance policy liabilities
3 486 557 1 796 465 94%
Movement to insurance policy liabilities
3 011 553 1 546 773 95% The amount allocated to members in their capacity as policyholders.
Tax 465 379 226 342 106% Taxes raised in favour of the South African and Namibian Revenue Services.
Surplus after tax and policy movements
9 625 23 350 (59%) Any adjustment required to maintain capital cover and the result of operations of subsidiaries, other than the long-term insurance subsidiary.
PPS GROUP CONSOLIDATED STATEMENT OF PROFIT OR LOSS AND COMPREHENSIVE INCOMEfor the year ended 31 December 2017
These are the benefits members
receive when claiming from PPS
This amount is part of the annual allocation to members’
PPS Profit-Share Accounts
PPS INTEGRATED REPORT 201726

OVERVIEWAs PPS celebrated its 76th anniversary in the year of review, the Human Resources (HR) function continued to prepare our employees for the requirements of an increasingly digital and millennial generation-aligned organisation.
The calibre and competencies of employees are key differentiators within the increasingly competitive financial services sector. At PPS we are crafting an Employee Value Proposition (EVP) that will align with and drive the strategic outcomes of the Membership Value Proposition (MVP) that is also being expanded.
B-BBEE LEVEL 3 ORGANISATION
2017
Employees 1 334
Holdings Trust Trustees 20EE – Trustees 10
Employment Equity statistics
2017 %
White 375 28%
African, Coloured and Indian 941 71%Foreign 18 1%
TOTAL 1 334 100%
Gender breakdown
2017 %
Male 478 36%
Female 856 64%
TOTAL 1 334 100%
HUMAN CAPITAL
27

EMPLOYEE ENGAGEMENT – VISION 2020In order to motivate and reinforce our employees’ commitment to achieving our strategic goals, we shared our ‘Vision 2022’ through a series of multimedia formats. We communicated touchpoints that spoke to, amongst other things, the concept of co-creating a responsible and collaborative culture at PPS.
OPPORTUNITIESEnabling a professional cultureAll levels of the organisation have committed to the fact that PPS is defined by the demands and standards of professionalism, and this needs to be reflective in how our people engage with members, as well as how they are treated.
In order to support the strategic growth and digitisation imperatives of PPS, HR has enhanced its capacity to support the business by establishing HR Centres of Excellence in the spheres of talent management, succession planning, organisational learning and personal development activities, required to develop the skilled leaders and specialists for a next generation PPS.
Navigating the digital evolutionTechnology can empower businesses with improved productivity, faster development and production cycles, superior decision making by employees, and enhanced customer service. But deriving these benefits from incorporating new technology is not always smooth. As incoming technology is adopted, various roles within PPS may change and the challenge is to equip employees to navigate that change through up-skilling and re-skilling interventions.
Achieving the group visionIn 2018 we will formally launch a Brand Leadership programme to connect our staff to the vision of collaboration. Our vision is for each PPS staff member to exercise leadership in their area of responsibility irrespective of job title.
Planning for the PPS of the next decade requires organisational flexibility and agility. Collaboration has emerged as a strong imperative.
ATTRACTING, RETAINING AND MOTIVATING PEOPLEIn 2017, we conducted an ethics survey and unpacked the feedback through a series of workshops. These provided invaluable insights into employee attitudes towards ethics, processes, policies and treatment of members. The outcomes were mainly positive, but certain required improvements in employee experiences in PPS were uncovered, which have informed new leadership engagement strategies that have been embarked upon.
This feedback was evaluated by the broader management team, which is developing an action plan to close identified gaps.
Leadership successionSuccession plans are in place for when PPS veterans retire. Suitable candidates have been identified for all roles and placed on leadership and skills development programmes.
PPS INTEGRATED REPORT 201728
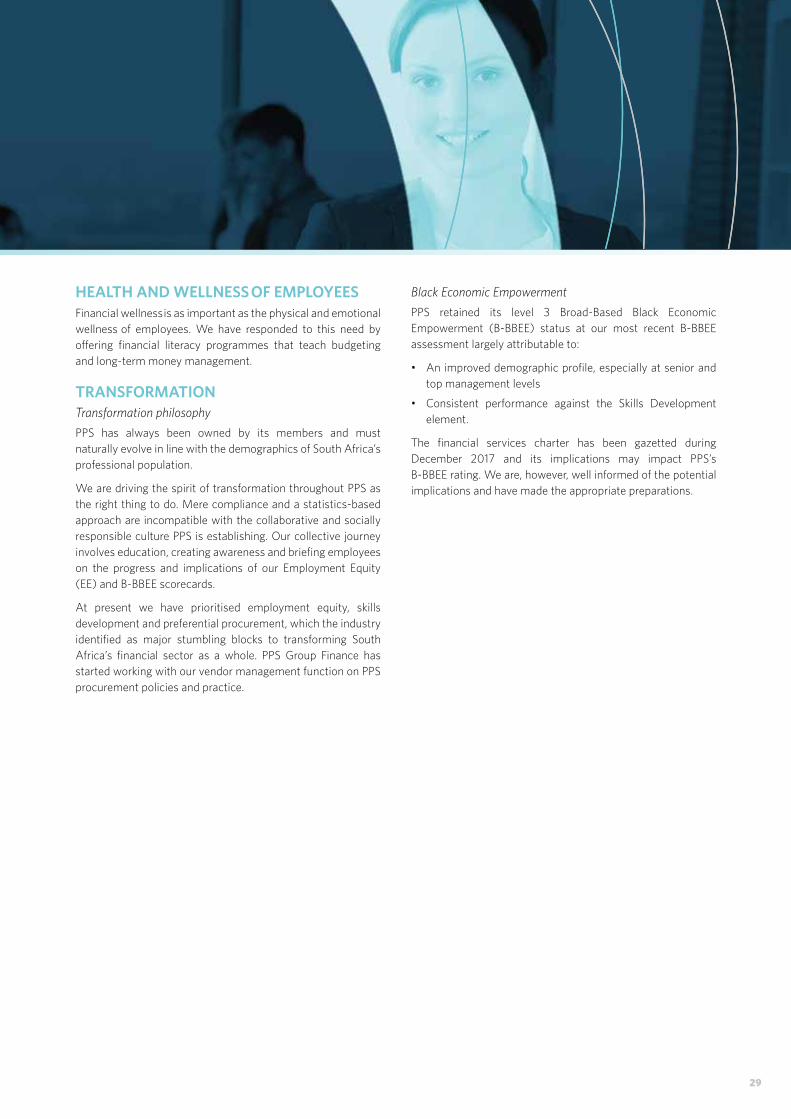
HEALTH AND WELLNESS OF EMPLOYEESFinancial wellness is as important as the physical and emotional wellness of employees. We have responded to this need by offering financial literacy programmes that teach budgeting and long-term money management.
TRANSFORMATION Transformation philosophyPPS has always been owned by its members and must naturally evolve in line with the demographics of South Africa’s professional population.
We are driving the spirit of transformation throughout PPS as the right thing to do. Mere compliance and a statistics-based approach are incompatible with the collaborative and socially responsible culture PPS is establishing. Our collective journey involves education, creating awareness and briefing employees on the progress and implications of our Employment Equity (EE) and B-BBEE scorecards.
At present we have prioritised employment equity, skills development and preferential procurement, which the industry identified as major stumbling blocks to transforming South Africa’s financial sector as a whole. PPS Group Finance has started working with our vendor management function on PPS procurement policies and practice.
Black Economic EmpowermentPPS retained its level 3 Broad-Based Black Economic Empowerment (B-BBEE) status at our most recent B-BBEE assessment largely attributable to:
• An improved demographic profile, especially at senior and top management levels
• Consistent performance against the Skills Development element.
The financial services charter has been gazetted during December 2017 and its implications may impact PPS’s B-BBEE rating. We are, however, well informed of the potential implications and have made the appropriate preparations.
29

SOCIAL AND RELATIONSHIP CAPITAL
INVESTING IN THE FUTURE Our 76 years of focusing on graduate professionals has entrenched PPS as a market and thought leader among South Africa’s graduate professionals. We don’t take our market leadership for granted and continually engage our target audience through various channels.
South Africa’s under-30 population greatly outnumbers the older generations. We have prioritised getting the attention of students early in their tertiary studies, so that they take up PPS membership as soon as they meet our eligibility criteria.
Our marketing efforts are informed by two surveys that PPS runs annually. These are the ‘Graduate Professional Index’ and the ‘Student Confidence Index’. These surveys enable PPS to identify threats and opportunities that will inform us in preparing for the future needs of potential members.
The Graduate Marketing division supports and educates students on campus about financial services, and why financial planning is vital to a future of lifelong prosperity.
The PPS Lounge at Wits is exclusively for senior students requiring a dedicated space for studies and assignments,
Herman Mashaba (Executive mayor of Johannesburg),
Robert Zwane (PPS Power of Professional thinking award),
Lindie Engelbrecht (Executive Director: Membership at SAICA) and
Ayanda Seboni (Executive: Brand, Marketing and Communications)
individually or in groups. This lounge offers premium coffee, newspapers and magazines, free Wi-Fi, a computer lab, and meeting rooms. Incentives such as the coffee lounge keep PPS top of mind with future graduates. We are investigating rolling out a similar approach on other campuses.
Another PPS initiative was to host sponsored workshops for young professionals, in collaboration with other professional associations.
In 2017, PPS was a proud headline sponsor of the SAICA Top 35 Under 35 – a prestigious awards ceremony recognising trailblazers in the field of accounting. Young accountants in business, academia, private practice and government were accoladed for their exceptional contributions to the field and economy.
More than simply recognising outstanding young individuals, these initiatives again prove our commitment to mutuality among graduate professionals and our long-term vision in preparing professionals of the future for membership. Only constant involvement will keep PPS as the leading financial services provider to professionals from ‘graduation to the grave’.
View into meeting room Seating area Reception counter / Green wall Magazine, newspaper display
Signage detail Bench detail Green wall Seating area
View into meeting room Seating area Reception counter / Green wall Magazine, newspaper display
Signage detail Bench detail Green wall Seating area
PPS Inner Circle Lounge
PPS INTEGRATED REPORT 201730

FULL CIRCLEPPS has expanded our range of services to members to further unlock the PPS value proposition.
In mid-2017 we established a new support unit offering fiduciary services such as drafting wills and winding up deceased estates. PPS is now the only South African financial services provider with an end-to-end portfolio of solutions aimed exclusively at the unique needs of professionals.
Digitalisation, innovation and disruption are shaping industries and economies. Professionals – young and older – will lead the changes. As such, PPS partnered with world renowned Singularity University to host an exclusive Exponential Forum for our members. Scheduled for the end of May 2018, members will discuss opportunities that may arise from concepts such as robotics, 3D printing, advances in health and medicine, biotech, artificial intelligence, the Internet of Things (IoT), the future of jobs and other emerging trends.
PPS FOUNDATION & PPS EDUCATIONAL TRUST Message from the Chairperson of the PPS Foundation and PPS Educational TrustsThe year 2017 was one of many milestones for the PPS Foundation (the Foundation), such as reaching our first anniversary and obtaining our Public Benefit Organisation (PBO) registration. After barely two years in formal existence, we are thrilled with the progress made against our 2017 goals. Yet, we remain most aware of the tough challenges that still lie ahead.
Indeed, as we traversed the country visiting schools and universities in the latter part of 2017, we gathered first-hand insights into real educational needs. South Africa’s education facilities still mirror the country’s skewed socio-economic landscape. We were motivated to work harder and more urgently to create opportunities for professionals to emerge.
Against the background of a turbulent educational environment and a depressed economy, the Foundation was able to increase its bursary support and graduate intake for 2017. We also stabilised our costs, despite heightened demand for funding.
Following the report by the Heher Commission and the President’s recent announcement on free tertiary education for poor and working-class, South Africa’s educational sector is experiencing an unprecedented paradigm shift. All stakeholders are concerned about how free education can be funded and what impact it will have on educational institutions.
The PPS Foundation is ready to play a part by contributing to science, technology, engineering, and mathematics (STEM) fields at our own discretion. We look forward to delivering an even more robust performance in the coming year, driven by innovative thinking that supports excellent outcomes.
I also thank all PPS members and my fellow trustees for their support, insight and vision they willingly contribute to the PPS Foundation.
Dr S N E Seoka
31

STRUCTUREThe PPS Foundation delivers its mandate through a set of standing programmes:
GRADUATEINTERNSHIP
DEVELOPMENT PROGRAMME
BURSARYPROGRAMME
PROFESSIONALSCONNECT
UNIVERSITY SUPPORT
PROGRAMME
PPS FOUNDATION
PPS INTEGRATED REPORT 201732

PPS Bursary Programme
The PPS Foundation’s bursary programme financially supports tertiary students who display meritorious academic capability and achievements. This programme is pitched at full-time students in Science, Technology, Engineering and Maths (STEM) studies, but we do consider students pursuing other aligned professional qualifications at recognised South African universities and tertiary technology institutions.
In 2017 the PPS Foundation awarded over 100 bursaries to students placed at 17 of the country’s 26 public universities. The Foundation’s recently gained PBO status significantly broadens our fund-raising opportunities.
The number of bursaries awarded has increased over the years:
2013 2014 2015 2016 2017
15 27 37 90 105
PPS Graduate Internship Programme
In 2017 we hosted 25 graduate interns, who underwent a rigorous 12-month learning and development programme while being posted throughout the group. Our 2018 graduate recruitment campaign, titled #Why PPS, attracted an impressive range of high calibre applicants.
This intake commenced in February and its 20 candidates were placed throughout the Group.
Professionals Connect
In 2017 our graduate outreach portal, Professionals Connect, launched an initiative to pair experienced professionals with graduates in 10-month mentoring partnerships. In this past year we initiated 11 pairings in fields such as chartered accountancy, business analysis, law, human resources and biotechnology. Mentors were drawn from within and outside of the PPS membership base.
PPS also partnered with GetReady, which utilises an innovative approach to mentorship by immersing unemployed graduates in coaching, critical thinking and analysis while they solve practical corporate case studies.
University Support Programme
The Foundation revised our University Support Programme criteria to align all efforts to the PPS Foundation Trust’s mandate.
During October and November 2017, the Foundation engaged with faculty leadership to explore partnerships that will positively impact students and are of national interest or socio-economic relevance.
EMPLOYEE AND MEMBER VOLUNTEERISMThe Foundation works to mobilise PPS employees and members to become hands-on involved in supporting our corporate social responsibility (CSI) initiatives.
A notable project taken up by employee volunteers was the #Caring4Girls initiative in partnership with Imbumba Foundation, a non-profit organisation that collects and distributes sanitary towels to disadvantaged school girls.
Consumer Financial Education This year we piloted Consumer Financial Education workshops to students on select campuses across the country. These were well received and helped sensitise students and their universities to the PPS value proposition. The Foundation is exploring a partnership with the Black Management Forum’s Youth Chapter, which has begun spreading the word on campuses where we are not yet physically present.
33

INTELLECTUAL CAPITAL
PPS INNOVATIONTechnology has become a critical driver for providing a richer and more intuitive member experience. Leveraging new technologies deliver integrated and seamless member experiences, enabling our members to access PPS services, their advisors and their portfolios at a time and place of their choosing, using any smartphone, tablet or computer.
ACCESS • InTouch
In 2014 we launched the InTouch interface that enables members to update personal details, view their portfolios and profit share accounts, access their documents and request services. Members can also submit claims and medical reports electronically.
By year-end over 41 000 members had registered on InTouch.
InTouch also includes a new quoting tool that enables advisors to seamlessly and quickly interact with members. This quoting tool is being further enhanced during 2018.
• PPS mobile application
In 2016 we launched the PPS for Professionals App as a secure, convenient way for members to access their PPS information from a smartphone. The app offers drill-down views of all PPS portfolio products such as investments, insurance and medical aid – as well as profits accrued in each member’s PPS Profit-Share Account. The Invest Now functionality enables placing new investments, topping up existing investments, and switching or making withdrawals. Added benefits are daily tracking of investment financial indicators and access to key documents such as tax certificates.
Approximately 3 500 members have downloaded the app.
• PPS Horizon
The financial services industry is undergoing significant transformation in how advisory services are provided. These changes are being driven by new regulations, changing demographics and technological advances. PPS Horizon enables members to plan for financial goals and retirement.
Launching PPS Horizon was the first step in our journey to provide additional digital channels for member engagement. During 2018 we will launch insurance-related digital interfaces for members, while also re-engineering underwriting experiences, claim processes and membership on-boarding.
Driving communication across social media
A PPS social media presence has become essential to swift and accurate interaction with members. We actively align our social media messaging to support ongoing business activities.
LOOKING AHEADWe are building digital capabilities that create time, value and relevance for our members and advisers, making member interaction with PPS more intuitive and productive than ever before.
PPS INTEGRATED REPORT 201734

LEADERSHIPAND
GOVERNANCE
35

PPS HOLDINGS TRUST
FRONT ROW
Mr E A MoollaB IurisPractising AttorneyIndependent Non-Executive Chairman
Mr U D JivanBA, LLBPractising AttorneyConveyancer and Notary PublicIndependent Non-Executive Trustee
Mr B R TophamB Compt (Hons), B Proc, LLM, CA(SA)Chartered Accountant and AttorneyIndependent Non-Executive Trustee
Mr I J SmitB Com (Hons), FASSAGroup Chief Executive Officer
MIDDLE SEATED
Mr I KotzéB PharmExecutive Director: Pharmaceutical Society of South AfricaIndependent Non-Executive Trustee
Mr P RanchodB Compt (Hons), CA(SA), MBL, H Dip Business Data ProcessingIndependent Director and Business ConsultantIndependent Non-Executive Trustee
Ms P NatesanB Com (Acc) (Hons), CA(SA)Executive: Centre for Corporate Governance at the Institute of Directors in Southern AfricaIndependent Non-Executive Trustee
BACK ROW
Mr S TrikamjeeB Com (Hons), CA(SA)Chartered AccountantIndependent Non-Executive Trustee
Prof M W SonderupB Pharm, MB ChB, FCP(SA)Senior Specialist, Groote Schuur Hospital and Lecturer, University of Cape Town Independent Non-Executive Trustee
Mr M PillayHDE, BSc Eng (Civil, Environmental), MBAChief Executive Officer: South African Institution of Civil Engineering Independent Non-Executive Trustee
Dr C M KrügerMB ChB, M Prax Med, M Pharm MedFamily PhysicianIndependent Non-Executive Trustee
PPS INTEGRATED REPORT 201736

Mr C ErasmusB Sc, FIA, FASSADirector of CompaniesIndependent Non-Executive Trustee
Dr D P du PlessisB Sc (QS), Doctor of Business AdministrationDirector of CompaniesIndependent Non-Executive Trustee
Mr N C NyawoB Com (Hons), CA(SA), MBA Standard Bank Group: Head of MIS Global Markets Africa FinanceIndependent Non-Executive Trustee
Ms D L T DondurB Acc (Hons), B Compt, CA(SA), MBADirector of CompaniesIndependent Non-Executive Trustee
Dr S N E SeokaB Pharm, PhD, FPSPharmacistIndependent Non-Executive Deputy Chairman
Prof H E WainerB Acc, CA(SA)Chartered Accountant and Registered AuditorIndependent Non-Executive Trustee
Mr J A B DownieBSc, MBA, CFPAsset Consultant and Professional TrusteeIndependent Non-Executive Trustee
Mr V P RimbaultB Sc Eng (Mech)Chief Executive Officer: The South AfricanInstitution of Mechanical EngineeringIndependent Non-Executive Trustee
Dr F MansoorBDS, MBAChief Executive Officer: The Integrated Dental EcosystemIndependent Non-Executive Trustee
Adv T N AboobakerBA, LLBPractising Senior AdvocateIndependent Non-Executive Trustee
BACK ROW
MIDDLE SEATED
FRONT ROW
37

FRONT ROW
PPS INSURANCE
Mr E A MoollaB IurisPractising AttorneyIndependent Non-Executive Chairman
Mr C ErasmusB Sc, FIA, FASSADirector of CompaniesIndependent Non-Executive Chairman
BACK ROW
Mr S TrikamjeeB Com (Hons), CA(SA)Chartered AccountantIndependent Non-Executive Director
Dr C M KrügerMB ChB, M Prax Med, M Pharm MedFamily PhysicianIndependent Non-Executive Director
Dr S N E SeokaB Pharm, PhD, FPSPharmacistIndependent Non-Executive Director
Mr J A B DownieB Sc, MBA, CFPAsset Consultant and Professional TrusteeIndependent Non-Executive Director
PPS INTEGRATED REPORT 201738

Mr I J SmitB Com (Hons), FASSAGroup Chief Executive OfficerExecutive Director
Mrs T BoeschB Com (Hons), CA(SA)Group Chief Financial OfficerExecutive Director
Prof H E WainerB Acc, CA(SA)Chartered Accountant and Registered AuditorIndependent Non-Executive Deputy Chairman
Mr P RanchodB Compt (Hons), CA(SA), MBL, H Dip Business Data ProcessingIndependent Director and Business ConsultantIndependent Non-Executive Director
Mr N J BattersbyB Sc Eng (Mech), B Com (Hons), MBA, CFPChief Executive: PPS InvestmentsExecutive Director
Ms D L T DondurB Acc (Hons), B Compt, CA(SA), MBADirector of CompaniesIndependent Non-Executive Director
Dr D P du PlessisB Sc (QS), Doctor of Business AdministrationDirector of CompaniesIndependent Non-Executive Director
BACK ROW
Mr N G PayneB Com (Hons), CA(SA), MBLDirector of CompaniesIndependent Non-Executive Director
39

PPS GROUP EXECUTIVE COMMITTEE
FRONT ROW
Mr D SemwayoB Com (Hons), FASSA, CFAGroup Executive: Actuarial and Technical
Mr N HoosenB Acc, MBAChief Executive: PPS Short-Term Insurance
BACK ROW
Mr Q J AugustineB Sc (Actuarial Science), PG Dip (Actuarial Science), FIAGroup Executive: Member Value Proposition
Mrs L A DlaminiBA, LLM (Tax law)Group Executive: Human Resources
Mr S R ClarkB ComGroup Executive: Life Administration and Systems
Mr V E BarnardB ComGroup Company Secretary
Mrs A N SeboniB Com, MAPGroup Executive: Brand, Marketing and Communications
PPS INTEGRATED REPORT 201740

Mr I J SmitB Com (Hons), FASSAChief Executive Officer
Mr W J MoutonB ProcExecutive: Life Broker Services
Mr W J LynchCAIB(SA), PB(SA), MDP, PG Dip (Management), MBA, AMP (Harvard)Group Executive: Business Change and Strategic Development
Dr H D P HoffmanMB ChB, M Med (Paed), FCP(SA)Chief Executive: PPS Healthcare Administrators
Mr N J BattersbyB Sc Eng (Mech), B Com (Hons), MBA, CFPChief Executive: PPS Investments
Mrs T BoeschB Com (Hons), CA(SA)Chief Financial Officer
Mr N J CoetzeeB Com (Hons), CFA, CFPExecutive: Internal Distribution
41

PPS INVESTMENTS
Mr M J JacksonBA (Hons), MAIndependent Non-Executive Director
Mr N G PayneB Com (Hons), CA(SA), MBLDirector of CompaniesIndependent Non-Executive Director
Mr I J SmitB Com (Hons), FASSANon-Executive Director
Mrs T BoeschB Com (Hons), CA(SA)Non-Executive Director
Mr N J BattersbyB Sc Eng (Mech), BCom (Hons), MBA, CFPChief Executive: PPS Investments
Mr E A MoollaB IurisIndependent Non-Executive Chairman
Mr P J KoekemoerB Com (Hons), CA(SA), CFP, CFAIndependent Non-Executive Director
Mr A C PillayB Bus Sc, CA(SA), CFA, AMP (Harvard)Independent Non-Executive Director
PPS INTEGRATED REPORT 201742

FRONT ROW
PPS SHORT-TERM INSURANCE
Mr P D V RademeyerCTA, CA(SA)Director of CompaniesIndependent Non-Executive Director
Mr C ErasmusB Sc, FIA, FASSADirector of CompaniesIndependent Non-Executive Director
Mr M J JacksonBA (Hons), MANon-Executive Chairman
Mr P RanchodB Compt (Hons), CA(SA), MBL, H Dip Business Data ProcessingIndependent Director and Business ConsultantIndependent Non-Executive Director
BACK ROW
Mr I J SmitB Com (Hons), FASSANon-Executive Director
Mrs T BoeschB Com (Hons), CA(SA)Non-Executive Director
Mr N HoosenBAcc, MBAChief Executive
Mr H J R de JonghBAcc (Hons), CA(SA)Non-Executive Director
Ms F JabaarBAcc (Hons), CA(SA)Non-Executive Director
43

PPS HEALTHCARE ADMINISTRATORS
FRONT ROW
Mr S J van MolendorffB Compt (Hons), CA(SA)Chief Financial Officer
Mr I KotzéB PharmNon-Executive Director
Mr N C NyawoB Com (Hons), CA(SA), MBANon-Executive Director
BACK ROW
Mr I J SmitB Com (Hons), FASSANon-Executive Director
Dr C M KrügerMB ChB, M Prax Med, M Pharm MedNon-Executive Director
Mr M J JacksonBA (Hons), MAChairmanNon-Executive Director
Mrs T BoeschB Com (Hons), CA(SA)Non-Executive Director
Dr H D P HoffmanMB ChB, M Med (Paed), FCP(SA)Chief Executive
PPS INTEGRATED REPORT 201744

GOVERNANCE AND MANAGEMENT
STRUCTURE

GOVERNANCE STRUCTURE
CORPORATE GOVERNANCE REPORT
GOVERNANCEThe holding entity of the PPS Group is the Professional Provident Society Holdings Trust (PPS Holdings Trust). Its primary operating subsidiary is Professional Provident Society Insurance Company Limited (PPS Insurance). The key operating subsidiaries of PPS Insurance are Professional Provident Society Short-Term Insurance Company Limited (PPS Short-Term Insurance), Professional Provident Society Investments Proprietary Limited (PPS Investments) and Professional Provident Society Healthcare Administrators Proprietary Limited (PPS Healthcare Administrators). Good corporate governance is an integral part of the PPS Group’s operations and the PPS Group is fully committed to the principles of King IV and the SAM Pillar II Risk Management requirements. In terms of the Pillar II Risk Management requirements, PPS Insurance is required to adopt, implement, and document an effective governance framework that provides for the prudent management and oversight of its insurance business and adequately protects the interests of its policyholders.
PPS MEMBERS
PPS Holdings Trust Board of Trustees
PPS Holdings Trust Audit Committee**
Nominations Committee PPS Insurance Company Board Subsidiary Company Boards
Remuneration Committee
Social and Ethics Committee* Risk Committee Actuarial Committee
Group Audit Committee*
Executive Management Committee
Risk Management Function#
Compliance Function# Actuarial Function# Internal Audit# External Audit##
* These are statutory committees with a direct reporting line to the PPS Insurance Board.
** This is a statutory committee, required in terms of the Trust Deed of PPS Holdings Trust, with a direct reporting line to the PPS Holdings Trust Board.
# These functions also have direct reporting lines to the appropriate board committees.
## External audit also has a direct reporting line to the boards of PPS Holdings Trust, PPS Insurance and its subsidiaries, and to PPS Members.
PPS INTEGRATED REPORT 201746

The governance framework consists of three parts being:
• Boards and board committees – This pertains to the composition, governance and structure of the PPS Holdings Trust Board of Trustees, the PPS Insurance Board of Directors, the boards of directors of the operating subsidiary companies, with well-defined roles and responsibilities, as well as statutory and other board committees, being the PPS Holdings Trust Audit Committee, the Group Audit, Risk, Social and Ethics, Actuarial, Remuneration and Nominations Committees, as well as the Risk and Audit Committees established by certain subsidiaries.
• Risk management system – The risk management system includes the following key policies:
– Enterprise Risk Management Framework
– Risk Appetite Policies
– Fit and Proper Policy
– Remuneration Policy
– Asset-Liability and Investment Management Policy
– Reinsurance and Other Risk Transfer Policy
– Financial Risk Policy
– Insurance Risk Policy
– Strategic and Operational Risk Policy
– Fraud and Corruption Policy and Response Plan
– Own Risk and Solvency Assessment (ORSA) Policy
– Data and Reporting Policy.
• Internal control system.
The reviewed and updated PPS Governance Framework provides for the prudent management and oversight of PPS, as well as adequately protecting the interests of PPS’ members. The framework is appropriate given the nature, scale and complexity of the PPS Group and its associated risks and is based on key principles as set out in this report.
TRANSPARENT ORGANISATIONAL STRUCTUREThe governance framework provides an adequate, transparent organisational structure with a clear allocation and appropriate segregation of responsibilities. The roles and responsibilities of persons accountable for the management and oversight of PPS are clearly defined. The PPS Group is governed by a unitary board of trustees, assisted by boards of directors, board committees and management committees.
An appropriate system of delegation is in place, in terms of which the direction of the operations of the PPS Group has been delegated to the PPS Insurance Board. The PPS Insurance Board has delegated some of the activities and tasks associated with its role and responsibilities to board committees, the
Group Executive Committee, senior management and other employees of the PPS Group.
FIT AND PROPERIn terms of BN 158 of 2014 (Governance and Risk Management Framework) and BN 158 of 2015 (Fit and Proper Requirements), the following persons must, at all times, meet Fit and Proper requirements:
• Trustees and directors
• Senior management, being the Group Chief Executive (Chief Executive) and persons reporting directly to the Chief Executive with decision-making powers
• Heads of Control Functions
• Public Officers
• Auditors
• Principal Officers
• Significant owners of insurance companies in the PPS Group.
The PPS Group Fit and Proper Policy facilitates sound and prudent management of PPS by including requirements which are based on the principles of honesty and integrity, competence, qualifications, ongoing professional development and experience. Fit and Proper checks for the aforementioned persons are conducted on an annual basis. The draft Prudential Standards, as released by the Financial Services Board, will be implemented when they come into effect.
RISK MANAGEMENT SYSTEMThe risk management system comprises the totality of strategies, policies and procedures for identifying, measuring, monitoring, managing and reporting of all reasonably foreseeable current and emerging material risks, and is part of the day-to-day business activities conducted at the PPS Group. The system takes into account the probability, potential impact, velocity and duration of risks and is adapted as the business and the external environment change. The system supports the boards of directors and trustees in meeting their responsibilities relating to the furtherance of the safe and sound operation of the PPS Group and the protection of its members. The objectives of the PPS Group are aligned with its environmental policies. The risk management system takes into account the alignment of sustaining and growing the business while preserving the environment.
The risk management system comprises the following components:
• A clearly defined and documented risk management strategy, which considers the overall business strategy and business activities
47

CORPORATE GOVERNANCE REPORT (continued)
• Documented procedures which clearly define the decision-making processes within the framework of the risk management system
• An adequate written overall risk management policy and component policies, consistent with the risk management strategy
• Appropriate processes, procedures, and tools for identifying, measuring, monitoring, managing, and reporting (including communication and escalation mechanisms) on all material risks
• Reports to inform senior management, the Group Risk Committee, and the boards of directors and trustees on all material risks faced by the PPS Group and on the effectiveness of the risk management system itself
• Processes for ensuring adequate contingency planning, business continuity, and crisis management.
The detailed particulars of the risk management system are set out in the PPS Group Enterprise Risk Management Framework.
INTERNAL CONTROL SYSTEMThe internal control system consists of the totality of strategies, policies, procedures, and controls to assist the boards of directors, trustees and managing executives in the fulfilment of their oversight and management responsibilities. The PPS Group has adopted a Five Lines of Assurance model, supported by a combined assurance framework to facilitate and ensure effective governance across all processes and functions.
The internal control system provides the boards of directors, trustees, and managing executives with reasonable assurance from a control perspective that the business is operated consistently within the following parameters:
• Business objectives of PPS
• Strategy determined by the boards of directors and trustees. The detailed particulars of the strategic planning process are set out in the Strategic Planning and Capital Allocation Framework
• Key business, information technology and financial policies and processes, as well as related risk management policies and procedures, determined by the boards of directors and trustees
• Applicable laws and regulations.
The internal control system comprises the following components:
• Appropriate controls to ensure the availability and reliability of financial and non-financial information
• Annual compliance plan
• Appropriate segregation of duties and controls to ensure that such segregation is observed
• Key business procedures and policies
• Written inventory of key procedures and policies, and of the key controls in place in respect of such procedures and policies
• Training in respect of relevant components of the internal control system, particularly for employees in positions of trust or responsibility, or carrying out activities that have significant risk
• Regular monitoring of all controls to ensure that the totality of controls form a coherent system, and that the internal control system functions as intended, fits within the overall governance framework and complements the risk identification, risk assessment and risk management activities
• Regular independent testing and assessments to determine the adequacy, completeness and effectiveness of the internal control system and its usefulness to the boards of directors, trustees, and managing executives for controlling the operations
• Delegations of authority, approved by the boards, which are regularly reviewed by the boards of directors.
CONTROL FUNCTIONSIn terms of Board Notice 158 of 2014, insurance companies must have certain control functions in place. The following four key control functions are in place within the two PPS Group insurance companies:
• Risk management
• Actuarial
• Compliance
• Internal audit.
The control functions are structured to include the necessary authority, independence, resources, expertise, access to the boards and all relevant employees, as well as information to enable them to exercise their authority and perform their responsibilities. Where appropriate, the Heads of Internal Audit and Actuarial Control Functions may be outsourced – subject to the provisions of the Outsourcing Policy – in light of the nature, scale, and complexity of the business, risks, and legal and regulatory obligations. The Actuarial Control Functions are performed by Deloitte in terms of outsourced arrangements. Mr C van der Riet of Deloitte served as the Head of the Actuarial Control Function for PPS Insurance until 30 September 2017, when he left Deloitte to take up a position at an insurer, and was replaced by Mr G T Waugh (also of Deloitte) with effect from 1 October 2017. Mr J van der Merwe of Deloitte serves as
PPS INTEGRATED REPORT 201748

the Head of the Actuarial Control Function for PPS Short-Term Insurance. The Internal Audit Control function is performed by KPMG in terms of an outsourced arrangement. Ms I Fourie of KPMG serves as the Head of the Internal Audit Control Function for both insurance companies in the PPS Group. The Compliance and Risk Management Control Functions are performed in-house and may only be outsourced with the approval of the Registrar. Mrs T Boesch serves as the Head of the Compliance and Risk Management Control Functions for PPS Insurance. For PPS Short-Term Insurance, Mr H van Heerden serves as the Head of the Risk Management Control Function, while Mr J Andrews serves as the Head of the Compliance Control Function.
The existence of the control functions does not relieve the boards of directors and trustees, or senior management, from their respective governance and related responsibilities. The governance framework will continue to evolve to ensure compliance with emerging legislation and to enhance the ability of the boards of directors and trustees, managing executives and heads of control functions to manage PPS soundly and prudently. The Actuarial, Audit, Risk, Remuneration and Social and Ethics Committees fulfil a key role in ensuring good corporate governance within the PPS Group. Processes are reviewed regularly to ensure compliance with legal obligations and codes of governance.
GOVERNANCE DEPARTMENTSThe following departments ensure good corporate governance throughout the PPS Group:
GROUP COMPANY SECRETARIATThe chairmen of the Boards of PPS Holdings Trust, PPS Insurance and its subsidiaries, the board sub-committees, and the Chief Executive are assisted by the Group Company Secretary in ensuring good corporate governance and adherence to the PPS Group’s governance policies. By working closely with the respective board chairmen and the Chief Executive of the PPS Group, the Group Company Secretary ensures that the agendas for board, board committee and the Group Executive Committee meetings address the key business and governance issues, and that the boards are adequately informed to enable them to discharge their duties and make informed decisions. He is responsible for the determination of the corporate calendar to ensure all required matters are addressed by the respective boards and committees. The Group Company Secretary also has a significant role in supporting the Group Nominations Committee in the discharge of its duties to ensure that the PPS Group boards and committees are appropriately constituted and have appropriate Terms of Reference, and that the board and committee members comply with Fit and Proper requirements, are inducted on appointment, trained and evaluated. The Group Company Secretary co-ordinates the contents and holding of
the annual directors’ and trustees’ training programme, as well as access to and attendances at governance programmes by external service providers in accordance with best practice and King IV.
All trustees and directors have direct access to the services of the Group Company Secretary, who is also appointed as the Secretary of PPS Holdings Trust and as a member and Secretary of the Group Executive Committee. He advises them on all corporate governance matters, on board procedures, and on compliance with PPS Holdings Trust’s trust deed and PPS Group entities’ memoranda of incorporation and trust deeds.
Comprehensive agendas and papers are provided to the boards by the Group Company Secretary (and by subsidiary Company Secretaries, as applicable) in advance of the meetings of the boards and board committees, including circulation of committee minutes and reports to the appropriate boards. The Group Company Secretary also has responsibility for the secretarial functions of all subsidiary companies, and to ensure that the minutes and statutory records of all PPS Group board and board committee meetings are prepared and maintained in the appropriate PPS Group records.
Members of the boards have access to independent professional advice, as may be required, through the office of the Group Company Secretary at the PPS Group’s expense, in order to discharge their responsibilities as directors and trustees.
GROUP LEGALAll legal advisers employed in such capacity report to the Head of Legal and Compliance and are responsible for managing legal risk that may arise during the course of the PPS Group’s activities, and ensuring that these risks are appropriately mitigated across all entities. This is achieved by providing or sourcing appropriate legal advice, ensuring that legal risks are optimally negotiated, documented, and monitored, and that the necessary controls are implemented.
GROUP COMPLIANCEThe PPS Group boards are ultimately accountable for compliance with applicable laws and adopted non-binding rules, codes, and standards. The primary objective of the compliance function is to assist the boards with this responsibility. Management is committed to ensuring that the business is run with integrity, complies with all regulatory and best practice requirements, and is conducted in accordance with the highest ethical standards. The appointed Compliance Officer is responsible for the effective implementation of the Compliance Risk Management Framework and for facilitating compliance throughout the business by creating awareness, independent monitoring, reporting and the provision of practical solutions or recommendations. However, the primary responsibility
49

CORPORATE GOVERNANCE REPORT (continued)
for complying with any regulatory requirement lies with all members of staff conducting the particular transaction or activity to which the requirement applies.
PPS has implemented a combination of a centralised and a decentralised compliance function. Group Compliance is the central department, whose main role is the development of the compliance policy (the boards determine such policy) and related standards to ensure a consolidated compliance risk management and reporting process throughout the PPS Group. The decentralised compliance function consists of business units which have their own compliance functions that are responsible for implementing the PPS Group policies, monitoring the activities of the business units and reporting the status of compliance to Group Compliance. PPS Investments, PPS Healthcare Administrators, PPS Short-Term Insurance and Professional Provident Society Insurance Company (Namibia) Limited (PPS Namibia) have their own business unit compliance officers with oversight by Group Compliance for compliance related matters. Group Compliance assumes direct responsibility for compliance risk management in PPS Insurance and its divisions.
The compliance function performs its activities in accordance with these five principles:
• All legislative requirements, such as acts, bills, directives, practice notes, industry codes of conduct, and relevant discussion documents, which impose obligations on PPS are identified and interpreted continuously
• Compliance requirements are addressed in business processes
• Management and staff are trained on the compliance requirements relevant to their roles
• Compliance monitoring is conducted to provide assurance on the level of compliance
• Compliance incidents or suspected incidents are reported and managed.
GROUP RISK MANAGEMENTThe taking of risk, in an appropriate manner, is an integral part of business. Success relies on optimising the trade-off between risk and reward, following an integrated risk management process, and by considering all internal and external risk factors. While conducting its business, PPS is exposed to, and needs to take on, a variety of risks. The long-term sustained growth, continued success, and reputation of PPS are critically dependent on the quality of risk management. Management is committed to applying best practice and standards, including the implementation of the ISO 31000 standard on Risk Management, SAM Pillar II Risk Management requirements and King IV. The PPS Group Enterprise Risk Management Framework is aligned to such standards.
PPS’ risk philosophy is underpinned by its objective of member value creation, meeting member benefit expectations and achieving sustainable profitable growth, in a manner that is consistent with members’ expectations of PPS’ risk appetite. This means the PPS Group must ensure that a high-quality risk management culture is instilled throughout its operations, built on the following main elements:
• Adherence to the value system of PPS
• Proactive risk management
• A risk awareness culture via management of the business units
• Disciplined and effective risk management processes and controls, and adherence to risk management standards and limits
• Compliance with the relevant statutory, regulatory, and supervisory requirements by way of a robust compliance risk management process
• Regular monitoring by Compliance
• Review of control measures by Internal Audit
• Oversight of the risk management process by the Group Risk Committee.
The boards ensure that PPS has implemented an effective ongoing process to identify risk, measure its potential outcome and then implement what is necessary to proactively manage these risks. This responsibility includes setting the risk appetite and tolerance of the PPS Group, measuring the relevant risks against it, and ensuring that the necessary controls and service level agreements are in place, are effective and are adhered to at all times. Assurance of good corporate governance is achieved through the regular measurement, reporting, and communication of risk management performance, which includes progress with risk management plans and improvements to risk management maturity.
Management and employees are responsible for the management of risk in accordance with the Enterprise Risk Management Framework, and incorporating risk management into the day-to-day operations of the PPS Group. Management is assisted by the risk management control function in performing annual risk assessments and updating these quarterly, and agreed mitigating actions are managed utilising CURA software. Risk registers are produced from CURA and reviewed monthly by the Group Executive Committee and quarterly by the Group Risk Committee for strategic and major operational risks. A Risk Report containing the findings and conclusions of the risk environment of the PPS Group is prepared on a quarterly basis and is reviewed by the Group Risk Committee and the respective boards. Other operational risk registers are continuously managed by the relevant business areas.
PPS INTEGRATED REPORT 201750
An opportunity assessment methodology has been implemented by PPS. The purpose of using this methodology is to identify opportunities and the material risks associated with new opportunities to enhance the quality and depth of the risk management process. This methodology also enables an assessment of current strategic objectives against those derived, based on opportunities and the prioritisation of the efforts to get maximum return based on readily accessible resources.
The PPS Holdings Trust Audit Committee, the Group Risk, Audit, Actuarial, Remuneration, and Social and Ethics Committees, as well as the Risk and Audit Committees of subsidiaries, make reports and recommendations to the boards, enabling them to discharge their responsibilities in regard to risk management.
MANAGEMENT OF FRAUD AND CORRUPTION RISK AND CONFIDENTIAL REPORTINGThe PPS Group maintains a Fraud and Corruption Policy and Response Plan, and a Confidential Reporting Policy to manage fraud and corruption risk in the PPS Group, and to ensure that employees are able to report suspicious activities without fear of retribution. An ethics hotline, operated independently from the PPS Group by Deloitte, provides a facility to enable employees to report suspicious activities and unethical behaviour in a safe environment. All financial crime-related suspicious transactions and reports are managed by the Fraud Committee and other unethical behaviour is managed by the Human Resources Department.
PRINCIPLES AND PRACTICES OF FINANCIAL MANAGEMENTPPS Insurance issues insurance policies with a discretionary element of bonuses and is required to establish and maintain a document setting out its Principles and Practices of Financial Management (PPFM) and provide this document to policyholders. This document outlines PPS Insurance’s principles and practices of financial management, in order that policyholders can better understand the profit distribution principles and practices in place at PPS Insurance, as well as the investment strategy adopted by the PPS Insurance Board. The PPFM document is available to all policyholders on the PPS Group website at www.pps.co.za.
INFORMATION TECHNOLOGY (IT) GOVERNANCEThe PPS IT strategy is reviewed by the Group Risk Committee (GRC) and progress is tracked regularly through formal published project plans. This strategy is reviewed annually and
progress is highlighted for the GRC along with any adjustments that may have resulted from changed business strategies or environmental developments. This strategy is also regularly reviewed to ensure its alignment with business priorities.
PPS Group IT applies the standards recommended by the Information Technology Infrastructure Library (ITIL). ITIL is a set of good practices for IT service management that focuses on aligning IT services with the needs of business. These standards describe procedures, tasks and checklists that are not organisation-specific, and are recommended to be used for establishing a minimum level of competency. They allow the organisation to establish a baseline from which it can plan, implement and measure. They are used to demonstrate compliance and to measure improvement.
PPS Group IT performs annual ITIL maturity reviews which are presented to the GRC. Additionally, KPMG IT Advisory regularly performs IT control audits, King IV governance audits and an internal security ethical hack. These reviews are intended to provide the PPS Insurance Board with independent assurance on the effectiveness and state of internal controls, as well as confidence in the ability of IT to deliver the approved strategies.
PPS understands and respects that PPS members’ privacy is important to them. PPS limits the collection of personal information to what is necessary. PPS uses and shares personal information provided to it by members only in ways that PPS informs members of. PPS takes all reasonable security measures to prevent personal information from being used and shared for other purposes. The information security objective is to develop a cost-effective strategy that is in alignment with the PPS Group’s IT and business strategic objectives. The goal is to deliver this through effective risk management, where the investment in the relevant security controls is proportional to the risk exposure. The value delivery of information security is realised through the secure enablement of new business initiatives and the standardisation from a controls perspective of the environment, thereby reducing the number of incidents related to malicious code and unauthorised end-user modification of systems.
REGULATORY DEVELOPMENTSDuring the year under review, there was a significant volume of proposed legislation and amendments to existing legislation, all of which will impact the governance and reporting of governance within the PPS Group. This has placed additional responsibilities on the boards and management to ensure adherence to, and compliance with, the new requirements.
51

CORPORATE GOVERNANCE REPORT (continued)
The most important legislative changes for PPS are highlighted below:
1. SOLVENCY ASSESSMENT AND MANAGEMENT (SAM) The Financial Services Board (FSB) introduced a methodology for statutory reporting of assets, liabilities and solvency capital requirements for South African insurers, aligned to the European Union Solvency II standard. The official target date for SAM implementation is 1 July 2018. The SAM project at the Financial Services Board (FSB) is close to finalisation and the focus is now squarely on implementation efforts to ensure that the industry and the FSB are ready for implementation.
The PPS Group participated in the FSB’s consultative process preceding the implementation of SAM and numerous SAM returns have subsequently been submitted, including Quantitative Impact Studies, Annual Returns, Quarterly Returns and an Own Risk and Solvency Assessment (ORSA). Based on these, the PPS Group insurance companies would remain financially sound under the SAM framework and are well-positioned to deal with SAM requirements. The challenge faced is around embedment to ensure that measures designed are entrenched in decision-making and the day-to-day operations of the business.
The Comprehensive Parallel Run is currently underway, which will allow a final opportunity for insurers and the FSB to establish and test resources, processes and systems to ensure a smooth transition to the effective implementation of SAM requirements.
2. TWIN PEAKS The ‘Twin Peaks’ model is a strategy to divide the financial regulatory system into two regulatory regimes. These two regimes will be headed by a Prudential Authority and a Financial Sector Conduct Authority. The FSB will regulate market conduct and the prudential regime will be regulated by the South African Reserve Bank. The objectives of this model are financial stability, consumer protection, combating of financial crimes, and transparency. These changes will be funded, among other things, by increasing the levies paid by financial institutions.
In 2015 the Financial Sector Regulation Bill was sent to Parliament. This is an overarching bill that confirms the mandates and structures of both regulators and includes TCF principles. The bill provides the legislative framework for the functions of the two new regulators. The bill was finalised during 2017 and the Financial Sector Regulation Act was promulgated. The act has been signed by the President, but has not become effective, as it must still be proclaimed.
3. LONG-TERM AND SHORT-TERM INSURANCE REGULATIONS ON DEMARCATION BETWEEN HEALTH POLICIES AND MEDICAL SCHEMES The regulations specify which types of contracts are regulated under the Long-term Insurance Act, No 52 of 1998 and the Short-term Insurance Act, No 53 of 1998, as health and accident policies. These are accordingly excluded from the Medical Schemes Act, No 131 of 1998, despite such contracts meeting the definition of the business of a medical scheme. The regulations seek to clearly demarcate the responsibility for supervision of medical schemes and health insurance products and ensure that health insurance products do not undermine the medical scheme environment. The draft regulations do not allow insurers to continue to provide Primary Healthcare insurance policies, but allow insurers to continue to provide Medical Expense Shortfall policies and non-medical expense cover as a result of hospitalisation policies in a manner that complements medical schemes, subject to strict underwriting and marketing conditions. These regulations became effective on 1 April 2017.
4. RETAIL DISTRIBUTION REVIEW (RDR) The FSB released a discussion paper outlining the Retail Distribution Review (RDR) in 2014.
The RDR paper sets out a total of 55 specific proposals that cover:
• Types of services provided by intermediaries
• Relationships between product suppliers and intermediaries
• Intermediary remuneration.
RDR will have a significant impact on how product suppliers and financial service providers conduct their business. RDR Phase 1 is being given effect through proposed amendments to the following regulatory instruments:
• The General Code of Conduct for Authorised Financial Services Providers and Representatives, issued under the Financial Advisory and Intermediary Services Act (“FAIS Act”), No 37 of 2002
• Fit and Proper Requirements for Financial Services Providers, issued under the FAIS Act
• Regulations under the FAIS Act
• Regulations and Policy Protection Rules under the Long-term Insurance Act, No 52 of 1998 and Short-term Insurance Act, No 53 of 1998.
The FSB provided a further update on RDR as part of its annual Conduct of Business Seminar, which took place in November 2017. The FSB indicated that further
PPS INTEGRATED REPORT 201752

consultation on, among others, the following matters are planned for 2018: a) the criteria in order to use the designation ‘financial planner’ b) amendments to the applicable FAIS Codes of Conduct to effect ‘clean pricing’ on linked investment service platforms c) standards for product comparison/aggregation services d) removal of commissions on single premium insurance investment policies, possibly subject to low-income exceptions.
5. FINANCIAL INTELLIGENCE CENTRE (FIC) AMENDMENT ACT The draft Financial Intelligence Centre Amendment Bill was first released during 2015. This bill follows National Treasury’s and the FIC’s Consultation Paper on the Review of the Financial Intelligence Centre Act (FICA) which was released in May 2014. The bill amends the Financial Intelligence Centre Act and aims to enhance South Africa’s ability to combat financial crimes by proposing measures to address threats to the stability of South Africa’s financial system posed by money laundering and terrorist financing. The bill also seeks to more closely align South Africa’s anti-money laundering and counter terrorist financing legislation with international standards. The Bill was finalised during 2017 and the Financial Intelligence Centre Amendment Act was proclaimed with effect from June 2017.
6. INSURANCE ACTOn 17 April 2015, the National Treasury and the FSB released the draft Insurance Bill 2015 for public comment. The bill had been in development for the past seven years. The bill gives effect to the SAM framework and provides a consolidated legal framework for the prudential supervision of the insurance sector that is consistent with international standards for insurance regulation and supervision. It is envisaged that the bill will replace those sections of the Long-term Insurance Act and the Short-Term Insurance Act that relate to prudential supervision.
The objective of the bill is to establish a legal framework for insurers and insurance groups that:
• Facilitates the monitoring and preserving of the safety and soundness of insurers
• Enhances the protection of policyholders and potential policyholders
• Increases access to insurance for all South Africans
• Contributes to the stability of the financial system in general.
The bill was tabled in Parliament on 28 January 2016. During June 2017, National Treasury published a detailed response document to the public comments
received on the bill. New draft list versions of Schedules 1 and 3 to the bill were also released for public comment during October 2017. The amendments to Schedule 1 seek to further support the conduct mandate of the Financial Sector Conduct Authority, while the amendments to Schedule 3 seek to clarify the approach to transitioning the registration of insurers under the existing Long-term Insurance and Short-term Insurance Acts to licenses under the bill. The Insurance Act was approved by Parliament on 28 November 2017.
7. LONG- AND SHORT-TERM INSURANCE: REPLACEMENT OF POLICYHOLDER PROTECTION RULESA replacement of the Policyholder Protection Rules (PPRs) under the Long-term Insurance Act and Short-term Insurance Act was published in December 2016. The amendments to the PPRs are a step towards Government’s move to a ‘Twin Peaks’ model of regulation and the implementation of the Treating Customers Fairly (TCF) approach to improved customer protection in the financial services industry. The conduct of business reforms that will be given effect to through the PPRs are: RDR, enhanced disclosure requirements facilitating TCF, improved claims management processes, rules regarding advertising, brochures and similar communications, enhanced complaints management processes, premiums reviews, minimum data governance requirements and no negative option marketing.
The revised PPRs became effective on 1 January 2018.
8. LONG- AND SHORT-TERM INSURANCE: REGULATIONSProposed amended regulations under the Long-term Insurance Act and Short-term Insurance Act were published in December 2016. The conduct of business reforms that will be given effect to through the regulations are: limitations on persons who may enter into binder agreements, as well as prescribed maximum fees to be paid to binder holders and other outsourced relationships, general principles for determining remuneration, minimum data governance requirements and reducing maximum causal event charges from between 30% and 40% down to 5% over time. The particular focus of the comments received on the first draft of the regulations was on the amendments relating to the introduction of binder fee caps for financial advisors. Revised drafts of the Long-term Insurance Act and Short-term Insurance Act regulations were released for public comment during July 2017. The revised Regulations became effective on 1 January 2018.
53

CORPORATE GOVERNANCE REPORT (continued)
COMPLIANCE WITH THE PRINCIPLES OF KING IVThe King IV Report on Corporate Governance replaced King III in its entirety, and unlike its predecessors, the King IV Report is outcome-based. Four governance outcomes, viz: ethical culture, good performance, effective control and legitimacy, are guided and supported by 17 principles and over 400 recommended practices.
An assessment of compliance by the PPS Group with the King IV principles was conducted as part of the 2017 Group Compliance Programme, using the King IV Governance assessment instrument. The results of the assessment indicated that the PPS Group had satisfactorily applied 389 of the recommended practices, with 10 practices not being applicable to PPS and five practices which had not been applied.
Practice 36.a The chair of the governing body should not be a member of the audit committee. Not Applied
Commentary:
The Chairman of PPS Holdings Trust is one of six members of the PPS Group Audit Committee and one of three members of the PPS Holdings Trust Audit Committee and does not chair either of the committees. He provides valuable knowledge to the Committees and also provides a link between the two audit committees and has therefore been retained as a member. The Chairman of PPS Insurance is a member of the Group Audit Committee where he provides actuarial expertise and a link between the Actuarial and Group Audit Committees. For particulars of the responsibilities and functions of these committees, please refer to the Report of the Audit Committees in this Integrated Report.
Practice 83.a The notice period stipulated in the CEO’s employment contract and the contractual conditions related to termination should be disclosed.
Not Applied
Commentary:
Particulars of the Group Chief Executive’s employment contract are considered to be competitive information and are not publicly reported.
Practice 34.c The overview of the remuneration policy should include a description of the framework and performance measures used to assess the achievement of strategic objectives and positive outcomes, including the relative weighting of each performance measure and the period of time over which it is measured.
Not Applied
Practice 34.d The overview of the remuneration policy should include an illustration of the potential consequences on the total remuneration for executive management, on a single, total figure basis, of applying the remuneration policy under minimum, on-target and maximum performance outcomes.
Not Applied
Practice 35.b The implementation report must include an account of the performance measures used and the relative weighting of each, as a result of which awards under variable remuneration incentive schemes have been made, including: the targets set for the performance measures and the corresponding value of the award opportunity; and for each performance measure, how the organisation and executive managers, individually, performed against the set targets.
Not Applied
Commentary:
Detailed particulars of the above remuneration aspects are considered to be competitive information and are not publicly disclosed.
PPS INTEGRATED REPORT 201754
GOVERNANCE OF THE PPS GROUP BY THE BOARDSThe PPS Group is ultimately governed by PPS Holdings Trust, which has a unitary board of trustees, assisted by boards of directors and trustees of PPS Group entities and the committees as detailed below.
The wholly-owned principal operating subsidiary, PPS Insurance, has a majority of independent non-executive directors, eight of whom are nominated members of the PPS Holdings Trust Board (including the two ex officio appointees), and includes directors with specialist skills appropriate to the insurance and investment industries. The PPS Insurance Board is accountable to the PPS Holdings Trust Board for the achievement of strategic objectives determined by the PPS Holdings Trust Board in furthering the interests of its members. These objectives pertain to:
• Operational efficiency
• Investment returns
• Membership and sales growth
• Service to PPS members.
The primary operating subsidiaries of PPS Insurance are set out in the Trustees’ Report and their boards are comprised of executive and non-executive directors and trustees as set out in this report.
BOARD COMPOSITION, APPOINTMENTS AND SUCCESSION PLANNINGThe PPS Holdings Trust Board is comprised of 20 trustees, all of whom are independent non-executive trustees. In terms of its trust deed, PPS Ordinary Members may nominate and elect 10 members to the board of PPS Holdings Trust at its annual general meeting. At the invitation of the PPS Holdings Trust Board, a further six members of the current board of PPS Holdings Trust are, subject to the recommendations of the Group Nominations Committee and the approval of the PPS Holdings Trust Board, in accordance with the provisions of the trust deed, nominated to serve on the PPS Holdings Trust Board by professional associations whose members are significantly represented in the PPS membership base. The PPS Holdings Trust Board has co-opted a further two members for their specific skills, as provided for in the trust deed, which also stipulates that the Chairman and Deputy Chairman of PPS
Insurance are appointed ex officio to the board of PPS Holdings Trust. All PPS Holdings Trust Board members are appointed for specific terms and re-appointment is not automatic.
The PPS Holdings Trust Board appoints the members of its board committees and the board members of PPS Insurance, the PPS RA Fund and the PPS Beneficiaries Trust. In turn, the PPS Insurance Board appoints the members of its board committees and the board members of its subsidiaries.
Under delegated authority of the PPS Holdings Trust Board, the Group Nominations Committee, within its powers, evaluates, selects and recommends for appointment the PPS Group trustees and directors, including the Chief Executive, executive directors and non-executive directors/trustees and board committee members, taking into account the Fit and Proper and other regulatory requirements for the appointment of directors/trustees of long-term and short-term insurance companies and their holding entities.
The Group Nominations Committee considers trustee and director succession planning and makes appropriate recommendations to the PPS Group boards. This encompasses an evaluation of the skills, knowledge and experience required to add value to the PPS Group, as well as compliance with Fit and Proper requirements, for all trustees and directors, including PPS Holdings Trust trustees standing for re-election, as well as new candidates standing for election for the first time. All elections of trustees of PPS Holdings Trust are made in terms of a formal and transparent procedure and are subject to approval by the members of PPS Holding Trust at its annual general meeting. The PPS Holdings Trust Board has considered and is of the view that the PPS Group boards and committees are appropriately constituted to meet statutory requirements and the PPS Group’s needs.
Candidates who have been nominated for service on PPS Group boards are required to clearly identify any conflict, or potential conflict, of interest with the activities of PPS Holdings Trust, its subsidiaries and affiliates. Candidates who are financial advisors or intermediaries, or hold any office or interest, directly or indirectly, in any entity which competes in the same sphere of business as the PPS Group, do not qualify for appointment to any PPS Group Board.
55
CORPORATE GOVERNANCE REPORT (continued)
CHAIRMAN AND DEPUTY CHAIRMAN OF THE PPS HOLDINGS TRUST BOARD OF TRUSTEES Mr E A Moolla has held the position of Chairman of the PPS Holdings Trust Board of Trustees since 2012. Mr Moolla has indicated that he will step down as Chairman of the PPS Holdings Trust Board at the 22 May 2018 annual general meeting. The Board will be required to elect his successor at the first board meeting following the annual general meeting, scheduled to be held on 13 June 2018. Dr S N E Seoka has held the position of Deputy Chairman of the PPS Holdings Trust Board of Trustees since 2012. In terms of PPS Insurance’s Memorandum of Incorporation, the Chairman and Deputy Chairman of PPS Holdings Trust are appointed ex officio to the PPS Insurance Board and form part of the eight PPS Holdings Trust trustees nominated annually by the PPS Holdings Trust Board to serve on the PPS Insurance Board.
CHAIRMAN AND DEPUTY CHAIRMAN OF THE PPS INSURANCE BOARD OF DIRECTORSMr C Erasmus has held the position of Chairman of the PPS Insurance Board since 2014. Prof H E Wainer was appointed as Deputy Chairman of the board in 2015. In terms of PPS Holdings Trust’s trust deed, the Chairman and Deputy Chairman of PPS Insurance are appointed ex officio to the board of PPS Holdings Trust.
CHIEF EXECUTIVE OF THE PPS GROUPMr I J Smit was appointed as the Chief Executive of the PPS Group on 25 July 2016.
BOARD CHARTERS AND TRUST DEEDIn accordance with the principles of sound corporate governance, the Board Charters for the PPS Holdings Trust, the PPS Insurance and the subsidiary boards – modelled on the charter principles recommended by King IV and adapted to the requirements of PPS – incorporate the powers of the boards, providing a clear and concise overview of the division of responsibilities and accountability of board members, collectively and individually, to ensure a balance of power and authority. The Board Charters are reviewed annually to ensure continued compliance with regulation and best practice.
The trust deed of the PPS Holdings Trust incorporates key elements of the Companies Act, 2008, and its trustees have similar responsibilities and duties to those of company directors, including the statutory responsibilities imposed on directors by the Companies Act, in addition to their responsibilities and duties as trustees.
Committees of the boards act within board approved Terms of Reference and the chairman of each committee reports, as appropriate, to the board which constituted such committee at the scheduled meetings of that board. These Terms of Reference are reviewed annually to ensure continued compliance with regulation and best practice. Where appropriate, the minutes of the committee meetings are tabled at subsequent board meetings. The chairmen of the PPS Holdings Trust and PPS Insurance Boards are independent non-executive trustees/directors. At PPS Insurance, the roles of Chairman and Chief Executive are separated, with a clear division of responsibility to ensure distinction between their respective duties and responsibilities. The chairmen have no executive functions. The role of all trustees and directors is to bring independent judgment and experience to the boards’ decision-making process and to act in the best interests of the trust or company on whose board such trustee/director serves.
FUNCTIONING OF THE BOARDS AND BOARD COMMITTEESThe Group Executive Committee and various other management sub-committees, established by the Group Executive Committee, provide ongoing input and support to the boards, board committees and Chief Executive as and when required.
The members of the boards receive timely, accurate and relevant information to enable them to fulfil their duties. All new directors and trustees undergo a formal induction process, which includes meeting the PPS Group’s senior management to discuss key aspects of the business and the governance thereof, with comprehensive documentation regarding the governance and management structures of the PPS Group. All directors and trustees are encouraged to undertake continuing professional development, training and education throughout their term of office. The PPS Group sponsors membership of the Institute of Directors for its board members. Board members are provided on an ongoing basis with information and training relevant to the business of the PPS Group and the industries in which it operates. Board members also attend an annual training day on pertinent aspects of the business, strategy, regulation and the environment in which the PPS Group operates.
The chairmen’s key responsibilities are to provide leadership to the boards, to oversee the determination of strategy, to guide the process to ensure a balance in the composition of the boards, to ensure sufficient and open discussion of matters before the boards and to promote effective communication between executive and non-executive directors/trustees.
The Chief Executive has overall responsibility for the management of the PPS Group’s business and its operations,
PPS INTEGRATED REPORT 201756

in line with the policies and strategic objectives set and agreed on by the PPS Insurance Board. The Chief Executive reports to the PPS Insurance Board on the performance of the PPS Group and any other material matters at regular board meetings which are scheduled six times per annum. He reports on how the PPS Group has performed against key indicators following the monthly meetings of the Executive Committee, which manages the PPS Group’s business on a day-to-day basis. Key reports are reviewed at the meetings of the PPS Insurance Board when the Chief Executive highlights significant issues and other executive and non-executive directors are invited to contribute, as appropriate. Additional meetings of the boards are scheduled as may be required.
The Chief Executive also reports on the performance of PPS Insurance to the PPS Holdings Trust Board against the strategic objectives determined for PPS Insurance by the PPS Holdings Trust Board.
Additional papers on issues upon which the boards are required to make decisions are submitted, as appropriate, and members of senior management regularly attend board meetings by invitation to present papers and to deal with issues raised by the boards.
BOARD PERFORMANCE ASSESSMENTThe Group Nominations Committee is mandated by the PPS Holdings Trust and PPS Insurance Boards to institute formal and comprehensive board evaluation programmes for the assessment of the PPS Group’s trustees and directors in accordance with regulatory requirements. In terms of these programmes, the boards of PPS Holdings Trust and PPS Insurance, as well as the individual trustees and directors serving on those boards, are evaluated with the assistance of independent consultants in accordance with best local and international governance and board evaluation practices, including the Fit and Proper requirements stipulated by the FSB’s Board Notice 158. The results of the evaluations are reported to the boards and the identified areas for improvement are incorporated into the board training programme and agendas for scheduled meetings of the board. The most recent evaluations of the boards were performed in November 2017 by an independent assessor, The Board Practice. The assessments indicated that the PPS Group boards were effective in discharging their duties.
RETIREMENT OF BOARD MEMBERS BY ROTATIONOne-third of the 10 elected trustees of the PPS Holdings Trust, who are not representatives of a professional association or co-opted, and are appointed in terms of clause 5.3.1 of the Trust Deed, and who are in office as at the date of the annual general meeting, are subject to retirement by rotation at
least every three years, but may stand for re-election at the annual general meeting, subject to the approval of the Group Nominations Committee. The names and abbreviated curricula vitae of the trustees who are retiring by rotation and are eligible for re-election, as well as of new nominees standing for election, at the forthcoming annual general meeting to be held on 22 May 2018, are stated in the notice of annual general meeting commencing on page 167 and up to page 176 of this Integrated Report.
In accordance with the provisions of the trust deed, PPS Holdings Trust trustees who are representatives of professional associations and trustees who are co-opted to the Board are also appointed for a three-year term, after which they are required to retire, but may be nominated or co-opted for re-appointment by the PPS Holdings Trust Board.
INTERESTS IN CONTRACTS AND CONFLICTS OF INTERESTTrustees and directors are required to avoid conflicts of interest, where possible, and where it cannot be avoided, to inform the respective board/s on which they serve timeously of conflicts or potential conflicts of interest that they may have in relation to particular items of business and they are obliged to recuse themselves from discussions or decisions in relation to such matters. Trustees and directors are also required to disclose their interests in, and directorships of, other companies/entities in accordance with statutory requirements and to inform the boards when any changes occur. During the year ended 31 December 2017, none of the directors/trustees had disclosed any interest in contracts or arrangements entered into by the PPS Group. The Chief Executive is required to disclose any appointments to non-PPS Group Boards. Directors and trustees are required to submit and maintain written declarations of interests, which are presented to the respective boards at each board meeting and board members are required to acknowledge in writing that they have read the written disclosures submitted.
PROFESSIONAL INDEMNITY INSURANCEAdequate directors and officer’s liability insurance and indemnity cover has been effected by the PPS Group in respect of all its trustees, directors and officers. No claims under the relevant policies were lodged during the year under review.
57

CORPORATE GOVERNANCE REPORT (continued)
TRUSTEES OF THE PROFESSIONAL PROVIDENT SOCIETY HOLDINGS TRUST
Trustee Age* Qualification Classification Term of Office
Mr E A Moolla(Chairman) Independent Non-executive
67 B Iuris Elected for a three-year termAppointed 11 March 2002Ends AGM 2018
Dr S N E Seoka (Deputy Chairman)Independent Non-executive
62 B Pharm, PhD, FPSCo-optedfor a three-year term
Appointed 15 August 2005Ends AGM 2019
Adv T N AboobakerIndependent Non-executive
64 BA, LLBNominatedfor a three-year term(1)
Appointed 4 December 2006Ends AGM 2020
Ms D L T DondurIndependent Non-executive
51B Acc (Hons), B Compt, CA(SA), MBA
Nominatedfor a three-year term(2)
Appointed 6 July 2011Ends AGM 2020
Mr J A B DownieIndependent Non-executive
59 B Sc, MBA, CFPCo-optedfor a three year term
Appointed 15 April 2010Ends AGM 2019
Dr D P du PlessisIndependent Non-executive
63 B Sc (QS), MBA, DBAElectedfor a three-year term
Appointed 3 June 2013Ends AGM 2019
Mr C ErasmusIndependent Non-executive
66 B Sc, FIA, FASSA Appointed ex officioAppointed 1 June 2015 Ends N/A
Mr U D JivanIndependent Non-executive
55 BA, LLBElectedfor a three-year term
Appointed 8 June 2009Ends AGM 2018
Mr I Kotzé Independent Non-executive
61 B PharmNominatedfor a three-year term(3)
Appointed 27 August 2001 Ends AGM 2020
Dr C M Krüger Independent Non-executive
52MB ChB, M Prax Med, M Pharm Med
Electedfor a three-year term
Appointed 21 June 2004Ends AGM 2018
Dr F Mansoor Independent Non-executive
38 BDS, MBANominatedfor a three-year term(4)
Appointed 17 July 2017Ends AGM 2020
Ms P NatesanIndependent Non-executive
38 B Com (Hons), CA(SA) Electedfor a three-year term
Appointed 17 July 2017Ends AGM 2020
Mr N C NyawoIndependent Non-executive
38B Com (Hons), CA(SA), MBA
Electedfor a three-year term
Appointed 2 June 2014Ends AGM 2019
Mr M PillayIndependent Non-executive
41 HDE, B SC Eng, MBAElectedfor a three-year term
Appointed 17 July 2017Ends AGM 2020
Mr P RanchodIndependent Non-executive
62B Compt (Hons),CA(SA), MBL, H Dip Business Data Processing
Electedfor a three-year term
Appointed 6 June 2011Ends AGM 2020
Mr V P RimbaultIndependent Non-executive
54 B Sc Eng (Mech)Nominatedfor a three-year term(5)
Appointed 12 September 2011 Ends AGM 2020
Prof M W Sonderup Independent Non-executive
49B Pharm, MB ChB, FCP (SA)
Nominatedfor a three-year term(6)
Appointed 29 March 2012Ends AGM 2020
Mr B R Topham Independent Non-executive
46B Compt (Hons), B Proc, LLM, CA(SA)
Elected for a three-year term
Appointed 2 June 2014Ends AGM 2019
Mr S Trikamjee Independent Non-executive
39 B Com (Hons), CA(SA)Electedfor a three-year term
Appointed 8 June 2009Ends AGM 2020
Prof H E Wainer Independent Non-executive
56B Acc, CA(SA), Registered Auditor
Appointed ex officioAppointed 1 June 2015Ends N/A
PPS INTEGRATED REPORT 201758

Trustee Age* Qualification Classification Term of Office
Dr N G CampbellIndependent Non-executive
67 BDSElectedfor a three-year term
Appointed 9 March 2002Retired 22 May 2017
Dr M J Grootboom Independent Non-executive
66MB ChB, FCS (SA) ORTH, CIME (ABIME)
Electedfor a three-year term
Appointed 1 June 2015 Retired 22 May 2017
Dr J Patel Independent Non-executive
65 B ChdNominatedfor a three-year term(4)
Appointed 8 June 2009Retired 22 May 2017
* As at 28 March 2018
N/A = Not applicable
Nominated by:
1. The General Council of the Bar of South Africa
2. The South African Institute of Chartered Accountants
3. The Pharmaceutical Society of South Africa
4. The South African Dental Association
5. The Professional Engineers’ Societies
6. The South African Medical Association
PPS INSURANCE BOARD
Director Age* Qualification Appointed
Mr C Erasmus (Chairman) Independent Non-executive
66 B Sc, FIA, FASSA Appointed 19 February 2007
Prof H E Wainer (Deputy Chairman) Independent Non-executive
56 B Acc, CA(SA), Registered Auditor Appointed 30 November 2009
Ms D L T Dondur Independent Non-executive 51B Acc (Hons), B Compt, CA(SA), MBA
Appointed 24 June 2013
Mr J A B Downie Independent Non-executive 59 B Sc, MBA, CFP Appointed 24 June 2013
Dr D P du Plessis Independent Non-executive 63 B Sc (QS), MBA, DBA Appointed 19 June 2017
Dr C M Krüger Independent Non-executive 52MB ChB, M Prax Med, M Pharm Med
Appointed 29 June 2015
Mr E A Moolla Independent Non-executive 67 B Iuris Appointed 24 February 2003
Mr N G Payne Independent Non-executive 58 B Com (Hons), CA(SA), MBL Appointed 25 June 2007
Mr P Ranchod Independent Non-executive 62B Compt (Hons), CA(SA), MBL,H Dip Business Data Processing
Appointed 24 June 2013
Dr S N E Seoka Independent Non-executive 62 B Pharm, PhD, FPS Appointed 26 June 2006
Mr S Trikamjee Independent Non-executive 39 B Com (Hons), CA(SA) Appointed 29 June 2015
Mr I J Smit (Chief Executive) (Executive) 50 B Com (Hons), FASSA Appointed 25 July 2016
Mr N J Battersby (Executive) 50 B Sc, B Com (Hons), MBA, CFP Appointed 28 September 2016
Mrs T Boesch (Financial Director) (Executive) 43 B Com (Hons), CA(SA) Appointed 4 May 2009
Dr N G Campbell Independent Non-executive 67 BDSAppointed 21 July 2003 Retired 22 May 2017
* As at 28 March 2018
59
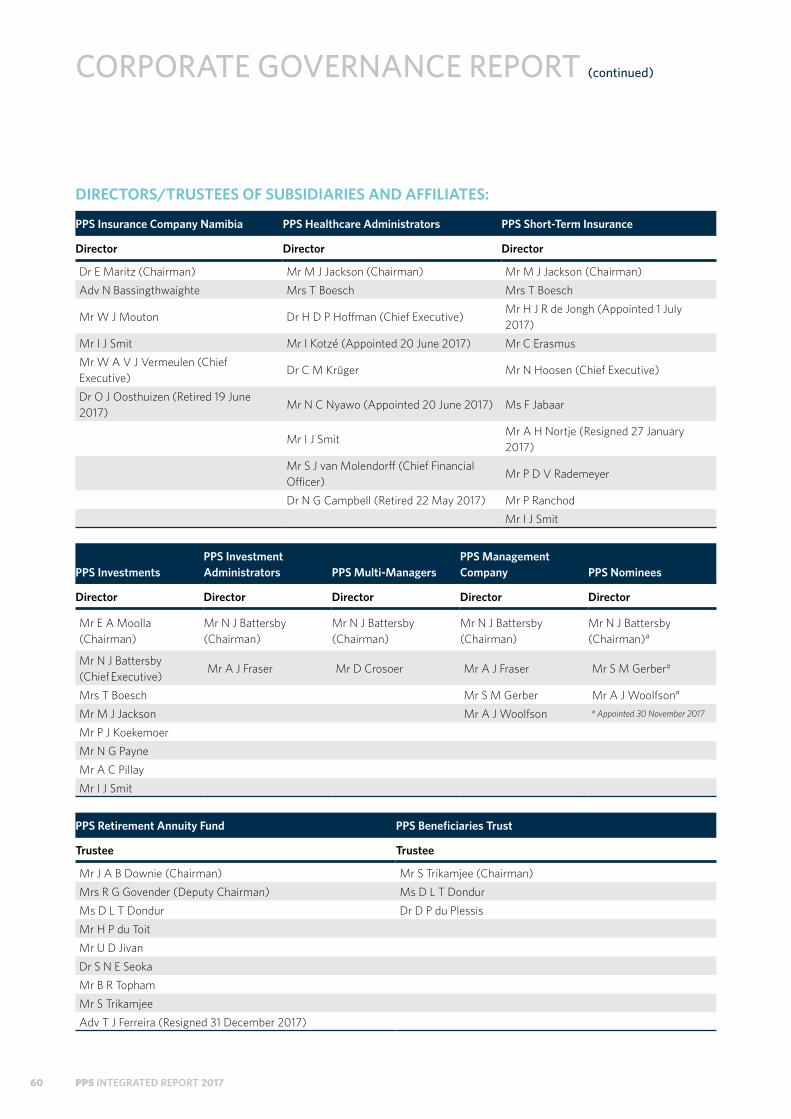
CORPORATE GOVERNANCE REPORT (continued)
DIRECTORS/TRUSTEES OF SUBSIDIARIES AND AFFILIATES:
PPS Insurance Company Namibia PPS Healthcare Administrators PPS Short-Term Insurance
Director Director Director
Dr E Maritz (Chairman) Mr M J Jackson (Chairman) Mr M J Jackson (Chairman)
Adv N Bassingthwaighte Mrs T Boesch Mrs T Boesch
Mr W J Mouton Dr H D P Hoffman (Chief Executive)Mr H J R de Jongh (Appointed 1 July 2017)
Mr I J Smit Mr I Kotzé (Appointed 20 June 2017) Mr C Erasmus
Mr W A V J Vermeulen (Chief Executive)
Dr C M Krüger Mr N Hoosen (Chief Executive)
Dr O J Oosthuizen (Retired 19 June 2017)
Mr N C Nyawo (Appointed 20 June 2017) Ms F Jabaar
Mr I J SmitMr A H Nortje (Resigned 27 January 2017)
Mr S J van Molendorff (Chief Financial Officer)
Mr P D V Rademeyer
Dr N G Campbell (Retired 22 May 2017) Mr P Ranchod
Mr I J Smit
PPS InvestmentsPPS Investment Administrators PPS Multi-Managers
PPS Management Company PPS Nominees
Director Director Director Director Director
Mr E A Moolla (Chairman)
Mr N J Battersby (Chairman)
Mr N J Battersby (Chairman)
Mr N J Battersby (Chairman)
Mr N J Battersby (Chairman)#
Mr N J Battersby (Chief Executive)
Mr A J Fraser Mr D Crosoer Mr A J Fraser Mr S M Gerber#
Mrs T Boesch Mr S M Gerber Mr A J Woolfson#
Mr M J Jackson Mr A J Woolfson # Appointed 30 November 2017
Mr P J Koekemoer
Mr N G Payne
Mr A C Pillay
Mr I J Smit
PPS Retirement Annuity Fund PPS Beneficiaries Trust
Trustee Trustee
Mr J A B Downie (Chairman) Mr S Trikamjee (Chairman)
Mrs R G Govender (Deputy Chairman) Ms D L T Dondur
Ms D L T Dondur Dr D P du Plessis
Mr H P du Toit
Mr U D Jivan
Dr S N E Seoka
Mr B R Topham
Mr S Trikamjee
Adv T J Ferreira (Resigned 31 December 2017)
PPS INTEGRATED REPORT 201760

PPS Personal Pension RetirementAnnuity Fund PPS Preservation Provident Fund PPS Preservation Pension Fund
Trustee Trustee Trustee
Mrs R G Govender (Chairman) Mrs R G Govender (Chairman) Mrs R G Govender (Chairman)
Mr A Bosch Mr A Bosch Mr A Bosch
Mr J A B Downie Mr J A B Downie Mr J A B Downie
Mr H P du Toit Mr H P du Toit Mr H P du Toit
Mr S Trikamjee(Appointed 1 January 2018)
Mr S Trikamjee(Appointed 1 January 2018)
Mr S Trikamjee(Appointed 1 January 2018)
Adv T J Ferreira(Resigned 31 December 2017)
Adv T J Ferreira(Resigned 31 December 2017)
Adv T J Ferreira(Resigned 31 December 2017)
PPS Property Fund Trust PPS Foundation PPS Educational Trust PPS Training Academy
Trustee Trustee Trustee Director
Mr I J Smit (Chairman) Dr S N E Seoka (Chairman) Dr S N E Seoka (Chairman) Dr S N E Seoka (Chairman)
Mr N J Battersby Mrs L A DlaminiAdv T N Aboobaker(Resigned 19 June 2017)
Mrs L A Dlamini
Mrs T BoeschDr D P du Plessis(Appointed 3 August 2017)
Mrs L A Dlamini Dr D P du Plessis
Mr V Schroeder Mr N C Nyawo Dr D P du PlessisDr M J Grootboom(resigned 22 May 2017)
Mr P RanchodDr M J Grootboom(resigned 22 May 2017)
Mr N C Nyawo(Appointed 19 June 2017)
Mr N C Nyawo(Appointed 3 August 2017)
Mr P Ranchod(Appointed 19 June 2017)
Mr P Ranchod(Appointed 3 August 2017)
Plexus Properties Financial Solutions 4 Professionals$ Six Anerley Road Holdings #
Director Director Director
Mrs T Boesch Mrs T Boesch Dr S N E Seoka (Chairman)
Mr I J Smit Mr N J Coetzee (Appointed 26 February 2018)
Adv T N Aboobaker (Resigned 19 June 2017)
Mr W J Mouton (Appointed 26 February 2018)
Mrs L A Dlamini
Mr S R Ruiters (Appointed 26 February 2018)
Dr D P du Plessis (Appointed 19 June 2017)
Mr I J Smit Mr N C Nyawo (Appointed 19 June 2017)
Mr P Ranchod (Appointed 19 June 2017)
$ Formerly PPS Property Fund (Pty) Ltd # Formerly PPS Academy Holdings
61

CORPORATE GOVERNANCE REPORT (continued)
MEETINGS AND ATTENDANCEThe schedules below set out the PPS Holdings Trust and PPS Insurance Board meetings held during the year and attendance thereat were as follows:
The PPS Holdings Trust 30 Mar 2017 12 Jun 2017 27 Sep 2017 29 Nov 2017
Mr E A Moolla (Chairman) X X X X
Dr S N E Seoka (Deputy Chairman) X X X X
Adv T N Aboobaker X X X X
Dr N G Campbell (Retired 22 May 2017) X N/A N/A N/A
Ms D L T Dondur X X X X
Mr J A B Downie X X X X
Dr D P du Plessis X X X X
Mr C Erasmus X X X X
Dr M J Grootboom (Retired 22 May 2017) X N/A N/A N/A
Mr U D Jivan X X X X
Mr I Kotzé X AP X X
Dr C M Krüger X X X X
Dr F Mansoor (Appointed 17 July 2017) N/A N/A X X
Ms P Natesan (Appointed 17 July 2017) N/A N/A X X
Mr N C Nyawo X X X X
Dr J Patel (Retired 22 May 2017) X N/A N/A N/A
Mr M Pillay (Appointed 17 July 2017) N/A N/A X X
Mr P Ranchod X X X X
Mr V P Rimbault X X X X
Prof M W Sonderup X X X X
Mr B R Topham X X X X
Mr S Trikamjee X X X X
Prof H E Wainer X X X X
AP = ApologyN/A = Not applicable
PPS Insurance Company Limited1 Mar2017
29 Mar2017
19 Jun2017
29 Aug2017
26 Sep2017
27 Nov2017
Mr C Erasmus (Chairman) X X X X X X
Prof H E Wainer (Deputy Chairman) X X X X X X
Mr N J Battersby X X X X X X
Mrs T Boesch X X X AP X X
Dr N G Campbell (Retired 22 May 2017) X X N/A N/A N/A N/A
Ms D L T Dondur X X AP X X X
Mr J A B Downie X X X X X X
Dr D P du Plessis (Appointed 12 June 2017) N/A N/A AP X X X
Dr C M Krüger X X X X X X
Mr E A Moolla X X X X X X
Mr N G Payne X X AP X X X
Mr P Ranchod X X X X X X
Dr S N E Seoka X X X X X X
Mr I J Smit X X X X X X
Mr S Trikamjee X X X X X X
AP = Apology N/A = Not applicable
PPS INTEGRATED REPORT 201762

BOARD COMMITTEESA number of standing board committees have been established to assist the boards in discharging their responsibilities. The boards are satisfied that the members of the respective committees have sufficient recent and relevant experience and are appropriately qualified to enable them to carry out their respective duties and responsibilities.
The membership and principal functions of these committees are set out below.
The various committee members as well as their attendance at the relevant committee meetings are provided in this Corporate Governance Report, the Report of the Audit Committees and the Report of the Group Social and Ethics Committee.
PPS HOLDINGS TRUST STANDING BOARD COMMITTEESThe PPS Holdings Trust Board has established the following standing board committees:
• PPS Holdings Trust Audit Committee
• Group Nominations Committee.
PPS INSURANCE STANDING BOARD COMMITTEESThe PPS Insurance Board has established the following standing board committees:
• Group Actuarial Committee
• Group Audit Committee
• Group Remuneration Committee
• Group Risk Committee
• Group Social and Ethics Committee.
PPS HOLDINGS TRUST AUDIT COMMITTEE (TAC) AND GROUP AUDIT COMMITTEE (GAC)The composition, roles, responsibilities and attendance at meetings of the TAC and GAC are set out in the Audit Committees’ report on pages 84 to 87 of this Integrated Report.
GROUP RISK COMMITTEE (GRC)Members
Mr N G Payne (Chairman)
Mr C Erasmus
Mr I J Smit
The role of the GRC is to assist the PPS Group boards in discharging their fiduciary duties regarding risk management within the PPS Enterprise Risk Management and Governance Frameworks, which include:
• risk policy and the implementation of risk management
• risk governance structures
• risk infrastructure, processes and culture
• the setting of risk appetite and tolerances
• risk assessment, profiling, mitigation and reporting
• assurance and stakeholder disclosures.
The GRC is comprised of two independent non-executive PPS Insurance directors, who are risk management specialists, and the Chief Executive. The GRC is chaired by an independent non-executive director. The GRC is scheduled to meet at least four times a year. The non-executive members of the GRC are also members of the GAC and the Group Actuarial Committee. The internal auditors and Heads of Group Compliance and Risk Management are present at each meeting, when reports are tabled outlining the progress in terms of the risk management framework, internal audit plans and an overview of the PPS Group’s risk profile. The GRC is satisfied that the risk assessments, responses and interventions are effective. The GRC is responsible for the statutory compliance monitoring functions and makes reports to the GAC and Group Social and Ethics Committee on risk matters pertaining to those committees. The GRC considers and recommends the PPS Group SAM ORSA Report for approval by the PPS Insurance Board. The GRC also receives reports by the Risk and Audit Committees of the PPS Insurance subsidiaries which have such committees.
The GRC meetings held during the year and the attendance thereat were as follows:
Group Risk Committee
6 Mar2017
29 May2017
11 Sep2017
6 Nov2017
Mr N G Payne(Chairman)
X X X X
Mr C Erasmus X X X X
Mr I J Smit X X X X
63

CORPORATE GOVERNANCE REPORT (continued)
GROUP ACTUARIAL COMMITTEE (AC)Members
Mr C Erasmus (Chairman)
Mr N G Payne
Prof H E Wainer
The AC is chaired by an independent non-executive director and is comprised solely of independent non-executive directors of PPS Insurance.
The AC has an important role in ensuring the integrity of actuarial processes and the proper assessment of PPS Insurance Group Companies’ risk philosophy from an actuarial perspective, strategy, policies, financial and operational processes and controls, as well as assessments of major risks from an actuarial perspective. The AC’s activities are focused on considering actuarial assumptions and experience, product pricing and design, valuation results, risk metrics and reporting guidelines and practices adopted by the Heads of Actuarial Control and the Company Actuaries, as well as other actuarial matters as applicable to PPS Insurance and any of its subsidiaries operating a life or short-term insurance licence.
The AC acts as an independent adviser to the PPS Insurance, PPS Namibia and PPS Short-Term Insurance Boards and has the following primary responsibilities:
• To assist the boards in fulfilling their oversight responsibilities regarding:
– the accuracy and integrity of the actuarial statements
– compliance with actuarial, legal and regulatory requirements
– the performance of the Actuarial Functions of PPS Insurance and PPS Short-Term Insurance.
• To assist the PPS Insurance, PPS Namibia and PPS Short-Term Insurance boards in the execution of their fiduciary duties regarding the oversight of the reinsurance arrangements and risk transfer processes.
• To assist the PPS Insurance and PPS Short Term Insurance boards with the execution of their responsibilities relating to the Own Risk and Solvency Assessment (ORSA).
• To provide a sounding board for the Heads of Actuarial Control and the Company Actuaries in making recommendations to the boards and to consider, for tabling at board meetings, the recommendations of the Heads of Actuarial Control and the Company Actuaries.
The AC meetings held during the year and attendance thereat were as follows:
Group ActuarialCommittee
28 Feb 2017
1 Jun2017
13 Sep 2017
6 Nov 2017
Mr C Erasmus(Chairman)
X X X X
Mr N G Payne X X X X
Prof H E Wainer X X X X
GROUP REMUNERATION COMMITTEE (REMCO)Members
Mr N G Payne (Chairman)
Mr C Erasmus
Mr E A Moolla
Prof H E Wainer
Chaired by an independent non-executive PPS Insurance director and comprising solely of non-executive directors of PPS Insurance, the Group Remuneration Committee (REMCO) has been established as a sub-committee of the PPS Insurance Board with delegated responsibility for ensuring the implementation of the Remuneration Policy as approved by the PPS Insurance Board from time to time, and making recommendations to the PPS Group boards in regard to employee and non-executive remuneration for consideration and final approval. REMCO is also responsible for advising the PPS Group in relation to matters of executive, senior management and staff remuneration, as well as key human resources and employee related matters, including employment equity and transformation.
The PPS Group is committed to a remuneration philosophy that is applied consistently across the group and focuses on rewarding consistent and sustainable individual, team and corporate performance. The remuneration policy underpins the reward strategy and is key to the PPS Employee Value Proposition. Taking due cognisance of the market and the competitive financial services sector, REMCO is responsible for developing a remuneration philosophy and remuneration policies and practices that aim to set appropriate remuneration levels which enable PPS to attract, engage, motivate, reward and retain executives, senior managers, key talent and other competent staff, with the appropriate values. The remuneration policy forms an integral part of PPS’ corporate strategy and risk profile and maintains a sustainable balance between short-term and long-term value creation, building on PPS’ long-term responsibility towards its stakeholders, namely members, employees, society and other stakeholders.
PPS INTEGRATED REPORT 201764

The detailed responsibilities of REMCO are set out in its Terms of Reference as approved by the PPS Insurance Board from time to time, and include ensuring that the remuneration policy:
• is aligned to the PPS Group’s strategy, values and goals and the interests of members, staff and other stakeholders
• retains key skills to promote short-term performance objectives and long-term value creation
• is consistent with the PPS Group’s risk appetite and does not induce excessive or inappropriate risk-taking
• is consistent with and promotes sound and effective risk management
• achieves the most effective returns for total employee spend
• addresses diverse employee needs within and across different business units
• appropriately balances the interests of members, operational and strategic requirements and provides attractive and appropriate remuneration packages for executive Directors, executives, senior management and employees.
REMCO’s duties also include:
• ensuring that the mandates of remuneration committees, remuneration policies and practices of subsidiaries of the group are aligned to the group remuneration philosophy
• the approval of the average annual percentage increases to guaranteed packages of staff
• the approval of all short-term and long-term incentive scheme designs, as well as any amendments thereto
• the approval of recommended payments and allocations to be made in terms of any short-term and long-term incentive scheme
• ensuring that the remuneration policy is appropriate considering the desired culture, size of the PPS Group, its organisational structure and the complexity of its activities. This policy forms part of the PPS Enterprise Risk Management Framework and component policies
• the determination of the remuneration of the non-executive trustees and directors of PPS Holdings Trust and its subsidiaries and related entities for recommendation to the respective boards for approval, and ultimate approval by the respective entities’ members by special resolution at their respective annual general meetings, in advance of making payment of such remuneration to the board members.
Non-executive directors/trustees are remunerated on the basis of annual retainers, as well as attendance fees for each meeting attended. Non-executive directors/trustees do not participate in the PPS Group’s long-term or short-term incentive schemes. The trustees’ fees for PPS Holdings Trust
and its board committees are subject to the ultimate approval of PPS’ Ordinary Members by special resolution at its annual general meeting.
No employee included in the scope of this policy is involved in deciding his or her own remuneration. The Chief Executive and the Group Executive: Human Resources attend the meetings of REMCO by invitation. The Chief Executive and Group Executive: Human Resources are recused from any discussion and/or decision pertaining to their own remuneration.
The need for continued focus on driving new initiatives and strategies as well as the war for talent in the industry resulted in REMCO approving the implementation of a Key Employee Retention Scheme in 2017. Participation in the Retention Scheme is limited to key employees in the PPS Group and employees in critical roles, to incentivise the retention of those employees, as well as to reward long-term sustained performance aligned with members’ interests and outcomes. The Retention Scheme will operate over a five-year period. Ongoing focus was also placed on ensuring that PPS maintains fair and equitable remuneration and benefits for all staff.
The REMCO meetings held during the year and the attendance thereat were as follows:
Group Remuneration Committee
6 Mar2017
22 May2017
13 Sep 2017
Mr N G Payne (Chairman)
X X X
Mr C Erasmus X X X
Mr E A Moolla X X X
Prof H E Wainer X X X
GROUP NOMINATIONS COMMITTEE (GNC)The GNC is a sub-committee of the PPS Holdings Trust Board, mandated with responsibility for PPS Holdings Trust and its subsidiaries.
Members
Mr E A Moolla (Chairman)
Mr C Erasmus (Deputy Chairman)
Dr N G Campbell (retired 22 May 2017)
Dr C M Krüger
Dr S N E Seoka
Mr S Trikamjee (appointed 12 June 2017)
The GNC is chaired by an independent trustee and comprises solely of independent non-executive trustees of the PPS Holdings Trust.
65

CORPORATE GOVERNANCE REPORT (continued)
It is the responsibility of the GNC to ensure that succession plans are in place for appointments to the boards of PPS Holdings Trust and its subsidiaries that will maintain an appropriate balance of qualifications, skills and experience and achieve compliance with Fit and Proper requirements. The GNC leads the process for appointment and re-election of trustees and directors and makes recommendations to the boards for the appointment of PPS Group boards and committees, except in regard to the appointment of the members of the GNC itself, which is the sole prerogative of the PPS Holdings Trust Board, ensuring that there is a formal, rigorous and transparent procedure for all appointments. The PPS Holdings Trust Board is satisfied that the range and balance of expertise, experience and qualifications of the board members are appropriate for the current needs of the business, but keeps these matters under regular review.
The GNC annually considers the continued service of board members with a period of appointment in excess of nine years and is satisfied that such board members still meet the requirements for independence.
The PPS Holdings Trust Board is responsible for ensuring that an effective system for succession planning and development is in place, covering trustees and directors. It has delegated this task to the GNC. In considering an appointment, the GNC assesses and defines the characteristics, qualities, skills and experience it believes would complement the overall balance and composition of the PPS Holdings Trust Board, subsidiary boards and board sub-committees, ensuring compliance with Fit and Proper requirements. The GNC may appoint external consultants to assist it in the identification and recruitment of an individual who satisfies the GNC’s criteria. Where the GNC is considering matters relating to an individual who is a member of the GNC, such individual is recused from the discussion of that item.
The GNC is satisfied that each non-executive trustee and director achieves the commitment required to properly discharge their responsibilities. The directors and trustees have continued to update their skills and knowledge, both within the PPS Group and externally. The GNC has been mandated to perform, and is responsible for, the evaluation of the boards and board members, including compliance with enhanced requirements regarding independence and being Fit and Proper for serving on an insurance company board in terms of regulation.
The GNC meetings held during the year and the attendance thereat were as follows:
Group Nominations Committee
25Jan
2017
15Mar
2017
23May 2017
20Sep
2017
16Nov
2017
Mr E A Moolla(Chairman)
X X X X X
Mr C Erasmus(Deputy Chairman)
X X X X X
Dr N G Campbell (Retired 22 May 2017)
X X N/A N/A N/A
Dr C M Krüger X X X X X
Dr S N E Seoka X X X X X
Mr S Trikamjee (Appointed 12 June 2017)
N/A N/A N/A X X
GROUP SOCIAL AND ETHICS COMMITTEE (SEC)Particulars of the composition, role and responsibilities of the SEC and attendance at meetings are set out in the SEC’s report on pages 88 to 89 of this Integrated Report.
PPS INTEGRATED REPORT 201766
GROUP EXECUTIVE COMMITTEE (GROUP EXCO)Members
Mr I J Smit (Chairman) (Group Chief Executive)
Mr V E Barnard (Group Company Secretary)
Mr N J Battersby (Chief Executive: PPS Investments)
Mrs T Boesch (Group Chief Financial Officer)
Mr S R Clark (Executive: Life Administration and Systems)
Mrs L A Dlamini (Group Executive: Human Resources)
Dr H D P Hoffman (Chief Executive: PPS Healthcare Administrators)
Mr N Hoosen (Chief Executive: PPS Short-Term Insurance)
Mr E G Joubert (Group Executive: Marketing and Stakeholder Relations) (resigned 30 June 2017)
Mrs Z Saungweme (Executive: Digital and Social Media) (resigned 15 February 2017)
Mr N J Coetzee (Executive: Internal Distribution)
Mr W J Mouton (Executive: External Distribution)
Mr D Semwayo (Executive: Actuarial and Technical) (resigned 31 December 2017)
Mrs A N Seboni (Group Executive: Marketing) (appointed 1 June 2017)
Mr W J Lynch (Executive: Business Change and Strategic Development) (appointed 1 June 2017)
Mr Q J Augustine (Executive: Member Value Proposition) (appointed 1 July 2017)
Composition and meeting procedures
Group Exco is chaired by the Chief Executive and has regular input from executives in Operations, Internal and External Distribution, Finance, Actuarial, IT, Human Resources, Compliance, Governance, Marketing, Business Change and Strategic Development, Member Value Proposition, the Group Company Secretary, the subsidiary businesses of PPS Investments, PPS Short-Term Insurance and PPS Healthcare Administrators and the associate PPS Mutual Australia. Group Exco meetings are held at least monthly and additional meetings are scheduled as required. Group Exco is responsible for the implementation of day-to-day strategy and the operations of the PPS Group, within the parameters defined by the boards.
Group Exco is supported by a number of management committees throughout the PPS Group.
67

2017 ANNUAL FINANCIAL
STATEMENTS
PPS INTEGRATED REPORT 201768
CONTENTS
70 STATEMENT OF RESPONSIBILITY BY THE BOARD OF TRUSTEES
71 CERTIFICATE BY THE SECRETARY
72 INDEPENDENT AUDITOR’S REPORT
75 REPORT OF THE INDEPENDENT ACTUARY
79 INVESTMENT RETURNS AND PROFIT ALLOCATION TO POLICYHOLDERS’ PPS PROFIT-SHARE ACCOUNT
82 TRUSTEES’ REPORT
84 AUDIT COMMITTEES’ REPORT
88 GROUP SOCIAL AND ETHICS COMMITTEE’S REPORT
90 CONSOLIDATED STATEMENT OF FINANCIAL POSITION
91 CONSOLIDATED STATEMENT OF PROFIT OR LOSS AND OTHER COMPREHENSIVE INCOME
92 CONSOLIDATED STATEMENT OF CHANGES IN EQUITY
93 CONSOLIDATED STATEMENT OF CASH FLOWS
94 GROUP ACCOUNTING POLICIES
107 NOTES TO THE CONSOLIDATED FINANCIAL STATEMENTS
164 PPS HOLDINGS TRUST ANNUAL FINANCIAL STATEMENTS
166 ACTION REQUIRED BY MEMBERS IN REGARD TO THE 2018 ANNUAL GENERAL MEETING
167 NOTICE TO THE MEMBERS OF THE ANNUAL GENERAL MEETING AND CV’S OF CANDIDATES STANDING FOR ELECTION
177 FORM OF PROXY
179 ADMINISTRATIVE INFORMATION
This report comprises of the audited consolidated annual financial statements of The Professional Provident Society Holdings Trust and its subsidiaries, as well as the annual financial statements of The Professional Provident Society Holdings Trust.
The report was prepared under the supervision of T Boesch CA(SA). An audit was performed by PricewaterhouseCoopers Inc. in line with requirements of the Trust Deed.
Published: 28 March 2018
69

The trustees accept responsibility for the fair presentation of the financial statements of The Professional Provident Society Holdings Trust, comprising the financial statements of the trust itself and the consolidated financial statements of the trust and its subsidiaries. These financial statements have been prepared in accordance with International Financial Reporting Standards, and in the manner required by the Long Term Insurance Act of 1998, the South African Companies Act of 2008, and the Trust Deed. The trustees are of the opinion that the financial statements are fairly presented in the manner required. The independent auditors are responsible for reporting on these financial statements and were given unrestricted access to all financial records and related data including minutes of all meetings of members of the board of trustees and committees of the board. The trustees have no reason to believe that any representations made to the independent auditors during the audit were not valid and appropriate. The trustees accept responsibility for the maintenance of accounting records and systems of internal financial control.
The trustees are satisfied that no material breakdown in the operations of the systems of internal financial controls and procedures occurred during the year under review.
Nothing has come to the attention of the trustees to indicate that the Group, or any company within the Group, will not remain a going concern for at least the ensuing financial year. The financial statements have been prepared on the same basis.
The annual financial statements, which appear on pages 90 to 165, were approved by the board of trustees and are signed on its behalf by:
Mr E A Moolla Mr I J Smit Mrs T BoeschChairman Chief Executive Financial Director
The Professional Provident Society Holdings Trust
Johannesburg28 March 2018
STATEMENT OF RESPONSIBILITY BY THE BOARD OF TRUSTEESfor the year ended 31 December 2017
PPS INTEGRATED REPORT 201770

In my capacity as the Secretary of The Professional Provident Society Holdings Trust, I hereby certify in terms of section 88(2)(e), of the Companies Act of 2008 and the Trust Deed that for the year ended 31 December 2017, the Group has lodged with the Companies and Intellectual Property Commission all such returns as are required in terms of this Act. I also confirm that all returns to the Master of the High Court’s office, required for The Professional Provident Society Holdings Trust in terms of its Trust Deed and the Trust Property Control Act of 1988, are to the best of my knowledge and belief true, correct and up to date.
V E BarnardGroup Company SecretaryThe Professional Provident Society Holdings Trust
28 March 2018
CERTIFICATE BY THE SECRETARY
71

REPORT ON THE AUDIT OF THE CONSOLIDATED AND SEPARATE FINANCIAL STATEMENTS
OUR OPINIONIn our opinion, the consolidated and separate financial statements present fairly, in all material respects, the consolidated and separate financial position of The Professional Provident Society Holdings Trust (the Trust) and its subsidiaries (the Group) as at 31 December 2017, and its consolidated and separate financial performance and its consolidated and separate cash flows for the year then ended in accordance with International Financial Reporting Standards and the requirements of the Trust Deed.
WHAT WE HAVE AUDITEDThe Professional Provident Society Holdings Trust’s consolidated and separate financial statements set out on pages 90 to 165 comprise:
• The Consolidated and Separate Statements of Financial position as at 31 December 2017;
• The Consolidated and Separate Statements of Profit or Loss and Other Comprehensive Income for the year then ended;
• The Consolidated and Separate Statements of Changes in Equity for the year then ended;
• The Consolidated and Separate Statements of Cash Flows for the year then ended; and
• The Notes to the Consolidated Financial Statements and Separate Financial Statements, which include a summary of significant accounting policies;
BASIS FOR OPINIONWe conducted our audit in accordance with International Standards on Auditing (ISAs). Our responsibilities under those standards are further described in the Auditor’s responsibilities for the audit of the consolidated and separate financial statements section of our report.
We believe that the audit evidence we have obtained is sufficient and appropriate to provide a basis for our opinion.
INDEPENDENCEWe are independent of the Group in accordance with the Independent Regulatory Board for Auditors Code of Professional Conduct for Registered Auditors (IRBA Code) and other independence requirements applicable to performing audits of financial statements in South Africa. We have fulfilled our other ethical responsibilities in accordance with the IRBA Code and in accordance with other ethical requirements applicable to performing audits in South Africa. The IRBA Code is consistent with the International Ethics Standards Board for Accountants Code of Ethics for Professional Accountants (Parts A and B).
OTHER INFORMATIONThe trustees are responsible for the other information. The other information comprises the Statement of Responsibility by the Board of Trustees, Certificate by the Secretary, Report of the Independent Actuary, Investment returns and profit allocation to the policyholder’ PPS-Profit Share Account, Trustees’ report, Audit Committees’ Report, Group Social and Ethics Committee’s Report, Corporate Governance Report, Administrative Information, Action required by members in regard to the 2018 Annual General Meeting and Notice to Members of the Annual General Meeting and Form of Proxy. Other information does not include the consolidated and separate financial statements and our auditor’s report thereon.
Our opinion on the consolidated and separate financial statements does not cover the other information and we do not express an audit opinion or any form of assurance conclusion thereon.
In connection with our audit of the consolidated and separate financial statements, our responsibility is to read the other information identified above and, in doing so, consider whether the other information is materially inconsistent with the consolidated and separate financial statements or our knowledge obtained in the audit, or otherwise appears to be materially misstated.
If, based on the work we have performed, we conclude that there is a material misstatement of this other information, we are required to report that fact. We have nothing to report in this regard.
INDEPENDENT AUDITOR’S REPORTTO THE MEMBERS OF THE PROFESSIONAL PROVIDENT SOCIETY HOLDINGS TRUST
PPS INTEGRATED REPORT 201772

RESPONSIBILITIES OF THE TRUSTEES FOR THE CONSOLIDATED AND SEPARATE FINANCIAL STATEMENTSThe trustees are responsible for the preparation and fair presentation of the consolidated and separate financial statements in accordance with International Financial Reporting Standards and the requirements of the Trust Deed, and for such internal control as the trustees determine is necessary to enable the preparation of consolidated and separate financial statements that are free from material misstatement, whether due to fraud or error.
In preparing the consolidated and separate financial statements, the trustees are responsible for assessing the Group and the Trust’s ability to continue as a going concern, disclosing, as applicable, matters related to going concern and using the going concern basis of accounting unless the trustees either intend to liquidate the Group and/or the Trust or to cease operations, or have no realistic alternative but to do so.
AUDITOR’S RESPONSIBILITIES FOR THE AUDIT OF THE CONSOLIDATED AND SEPARATE FINANCIAL STATEMENTSOur objectives are to obtain reasonable assurance about whether the consolidated and separate financial statements as a whole are free from material misstatement, whether due to fraud or error, and to issue an auditor’s report that includes our opinion. Reasonable assurance is a high level of assurance, but is not a guarantee that an audit conducted in accordance with ISAs will always detect a material misstatement when it exists. Misstatements can arise from fraud or error and are considered material if, individually or in the aggregate, they could reasonably be expected to influence the economic decisions of users taken on the basis of these consolidated and separate financial statements.
As part of an audit in accordance with ISAs, we exercise professional judgement and maintain professional scepticism throughout the audit. We also:
• Identify and assess the risks of material misstatement of the consolidated and separate financial statements, whether due to fraud or error, design and perform audit procedures responsive to those risks, and obtain audit evidence that is sufficient and appropriate to provide a basis for our opinion. The risk of not detecting a material misstatement resulting from fraud is higher than for one resulting from error, as fraud may involve collusion, forgery, intentional omissions, misrepresentations, or the override of internal control.
• Obtain an understanding of internal control relevant to the audit in order to design audit procedures that are appropriate in the circumstances, but not for the purpose of expressing an opinion on the effectiveness of the Group’s and the Trust’s internal control.
• Evaluate the appropriateness of accounting policies used and the reasonableness of accounting estimates and related disclosures made by the trustees.
• Conclude on the appropriateness of the trustees’ use of the going concern basis of accounting and, based on the audit evidence obtained, whether a material uncertainty exists related to events or conditions that may cast significant doubt on the Group’s and the Trust’s ability to continue as a going concern. If we conclude that a material uncertainty exists, we are required to draw attention in our auditor’s report to the related disclosures in the consolidated and separate financial statements or, if such disclosures are inadequate, to modify our opinion. Our conclusions are based on the audit evidence obtained up to the date of our auditor’s report. However, future events or conditions may cause the Group and/or Trust to cease to continue as a going concern.
• Evaluate the overall presentation, structure and content of the consolidated and separate financial statements, including the disclosures, and whether the consolidated and separate financial statements represent the underlying transactions and events in a manner that achieves fair presentation.
• Obtain sufficient appropriate audit evidence regarding the financial information of the entities or business activities within the group to express an opinion on the consolidated financial statements. We are responsible for the direction, supervision and performance of the group audit. We remain solely responsible for our audit opinion.
We communicate with the trustees regarding, among other matters, the planned scope and timing of the audit and significant audit findings, including any significant deficiencies in internal control that we identify during our audit.
73

REPORT ON OTHER LEGAL AND REGULATORY REQUIREMENTSIn terms of the IRBA Rule published in Government Gazette Number 39475 dated 4 December 2015, we report that PricewaterhouseCooperInc. has been the auditor of the Professional Provident Society Holdings Trust and its’ subsidiaries for 17 years.
PricewaterhouseCoopers Inc. Director: J. GoncalvesRegistered Auditor
Johannesburg28 March 2018
INDEPENDENT AUDITOR’S REPORT (continued)
PPS INTEGRATED REPORT 201774

1. CERTIFICATION OF FINANCIAL POSITION• I have conducted actuarial reviews of Professional Provident Society Insurance Company Limited (PPS Insurance) and
Professional Provident Society Insurance Company (Namibia) Limited (PPS Namibia) (‘the insurance interests’) in accordance with, and this Statutory Actuary’s report has been produced in accordance with, applicable Actuarial Society of South Africa Standards of Actuarial Practice and Actuarial Practice Notes, and;
• These principles require reasonable provision for the liability in respect of future benefit payments to policyholders, generally based on the assumption that current conditions will continue. Provision is therefore not made for all possible contingencies;
• I have accepted that the Financial Statements comply with the requirements of the Companies Act;
• The assets in each life company exceeded the liabilities plus capital requirements at the valuation date;
• The South African company met the asset spreading requirements of the Long Term Insurance Act at the valuation date; and
• In my opinion, as at 31 December 2017, the insurance interests were financially sound on the statutory bases and are expected to remain so for the foreseeable future where financially sound includes meeting the asset spreading requirements as prescribed by the Long Term Insurance Act for the South African company.
GT WaughStatutory Actuary
28 March 2018
The statutory basis balance sheet for each life company is shown below:
2017 2016
PPS Insurance Paragraph R'000 R'000
Net assets 2 31 664 763 28 458 935
Insurance liabilities 3 31 287 190 28 090 818
Apportionment and Special Benefit Accounts 24 848 188 22 516 223
Risk benefit reserves 3 756 577 3 546 970
Investment benefits 2 682 425 2 027 625
Excess of assets over liabilities 377 573 368 117
Capital adequacy requirement 4 143 528 139 891
Ratio of excess assets to Capital Adequacy Requirement 2.6 2.6
2017 2016
PPS Namibia Paragraph N$'000 N$'000
Net assets 2 1 242 407 998 640
Insurance liabilities 3 1 236 407 992 640
Apportionment and Special Benefit Accounts 909 386 780 513
Risk benefit reserves 327 021 212 127
Excess of assets over liabilities 6 000 6 000
Capital adequacy requirement 4 4 000 4 000
Ratio of excess assets to Capital Adequacy Requirement 1.5 1.5
REPORT OF THE INDEPENDENT ACTUARYfor the year ended 31 December 2017
75

2. STATUTORY BASIS ASSET VALUATION METHODS AND ASSUMPTIONSThe assets are valued at balance sheet values, i.e. at market or Directors’ values as described in the accounting policies.
3. STATUTORY BASIS LIABILITY VALUATION METHODS AND ASSUMPTIONSThe actuarial liabilities were valued on bases which were consistent with the asset values, using the Financial Soundness Valuation method in accordance with the requirements of the Long term Insurance Act, 1998 and SAP104 of the Actuarial Society of South Africa (ASSA), as follows:
For sickness, permanent incapacity and death benefits (referred to in the notes to the accounts as the ‘non-DPF component’ of the liabilities), the actuarial liabilities were stated at the present value of expected benefit payments and expenses less the present value of expected future premium receipts.
For benefits where the value is related to the return on an underlying investment portfolio (i.e. the apportionment and special benefit accounts), the actuarial liabilities were stated at the value of the non-vesting account balances per the financial statements. These amounts are referred to in the notes to the accounts as the ‘DPF component’ of the policy liabilities.
Where cumulative investment returns and profits exceeded the bonuses and investment allocations to policyholder benefits, bonus stabilisation reserves were established. There was no bonus stabilisation reserve (i.e. N$ 0) at 31 December 2017 as well as at 31 December 2016.
The actuarial liability in respect of Investment contracts was taken to be the fair value of the assets backing the contracts.
An allowance for future profit payments has been made at a level consistent with assumed future experience, and our understanding of policyholder expectations.
The assumptions regarding future experience are based on best estimates suitably adjusted to provide safety margins according to the requirements of SAP104 of the Actuarial Society of South Africa.
In accordance with generally accepted practice, the best estimates of future expenses, mortality, morbidity and persistency are largely based on recent past experience rather than being an attempt to predict the future course of these variables. The most recent persistency investigation was for the period 01.01.2016 to 31.12.2016. The morbidity investigation was conducted on the experience for 2016. The mortality experience related to the period 01.01.2016 to 31.12.2016.
No allowance was made for any assumed deterioration in mortality and morbidity due to HIV/AIDS. It is expected that the impact of the epidemic on the current membership will not be significant in the near future.
The provision for expenses (before adding margins) is based on the company’s current experience. Costs per unit of benefit are assumed to escalate at 6.45% (2016: 6.60%) per annum in future. The experience will be monitored and adjustments made as and when necessary.
The future tax outgo is based on the tax basis currently applicable to life insurers and includes provision for Capital Gains Tax.
The economic assumptions were based on the following:
Bond yield at 31 December 2017 9.20%Equity return 12.20%Cash 7.70%Property return 10.20%
The assumed future gross investment return is 9.45% p.a. (2016: 9.60% p.a.)
REPORT OF THE INDEPENDENT ACTUARY (continued)
for the year ended 31 December 2017
PPS INTEGRATED REPORT 201776

4. STATUTORY CAPITAL ADEQUACY REQUIREMENTSThe statutory capital adequacy requirement is calculated to determine whether the excess of assets over liabilities is sufficient to provide for the possibility of a significant negative departure of actual future experience from the assumptions made in calculating actuarial liabilities and for significant fluctuations in the value of assets. The capital adequacy requirement has been calculated in accordance with SAP104. This guidance note prescribes various adverse scenarios that must be tested to determine the potential impact on the business of possible adverse experience. The combined excess of the assets over the liabilities for the life companies on the statutory basis is 2.6 times (2016: 2.6 times) the combined capital adequacy requirement.
In deriving the investment resilience requirement in the ordinary capital adequacy requirement (OCAR) it was assumed that a decline of 30% in equity asset values, 15% in property values, and a 24% increase in fixed interest asset values (as a result of a 25% decrease in fixed-interest yields) will occur, in accordance with SAP104.
In the case of PPS Insurance all profits and losses arising are transferred to policyholders by means of the annual profit declarations to Profit-Share Accounts. These annual declarations are non-vesting and may be positive or negative, depending on the experience of the business. When calculating the Capital Adequacy Requirement allowance may be made for the impact of management action. The management action assumed in PPS Insurance is the declaration of profits which reflect the experience each year. The impact of this management action is to reduce the Capital Adequacy Requirement.
The impact of the assumed management action in the calculation of the capital adequacy requirement on profits allocated to policyholders (total of South Africa and Namibia) is as follows:
• The impact of prescribed basis fluctuations in the mortality, morbidity and medical experience will be absorbed by a reduction in the profit allocation to Apportionment Accounts of R386 million. This is equivalent to a reduction in the current profit allocation of 35%.
• The impact of prescribed basis fluctuations in the permanent incapacity benefit claims in payment mortality experience will be absorbed by a reduction in the profit allocation to Apportionment Accounts. This assumption reduces this component of the capital adequacy requirements by R137 million, which is equivalent to a reduction in the current profit allocation of 13%.
• The impact of prescribed basis fluctuations in the level of maintenance expenses will be absorbed by a reduction in the profit allocation to Apportionment Accounts by R60 million, which is equivalent to a reduction in the current profit allocation of 5%.
• The allowance for operational risk in the CAR calculation is R159 million. We assume that should these operational risk events occur, that the impact of this will be absorbed by a reduction in the operating profit allocated to Apportionment Accounts. This is equivalent to a reduction in the aggregate profit allocation of 14%.
• The allowance for credit risk in the CAR calculation amounted to R239 million. The impact of these credit risk events materialising will result in a reduction to Special Benefit Accounts. This is equivalent to removing 1.7% of the Special Benefit Account balances at 31 December 2017.
77

• The impact of the fall in the value of assets backing the policyholder liabilities equivalent to a 30% fall in equity values and a 25% decrease in interest rates will be absorbed by reducing the special benefit accounts by R3.79 billion, which is equivalent to reducing the current special benefit accounts by 26%. These calculations do not include the potential direct impact of these risk events on assets backing the Profit-Share Accounts. The actual combined impact on the members’ Profit-Share Accounts will thus be significantly higher than shown here.
• The impact of a fall in foreign assets is not applicable as none of the assets backing the risk reserves are deemed as “foreign”.
The impact of losses arising from adverse policy terminations will be absorbed by a reduction in the special benefit accounts of R4.26 billion. This is equivalent to a reduction in the current level of special benefit accounts of 30%. The quantification of the exposure to policy terminations has been based on a less conservative measure than used to determine the capital adequacy requirements for statutory reporting purposes.
The off-setting management actions assumed above have been approved by specific resolution by the board of directors, and I am satisfied that these actions would be taken if the corresponding risks were to materialise.
5. ALTERATIONS, NOTES AND QUALIFICATIONSThe actuarial assumptions will be reviewed from time to time to reflect changes in experience and/or expectations.
REPORT OF THE INDEPENDENT ACTUARY (continued)
for the year ended 31 December 2017
PPS INTEGRATED REPORT 201778

At the end of each year policyholders’ PPS Profit-Share Account, comprising the Apportionment Accounts and the Special Benefit Accounts, are allocated a share of the profit or loss, net of movements in insurance policy liabilities earned over that year. The PPS Profit-Share Account accumulates from year to year until a policyholder reaches retirement age. On retirement, death or exit, policyholders receive a lump sum payment based on the balance accumulated in their PPS Profit-Share Account at that time. This is over and above the cover enjoyed by them as policyholders.
The PPS Profit-Share Account represents an allocation of surplus and investment returns only. This account does not belong to the policyholders, or their nominated beneficiaries (or become a ‘vested benefit’) until retirement, death or exit. The total assets backing the PPS Profit-Share Account belong to PPS Insurance or PPS Namibia at all times.
The investment returns or losses and net operating income allocated each year may be positive or negative, depending on investment return as well as the operating experience of PPS Insurance and/or PPS Namibia. Therefore, the PPS Profit-Share Account may increase or decrease in any year. Possible variations in the PPS Profit-Share Account are set out in the accounting policies and notes to these financial statements. No guarantees can be given by PPS Insurance or PPS Namibia that the allocations of operating results or investment returns will always be positive, or that the PPS Profit-Share Account will not reduce in any year.
The net operating income is allocated with reference to the qualifying products a policyholder holds and in accordance with the allocation rules for the specific products held. The investment returns are allocated in proportion to the size of the policyholders’ PPS Profit-Share Account.
For all policyholders from age 60 to 65, the full balance of the PPS Profit-Share Account is available through the Vested Profit-Share Account to such policyholders on termination of cover or resignation, subject to the vesting rules as contained in the policy document, and it is paid to the policyholders’ beneficiaries or their estates on death. For all policyholders aged 66 or older, the full balance of the PPS Profit-Share Account is available through the Vested Profit-Share Account to such policyholders, and it is paid to the policyholders’ beneficiaries or their estates on death. On surrender of a policy prior to the age of 60, policyholders are entitled to receive a lump sum termination payment determined as a proportion of the PPS Profit-Share Account at the time.
ALLOCATION TO SPECIAL BENEFIT ACCOUNTSThe following investment allocations (Note 1) for 2017 were made to the Special Benefit Accounts:
2017 2016
PPS Insurance R million R million
PPS BEE investment income gains 11.0 5.7
Investment income and gains 2 214.8 1 255.2
Total allocated 2 225.8 1 260.9
2017 2016
PPS Namibia N$ million N$ million
Total allocated 99.6 26.1
Note 1 – Investment return allocated to policyholders’ Special Benefit Accounts as a percentage of the PPS Profit-Share Account at the beginning of the year.
INVESTMENT RETURNS AND PROFIT ALLOCATION TO POLICYHOLDERS’ PPS PROFIT-SHARE ACCOUNTfor the year ended 31 December 2017
79

ALLOCATION TO APPORTIONMENT ACCOUNTSThe allocations at 31 December 2017 to policyholders’ Apportionment Accounts are set out as follows:
2017 2016
PPS Insurance R'000 R'000
Total investment income allocation 261 489 222 063
PPS Sickness and Permanent Incapacity Benefit
Ordinary (Full) 509 436 741 639
Ordinary (Reduced) 4 606 14 202
Supplementary A 87 123 85 952
Supplementary B 3 165 4 977
Deferred 68 961 59 063
Accident 3 317 4 632
Hospital benefits
Ordinary (Full) 38 960 56 738
Ordinary (Reduced) 484 1 378
Supplementary A 9 231 8 737
Supplementary B 346 537
Accident 1 031 1 470
PPS Provider
Sickness and Permanent Incapacity Plan 14 184 7 881
Professional Life Provider 193 422 130 374
Profesional Health Provider 54 544 33 446
Professional Disability provider 18 826 10 083
Accident Benefit 137 116
Bonus allocation for PPS Investments' portfolios 15 123 13 196
Bonus allocation for PPS Medical Aid products 18 587 10 028
BEE allocation 1 913 2 685
Total profit allocation 1 043 396 1 187 134
Total allocated 1 304 885 1 409 197
INVESTMENT RETURNS AND PROFIT ALLOCATION TO POLICYHOLDERS’ PPS PROFIT-SHARE ACCOUNT (continued)
for the year ended 31 December 2017
PPS INTEGRATED REPORT 201780

2017 2016
PPS Namibia N$'000 N$'000
Total Investment income allocation 14 110 10 354
PPS Sickness and Permanent Incapacity Benefit
Ordinary (Full) 38 568 35 187
Ordinary (Reduced) 1 379 1 322
Supplementary A 4 357 2 286
Supplementary B 192 179
Deferred 4 882 2 261
Accident 203 171
Hospital Benefits
Ordinary (Full) 3 640 3 327
Ordinary (Reduced) 115 107
Supplementary A 567 285
Supplementary B 28 26
Accident 74 61
Sickness and Permanent Incapacity 536 218
PPS Retirement Annuity 434 1 232
Total Profit allocation 54 975 46 662
Total allocated 69 085 57 016
81

HOLDING ENTITY The PPS Group holding entity is The Professional Provident Society Holdings Trust, registration number IT 312/2011 (‘PPS Holdings Trust’), which controls all the entities in the PPS Group.
PRINCIPAL ACTIVITIESPPS Holdings Trust is a trust registered by the Master of the High Court in terms of the Trust Property Control Act of 1988. PPS Holdings Trust's sole investment is 100% of the shares of Professional Provident Society Insurance Company Limited (‘PPS Insurance’). The beneficiaries of PPS Holdings Trust are the PPS Group companies. Membership of PPS Holdings Trust is acquired through participation in PPS Group products. The members of PPS Holdings Trust control the Group through the election of trustees. Members participate in all the profits of the PPS Group through their participation in their policyholder PPS Profit-Share Accounts.
PPS Insurance Company Limited (‘PPS Insurance’) is a long-term insurance company registered in South Africa in terms of the Long Term Insurance Act , which offers a broad range of insurance products, including sickness and incapacity benefits, life and disability benefits, critical illness benefits and business assurance policies. PPS Insurance also issues linked living annuities and endowment policies to PPS members.
Professional Provident Society Insurance Company (Namibia) Limited (‘PPS Namibia’) is a wholly-owned subsidiary of PPS Insurance and provides insurance products exclusively to the Namibian market. A reinsurance agreement with PPS Insurance is in place for PPS Namibia. In terms of this reinsurance arrangement, PPS Namibia partially reinsures its obligations to the Namibian policyholders with PPS Insurance. This arrangement was put in place in order to protect the security and benefit expectations of the Namibian policyholders by effectively including Namibian policyholders in a risk pool of over 122 000 policyholders. Without this reinsurance arrangement, the Namibian subsidiary with over 4 900 Namibian policyholders would be exposed to higher volatility from participating in a significantly smaller risk pool.
Professional Provident Society Healthcare Administrators (Pty) Limited (‘PPS Healthcare Administrators’) is a wholly-owned subsidiary of PPS Insurance, which administers Profmed and other medical schemes. PPS Healthcare Administrators’ objective is to provide excellent service and to support the sustainability of the schemes by applying scheme, benefit and tariff rules properly and managing clinical risk, to enable medical schemes to provide for the health care needs of members when they need it most.
Professional Provident Society Short-term Insurance Company Limited (‘PPS Short-Term Insurance’) is a subsidiary of PPS Insurance, in which PPS Insurance holds a 51% interest and Santam Limited the remaining 49%. PPS Short-Term Insurance is operating independently of Santam as a fully-fledged short-term insurer, offering Personal Lines, Commercial Lines and Professional Indemnity products to PPS members, and is under the control of PPS Insurance.
Professional Provident Society Investments (Pty) Limited (‘PPS Investments’) and its subsidiaries are wholly-owned subsidiaries of PPS Insurance which provide, inter alia, savings and investment products to PPS members.
PPS Mutual Limited and its operating subsidiary are affiliates of PPS Insurance launched in Sydney, Australia in February 2016. The company’s operating model replicates the PPS Group in South Africa’s mutual model, focusing on the insurance needs of graduate professionals in Australia.
The PPS Property Fund Trust (‘PPS Property Trust’) is a trust controlled by PPS Insurance, registered in terms of the Trust Property Control Act of 1988, which invests in certain investment property for the benefit of PPS Insurance.
TRUSTEES’ REPORT
PPS INTEGRATED REPORT 201782

The Professional Provident Society Foundation Trust is a trust founded by PPS Insurance and registered by the Master of the High Court in 2016 in terms of the Trust Property Control Act of 1988. It has the following principal objectives:
• To work with strategic partners to improve access to Science, Technology, Engineering and Mathematics (STEM) related professions and build the professional pipeline, especially the scarce skills disciplines
• To make a measurable contribution to sustainable development within South Africa’s communities (as defined in the DTI B-BBEE Codes of Good Practice) and FSC by:
– Empowering black school leavers with the necessary skills, competencies and FCS knowledge to access professional qualifications
– Enhancing job readiness and skills by supporting black students in tertiary institutions to ensure that they qualify as professionals
– Providing tools, programmes and mechanisms for bridging into employment
– Building strategic relationships with other organisations which have the same aims and objects as the Foundation in order to leverage and enhance impact.
• To ensure that every Rand that flows through the Foundation is spent on real sustainable, measurable benefits for the professional pipeline they serve.
The Professional Provident Society Educational Trust is a trust founded by PPS Insurance and registered by the Master of the High Court in 2016 in terms of the Trust Property Control Act of 1988. It has the following principal objectives:
• To secure financial support that makes a meaningful impact on public education in South Africa by improving access to STEM and related professions in order to build the professional pipeline in the country
• To serve as a repository for all the donations from the donors and to allocate same to the Trust Fund
• To acquire shares in designated entities, and any other assets which the Trust may acquire from time to time
• To make grants to the Beneficiaries from the Trust Fund pursuant to the Trust Activities
• To seek to make a measurable contribution to sustainable development within South Africa’s communities (as defined in the DTI B-BBEE Codes of Good Practice and FSC) by obtaining and deploying funding to advance education to build the professional pipeline
• To offer bridging programmes between secondary and tertiary education, and between tertiary education and the workplace.
Professional Provident Society Training Academy (Pty) Limited was incorporated by PPS Insurance and registered by the CIPC on 19 July 2016, and is a 51% subsidiary of The Professional Provident Society Educational Trust and operates as a training academy for the PPS Group.
GOING CONCERNThe financial statements have been prepared on the basis of accounting policies applicable to a going concern. This basis presumes that funds will be available to finance future operations and that the realisation of assets and settlement of liabilities, contingent obligations and commitments will occur in the ordinary course of business.
FINANCIAL RESULTS The financial results on pages 90 to 165 set out the results of the Trust and the PPS Group (comprising PPS Holdings Trust and all its subsidiaries).
83

INTRODUCTIONThe PPS Holdings Trust Audit Committee (‘TAC’) and the PPS Group Audit Committee (‘GAC’) are committees of PPS Holdings Trust and PPS Insurance, respectively. The responsibilities of these committees are prescribed by the Trust Deed and the Companies Act, and are outlined in their written Terms of Reference, which are in line with King IV, and are reviewed and updated annually. The committees have an independent role, with accountability to both the board and members in terms of the Companies Act and Trust Deed of PPS Holdings Trust.
The TAC has oversight over PPS Holdings Trust and the PPS Group, while the GAC has oversight over PPS Insurance and its subsidiaries. This includes oversight over the respective Risk and Audit Committees of PPS Investments and PPS Short-Term Insurance, which make reports to the GAC.
The report of the TAC and GAC is presented to the members in terms of section 94(7)(f) of the Companies Act, No 71 of 2008 (‘the Companies Act’), and a similar provision in the Trust Deed.
COMPOSITION OF THE PPS HOLDINGS TRUST AUDIT COMMITTEEMEMBERS:
Independent non-executive Trustees of PPS Holdings Trust:
Ms D L T Dondur (Chairman), B Acc (Hons), B Compt, CA(SA), MBA, Member of the TAC since 2012
Mr E A Moolla, B Iuris, Member of the TAC since 2011
Mr P Ranchod, B Compt (Hons), CA(SA), MBL, H Dip Business Data Processing, Member of the TAC since 2014
The appointment of the current Members of the TAC was confirmed by PPS members at the annual general meeting held on 22 May 2017.
The TAC was established pursuant to the Trust Deed of PPS Holdings Trust and comprises three independent non-executive trustees of PPS Holdings Trust. The members of the committee are elected annually by the members of PPS Holdings Trust at its annual general meeting, after being nominated for election by the Nominations Committee and being approved by the PPS Holdings Trust Board for election. As PPS Holdings Trust is not an operating company, but consolidates the financial results of PPS Insurance and its subsidiaries, the TAC considers the recommendations of the GAC in regard to the integrated report and the annual financial statements of PPS Insurance and its subsidiaries. There is an overlap in membership of the TAC and the GAC to ensure appropriate information is exchanged between the two audit committees, and the TAC does not replicate the work performed by the GAC in regard to PPS Insurance and its subsidiaries.
Meetings of the TAC held during the year and attendance thereat:
PPS Holdings Trust Audit Committee 8 March 2017 8 November 2017
Ms D L T Dondur (Chairman) X X
Mr E A Moolla X X
Mr P Ranchod X X
COMPOSITION OF THE PPS GROUP AUDIT COMMITTEEMEMBERS:
Independent non-executive directors of PPS Insurance:
Prof H E Wainer (Chairman), B Acc, CA(SA), Member of GAC since 2001
Ms D L T Dondur, B Acc (Hons), B Compt, CA(SA), MBA, Member of GAC since 2013
Mr C Erasmus, B Sc, FIA, Member of GAC since 2009
Mr E A Moolla, B Iuris, Member of GAC since 2015
Mr N G Payne, B Com (Hons), CA(SA), MBL, Member of GAC since 2007
Mr P Ranchod, B Compt (Hons), CA(SA), MBL, H Dip Business Data Processing, Member of the GAC since 2014
AUDIT COMMITTEES’ REPORT
PPS INTEGRATED REPORT 201784

SPECIALIST CONSULTANT:
Dr C E Rabin, D Phil, CA(SA), specialist consultant to the GAC since 2011, formerly a member of the GAC from 2005 to 2011.
Meetings held during the year and attendance thereat:
Group Audit Committee 8 March 2017 29 May 2017 11 September 2017 8 November 2017
Prof H E Wainer (Chairman) X X X X
Ms D L T Dondur X X X X
Mr C Erasmus X X X X
Mr E A Moolla X X X X
Mr N G Payne X AP X X
Mr P Ranchod X X X X
Dr C E Rabin* X X X X
*Consultant
AP = Apology
The GAC comprises six non-executive PPS Insurance directors, all of whom are independent. Dr Rabin, who is not a member of the PPS Insurance Board, and was formerly a member of the GAC, was appointed as a specialist consultant to the GAC pursuant to the requirement of the Companies Act, 2008, that all members of the GAC have to be Board members. Four of the members of the GAC and the specialist consultant are Chartered Accountants. The fifth and sixth members of the GAC are an actuary and a lawyer, respectively.
The boards are satisfied that the members of these committees have sufficient recent and relevant financial experience to enable them to carry out their duties and responsibilities and that the members of the committees bring a wide range of relevant experience and expertise. The GAC meets at least four times a year, while the TAC is scheduled to meet at least twice a year. The Chairmen of the Group Risk Committee and the Group Actuarial Committee are also members of the GAC. The Head of the Actuarial Control Function and Statutory Actuary, the Company Actuary, the external auditors, the Head of the Internal Audit Function and other relevant role players are present at each meeting of the GAC. The external auditors are present at each meeting of the TAC by invitation.
The TAC and GAC meet both the external and internal auditors separately in private sessions, without executive management being present. The Chief Executive and the Financial Director, along with other members of management, attend committee meetings, as necessary, at the invitation of the chairmen of the committees.
The PPS Group’s policy on non-audit services, which is reviewed annually by the committees, sets out what services may be provided to PPS by the external auditors. All non-audit services are pre-approved by the GAC. The committees conduct a formal external auditor evaluation process. This evaluation occurs annually and includes various criteria and standards such as independence, audit planning, technical abilities, audit process/outputs and quality control, business insight and general factors (such as black economic empowerment credentials). The committees keep abreast of current and emerging trends in international accounting standards.
Both committees have satisfied themselves:• as to the effectiveness of the PPS Group’s system of financial controls;
• that the financial statements of PPS Holdings Trust, PPS Insurance and its subsidiaries have been prepared in accordance with IFRS and the requirements of the Companies Act, 2008; and
• that the external auditor is independent of PPS Holdings Trust, PPS Insurance and its subsidiaries.
85

ROLE OF THE AUDIT COMMITTEESThe committees, inter alia, assist the trustees and directors in discharging their responsibilities relating to the safeguarding of assets, the operation of adequate and effective systems and control processes and the preparation of the integrated report and fairly presented financial statements in compliance with all applicable legal and regulatory requirements and accounting standards.
The committees performed their functions required in terms of the Companies Act and the Trust Deed and executed their responsibilities in accordance with their terms of reference. The committees performed, among others, the following functions:
• Reviewed and recommended for approval the annual financial statements
• Considered the factors and risks that might affect the financial reporting
• Confirmed the going-concern basis of preparation of the annual financial statements
• Reviewed and recommended for approval the integrated report
• Assessed the effectiveness of internal financial controls systems and formed the opinion that there were no material breakdowns in internal control
• Ensured that a combined assurance model was applied to provide a coordinated approach to all assurance activities
• Reviewed the Internal Audit Policy in line with King IV recommendations, and recommended the approval thereof to the PPS Insurance Board
• Approved the internal audit plan for the financial year
• Reviewed and evaluated reports relating to internal audit and risk management
• Nominated PricewaterhouseCoopers Inc. (‘PwC’) as the PPS Group’s external auditors
• Approved the external audit engagement letter and determined the audit fees payable to the external auditors
• Reviewed the quality and effectiveness of the external audit process and the audit plan and assessed the competence of the external auditors
• Obtained and considered a statement from the independent auditors confirming that its independence was not impaired
• Confirmed that no reportable irregularities had been identified or reported by the independent auditors under the Auditing Profession Act
• Ensured no limitations were imposed on the scope of the external audit
• Determined the nature and extent of non-audit services that the external auditors may provide and pre-approved any such services
• Maintained oversight over fraud and corruption risk management and established a protocol for whistleblowing
• Considered whether there were any concerns or complaints whether from within or outside the PPS Group relating to the accounting practices and internal audit of the PPS Group, the content or auditing of the PPS Group’s financial statements, the internal financial controls of the PPS Group or any related matter
• Made submissions to the board on matters concerning the PPS Group’s accounting policies, financial control, records and reporting.
EXTERNAL AUDITORSPwC served as the PPS Group’s external auditors for the 2017 financial year. The auditors’ terms of engagement were approved prior to the audit. The committees satisfied themselves that the external auditors’ appointment complies with the Companies Act and in particular Section 90(2) thereof, as well as the Auditing Profession Act.
The audit committees are satisfied that both PwC and the audit partner are independent. The external auditors provided assurance that their internal governance processes within their audit firm support and demonstrate their claim to independence.
Non-audit services were relatively immaterial for the current year and within the self-imposed limit set by the Group Audit Committee.
AUDIT COMMITTEES’ REPORT (continued)
PPS INTEGRATED REPORT 201786

EXPERTISE AND EXPERIENCE OF THE FINANCIAL DIRECTOR AND THE FINANCE TEAMThe committees are satisfied that the expertise and experience of the financial director are appropriate to meet the responsibilities of the position.
The committees considered the expertise, resources and experience of the PPS Group’s finance function and concluded that these are appropriate to meet the requirements of the PPS Group.
APPROVAL OF THE REPORTThe TAC and GAC confirm for the 2017 financial year that they have functioned in accordance with their Terms of Reference and as required by the Companies Act and Trust Deed of PPS Holdings Trust and that their reports have been approved by the directors and trustees.
On behalf of the audit committees:
Ms D L T Dondur Prof H E WainerChairman of TAC Chairman of GAC
28 March 2018 28 March 2018
87

INTRODUCTIONThe PPS Group Social and Ethics Committee (‘SEC’) is a statutory committee of the PPS Insurance Board established by the Board in terms of section 72(4) of the Companies Act (71 of 2008) (‘Companies Act’) and has the functions set out in Regulation 43(5) of the Companies Act.
The SEC is tasked to monitor specific activities of the PPS Insurance Group as set out below and to advise the PPS Insurance Group boards in relation to such matters. The SEC meets at least twice a year. The SEC is supported in discharging its duties by the Group Remuneration Committee, the Group Risk Committee and the Group Audit Committee.
MEMBERS
Mr N G Payne (Chairman), Independent Non-Executive Director
Mrs T Boesch, Executive Director
Mr C Erasmus, Independent Non-Executive Director
Mr I J Smit, Chief Executive
FUNCTIONS
The SEC performs all the functions as are necessary to fulfil the following statutory duties:
Monitoring the PPS Insurance Group’s activities, having regard to any relevant legislation, other legal requirements or prevailing codes of best practice, with regard to matters relating to:
• social and economic development
• good corporate citizenship
• assessment of the ethical risk profile
• labour and employment
• consumer relationships
• the environment, health and public safety
• the implementation of Treating Customers Fairly regulation
• drawing matters within its mandate to the attention of the PPS Insurance Group boards as may be required.
Reporting, through one of its members, to the members of PPS Insurance at its annual general meeting on the matters within its mandate.
The SEC meetings held during the year and attendance thereat were as follows:
Group Social and Ethics Committee 6 Mar 2017 6 Nov 2017
Mr N G Payne (Chairman) X X
Mrs T Boesch X X
Mr C Erasmus X X
Mr I J Smit X X
GROUP SOCIAL AND ETHICS COMMITTEE’S REPORT
PPS INTEGRATED REPORT 201788

Report to PPS Insurance members by the SEC
During 2017, the committee discharged its statutory duties and considered reports from the various contributors regarding the relevant functions and the following items were specifically noted:
Social and economic development • The United Nations Global Compact Principles are not legislation but reflect international best practice. PPS conducts its business in accordance with the principles regarding human rights, labour standards, the environment and anti-corruption.
• Compliance with the Employment Equity Act is managed in accordance with a report and a plan submitted to the Department of Labour, which are frequently tracked at executive management and board level.
• Various action plans are in place to address the requirements of the sectoral Broad-based Black Economic Empowerment Act and Financial Services Charter.
Good corporate citizenship • PPS promotes equality and prevents unfair discrimination against both employees and members.
• Various corporate social investment initiatives are in place to develop the professional community and students studying towards qualifying degrees.
• Various sponsorships, donations and charitable initiatives are undertaken and are regularly reviewed.
Assessment of the ethical risk profile • Corruption and fraud management is a priority for PPS and a Fraud Management Policy and Response Plan, as well as a confidential reporting facility, operated by an independent third party, are in place, and have been appropriately communicated to staff.
Consumer relationships • PPS has implemented Treating Customers Fairly (TCF) and has fully integrated it into its operations, achieving a high score using the self-assessment tool provided by the FSB for this purpose.
• Industry-specific consumer protection legislation is in place (FAIS, Long-term Insurance Act, etc.) and compliance therewith is actively managed and high levels of compliance have been achieved.
The environment, health and public safety, labour and employment
• The impact of the activities of the various companies on the environment is considered and projects to minimise the environmental impact of the operations of the organisation continue.
• The occupational health and safety of employees and clients in buildings occupied by PPS are monitored and a high level of compliance is achieved.
• Excellent working conditions are in place for all employees.
• Employment relationships are valued at PPS and programmes for continued improvements to maintain best employee practice are in place and effective, as evidenced by the results of regular employee surveys.
• Educational development of employees is achieved through various initiatives including internal and external training, induction programmes and bursary schemes.
The committee is satisfied with the reporting and governance framework to ensure compliance with its statutory responsibilities in terms of the Companies Act.
No complaints were received by the SEC during the year ended 31 December 2017 and based on the above monitoring reports, the SEC concluded that there were no specific issues under its purview which required reporting to the PPS Insurance Board or members of the PPS Group.
On behalf of the PPS Group Social and Ethics Committee:
Mr N G Payne Chairman of SEC
28 March 2018
89

Group
2017 2016
Note R’000 R’000
ASSETS
Property and equipment 2 593 445 546 196
Investment property 3 381 869 356 469
Intangible asset 4 89 941 73 187
Deferred tax 17 107 022 83 686
Financial assets - Investments at fair value through profit or loss 5 41 188 646 36 990 318
Reinsurance assets 6,12,13 99 825 75 706
Insurance and other receivables 7 502 007 420 983
Current income tax asset 12 189 45 283
Cash and cash equivalents 8 3 016 661 1 916 639
TOTAL ASSETS 45 991 605 40 508 467
EQUITY AND LIABILITIES
Accumulated funds 9 323 663 313 085
Revaluation Reserve 10 48 609 31 936
Non-controlling interest 11 77 142 55 065
TOTAL EQUITY 449 414 400 086
LIABILITIES
Long-term insurance policy liabilities 12 31 389 041 28 199 985
Short-term insurance policy liabilities 13 28 879 16 463
Investment contract liabilities 14 1 876 916 1 464 986
Liabilities to outside unit trust holders 15 10 709 000 9 088 757
Borrowings 16 180 702 186 379
Deferred tax 17 373 415 263 583
Retirement benefit obligations 18 6 818 6 738
Employee related obligations 19 198 132 157 210
Insurance and other payables 20 777 757 721 478
Current income tax liabilities 1 531 2 802
TOTAL LIABILITIES 45 542 191 40 108 381
TOTAL EQUITY AND LIABILITIES 45 991 605 40 508 467
CONSOLIDATED STATEMENT OF FINANCIAL POSITIONas at 31 December 2017
PPS INTEGRATED REPORT 201790

Group
2017 2016
Note R’000 R’000
Net insurance premium revenue 21 3 858 384 3 413 766
Other income 22 437 165 369 232
Investment income 23 1 823 561 1 658 022
Investment gains 24 2 770 571 617 358
Attributable to unit trust holders 15 (966 613) (476 512)
7 923 068 5 581 866
Net insurance benefits and claims 25 2 699 959 2 262 668
Movement in fair value of policyholder liabilities under investment contracts 14 140 060 15 296
Expenses 26 1 596 492 1 507 437
Profit before movement in insurance policy liabilities 3 486 557 1 796 465
Movement to insurance policy liabilities 12 3 011 553 1 546 773
Tax 28 465 379 226 342
Surplus after tax and policy movements 9 625 23 350
Other comprehensive income:
Revaluation of owner-occupied property net of deferred tax 18 608 8 324
Total comprehensive income for the year 28 233 31 674
The mutual nature of PPS should be noted. The allocation to policyholders - described above as ‘Movement to insurance policy liabilities’ - is a portion of the annual allocation to members’ PPS Profit-Share Account in their capacity as policyholders. The surplus after tax is the result of operations of the non-insurance subsidiaries and any increase required to maintain capital.
CONSOLIDATED STATEMENT OF PROFIT OR LOSS AND OTHER COMPREHENSIVE INCOMEfor the year ended 31 December 2017
91

Accumulated RevaluationNon-
controlling funds reserve interest Total Note R’000 R’000 R’000 R’000
Group
Balance at 1 January 2016 267 687 23 030 9 354 300 071
Transfer from DPF liability 12.2 – 582 – 582
Issue of shares by subsidiary to minority 14 532 – 53 227 67 759
Total comprehensive income/(loss) for the year 30 866 8 324 (7 516) 31 674
Surplus for the year 30 866 – (7 516) 23 350
Other comprehensive income for the year – 8 324 – 8 324
Balance at 31 December 2016 313 085 31 936 55 065 400 086
Transfer to DPF liability 12.2 – (1 935) – (1 935)Issue of shares by subsidary to minority – – 23 030 23 030Total comprehensive income/(loss) for the year 10 578 18 608 (953) 28 233
Surplus for the year 10 578 – (953) 9 625Other comprehensive income for the year – 18 608 – 18 608
Balance at 31 December 2017 323 663 48 609 77 142 449 414
CONSOLIDATED STATEMENT OF CHANGES IN EQUITYfor the year ended 31 December 2017
PPS INTEGRATED REPORT 201792

Group
2017 2016
Note R’000 R’000
Cash flows from operating activities
Cash generated from operations 29 494 191 316 548
Interest received 1 237 127 1 078 280
Dividend received 516 921 604 369
Tax paid 30 (347 208) (370 246)
Net cash from operating activities 1 901 031 1 628 951
Cash flows from investing activities
Purchases of property and equipment 2 (71 232) (104 896)
Improvements to investment property 3 (3 816) (96)
Software development 4 (35 865) (26 784)
Purchase of financial assets 5,15 (19 893 027) (16 683 118)
Proceeds from sale of furniture and equipment 338 339
Proceeds from sale of investment property – 42 795
Proceeds from disposal of financial assets 19 185 240 14 237 205
Net cash used in investing activities (818 362) (2 534 555)
Cash flows from financing activities
Proceeds from issue of share capital of subsidiary to minority 23 030 65 259
Decrease in borrowings 16 (5 677) (4 632)
Net cash from financing activities 17 353 60 627
Net increase/(decrease) in cash and bank 1 100 022 (844 977)
Cash and bank at beginning of year 1 916 639 2 761 616
Cash and bank at end of year 8 3 016 661 1 916 639
CONSOLIDATED STATEMENT OF CASH FLOWSfor the year ended 31 December 2017
93
The principal accounting policies applied in the preparation of these consolidated financial statements are set out below.
1. BASIS OF PRESENTATIONThese financial statements are prepared in accordance with International Financial Reporting Standards (‘IFRS’).
The preparation of financial statements in conformity with IFRS requires the use of certain critical accounting estimates. It also requires management to exercise its judgement in the process of applying the Group’s accounting policies. The areas involving a higher degree of judgement or complexity, or areas where assumptions and estimates are significant to the consolidated financial statements are disclosed in note 34.
All monetary information and figures presented in these financial statements are stated in thousands of Rand (R’000), unless otherwise indicated.
The Group has adopted the following new standards and amendments to standards, including any consequential amendments to other standards, with a date of initial application of 1 January 2017:
• Amendments to IAS 7, ‘Cash flow statements’
• Amendments to IAS 12, ‘Income taxes’
• Annual improvements 2014-2016, affecting IFRS 12 ‘Disclosure of interests in other entities’
These do not have a material impact on the Group’s overall results and financial position.
2. CONSOLIDATIONThe financial statements include the assets, liabilities and results of the operations of PPS Holdings Trust (‘Parent’) and its subsidiaries (‘together the Group’).
Subsidiaries
Subsidiaries are entities over which the Group directly or indirectly has control. An investor controls an investee when the investor is exposed, or has rights, to variable returns from its involvement with the investees and has the ability to affect those returns through its power over the investee.
Subsidiaries are consolidated from the date on which the Group obtains control. Subsidiaries are deconsolidated when control ceases.
All the Group subsidiaries were created by the Group. There are no acquired subsidiaries and there is no goodwill arising on consolidation.
All unit trusts which are managed by a controlled subsidiary of the Group are consolidated, irrespective of the Group’s economic interest. Third Party unit trust holders’ interests in unit trusts are liabilities of the unit trust and is classified as such in the Group.
Intra-group transactions, balances and unrealised gains on transactions are eliminated on consolidation.
Unrealised losses are also eliminated, unless the transaction provides evidence of an impairment of the asset transferred. In the Parent’s annual financial statements, the interests in subsidiaries are accounted for at cost. A provision for impairment is created if there is evidence of impairment.
Non-controlling interest
This is the minority shareholders’ interest in the surplus/deficit after tax since acquisition, and the net assets of entities controlled by the group. In the Statement of Financial Position, the non-controlling interest is disclosed as part of equity in terms of IFRS.
Associates
An associate is an entity over which the Group has the ability to exercise significant influence, but not control, through participation in the financial and operating policy decisions of the entity. Judgment is applied in assessing which entities the Group has the ability to exercise significant influence over. The Group has no shareholding in associates and therefore no rights to either net profits/losses, or net assets.
GROUP ACCOUNTING POLICIES
PPS INTEGRATED REPORT 201794
3. FINANCIAL INSTRUMENTS3.1 General
The Group initially recognises financial assets and liabilities (including assets and liabilities designated at fair value through profit or loss), when the Group becomes a party to the contractual provisions of the instrument.
Financial instruments recognised in the Statement of Financial Position include investments, other receivables, cash and cash equivalents, investment contract liabilities, borrowings, accruals, third party liabilities arising on consolidation of unit trusts and other payables.
3.2 Financial assets
The Group has the following financial asset categories: financial assets at fair value through profit or loss, as well as loans and receivables.
All financial assets are initially measured at fair value including, for financial assets not at fair value through profit or loss, any directly attributable transaction costs. All financial asset purchases and sales are initially recognised using trade date accounting.
Financial instruments at fair value through profit or loss
A financial asset is placed into this category if so designated by management upon initial recognition.
Financial assets designated at fair value through profit or loss, consist of local and foreign equities, money market instruments, government bonds, corporate bonds and unit trusts. Subsequent to initial recognition, these financial assets are accounted for at fair value. Fair value gains and losses arising from changes in fair value are included in the Statement of Profit or Loss and other Comprehensive Income as net fair value gains on financial assets in the period in which they arise.
Equity fair values are based on regulated exchange quoted bid prices at the close of business on the last trading day on or before the reporting date. Bond fair values are based on regulated exchange quoted closing prices at the close of business on the last trading day, on or before the reporting date. Unit trust fair values are based on the net asset value (price) on the reporting date.
Loans and other receivables
Loans and receivables are non-derivative financial assets with fixed or determinable payments that are not quoted in an active market.
Loans and receivables are initially measured at fair value and subsequently at amortised cost using the effective interest rate method less impairment adjustments (accounting policy note 12).
3.3 Financial liabilities
A financial liability is any liability that is a contractual obligation to deliver cash or another financial asset to another entity.
Financial liabilities include other payables, borrowings categorised as financial liabilities at amortised cost, investment contract liabilities (accounting policy note 4.2.3) and third-party financial liabilities arising on consolidation of unit trusts (accounting policy note 2), designated on initial recognition as at fair value through profit and loss.
Other payables are initially measured at fair value less transaction costs that are directly attributable to the raising of the funds, and are subsequently stated at amortised cost using the effective interest rate method. Any difference between the proceeds, net of transaction costs and the redemption value is recognised in the Statement of Profit or Loss and other Comprehensive Income over the period of borrowing.
Borrowings are recognised initially at fair value, net of transaction costs incurred. Borrowings are subsequently measured at amortised cost. Any difference between the proceeds (net of transaction costs) and the redemption value is recognised in the Statement of Profit or Loss and other Comprehensive Income over the period of the borrowings using the effective interest method.
95

GROUP ACCOUNTING POLICIES (continued)
Investment contract liabilities are initially measured at fair value less transaction costs, and are subsequently measured at fair value.
Third-party financial liabilities arising on consolidation of unit trusts are effectively demand deposits and are consequently subsequently measured at fair value, which is the unquoted unit values as derived by the fund administrator, with reference to the rules of each particular fund. Fair value gains or losses are recognised in the Statement of Profit or Loss and other Comprehensive Income.
3.4 Derecognition of financial assets and financial liabilities
The Group derecognises an asset:
• when the contractual rights to the cash flows from the asset expires;
• where there is a transfer of contractual rights to receive cash flows on the asset in a transaction in which substantially all the risks and rewards of ownership of the asset are transferred; or
• where the Group retains the contractual rights to the cash flows from these assets, but assumes a corresponding liability to transfer these contractual rights to another party and consequently transfers all or substantially all the risks and benefits associated with the assets.
Where the Group retains substantially all the risks and rewards of ownership of the financial asset, the Group continues to recognise the asset.
The Group derecognises a financial liability when its contractual obligations are discharged or cancelled or expire.
3.5 Financial Instruments, owner occupied property (accounting policy note 8) and insurance and investment contract (accounting policy note 4) analysis
IFRS 13 indicates a three tier hierarchy for fair value measurement disclosures:
Level 1: Quoted prices (unadjusted) in active markets for identical assets or liabilities. These are the readily available in the market and are normally obtainable from multiple sources.
Level 2: Inputs other than quoted prices included within Level 1 that are observable for the asset or liability, either directly (i.e. as prices) or indirectly (i.e. derived from prices).
Level 3: Inputs for the asset or liability that is not based on observable market data (unobservable inputs).
4. INSURANCE AND INVESTMENT CONTRACTS4.1 Classification of contracts
An insurance contract is a contract under which the insurer accepts significant insurance risk from the policyholder by agreeing to compensate the policyholder if a specified uncertain future event (the insured event) adversely affects the policyholder. Such contracts may also transfer financial risk. The Group defines significant insurance risk as the possibility of having to pay benefits on the occurrence of an insured event that is significantly more than the benefits payable if the insured event did not occur. Insurance contracts are classified in three main categories, depending on the type of insurance risk exposure, namely long-term insurance, short-term insurance and investments.
Investment contracts are those contracts that transfer financial risk with no significant insurance risk. These are contracts where the Group does not actively manage the investments of the policyholder over the lifetime of each policy contract. Benefits are linked to the performance of a designated pool of assets, selected based on the policy holder risk appetite.
Financial risk is the risk of a possible future change in one or more of a specified interest rate, financial instrument price, commodity price, foreign exchange rate, index of prices or rates, credit rating or credit index or other variable, provided in the case of a non-financial variable that the variable is not specific to a party to the contract.
The Group issues long-term insurance contracts that contain a discretionary participation feature (‘DPF’). This feature entitles the contract holder to receive, as a supplement to guaranteed benefits, additional benefits:
PPS INTEGRATED REPORT 201796

• that are likely to be a significant portion of the total contractual benefits;
• whose amount or timing is contractually at the discretion of the insurer; and
• that are contractually based on:
i. the performance of a specified pool of contracts or a specified type of contract;
ii. realised and/or unrealised investment returns on a specified pool of assets held by the issuer; or
iii. the profit or loss of the company, fund or other entity that issues the contract.
The classification of contracts is performed at the inception of each contract. The classification of the contract at inception remains the classification of the contract for the remainder of its lifetime, unless the terms of the contract change to such an extent that it is treated as an extinguishment of the existing contract and the issuance of a new contract.
Insurance contracts
The Group issues long-term insurance contracts that transfer insurance risk and include a DPF component. Such contracts may also transfer financial risk. The DPF component in the Group’s insurance contracts cannot be determined and separated from the insurance component from inception. The respective cash flows relating to each component are also not independent of each other.
Each year, any profits or losses arising on the non-DPF component are allocated to the DPF component. In this way a significant portion of the insurance risk is carried by the policyholder in the DPF component of their benefits. The profits or losses will include the impact of changes in the underlying assumptions or estimates on the non-DPF policy liabilities. The DPF component cannot therefore be unbundled or accounted for as a separate investment contract. In such cases, IFRS 4 accepts that the entire insurance contract is accounted for as a liability with movements through the Statement of Profit or Loss and other Comprehensive Income.
Short-term insurance contracts provide benefits under short-term policies, which include motor, household and professional indemnity, or a combination of any of those policies. Short-term insurance contracts are further classified into the following categories:
– Personal insurance, consisting of insurance provided to individuals and their personal property; or
– Commercial insurance, providing cover on the assets and liabilities of business enterprises.
4.2 Valuation and recognition
4.2.1 Long-term Insurance contracts
Principles of valuation and profit recognition
The accounting policy for the measurement of liabilities in respect of insurance contracts has been determined having regard to the Standard of Actuarial Practice (SAP’s) and Advisory Practice Notes (APN’s) issued by the Actuarial Society of South Africa (ASSA). Of particular relevance to the insurance liability calculations, are the following actuarial guidance notes:
SAP 104: Life Offices – Valuation of Long-Term Insurers;
APN 102: Life Offices – HIV/AIDS;
APN 105: Recommended AIDS extra mortality bases.
Valuation
The insurance contracts are valued in terms of the financial soundness valuation (‘FSV’) basis contained in SAP104 issued by the ASSA. A liability for contractual benefits that are expected to be incurred in the future, (the non-DPF component of the policy liabilities) is recorded in respect of the existing policy book when the premiums are recognised. The liability is determined as the sum of the expected discounted value of the benefit payments and the future administration expenses that are directly related to the contract, less the expected discounted value of the premiums to be paid in terms of the policy contract. The liability is based on best-estimate assumptions as to mortality, persistency, maintenance expenses and investment income that are established at the time the contract is issued and updated on an annual basis at reporting
97

GROUP ACCOUNTING POLICIES (continued)
date to reflect current expectations. The policy liabilities also make provision for future profit declarations to policyholders. The profits provided for are in line with the Group’s interpretation of policyholder reasonable benefit expectations. The policy liabilities are discounted using an asset-backed rate.
Compulsory margins for adverse deviations are included in the assumptions as required in terms of SAP104.
The contracts issued contain a DPF component that entitles the holder to receive, as a supplement to the sickness and permanent incapacity benefits, additional benefits or profits. These non-vesting profits are declared annually.
The terms and conditions of these contracts set out the bases for the determination of the amounts on which the additional discretionary benefits are based (the DPF component of the policy liabilities) and within which the Group may exercise its discretion as to the quantum and timing of their payment to contract holders. These benefits consist of a non-vesting allocation of profits or losses of PPS Insurance and investment returns thereon, as determined by the Group.
Where the same policy includes both insurance and investment components and the policy is classified as an insurance policy in terms of IFRS4, the liability for the insurance benefits and investment benefits are valued. To avoid premature recognition of future profit, in the policy valuation, compulsory and discretionary margins are added to the best estimate assumptions, profits are only recognised to the extent of the initial acquisition costs, thus no separate deferred acquisition cost is recognised.
The Group has an obligation upon death or retirement to pay contract holders the DPF component of their benefits (the members’ apportionment and special benefit account) with a certain deduction on resignation. This deduction that is not paid out is retained as a liability for the benefit of all contract holders until paid to them individually in future periods.
The premium component relating to the DPF element cannot be determined and separated from the fixed and guaranteed terms and is therefore recognised as revenue as described below.
Recognition: insurance contracts
Premiums
From inception of the policy, premiums are recognised on a monthly basis. Premiums are before deduction of expenses for the acquisition of insurance contracts, and before the deduction of reinsurance premiums. Premium income received in advance is included in insurance and other payables.
Insurance benefits
Insurance benefits and claims are recorded as an expense gross of any reinsurance recovery when they relate to the sickness, permanent incapacity, disability, death, retirement or resignation of a member. These claims are recognised when notified. These claims also include the movement in incurred but not reported benefits.
Unintimated claims (IBNR) are defined as ‘incurred but not reported’ claims. This liability is held in respect of the sickness and permanent incapacity policies, life and disability policies, the professional health preserver policies and the life and disability assurance group policy. The reserve is measured using a management estimate, by making assumptions about future trends in reporting of claims. It has been calculated using a consistent methodology and on a statistical basis as for previous years’ reporting. The calculation is based primarily on a weighted average historic claims payout rate. The profile of claims run-off (over time) is modelled by using historic data of the Group. The profile is then applied to actual claims data of recent periods for which the run-off is not complete. The IBNR is included in the insurance policy liabilities.
Claims payable
A claims payable liability is held in respect of sickness and permanent incapacity policies, and the professional preserver policies, where the Group has been notified of a claim before reporting date, and the claim has not been paid at reporting date. Claims payable are estimated by claims assessors for individual cases reported to the Group and are included in insurance policy liabilities.
PPS INTEGRATED REPORT 201798

Expenses for the acquisition of insurance contracts
Expenses for the acquisition of insurance contracts consist of commission and marketing management costs paid by the Group upon the acquisition of new and additional insurance business. These costs are expensed in full in the financial period during which the new policies are acquired.
Liability adequacy test
At each reporting date, liability adequacy tests are required to ensure the adequacy of the insurance contract liabilities. In performing these tests, current best estimates of future premiums, claims, and claims handling and administration expenses are used. Since the insurance policy liabilities are calculated in terms of the financial soundness valuation (‘FSV’) basis, as described in SAP104, which meets the minimum requirements of the liability adequacy test, it is not necessary to perform an additional liability adequacy test.
Recognition: Reinsurance contracts
Reinsurance contracts outwards
Contracts entered into by the Company with reinsurers under which the Company is compensated for losses on one or more insurance contracts issued by the Company and that meet the classification requirements for insurance contracts are classified as reinsurance contracts held. Contracts that do not meet these classification requirements are classified as financial assets. Insurance contracts entered into by the Company under which the contract holder is another insurer (inwards reinsurance) are recognised as reinsurance contracts.
The benefits to which the Company is entitled under its reinsurance contracts held are recognised as reinsurance assets, which are dependent on the expected reinsurance claims and benefits arising under the related reinsured insurance contracts. These assets consist of short-term balances due from reinsurers (classified as insurance and other receivables) and long-term receivables (classified as reinsurance assets).
Amounts recoverable from or due to reinsurers are measured in terms of each reinsurance contract.
Reinsurance assets are assessed for impairment at each statement of financial position date. A reinsurance asset is deemed impaired if there is objective evidence, as a result of an event that occurred after its initial recognition, that the Company may not recover all amounts due, and that event has a reliably measurable impact on the amounts that the Company will receive from the reinsurer. Impairment losses on reinsurance assets are recognised in profit and loss for the period.
Reinsurance liabilities consist of premiums payable for reinsurance contracts and are recognised as an expense when due.
Reinsurance premiums
Reinsurance premiums paid are recognised as an expense in the Statement of Profit or Loss and other Comprehensive Income when they become due for payment in terms of the contracts at the undiscounted amounts payable in terms of the contracts.
Reinsurance recoveries
Reinsurance recoveries are recognised in the statement of Profit or Loss and other Comprehensive Income in the same period as the related claim at the undiscounted amount receivable in terms of the contracts.
Reinsurance inwards
Reinsurance premiums inwards are recognised as revenue on inception of the reinsurance agreement and on a monthly basis thereafter. Reinsurance premiums inwards are calculated in terms of the reinsurance agreements and disclosed as part of reinsurance premiums.
Receivables and payables related to insurance contracts
Insurance receivables and payables are recognised when due. These include amounts due to and from agents, brokers and insurance contract holders.
99

GROUP ACCOUNTING POLICIES (continued)
4.2.2 Short-term insurance contracts
Gross written premium
Gross premiums exclude value added tax and any other foreign indirect taxes. Premiums are accounted for as income when the risk related to the insurance policy incepts and are spread over the risk period of the contract. This also includes premiums received in terms of inward reinsurance arrangements. All premiums are shown before deduction of commission payable to intermediaries.
Expenses for the acquisition of insurance contracts
Commissions on securing new contracts and renewals are deferred and recognised as expenses over the period in which the related premiums are recognised as revenue.
Provision for unearned premiums (UPR)
The provision for unearned premiums represents the portion of the current year’s premiums that relate to risk periods extending into the following year. Unearned premium is calculated using a method which approximates the 365th method, except for insurance classes where allowance is made for uneven exposure which consist of crop and alternative risk business.
Provision for unexpired risk
Provision is made for underwriting losses that may arise from unexpired risks when it is anticipated that unearned premiums will be insufficient to cover future claims, as well as claims-handling fees and related administrative costs. This liability adequacy test is performed annually to ensure the adequacy of general insurance liabilities.
Provision for claims (OCR)
Provision is made on a prudent basis for the estimated final cost of all claims that had not been settled on the accounting date, less amounts already paid. Claims and loss adjustment expenses are charged to income as incurred based on the estimated liability for compensation owed to contract holders or third parties damaged by the contract holders. The company’s own assessors or contracted external assessors individually assess claims. The claims provision includes an estimated portion of the direct expenses of the claims and assessment charges. Claims provisions are not discounted.
Provision for claims incurred but not reported (IBNR)
Provision is also made for claims arising from insured events that occurred before the close of the accounting period, but which had not been reported to the company at that date. This provision is calculated using actuarial modeling (refer note 13.1).
Reinsurance contracts outwards
Contracts entered into by the Group with reinsurers under which the Group is compensated for losses on one or more insurance contracts issued by the Group and that meet the classification requirements for insurance contracts are classified as reinsurance contracts held. Contracts that do not meet these classification requirements are classified as financial assets.
Reinsurance premiums
Reinsurance premiums are recognised as an expense in the Statement of Profit of Loss and other Comprehensive Income when they become due for payment in terms of the contracts at the undiscounted amounts payable in terms of the contract.
PPS INTEGRATED REPORT 2017100

Reinsurance claims
The benefits to which the Group are entitled under its reinsurance contracts held are recognised as reinsurance assets, which are dependent on the expected reinsurance claims and benefits arising under the related reinsured insurance contracts. These assets consist of short-term balances due from reinsurers (classified as insurance and other receivables) and long-term receivables (classified as reinsurance assets) that are calculated based on the gross OCR and IBNR reserves.
Amounts recoverable from or due to reinsurers are measured in terms of each reinsurance contract.
Reinsurance UPR
The reinsurer’s share of unearned premiums represents the portion of the current year’s outward reinsurance premiums that relate to risk periods covered by the related reinsurance contracts extending into the following year. The reinsurers’ share of unearned premium is calculated using the 365th method except in the case of non-proportional treaties where unearned premiums on minimum and deposit premiums are calculated using the eighth method.
Reinsurance Commission Revenue/Deferred Revenue Liability
Income from reinsurance contracts ceded, that varies with and is related to obtaining new reinsurance contracts and renewing existing reinsurance contracts, is deferred over the period of the related reinsurance contracts and is recognised as a current liability.
Reinsurance assets
Reinsurance assets are assessed for impairment at each statement of financial position date. A reinsurance asset is deemed impaired if there is objective evidence, as a result of an event that occurred after its initial recognition, that the Group may not recover all amounts due, and that event has a reliably measurable impact on the amounts that the Group will receive from the reinsurer. Impairment losses on reinsurance assets are recognised in profit and loss for the period.
Reinsurance liabilities
Reinsurance liabilities consist of premiums payable for reinsurance contracts and are recognised as an expense when due.
4.2.3 Investment contracts
Investment contracts are recognised as financial liabilities in the Statement of Financial Position at fair value when the Group becomes party to their contractual provisions. Contributions received from policyholders are not recognised in profit or loss but are accounted for as deposits. Amounts paid to policyholders are recorded as deductions from the investment contract liabilities.
All investment contracts issued by the Group are designated by the Group on initial recognition as at fair value through profit or loss. This designation eliminates or significantly reduces a measurement inconsistency that would otherwise arise if these financial liabilities were not measured at fair value, since the assets held to back the investment contract liabilities are measured at fair value.
Changes in the fair value of investment contracts are included in profit or loss in the period in which they arise. The change in fair value represents a change in the fair value of the assets linked to these investment contracts. The fair value of the Investment contract liability is equal to that of the assets in the unitised fund underlying the policies, as reflected by the value of units held by each policyholder. The carrying amount of the assets backing the investment contract liabilities under investment contracts reflect the fair value of the assets concerned, thus the actuarial valuation of the investment contract liabilities under unmatured investment contracts also reflect the fair value of the contractual liabilities.
Receivables and payables related to investment contracts
Amounts due from and to policyholders and agents in respect of investment contracts are included in insurance and other receivables and payables.
101
GROUP ACCOUNTING POLICIES (continued)
5. FOREIGN CURRENCY TRANSLATION5.1 Transactions and balances
The consolidated financial statements are presented in Rands, which is the Group’s presentation currency. Foreign currency transactions are translated into Rands (‘the functional currency’ in terms of IFRS) using the exchange rates prevailing at the dates of the transactions. Foreign exchange gains and losses resulting from the settlement of such transactions and from the translation at year-end exchange rates of monetary assets and liabilities denominated in foreign currencies are recognised in the Statement of Profit or Loss and other Comprehensive Income.
Translation differences on non-monetary items, such as equities held at fair value through profit or loss, are reported as part of the fair value gain or loss.
5.2 Group companies
The results and financial position of all the Group entities that have a functional currency different from the presentation currency are translated into the presentation currency as follows:
• assets and liabilities for each statement of financial position presented are translated at the closing rate at the date of that entity’s most recent statement of financial position;
• income and expenses for each Statement of Profit or Loss and other Comprehensive Income are translated at average exchange rates (unless this average is not a reasonable approximation of the cumulative effect of the rates prevailing on the transaction dates, in which case income and expenses are translated at the dates of the transactions); and
• all resulting exchange differences are recognised as a separate component of equity.
6. DIRECT AND INDIRECT TAXDirect tax includes South African and foreign jurisdiction corporate tax payable, as well as capital gains tax.
The charge for current tax is based on the results for the year. It is calculated using taxation rates that have been enacted or substantively enacted by the reporting date, in each particular jurisdiction within which the Group operates.
Tax in respect of South African life insurance operations is determined using the five-fund method applicable to life insurance companies.
7. CASH AND CASH EQUIVALENTSCash comprises cash on hand and demand deposits at call with banks. Cash equivalents comprise highly liquid investments that are convertible to cash with insignificant risk of changes in value and with original maturities of less than three months.
8. PROPERTY AND EQUIPMENTOwner-occupied property represents property held for administrative purposes and for capital appreciation, and are offices occupied by the Group. Owner-occupied property is initially recorded at cost, and is subsequently shown at fair value, based on annual valuations by external independent appraisers, less subsequent depreciation for buildings. Any accumulated depreciation at the date of revaluation is eliminated against the carrying amount of the asset, and the net amount is restated to the revalued amount of the asset. The revaluation movement is allocated to the revaluation reserve. To avoid an accounting mismatch, the related movement in insurance policy liabilities is mirrored to the revaluation reserve.
Land is not depreciated.
Changes to the carrying amount arising on revaluation of land and buildings are recognised through other comprehensive income.
Other fixed assets are stated at historical cost less depreciation. Historical cost includes expenditure that is directly attributable to the acquisition of the items.
PPS INTEGRATED REPORT 2017102

Subsequent costs are included in the assets’ carrying amount or recognised as a separate asset, as appropriate, only when it is probable that future economic benefits associated with the item will flow to the Group and the cost of the item can be measured reliably. All other repairs and maintenance are charged to profit or loss during the financial period in which they are incurred.
Depreciation is calculated using the straight-line method to allocate their cost or revalued amounts to their residual values over their estimated useful lives, as follows:
• Buildings 50 years;
• Vehicles 5 years;
• Computer hardware 3 years;
• Furniture and fittings 6 years;
• Office equipment 5 years;
• Leasehold improvements the lesser of 5 years or the period of the lease.
The assets’ residual values and useful lives are reviewed at each reporting date and adjusted if appropriate. An asset’s carrying amount is written down immediately to its recoverable amount if the asset’s carrying amount is greater than its estimated recoverable amount.
Gains and losses on disposals are included in the Statement of Profit or Loss and other Comprehensive Income and are determined by comparing sales proceeds with the carrying amount.
9. INTANGIBLE ASSETSComputer software development costs
Costs that are directly associated with the production of identifiable and unique software products controlled by the Group, and that will probably generate economic benefits exceeding costs beyond one year, are recognised as an intangible asset when the following criteria are met:
• it is technically feasible to complete the software product so that it will be available for use;
• management intends to complete the software product and use or sell it;
• there is an ability to use or sell the software product;
• it can be demonstrated how the software product will generate probable future economic benefits;
• adequate technical, financial and other resources to complete the development and to use or sell the software product are available; and
• the expenditure attributable to the software product during its development can be reliably measured.
Direct costs include the external software development team’s costs. Computer software acquired as part of the software development project is capitalised on the basis of the acquisition costs and related costs to bring it to use. All other costs associated with developing or maintaining computer software programmes are recognised as an expense as incurred.
Computer software development costs recognised as assets are amortised, from the date the asset is brought into use, using the straight-line method over their useful lives, not exceeding a period of five years. The useful lives of the assets are reviewed at each reporting date and adjusted if appropriate.
10. INVESTMENT PROPERTYInvestment properties are held for the purpose of earning rental income and for capital appreciation. Investment properties are initially recorded at cost and include transaction costs on acquisition. Subsequent expenditure is capitalised to the asset’s carrying value, only when it is probable that the future economic benefits associated with the item will flow to the group and the cost can be measured reliably.
103

GROUP ACCOUNTING POLICIES (continued)
Investment properties are valued annually and adjusted to fair value as at the reporting date. Properties purchased within six months of the year-end are valued at cost, unless an independent valuation is performed.
Properties under construction, which are excluded from investment property valuations, are carried at cost where the PPS Property Fund Trust is satisfied that cost is a reasonable approximation of fair value. On completion, the cost is transferred to the carrying value of investment property and subsequently valued independently.
Any gain or loss arising from the fair value of the investment property is included in the Statement of Profit or Loss and other Comprehensive Income for the period to which it relates.
Gains and losses on the disposal of investment properties are recognised in the Statement of Profit or Loss and other Comprehensive Income and are calculated as the difference between the sale price and the carrying value of the property.
11. LEASESOperating leases where a Group company is the lessee
Payments made under operating leases (net of any incentives received from the lessor) are charged to the Statement of Profit or Loss and other Comprehensive Income on a straight-line basis over the period of the lease. Minimum rentals due after year-end are reflected under commitments.
Operating leases where a Group company is the lessor
Rental income from investment property is recognised as revenue on a straight-line basis over the term of the lease. Rental income from other property is classified as other income.
12. IMPAIRMENT OF ASSETSFinancial assets
The Group assesses at each reporting date whether there is objective evidence that a financial asset or group of financial assets carried at amortised cost is impaired. A financial asset or group of financial assets is impaired and impairment losses are incurred if, and only if, there is objective evidence of impairment as a result of one or more events that have occurred after the initial recognition of the asset (a ‘loss event’) and that loss event (or events) has an impact on the estimated future cash flows of the financial asset or group of financial assets that can be reliably estimated.
Objective evidence that a financial asset or group of assets is impaired includes the following events:
• significant financial difficulty of the issuer or debtor;
• a breach of contract, such as default or delinquency in payments;
• adverse changes in the payment status of issuers or debtors in the Group; or
• national or local economic conditions that correlate with defaults on assets in the Group.
If there is objective evidence that an impairment loss has been incurred on receivables, including those related to insurance contracts, the amount of the loss is measured as the difference between the financial asset’s carrying amount and the present value of estimated future cash flows discounted at the asset’s original effective interest rate. The carrying amount of the asset is reduced either directly against the asset or through the use of an allowance account for impairment losses. The amount of the loss is recognised in the Statement of Profit or Loss and other Comprehensive Income.
If in a subsequent period, the amount of the impairment loss decreases and the decrease can be related objectively to an event occurring after the impairment was recognised (such as improved credit rating), the previously recognised impairment loss is reversed by adjusting the impairment provision account. The amount of the reversal is recognised in the Statement of Profit or Loss and other Comprehensive Income.
Non-financial assets
Assets that are subject to amortisation are reviewed for impairment whenever events or changes in circumstances indicate that the carrying amount may not be recoverable. Such indicators include continued losses, changes in technology, market, economic, legal and operating environments.
PPS INTEGRATED REPORT 2017104

An impairment loss is recognised for the amount by which an asset’s carrying amount exceeds its recoverable amount. The recoverable amount is measured using the higher of fair value less costs to sell and value-in-use. Value-in-use is the present value of projected cash flows covering the remaining useful life of the asset. The carrying amount of the asset is reduced directly against the asset. The amount of the loss is recognised in the Statement of Profit or Loss and other Comprehensive Income.
If in a subsequent period, the amount of the impairment loss decreases and the decrease can be related objectively to an event occurring after the impairment was recognised, the previously recognised impairment loss is reversed by adjusting the impairment provision account. The amount of the reversal is recognised in the Statement of Profit or Loss and other Comprehensive Income.
13. DEFERRED TAXATIONDeferred tax is provided, using the liability method, on temporary differences arising between the tax value of assets and liabilities and their carrying amounts in the consolidated financial statements. Deferred tax is not recognised on initial recognition of the assets and liabilities where it does not impact either accounting or taxable profit. Deferred tax is determined using tax rates (and laws) that have been enacted or substantively enacted by the reporting date and are expected to apply when the related deferred tax asset is realised or the deferred tax liability is settled. For Investment Property measured at fair value, deferred tax is provided at rates applicable to capital gains. The principal temporary differences arise from the revaluation of financial assets held at fair value through profit or loss and provisions.
Deferred tax assets relating to the carry forward of unutilised tax losses are recognised to the extent that it is probable that future taxable profit will be available against which the tax losses can be utilised.
Deferred tax liabilities and assets are not discounted.
14. EMPLOYEE BENEFITS14.1 Pension / retirement obligations
The Group provides for retirement benefits of employees by means of a defined contribution pension and provident fund. The assets are held in separate funds controlled by trustees appointed by the Group and employees.
14.2 Post-retirement medical obligations
The Group provides for the unfunded post-retirement healthcare benefits of a small number of retirees, their spouses and dependents. For past service of employees, the Group recognises and provides for the actuarially determined present value of post-retirement medical aid employer contributions on an accrual basis using interest rates with reference to the market yield of government bonds at reporting date.
An independent actuary performs valuations of the defined benefit obligation, annually at reporting date, using the projected unit credit method to determine the present value of its post-retirement medical obligations and related current and past service costs.
Actuarial gains and losses arising from experience adjustments and changes in actuarial assumptions are charged or credited in the Statement of Profit or Loss and other Comprehensive Income in the period in which they arise.
14.3 Termination benefits
Termination benefits are recognised as an expense in the Statement of Profit or loss and other Comprehensive Income and a liability in the statement of financial position when the Group has a present obligation relating to termination.
14.4 Leave pay provision
The Group recognises employees’ rights to annual leave entitlement in respect of past service accumulated at reporting date.
14.5 Management bonuses
Management bonuses are recognised as an expense in staff costs as incurred when it is probable that the economic benefits will be paid and the amount can be reliably measured. Management bonuses arise as a result of a contractual obligation, but the amount of the bonus is at the discretion of the employer.
105

GROUP ACCOUNTING POLICIES (continued)
14.6 Long-term incentive and retention schemes
Long-term incentive and retention schemes for certain employees are in place. The entitlement to these benefits is based on the employee remaining in service of the Group for a period of three to five years, depending on the scheme.
The present value of the long-term incentive scheme is determined by discounting the estimated cash flows using an appropriate bond yield curve as at the reporting date, applying the projected unit credit method.
The growth of the benefit under the retention scheme is based on the five-year historical rolling average.
15. REVENUE15.1 Insurance premium revenue
See accounting policies 4.2.1 and 4.2.2.
15.2 Other income
Other income is measured at the fair value of the consideration received or receivable.
Policy administration and collection services fee income are fees arising from services rendered in conjunction with the administration of long-term insurance policies which are underwritten by other insurance companies as well as Retirement Annuities housed in the PPS Retirement Annuity Fund.
Fees are recognised as services are rendered.
Administration fees include fees charged to medical aid schemes and PPS Beneficiaries Trust, for administration services rendered to these entities.
Investment management fees include service fees earned in respect of investment management services rendered.
Commission received is recognised in the accounting period in which it accrues.
15.3 Investment income
Investment income comprises interest, dividends, as well as net fair value gains or losses on financial assets held at fair value through profit or loss.
Interest is recognised as income on the effective interest method. Interest income on financial assets at fair value through profit or loss is recognised as part of the fair value movement.
Dividends are recognised as income on the last day to register in respect of listed shares. Dividends include shares received in terms of capitalisation issues, irrespective of whether there is an option to receive cash in lieu of shares.
Net unrealised profits and losses on financial assets held at fair value through profit or loss comprise of gains and losses on disposal or revaluation of assets to fair values and are recognised in the Statement of Profit or loss and other Comprehensive Income.
PPS INTEGRATED REPORT 2017106

1. FINANCIAL INSTRUMENT AND INSURANCE CONTRACT ANALYSISThe tables analyse each class of financial instrument and insurance contracts per category as well as provide their fair values, where applicable.
R'000 Note
Financial assets and
liabilities designated
at fair value through
profit or loss on initial
recognition
Financial assets and
liabilities at
amortised cost
Insurance contract
assets and liabilities
Pre-payments
Total carrying amount Fair value
Group 2016
Equity securities
Local listed 5 12 815 373 – – – 12 815 373 12 815 373
International listed 5 59 285 – – – 59 285 59 285
Debt securities
Government and local bonds 5 6 684 947 – – – 6 684 947 6 684 947
International listed 5 201 335 – – – 201 335 201 335
Unit trusts and pooled funds 5 17 229 378 – – – 17 229 378 17 229 378
Reinsurance assets 6 – – 75 706 – 75 706 N/A
Insurance receivables 7 – – 32 829 – 32 829 N/A
Prepayments 7 – – – 39 959 39 959 39 959
Other receivables 7 – 291 538 – – 291 538 291 538
Reinsurance receivables 7 – – 56 657 – 56 657 N/A
Cash and cash equivalents 8 1 527 746 388 893 – – 1 916 639 1 916 639
Insurance contract liabilities 12 – – 28 199 985 – 28 199 985 N/A
Short-term insurance policy liabilities 13 – – 16 463 – 16 463 N/A
Investment contract liabilities 14 1 464 986 – – – 1 464 986 1 464 986
Liabilities to unit trust holders 15 9 088 757 – – – 9 088 757 9 088 757
Borrowings 16 – 186 379 – – 186 379 186 379
Reinsurance payables 20 – – 22 270 – 22 270 N/A
Insurance payables 20 – – 46 995 – 46 995 N/A
Accruals and sundry creditors 20 – 652 213 – – 652 213 652 213
NOTES TO THE CONSOLIDATED FINANCIAL STATEMENTSfor the year ended 31 December 2017
107

NOTES TO THE CONSOLIDATED FINANCIAL STATEMENTS (continued)
for the year ended 31 December 2017
R'000 Note
Financial assets and
liabilities designated
at fair value through
profit or loss on initial
recognition
Financial assets and
liabilities at
amortised cost
Insurance contract
assets and liabilities
Pre-payments
Total carrying amount Fair value
Group 2017 Equity securities
Local listed 5 14 711 830 – – – 14 711 830 14 711 830International listed 5 96 834 – – – 96 834 96 834
Debt securities Government and local bonds 5 7 094 137 – – – 7 094 137 7 094 137International listed 5 328 108 – – – 328 108 328 108
Unit trusts and pooled funds 5 18 957 737 – – – 18 957 737 18 957 737Reinsurance assets 6 – – 99 825 – 99 825 N/AInsurance receivables 7 – – 58 161 – 58 161 N/APrepayments 7 – – – 32 185 32 185 32 185Other receivables 7 – 369 030 – – 369 030 369 030Reinsurance receivables 7 – – 42 631 – 42 631 N/ACash and cash equivalents 8 2 616 774 399 887 – – 3 016 661 3 016 661Insurance contract liabilities 12 – – 31 389 041 – 31 389 041 N/AShort-term insurance policy liabilities 13 28 879 – 28 879 N/AInvestment contract liabilities 14 1 876 916 – – – 1 876 916 1 876 916Liabilities to unit trust holders 15 10 709 000 – – – 10 709 000 10 709 000Borrowings 16 – 180 702 – – 180 702 180 702Reinsurance payables 20 – – 22 770 – 22 770 N/AInsurance payables 20 – – 50 715 – 50 715 N/AAccruals and sundry creditors 20 – 704 272 – – 704 272 704 272
PPS INTEGRATED REPORT 2017108

2. PROPERTY AND EQUIPMENT
Owner- Vehicles,
office occupied Computer furniture & Leasehold property hardware equipment improvements TotalGroup R’000 R’000 R’000 R’000 R’000
Year ended 31 December 2016
Opening net book amount 363 783 40 787 41 900 20 677 467 147
Revaluation surplus 9 491 – – – 9 491
Depreciation relating to revaluation (480) – – – (480)
Additions 56 093 30 207 18 269 2 826 107 395
Disposals: Cost – (320) (677) – (997)
Disposals: Accumulated Depreciation – 320 547 – 867
Depreciation charge (865) (21 200) (12 027) (3 135) (37 227)
Closing net book amount 428 022 49 794 48 012 20 368 546 196
At 31 December 2016
Cost or valuation 441 269 149 661 113 374 27 660 731 964
Accumulated depreciation (13 247) (99 867) (65 362) (7 292) (185 768)
Net book amount 428 022 49 794 48 012 20 368 546 196
Non-current 428 022 49 794 48 012 20 368 546 196
Year ended 31 December 2017 Opening net book amount 428 022 49 794 48 012 20 368 546 196Revaluation surplus 19 259 – – – 19 259Depreciation relating to revaluation (503) – – – (503)Additions 17 498 23 669 29 118 947 71 232Disposals: Cost – (43 552) (17 862) – (61 414)Disposals: Accumulated Depreciation – 43 542 17 685 – 61 227Depreciation charge (854) (24 410) (13 885) (3 403) (42 552)
Closing net book amount 463 422 49 043 63 068 17 912 593 445
At 31 December 2017 Cost or valuation 478 026 129 778 124 630 28 607 761 041Accumulated depreciation (14 604) (80 735) (61 562) (10 695) (167 596)
Net book amount 463 422 49 043 63 068 17 912 593 445
Non-current 463 422 49 043 63 068 17 912 593 445
The land and buildings revaluation reserve represents the capital appreciation on the owner-occupied properties. As the properties are held to back insurance policy liabilities, with discretionary participation features, the movement in insurance policy liabilities as a result of the revaluation is recognised directly in equity.
Deferred tax has been provided on the revaluation difference arising on owner-occupied property owned by PPS Insurance Company Limited, based on the amounts and at the rate applicable to capital gains.
Owner occupied property is carried at fair value and is classified as level 3 in terms of the IFRS 13 hierarchy.
The Group’s owner-occupied property owned by PPS Insurance Company Limited at a carrying value after revaluation of R165.0 million (2016: R145.0 million) was revalued at 31 December 2017 by CB Richard Ellis (Pty) Limited, an independent valuator. The property consists of an office block situated at 6 Anerley Road, Parktown, which is occupied by the Group.
109

NOTES TO THE CONSOLIDATED FINANCIAL STATEMENTS (continued)
for the year ended 31 December 2017
Owner-occupied properties owned by the PPS Property Fund Trust consist of PPS Centurion Square at a carrying value after revaluation of R275.5 million (2016: R260.9 million) and 11 Eton Road at R22.9 million (2016: R22.1 million). PPS Centurion Square was revalued at 31 December 2017 by Mills Fitchet (Pty) Limited and 11 Eton Road by Quadrant Properties (Pty) Limited, both independent valuators.
Valuations were performed using the discounted cash flow of future income stream method. The discounted cash flow method takes projected cash flows and discount them at a rate which is consistent with comparable market transactions. Refer to note 34.5 for valuation assumptions. The opening carrying value is depreciated and then adjusted to reflect market value at year end.
If land and buildings were stated on a historical cost basis, the amounts would be as follows:
Group
2017 2016
R’000 R’000
Cost 360 664 343 166
Accumulated depreciation (11 238) (10 384)
Net book amount as at 31 December 349 426 332 782
3. INVESTMENT PROPERTY
Group
2017 2016
R’000 R’000
Opening net book amount 356 469 378 506
Additions 3 816 96
Revaluation surplus 21 584 17 511
Disposals – (39 644)
Net carrying value at 31 December 2017 381 869 356 469
Investment properties were valued by independent valuators on 31 December 2017 who hold a recognised and relevant qualification. Valuations were performed using the discounted cash flow of future income stream method. Investment property is carried at fair value. Fair value measurement is classified at level 3.
Investment property under construction is carried at cost.
PPS INTEGRATED REPORT 2017110

4. INTANGIBLE ASSET – SOFTWARE DEVELOPMENT COSTS
Group
2017 2016
R’000 R’000
Cost beginning of year 205 739 178 955
Accumulated amortisation beginning of year (132 552) (115 158)
Net carrying value at beginning of year 73 187 63 797
Opening net carrying value 73 187 63 797
Additions 35 865 26 784
Obsolete: Cost (2 924) –
Obsolete: Accumulated amortisation 2 924 –
Amortisation (19 111) (17 394)
Closing net carrying value 89 941 73 187
Cost 238 680 205 739
Accumulated amortisation (148 739) (132 552)
Net carrying value at end of year 89 941 73 187
5. FINANCIAL ASSETS – INVESTMENTS AT FAIR VALUE THROUGH PROFIT OR LOSS
Group
2017 2016
R'000 R'000
Analysis of financial assets held at fair value through profit or loss
Level 1 fair value financial assets
Equity securities:
– local listed 14 711 830 12 815 373
– international listed 96 834 59 285
14 808 664 12 874 658
Level 2 fair value financial assets
Debt securities – fixed interest rate:
– government bonds and local listed 7 094 137 6 684 947
– international listed 328 108 201 335
7 422 245 6 886 282
Unit trusts and pooled funds:
– local pooled funds and unit trusts 12 620 444 11 824 709
– international equity unit trusts 3 595 646 3 074 118
– international fixed interest unit trusts 145 800 147 032
– international balanced unit trusts 2 595 847 2 183 519
18 957 737 17 229 378
111
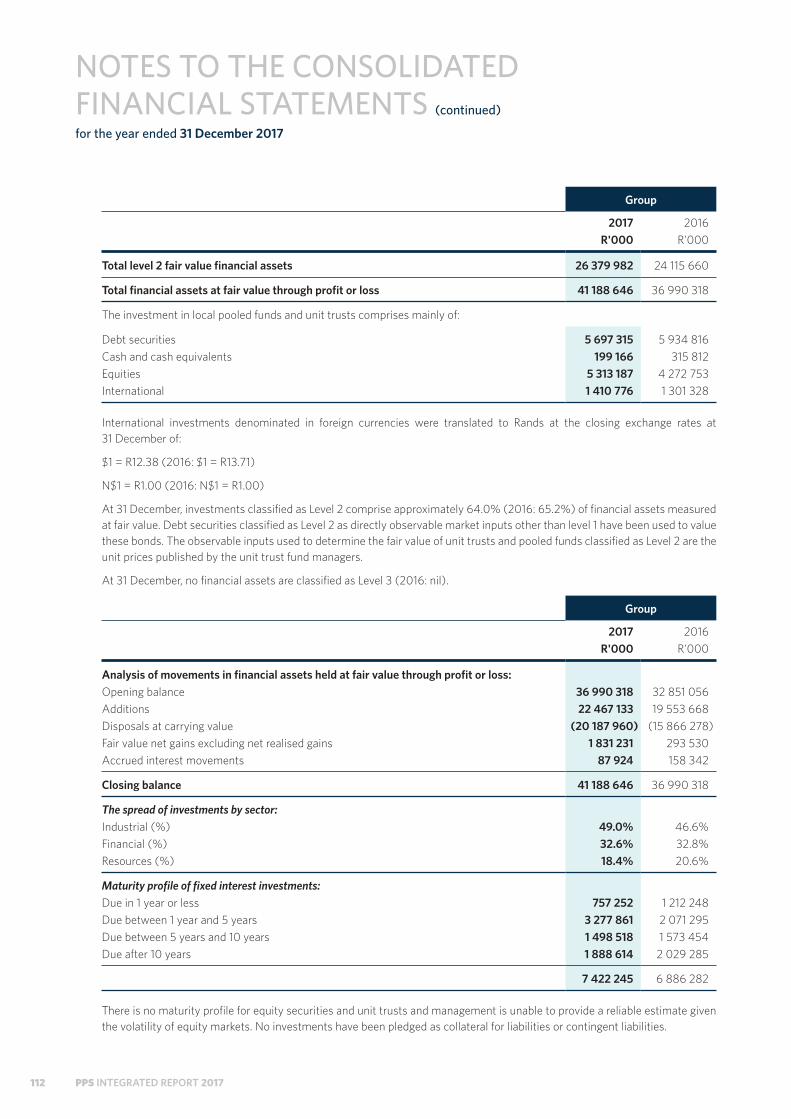
NOTES TO THE CONSOLIDATED FINANCIAL STATEMENTS (continued)
for the year ended 31 December 2017
Group
2017 2016
R'000 R'000
Total level 2 fair value financial assets 26 379 982 24 115 660
Total financial assets at fair value through profit or loss 41 188 646 36 990 318
The investment in local pooled funds and unit trusts comprises mainly of:
Debt securities 5 697 315 5 934 816
Cash and cash equivalents 199 166 315 812
Equities 5 313 187 4 272 753
International 1 410 776 1 301 328
International investments denominated in foreign currencies were translated to Rands at the closing exchange rates at 31 December of:
$1 = R12.38 (2016: $1 = R13.71)
N$1 = R1.00 (2016: N$1 = R1.00)
At 31 December, investments classified as Level 2 comprise approximately 64.0% (2016: 65.2%) of financial assets measured at fair value. Debt securities classified as Level 2 as directly observable market inputs other than level 1 have been used to value these bonds. The observable inputs used to determine the fair value of unit trusts and pooled funds classified as Level 2 are the unit prices published by the unit trust fund managers.
At 31 December, no financial assets are classified as Level 3 (2016: nil).
Group
2017 2016
R'000 R'000
Analysis of movements in financial assets held at fair value through profit or loss:
Opening balance 36 990 318 32 851 056
Additions 22 467 133 19 553 668
Disposals at carrying value (20 187 960) (15 866 278)
Fair value net gains excluding net realised gains 1 831 231 293 530
Accrued interest movements 87 924 158 342
Closing balance 41 188 646 36 990 318
The spread of investments by sector:
Industrial (%) 49.0% 46.6%
Financial (%) 32.6% 32.8%
Resources (%) 18.4% 20.6%
Maturity profile of fixed interest investments:
Due in 1 year or less 757 252 1 212 248
Due between 1 year and 5 years 3 277 861 2 071 295
Due between 5 years and 10 years 1 498 518 1 573 454
Due after 10 years 1 888 614 2 029 285
7 422 245 6 886 282
There is no maturity profile for equity securities and unit trusts and management is unable to provide a reliable estimate given the volatility of equity markets. No investments have been pledged as collateral for liabilities or contingent liabilities.
PPS INTEGRATED REPORT 2017112

6. REINSURANCE ASSETS AND LIABILITIES
Group
2017 2016
R’000 R’000
REINSURANCE ASSETS
Total assets arising from reinsurance contracts at beginning of the year 75 706 –
Transfer from reinsurance liabilities – (7 851)
Reinsurers’ share of long-term insurance policy liabilities (note 12.2) 25 275 81 322
Reinsurers’ share of short-term insurance policy liabilities (note 13.2) (1 156) 2 235
Total assets arising from reinsurance contracts at end of the year 99 825 75 706
Non-current 99 825 75 706
REINSURANCE LIABILITIES
Total liabilities arising from reinsurance contracts at beginning of the year – (7 851)
Transfer to reinsurance assets – 7 851
Reinsurers’ share of long-term insurance policy liabilities (note 12.2) – –
Reinsurers’ share of short-term insurance policy liabilities (note 13.2) – –
Total liabilities arising from reinsurance contracts at end of the year – –
Non-current – –
Amounts due from reinsurers in respect of claims already paid by the Group on the contracts that are reinsured are included in insurance and other receivables (note 7).
7. INSURANCE AND OTHER RECEIVABLES
Group
2017 2016
R’000 R’000
Receivables arising from insurance and reinsurance contracts: 100 792 89 486
– due from contract holders 70 903 45 929
– less allowance for impairment losses from receivables from contract holders (12 742) (13 100)
– due from reinsurers 42 631 56 657
Other receivables: 369 030 291 538
– accrued interest 20 397 6 506
– accrued dividends 57 020 89 321
– loan to associate company 153 691 135 079
– deferred acquisition costs 64 14
– other receivables 137 858 60 618
Prepayments 32 185 39 959
Total receivables including insurance receivables and prepayments 502 007 420 983
Current 502 007 420 983
Fair value of other receivables held at amortised cost 369 030 291 538
113

NOTES TO THE CONSOLIDATED FINANCIAL STATEMENTS (continued)
for the year ended 31 December 2017
Group
2017 2016
R’000 R’000
Allowances for impairment losses of receivables from contract holders
Specific allowances for impairment
At beginning of year 13 100 12 168
Impairment loss recognised 5 136 4 470
Impairment loss reversals (5 494) (3 538)
At end of year 12 742 13 100
8. CASH AND CASH EQUIVALENTS
Group
2017 2016
R’000 R’000
Cash at bank and in hand 399 887 388 893
Cash on call 2 616 774 1 527 746
Total cash and cash equivalents 3 016 661 1 916 639
The proportion of cash held to fund the working capital of the Group as part of the investment portfolio is 13.3% (2016: 20.0%) of total cash and cash equivalents. The balance of the cash is held as part of the investment portfolio. The effective interest rate earned was 6.50% (2016: 6.65%).
9. ACCUMULATED FUNDSThe accumulated funds balance represents the amount of reserves which is not distributable as this is part of the amount the Group must retain to cover the long-term insurance statutory capital adequacy requirement ('CAR'). The Group has maintained its level of CAR cover at 2.6 times (2016: 2.6 times) which has resulted in R9.5 million (2016: R38.3 million) being allocated to accumulated funds in the current year from the surplus after tax. Additional allocations to accumulated funds arise from the surplus after tax and non-controlling interests of subsidiaries.
10. REVALUATION RESERVE
Group
2017 2016
R’000 R’000
Opening balance 31 936 23 030
Revaluation surplus 19 259 9 491
Deferred tax (148) (687)
Depreciation relating to cumulative revaluation (503) (480)
Transfer (to)/from Long Term Insurance Policy Liabilities (1 935) 582
Closing balance 48 609 31 936
Revaluation reserve consists of fair value gains/losses on the revaluation of owner-occupied properties in the Group.
PPS INTEGRATED REPORT 2017114

11. NON-CONTROLLING INTEREST
Group
2017 2016
R’000 R’000
Non-controlling interest 77 142 55 065
Non-controlling interest consists of minorities' share of the Net Asset Value of PPS Short-term Insurance Company Limited and PPS Property Fund Trust.
12. LONG TERM INSURANCE POLICY LIABILITIES12.1 Long-term life insurance contracts – assumptions, change in assumptions and sensitivity
(a) Process used to decide on assumptions
The sickness and disability contracts issued by the Group include a non-DPF and a DPF component. The non-DPF component includes sickness and disability benefits. The DPF component includes the surplus rebate accounts allocated to each policyholder. The participating nature of these contracts results in the insurance and other risk being carried by the insured parties. These contracts are however managed and accounted for as one contract.
The determination of the non-DPF liabilities under long-term insurance contracts is dependent on estimates made by the Statutory Actuary. Any changes in estimates will impact on the size of the non-DPF policy liabilities and on the bonus rates the Group declares to the DPF component of the policy liabilities. Hence the changes in estimates will impact on the balance between the DPF component of the liabilities and the non-DPF component of the liabilities. In aggregate the changes will have no impact on the value of the total policy liabilities.
The assumptions used for the insurance contracts disclosed in this note are as follows:
• Mortality
Estimates are made as to the expected future mortality experience. The estimates are based on standard industry and national mortality tables that reflect historical mortality experience, adjusted where appropriate to reflect the Group’s own experience. The main sources of uncertainty are epidemics such as AIDS and wide-ranging lifestyle changes, such as in eating, smoking and exercise habits. These uncertainties could result in future mortality being significantly worse than in the past. However, continuing improvements in medical care and social conditions could result in improvements in longevity.
An investigation into the Group’s experience over the most recent year is performed to calibrate the base table to the PPS experience. The estimates of future mortality are based on standard industry and national mortality tables that reflect historical mortality experience, adjusted where appropriate to reflect the Group’s own experience. The base table currently in use is SA85-90.
• Morbidity
Estimates are made as to the expected number of temporary and permanent incapacity claims for each of the years in which the Group is exposed to risk. These estimates are based on morbidity tables that reflect the 01/01/2016 to 31/12/2016 morbidity experience of the Group. The main source of uncertainty is epidemics such as AIDS, Severe Acute Respiritory Syndrome, economic conditions and wide-ranging lifestyle changes, such as in eating, smoking and exercise habits. These uncertainties could result in future morbidity being worse than in the past for the age groups in which the Group has significant exposure to morbidity risk. The estimated morbidity experience determines the value of the future benefit payments in the policy liabilities.
The rates of disability claims are derived from the experience of the Group over the preceding two years.
• Persistency
Estimates are made as to the future rate at which policyholders will terminate their contracts prior to the original maturity date. These estimates are based on the 01/01/2016 to 31/12/2016 experience of the business. The future termination rates will vary with economic conditions, the profitability of the business and with changes in consumer behaviour.
115

NOTES TO THE CONSOLIDATED FINANCIAL STATEMENTS (continued)
for the year ended 31 December 2017
• Investment returns
Risk-free fixed interest securities: the risk free rates are based on the gross yields to redemption of a benchmark government security. For the current valuation, this rate is 9.2% (2016: 9.4%) per annum effective.
Equity investments: the expected long term return – dividends and capital growth – is derived by adding to the risk-free rate of return an equity risk premium of 3% (2016: 3%).
Cash investments: the expected long term return on cash and money market investments is derived by subtracting from the risk-free rate of return a margin of 1.5% (2016:1.5%).
Overall investment return: A weighted average rate of investment return is derived by combining different proportions of the above financial assets in a model portfolio, which is assumed to back the liabilities. The overall investment return was 9.45% gross of tax in 2017 (9.6% in 2016). These model portfolios are consistent with the asset allocation strategies as set out by the Group.
• Renewal expense level and inflation
Estimates are made as to the future level of administration costs to be incurred in administering the policies in force at the current year end, using a functional cost approach. This approach allocates expenses between policy and overhead expenses and within policy expenses, between new business, maintenance and claims. These future costs are assumed to increase each year in line with an assumed inflation rate. The assumed inflation rate is set at a level consistent with the assumed future investment returns. Variations in administration costs may arise from any cost reduction exercises implemented by management or from cost overruns relative to budget.
The current level of expenses is taken as an appropriate expense base. Expense inflation is assumed to be 2.75% (2016: 2.75%) below the current return on risk free interest securities.
• Tax
It has been assumed that current tax legislation and rates continue unaltered. Allowance is made for future tax and tax relief.
• Future profit allocations
The assumed future profit allowance on the non-DPF portion of the liabilities are in line with the Group’s past practice and members’ reasonable expectations.
(a) IBNR
The IBNR liability calculation is based on run-off tables using historical data from 2012 to 2017. Due to the short term over which these liabilities will be settled, no allowance is made for claims handling expenses, claims inflation, adjustments for trends, unusual claims or loss ratios, and the IBNR liability is undiscounted.
(b) Change in assumptions
The assumptions used to calculate the non-DPF portion of the policy liabilities are updated annually to reflect current best estimates of future experience. Changes to the assumptions will result in changes to the amount of the non-DPF policy liabilities. The impact of the changes will be included in the profits allocated to the DPF component of the policy liabilities.
Consequently the aggregate value of the policy liabilities will be unchanged as a result of changes to the assumptions.
The economic basis changes led to an increase in liabilities of R129.8 million (2016: R464.0 million decrease). The non-economic changes amounted to a R11.2 million decrease (2016: R2.0 million increase) in liabilities.
PPS INTEGRATED REPORT 2017116
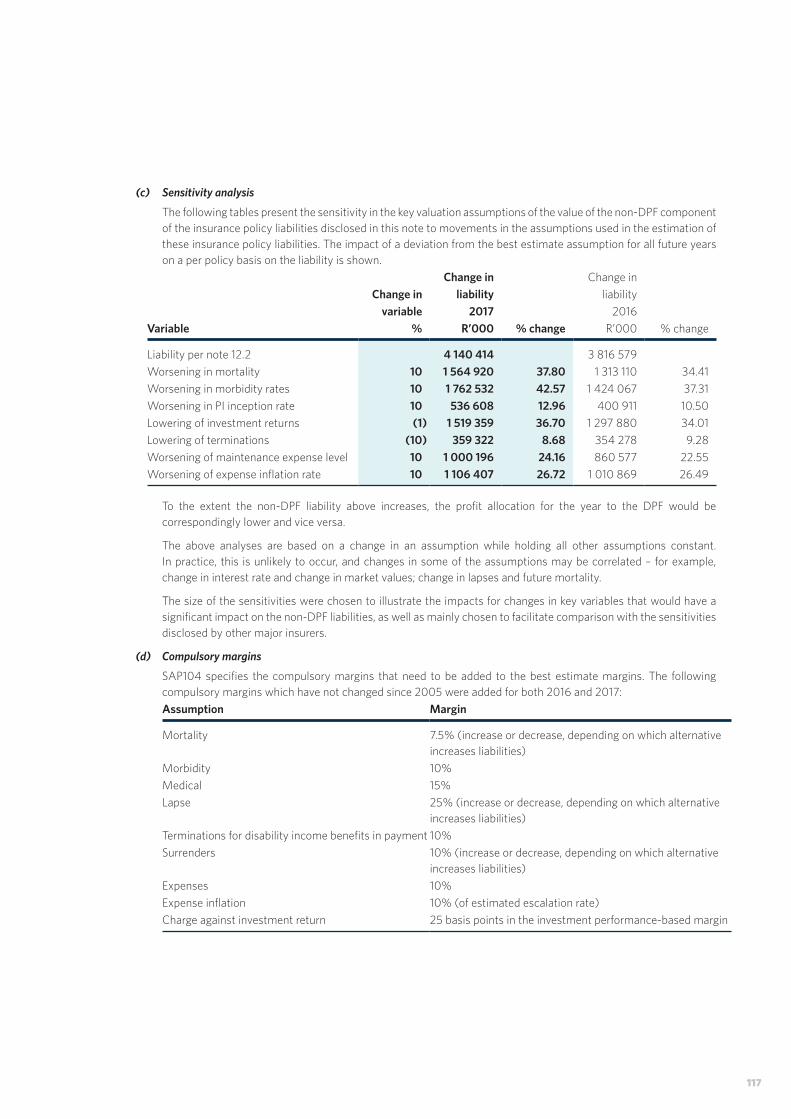
(c) Sensitivity analysis
The following tables present the sensitivity in the key valuation assumptions of the value of the non-DPF component of the insurance policy liabilities disclosed in this note to movements in the assumptions used in the estimation of these insurance policy liabilities. The impact of a deviation from the best estimate assumption for all future years on a per policy basis on the liability is shown.
Change in Change in
Change in liability liability
variable 2017 2016
Variable % R’000 % change R’000 % change
Liability per note 12.2 4 140 414 3 816 579
Worsening in mortality 10 1 564 920 37.80 1 313 110 34.41
Worsening in morbidity rates 10 1 762 532 42.57 1 424 067 37.31
Worsening in PI inception rate 10 536 608 12.96 400 911 10.50
Lowering of investment returns (1) 1 519 359 36.70 1 297 880 34.01
Lowering of terminations (10) 359 322 8.68 354 278 9.28
Worsening of maintenance expense level 10 1 000 196 24.16 860 577 22.55
Worsening of expense inflation rate 10 1 106 407 26.72 1 010 869 26.49
To the extent the non-DPF liability above increases, the profit allocation for the year to the DPF would be correspondingly lower and vice versa.
The above analyses are based on a change in an assumption while holding all other assumptions constant. In practice, this is unlikely to occur, and changes in some of the assumptions may be correlated – for example, change in interest rate and change in market values; change in lapses and future mortality.
The size of the sensitivities were chosen to illustrate the impacts for changes in key variables that would have a significant impact on the non-DPF liabilities, as well as mainly chosen to facilitate comparison with the sensitivities disclosed by other major insurers.
(d) Compulsory margins
SAP104 specifies the compulsory margins that need to be added to the best estimate margins. The following compulsory margins which have not changed since 2005 were added for both 2016 and 2017:
Assumption Margin
Mortality 7.5% (increase or decrease, depending on which alternative increases liabilities)
Morbidity 10%
Medical 15%
Lapse 25% (increase or decrease, depending on which alternative increases liabilities)
Terminations for disability income benefits in payment 10%
Surrenders 10% (increase or decrease, depending on which alternative increases liabilities)
Expenses 10%
Expense inflation 10% (of estimated escalation rate)
Charge against investment return 25 basis points in the investment performance-based margin
117

NOTES TO THE CONSOLIDATED FINANCIAL STATEMENTS (continued)
for the year ended 31 December 2017
12.2 Movements in long-term insurance policy liabilities and re-insurance assets – Long-term insurance contracts with and without DPF
Group
2017 2016
GrossRe-
insurance Net GrossRe-
insurance Net
R’000 R’000 R’000 R’000 R’000 R’000
Sickness and disability policies
– Claims payable (notified claims) 13 956 – 13 956 14 500 – 14 500
– Unintimated claims (IBNR) 59 311 – 59 311 56 865 – 56 865
– Non-DPF liability 3 884 523 67 944 3 816 579 3 989 359 (13 523) 4 002 882
– Cessation benefits (notified claims) 143 318 – 143 318 119 482 – 119 482
– DPF liability 23 948 940 – 23 948 940 22 223 556 – 22 223 556
Life policies
– Claims payable (notified claims) 54 766 – 54 766 93 901 – 93 901
– Unintimated claims (IBNR) 27 691 5 139 22 552 30 596 4 615 25 981
– Life assurance policy reserve 682 388 294 1 872 1 057 815
Other benefits and liabilities 66 798 – 66 798 60 886 – 60 886
Total at beginning of the year 28 199 985 73 471 28 126 514 26 591 017 (7 851) 26 598 868
Change in Insurance policy liabilities per Statement of Comprehensive Income 3 036 828 25 275 3 011 553 1 628 095 81 322 1 546 773
Transfer from / (to) Revaluation Reserve 1 935 – 1 935 (582) – (581)
Movement in claims liabilities
– arising from current year claims 132 619 – 132 619 (7 155) – (7 155)
– arising from prior year claims 17 674 – 17 674 (11 390) – (11 391)
Total movement in insurance policy liabilities 3 189 056 25 275 3 163 781 1 608 968 81 322 1 527 646
Total movement allocated 3 189 056 25 275 3 163 781 1 608 968 81 322 1 527 646
Sickness and disability policies
– Claims payable (notified claims) 5 336 – 5 336 (544) – (544)
– Unintimated claims (IBNR) 14 949 – 14 949 2 446 – 2 446
– Non-DPF liability 348 931 25 096 323 835 (104 836) 81 467 (186 303)
– Cessation benefits (notified claims) 18 057 – 18 057 23 836 – 23 836
– DPF liability 2 665 926 – 2 665 926 1 725 384 – 1 725 384
Life policies
– Claims payable (notified claims) 105 669 – 105 669 (39 135) – (39 135)
– Unintimated claims (IBNR) 12 957 415 12 542 (2 905) 524 (3 429)
– Life assurance policy reserve (193) (236) 43 (1 190) (669) (521)
Other benefits and liabilities 17 424 – 17 424 5 912 – 5 912
PPS INTEGRATED REPORT 2017118

Group
2017 2016
GrossRe-
insurance Net GrossRe-
insurance Net
R’000 R’000 R’000 R’000 R’000 R’000
Analysis of balance at the end of the year:
Sickness and disability policies
– Claims payable (notified claims) 19 292 – 19 292 13 956 – 13 956
– Unintimated claims (IBNR) 74 260 – 74 260 59 311 – 59 311
– Non-DPF liability 4 233 454 93 040 4 140 414 3 884 523 67 944 3 816 579
– Cessation benefits (notified claims) 161 375 – 161 375 143 318 – 143 318
– DPF liability 26 614 866 – 26 614 866 23 948 940 – 23 948 940
Life policies
– Claims payable (notified claims) 160 435 – 160 435 54 766 – 54 766
– Unintimated claims (IBNR) 40 648 5 554 35 094 27 691 5 139 22 552
– Life assurance policy reserve 489 152 337 682 388 294
Other benefits and liabilities 84 222 – 84 222 66 798 – 66 798
Total at the end of the year 31 389 041 98 746 31 290 295 28 199 985 73 471 28 126 514
Current 540 232 5 554 534 678 365 840 5 139 360 701
Non-current 30 848 809 93 192 30 755 617 27 834 145 68 332 27 765 813
Total 31 389 041 98 746 31 290 295 28 199 985 73 471 28 126 514
Group
2017 2016
R’000 R’000
The non-DPF liabilities developed as follows:
Liabilities at beginning of the year 3 816 579 4 002 884
Unwinding of discount rate 370 175 380 195
Expected cash flows 953 964 699 106
Expected risk liability at year-end 5 140 718 5 082 185
Impact of movements (82 064) (37 535)
Change in valuation assumptions (118 588) (465 946)
Asset value adjustments (623) 14 898
Risk benefit liability for new business issued (799 029) (777 023)
Liabilities at end of year 4 140 414 3 816 579
The DPF liabilities developed as follows:
Liabilities at beginning of the year 23 948 940 22 223 557
Claims paid during the year (1 026 456) (1 023 105)
Allocation of profits 3 734 971 2 758 492
Asset value adjustments (42 589) (10 004)
119

NOTES TO THE CONSOLIDATED FINANCIAL STATEMENTS (continued)
for the year ended 31 December 2017
Group
2017 2016
R’000 R’000
Liabilities at end of year 26 614 866 23 948 940
Analysis of total insurance policy liabilities, net of reinsurance:
Non-DPF liabilities 4 140 414 3 816 579
DPF liabilities 26 614 866 23 948 940
Life assurance policy reserve 337 294
Current liabilities 534 678 360 701
Liabilities at end of year 31 290 295 28 126 514
13. SHORT-TERM INSURANCE POLICY LIABILITIES13.1 Short-term insurance contracts – assumptions
Insurance risks are unpredictable and the Group recognises that it is not always possible to forecast, with absolute precision, future claims payable under existing insurance contracts. Over time, the Group has developed a methodology that is aimed at establishing insurance provisions that have an above-average likelihood of being adequate to settle all its insurance obligations.
Unearned premium provision
Unearned premiums represent the proportion of premiums written in the current year, which relate to risks that have not expired by the end of the financial year. The Group raises provisions for unearned premiums on a basis that reflects the underlying risk profile of its insurance contracts. An unearned premium provision is created at the commencement of each insurance contract and is released as the risk covered by the contract expires. All of the Group’s insurance contracts have an even risk profile. Therefore, the unearned premium provision is released evenly over the period of insurance using a time proportion basis. The provision for unearned premiums is first determined on a gross level and thereafter the reinsurance impact is separately recognised based on the relevant reinsurance contract. Reinsurance commission revenue is recognised on a basis that is consistent with the related provision for unearned premiums. At each reporting date an assessment is made of whether the provisions for unearned premiums are adequate. A separate provision can be made, based on information available at the reporting date, for any estimated future underwriting losses relating to unexpired risks (unexpired risk provision).
Unexpired risk provision
If the expected value of claims and expenses attributable to the unexpired periods of policies in force at the statement of financial position date exceeds the unearned premiums provision in relation to those policies, after deduction of any deferred commission expenses, management assesses the need for an unexpired risk provision. The need for an unexpired risk provision is assessed on the basis of information available at the reporting date. Claims events occurring after the statement of financial position date in relation to the unexpired period of policies in force at that time are not taken into account in assessing the need for an unexpired risk provision. Management will base the assessment on the expected outcome of those contracts, including the available evidence of claims experience on similar contracts in the past year, as adjusted for known differences, events not expected to recur, and the normal level of seasonal claims.
Outstanding claims
Outstanding claims represent the Group’s estimate of the cost of settlement of claims that have occurred and were reported by the reporting date, but that have not yet been finally settled. Claims provisions are determined based on previous claims experience, knowledge of events, the terms and conditions of the relevant policies and on the interpretation of circumstances. Each notified claim is assessed on a separate case-by-case basis with due regard for the specific circumstances, information available from the insured and/or loss adjuster, past experience with similar cases and historical claims payment trends. The approach also includes the consideration of the development of loss
PPS INTEGRATED REPORT 2017120

payment trends, the levels of unpaid claims, legislative changes, judicial decisions and economic conditions. The Group employs employees experienced in claims handling and rigorously applies standardised policies and procedures to claims assessment. The ultimate cost of reported claims may vary as a result of future developments or better information becoming available about the current circumstances. Therefore, case estimates are reviewed regularly and updated when new information becomes available. The provision for outstanding claims is initially estimated at a gross level. A separate calculation is performed to estimate reinsurance recoveries. The calculation of reinsurance recoveries considers the type of risk underwritten, the year in which the loss claim occurred, under which reinsurance programme the recovery will be made, the size of the claim and whether the claim was an isolated incident or formed part of a catastrophe reinsurance claim.
Claims incurred but not reported (IBNR)
There is also considerable uncertainty concerning the eventual outcome of claims that have occurred but had not yet been reported to the insurer by the reporting date. The IBNR provision relates to these events. The stochastic chain-ladder methodology assists in developing a greater understanding of the trends inherent in the data being projected to estimate the ultimate cost of claims. This process is performed separately for each line of business.
Stochastic chain-ladder methodology
The basic technique involves analysing historical claims development factors and selecting estimated development factors based on this historical pattern. The selected development factors are applied to cumulative internal claims data for each accident year that is not yet fully developed to produce an estimated ultimate claims cost for each accident year. It is the nature of this technique that a weighted average of claims inflation within the past data will be projected into the future.
A stochastic process is applied to the choice of development factors for each accident year in accordance with standard statistical practices. Numerous simulations are performed to obtain a distribution of the ultimate claims cost. The IBNR reserve is held so as to be at least sufficient at the 75th percentile of the ultimate cost distribution.
As this method uses historical claims development information, it assumes that the historical claims development pattern is a predictor of future claim developments. There are reasons why this may not be the case. Such reasons include:
• change in processes that affect the development/recording of claims paid and incurred;
• economic, legal, political and social trends;
• changes in mix of business; and
• random fluctuations, including the impact of large losses.
The degree of uncertainty will vary by policy class according to the characteristics of the insured risks and the cost of a claim will be determined by the actual loss suffered by the policyholder. There may be significant reporting lags between the occurrence of the insured event and the time it is actually reported to the Group. Following the identification and notification of an insured loss, there may still be uncertainty as to the magnitude and timing of the settlement of the claim. The establishment of insurance liabilities is an inherently uncertain process and as a consequence of this uncertainty, the eventual cost of settlement of outstanding claims can vary substantially from the initial estimates. The Group seeks to provide appropriate levels of claims provisions taking the known facts and experience into account. It should be emphasised that the estimation techniques for the determination of insurance liabilities involve obtaining corroborative evidence from as wide a range of sources as possible and combining these to form the overall estimate.
121

NOTES TO THE CONSOLIDATED FINANCIAL STATEMENTS (continued)
for the year ended 31 December 2017
13.2 SHORT-TERM INSURANCE POLICYHOLDER LIABILITIES
Group
2017 2016
GrossRe-
insurance Net GrossRe-
insurance Net
R’000 R’000 R’000 R’000 R’000 R’000
Notified claims 10 501 2 235 8 266 – – –
Incurred but not reported 5 836 – 5 836 – – –
Unearned premiums 126 – 126
Liabilities at the beginning of the year 16 463 2 235 14 228 – – –
Movement in claims liabilities
– Notified claims 10 591 (1 156) 11 747 10 501 2 235 8 266
– Incurred but not reported 933 – 933 5 836 – 5 836
Movement in unearned premiums 892 – 892 126 – 126
Total movement in insurance policy liabilities 12 416 (1 156) 13 572 16 463 2 235 14 228
Notified claims 21 092 1 079 20 013 10 501 2 235 8 266
Incurred but not reported 6 769 – 6 769 5 836 – 5 836
Unearned premiums 1 018 – 1 018 126 – 126
Liabilities at the end of the year 28 879 1 079 27 800 16 463 2 235 14 228
Current 28 879 1 079 27 800 16 463 2 235 14 228
Group
2017 2016
R’000 R’000
Claims and loss adjustment expenses developed as follows:
Notified claims 8 266 –
Incurred but not reported 5 836 –
Total at the beginning of the year 14 102 –
Increase in liabilities
- arising from current year claims settled 87 043 14 102
- movement in insurance liabilities and current year claims (74 363) –
Liabilities at the end of year 26 782 14 102
Notified claims 20 013 8 266
Incurred but not reported 6 769 5 836
Total 26 782 14 102
Unearned premiums is developed as follows:
Total at the beginning of the year 126 –
Charged to the Statement of Comprehensive Income 892 126
Liabilities at the end of year 1 018 126
PPS INTEGRATED REPORT 2017122

14. INVESTMENT CONTRACT LIABILITIES
Group
2017 2016
R’000 R’000
Level 2 fair value investment contract liabilities
Linked investment contracts 1 876 916 1 464 986
Non-current 1 876 916 1 464 986
All investment contracts are designated on initial recognition as at fair value through profit or loss.
The liabilities relating to linked contracts are measured with reference to the underlying assets linked to these contracts. PPS is contractually required to pay linked investment contract holders an amount equal to the fair value of the assets linked to these contracts. Linked contracts do not include any minimum guarantees and hence, there will be no difference between the carrying amount and the amount payable at the maturity date.
Investment contract liabilities are classified as Level 2, as the assets backing up these liabilities are unit trust funds of which the fair values are derived from the unit prices published by the unit trust fund managers.
Group
2017 2016
Movement table for investment contract liabilities R’000 R’000
Linked contracts
Balance at 1 January 1 464 986 1 139 647
Contributions received during the year 460 178 420 263
Fair value of policyholder liabilities under investment contracts 140 060 15 295
Net investment return credited to account balances 158 669 29 887
Net fees and charges deducted from account balances (18 609) (14 592)
Benefit payments (188 308) (110 219)
Balance at 31 December 1 876 916 1 464 986
15. LIABILITIES TO OUTSIDE UNIT TRUST HOLDERS 2017 2016
R'000 R'000
Liabilities to outside unit trust holders
Balance at 1 January 9 088 757 7 673 934
Investment by outside unit trust holders 2 574 106 2 870 550
Redemptions by outside unit trust holders (1 920 476) (1 932 239)
Total comprehensive income attributable to outside unit trust holders 966 613 476 512
Balance at 31 December 10 709 000 9 088 757
Current 10 709 000 9 088 757
Liabilities to outside unit trust holders are classified as Level 2, as the fair value of the unit trust funds are derived from unit prices published by the unit trust fund managers.
The total comprehensive income attributed to outside unit trust holders are their share of the gains/ losses in the unit trust.
123

NOTES TO THE CONSOLIDATED FINANCIAL STATEMENTS (continued)
for the year ended 31 December 2017
16. BORROWINGS
Group
Carrying amount and
fair value 2017 2016
R’000 R’000
Amortised cost
Mortgage loans (Secured) 157 309 165 075
Minority shareholder loans in PPS Property Fund Trust (Unsecured) 23 393 21 304
Total borrowings 180 702 186 379
Current 24 050 22 774
Non-current 156 652 163 605
A mortgage loan of R5.8 million bears interest at prime less 0.5% and is payable over 10 years, commencing on 1 September 2013.
A mortgage loan of R151.5 million bears interest at prime less 1% and is payable over 10 years, commencing on 20 January 2017, when it was converted from a development loan.
Minority shareholder loans in PPS Property Fund Trust carry interest at prime less 1%. These loans are payable between 31 October 2032 and 31 October 2035.
17. DEFERRED TAX
Group
2017 2016
R’000 R’000
Deferred tax assets:
Provisions 49 836 43 060
Tax losses carried forward 57 186 40 626
End of year 107 022 83 686
Deferred tax liabilities:
Unrealised gains on investments 370 481 260 797
Unrealised gains on land and buildings revaluation 2 934 2 786
End of year 373 415 263 583
Current asset 47 228 32 420
Non-current asset 59 794 51 266
Non-current liability 373 415 263 583
PPS INTEGRATED REPORT 2017124

The movement in the deferred tax assets and liabilities during the year is as follows:
(a) Deferred tax assets on provisions and computed tax losses
Group
R’000
At 1 January 2016 60 743
Recognised in profit or loss 22 943
At 31 December 2016 83 686
Recognised in profit or loss 23 336
At 31 December 2017 107 022
The utilisation of the deferred tax asset in respect of the provision for leave pay is dependent on the taking of leave and/or payment or forfeiture of amounts due in respect of leave accrued by employees. The utilisation of the deferred tax asset in respect of the tax losses is dependent on the relevant group entities making future profits. It is assessed as recoverable based on the probability of the future profitability of the entity.
(b) Deferred tax liabilities
Group
Deferred tax liability on
revaluation of
investments
Deferred tax liability on
cumulative revaluation of land and
buildings Total R’000 R’000 R’000
At 1 January 2016 350 981 2 099 353 080
Recognised in profit or loss 4 746 – 4 746
Recognised directly in equity – 687 687
Transfer to current income tax liabilities (94 930) – (94 930)
At 31 December 2016 260 797 2 786 263 583
Recognised in profit or loss 204 614 – 204 614Recognised directly in equity – 148 148Transfer to current income tax liabilities (94 930) – (94 930)
At 31 December 2017 370 481 2 934 373 415
125

NOTES TO THE CONSOLIDATED FINANCIAL STATEMENTS (continued)
for the year ended 31 December 2017
18. RETIREMENT BENEFIT OBLIGATIONS
Group
2017 2016
R’000 R’000
Statement of Financial Position obligations for:
– post-retirement medical benefits 6 818 6 738
6 818 6 738
Statement of profit or loss and comprehensive income charge for (note 27):
– post-retirement medical benefits 690 (361)
690 (361)
Post-employment medical benefits
The Group provides for the unfunded post-retirement healthcare benefits of those employees and a small number of retirees employed before 4 October 1999, as well as their spouses and dependants. The entitlement to post-retirement healthcare benefits is based on an employee remaining in service up to retirement and completion of a minimum service period.
The latest actuarial valuation of the Group’s post-employment benefits, carried out at 31 December 2017 indicated a present value of projected future benefits amounting to R6.8 million (2016: R6.7 million).
Group 2017 2016
The principal actuarial assumptions used were as follows:
Discount rate based on the Long-term Bond Index (%) 8.99 9.25
Medical cost inflation (%) 7.77 8.49
The assumed rates of mortality are as follows:
During employment: SA85-90 (Light) ultimate table ; and
Post-employment: PA(90) ultimate table rated down two years plus 1% improvement per annum (from a base year of 2006) .
19. EMPLOYEE RELATED OBLIGATIONS
Group
2017 2016
R’000 R’000
Leave pay accrual
Opening balance 25 870 22 978
Charged to the statement of profit or loss and other comprehensive income
– additional provisions 19 368 15 907
Used during the year (14 895) (13 015)
PPS INTEGRATED REPORT 2017126

Group
2017 2016
R’000 R’000
Closing balance 30 343 25 870
Current 30 343 25 870
Provision for performance related incentives
Opening balance 131 340 124 411
Additional provisions (executive directors and employees) 124 507 89 361
Used during the year (88 058) (82 432)
Closing balance 167 789 131 340
Current 86 636 63 462
Non-current 81 153 67 878
Total employee related obligations 198 132 157 210
20. INSURANCE AND OTHER PAYABLES
Group
2017 2016
R’000 R’000
Payables arising from insurance and reinsurance contracts:
– due to contract holders 44 388 41 253
– due to contract holders – life assurance policy 66 70
– reinsurance payables 22 770 22 270
– subscriptions received in advance 6 261 5 672
Other payables:
– accruals 665 557 614 356
– employees tax 12 496 12 584
– sundry creditors 26 219 25 273
Total insurance and other payables 777 757 721 478
Current 777 757 721 478
127

NOTES TO THE CONSOLIDATED FINANCIAL STATEMENTS (continued)
for the year ended 31 December 2017
21. NET INSURANCE PREMIUM REVENUE
Group
2017 2016
R’000 R’000
Individual premiums from policyholders 4 046 567 3 519 008
Long-term 3 936 341 3 514 230
Short-term 110 226 4 778
Group reinsurance premiums inwards 75 320 131 267
Long-term 44 848 43 160
Short-term 30 472 88 107
Premium revenue arising from insurance contracts issued 4 121 887 3 650 275
Individual premium revenue ceded to reinsurers on insurance contracts issued (263 503) (236 509)
Long-term (257 900) (230 515)
Short-term (5 603) (5 994)
Total net insurance premium revenue 3 858 384 3 413 766
Long-term 3 723 289 3 326 875
Short-term 135 095 86 891
22. OTHER INCOME
Group
2017 2016
R’000 R’000
Policy administration and collection services 38 287 11 877
Administration fees 245 204 230 294
Investment management services 59 487 59 959
Commission 15 314 10 025
Rental income 47 233 48 404
Sundry income 31 640 8 673
Total other income 437 165 369 232
23. INVESTMENT INCOME
Group
2017 2016
R’000 R’000
Financial assets held at fair value through profit or loss
– Interest income 1 338 941 1 234 010
– Dividend income 484 620 424 012
Total investment income 1 823 561 1 658 022
PPS INTEGRATED REPORT 2017128

24. INVESTMENT GAINS
Group
2017 2016
R’000 R’000
Financial assets held at fair value through profit or loss
– Net realised gains on disposal of financial assets 1 014 642 321 636
– Net realised foreign exchange losses (96 886) (18 470)
– Net unrealised gains on revaluation of financial assets 1 831 231 293 530
Investment property
– Fair value gains on investment property 21 584 17 511
– Net realised gains on disposal of investment property – 3 151
Total Investment gains 2 770 571 617 358
25. NET INSURANCE BENEFITS AND CLAIMS
Group
2017 2016
R'000 R'000
Gross
Long-term insurance contracts with and without DPF
– Individual sickness and incapacity benefits: Current year 1 045 854 874 202
– Individual sickness and incapacity benefits: Under/(over) provision for prior year 17 674 (11 391)
– Group non-DPF component of death benefits 697 526 518 248
– Individual DPF component of death, retirement and resignation benefits 1 018 036 976 429
Short-tem insurance contracts
– Personal lines 96 168 65 222
– Commercial 1 899 –
Total gross insurance benefits and recoveries 2 877 157 2 422 710
Reinsurance recoveries
Long-term insurance contracts with and without DPF
– Individual sickness and incapacity benefits (79 789) (54 439)
– Death benefits (96 330) (105 603)
Short-term insurance contracts
– Personal lines (1 073) –
– Commercial (6) –
Total reinsurance recoveries (177 198) (160 042)
Total net insurance benefits and claims 2 699 959 2 262 668
129

NOTES TO THE CONSOLIDATED FINANCIAL STATEMENTS (continued)
for the year ended 31 December 2017
26. EXPENSES
Group
2017 2016
R'000 R'000
Costs incurred for the acquisition of insurance contracts expensed in the year:
– Long-term insurance 236 511 222 782
– Sickness and incapacity policies 180 713 175 607
– Whole life policies 55 798 47 175
– Short-term Insurance 8 341 11 587
Multi-managers' fees – PPS Investments 74 671 71 397
Marketing and administrative expenses include :
– Amortisation of intangible asset (note 4) 19 111 17 394
– Auditors’ remuneration 7 886 6 872
– Audit fees 7 159 5 822
– Other services 727 1 050
– Data processing and information technology systems maintenance 142 800 130 760
– Depreciation on property and equipment (note 2) 42 552 37 227
– Directors'/Trustees' and executives' remuneration 24 714 31 797
– Directors /Trustees – non-executive 8 254 7 726
– Executive directors of PPS Insurance 14 353 22 389
– Directors of other subsidiaries 2 107 1 682
– Employee costs (note 27) 738 083 685 293
– Fees for services 16 396 13 904
– Actuarial 9 298 6 744
– Legal 4 608 4 881
– Internal audit 2 490 2 279
– Investment management fees 62 228 76 291
– Other administration, maintenance and product development expenses 189 156 175 028
– Operating lease rentals 34 043 27 105
Total expenses 1 596 492 1 507 437
VAT which cannot be recovered from the relevant taxation authority is expensed together with the related expense.
PPS INTEGRATED REPORT 2017130

27. EMPLOYEE COSTS
Group
2017 2016
R’000 R’000
Salaries and related costs 586 874 564 484
Pension costs – defined contribution plans 57 131 47 658
Other post-employment benefits (note 18) 690 (361)
Performance related incentives 93 388 73 512
Total employee costs (excluding executives) 738 083 685 293
28. TAX
Group
2017 2016
R’000 R’000
Current tax 223 442 196 900
– Current year tax 223 438 196 709
– Prior years underprovision 4 191
Deferred tax 181 278 (18 197)
Dividend withholding tax on deemed dividends 60 659 47 639
Total tax 465 379 226 342
Tax on the Group’s profit before tax differs from the theoretical amount that would arise using the tax rate applicable to South African/Namibian companies as follows:
Profit before movement in policy liabilities 3 486 557 1 796 465
Tax calculated at domestic tax rates applicable to profits in South Africa/Namibia 1 004 894 526 699
Tax effect of income not subject to tax (1 541 112) (1 169 819)
Tax effect of non-deductible expenses 952 455 816 475
Tax effect of tax rate on Dividend Withholding Tax on deemed dividends being different to tax rate on the individual policyholder fund ('IPF') 36 396 41 847
Prior year underprovision 4 191
Deferred tax raised – prior year – (266)
Tax effect of CF tax rate being different to IPF tax rate 12 742 11 215
Total tax per Statement of profit or loss and other comprehensive income 465 379 226 342
The applicable tax rate was 28% (2016: 28%) for South African companies and 32% (2016: 32%) for Professional Provident Society Insurance Company (Namibia) Limited. Professional Provident Society Insurance Company Limited has four separate tax funds: the individual policyholders’ fund (taxed at 30%), the Company policyholders’ fund (taxed at 28%), the untaxed policyholder's fund (not taxed) and the corporate fund (taxed at 28%). Professional Provident Society Insurance Company Limited does not qualify as having a Risk Policy Fund as defined under section 29A of the Income Tax Act, No. 58 of 1962. The tax reconciliation is done on total tax on all funds. The Professional Provident Society Holdings Trust is taxed at 45%.
Dividend withholding tax is payable on dividends received in the individual policy fund.
The Group has unutilised tax losses of R192.0 million (2016: R160.8million) available in certain subsidiaries for offset against future taxable income in those subsidiaries.
131

NOTES TO THE CONSOLIDATED FINANCIAL STATEMENTS (continued)
for the year ended 31 December 2017
29. CASH GENERATED FROM OPERATIONS
Group
2017 2016
R’000 R’000
Reconciliation of profit before movement in insurance policy liabilities to cash generated by operations:
4 453 170 2 272 977
Profit before movement in policy liabilities 3 486 557 1 796 465
Attributable to unit trust holders 966 613 476 512
Investment contract receipts 460 178 420 263
Investment contract surrenders (188 308) (110 219)
Adjustments for:
– Depreciation 42 552 37 227
– Fair value of policyholder liabilities under investment contracts 140 060 15 295
– Amortisation of intangible asset 19 111 17 394
– Realised profit on disposal of property and equipment (151) (80)
– Investment income (1 823 561) (1 658 022)
– Net unrealised gains on financial assets held at fair value through profit or loss (2 770 571) (617 359)
Changes in working capital:
– Insurance and other receivables (99 434) (11 934)
– Insurance and other payables 97 281 (44 550)
– Short-term policy liabilities 13 572 14 102
– Insurance policy liabilities 150 292 (18 546)
Cash generated from operations 494 191 316 548
30. TAX PAID
Group
2017 2016
R’000 R’000
Tax receivable at beginning of year (42 481) (11 704)
Current tax as per Statement of profit or loss and other comprehensive income 284 101 244 539
Transfer from deferred tax liability 94 930 94 930
Tax receivable at end of year 10 658 42 481
Total tax paid 347 208 370 246
PPS INTEGRATED REPORT 2017132

31. COMMITMENTS
Group
2017 2016
R’000 R’000
(a) Capital expenditure contracted for at the reporting date but not yet incurred is as follows:
– Committed but not contracted for 104 622 103 873 (b) Operating lease commitments – where a Group company is the lessee
The Group leases various offices under non-cancellable operating lease agreements. The leases have varying terms, escalation clauses and renewal rights.
The lease expenditure charged to the Statement of profit or loss and comprehensive income during the year is disclosed in note 26.
The future aggregate minimum lease payments under non-cancellable operating leases are as follows:
Due in one year or less 34 754 31 974
Due between one year and five years 123 259 83 920
Due after five years 12 270 5 263
(c) Operating lease commitments – where a Group company is the lessor
The Group leases out its investment property (see note 3) under non-cancellable operating lease agreements. The leases have varying terms, escalation clauses and renewal rights.
The lease revenue charged to the Statement of profit or loss and comprehensive income during the year is disclosed in note 22.
The future aggregate minimum lease receipts under non-cancellable operating leases are as follows:
Due in one year or less 36 050 38 124
Due between one year and five years 77 279 102 590
Due after five years 9 998 7 249
133

NOTES TO THE CONSOLIDATED FINANCIAL STATEMENTS (continued)
for the year ended 31 December 2017
32. TRUSTEES' REMUNERATIONThe PPS Holdings Trust trustees' remuneration from the Group
The PPS Holdings
TrustSubsidiary
CompaniesTotal
remuneration (including
committees)(including
committees)(including
committees) Trustees Rand Rand Rand
Adv. T Aboobaker 161 000 – 161 000
Dr N Campbell 79 666 41 025 120 691
Ms DLT Dondur 220 300 238 400 458 700
Mr JAB Downie 224 650 260 400 485 050
Dr D P du Plessis 180 500 90 350 270 850
Mr C Erasmus 84 300 1 412 100 1 496 400
Dr MJ Grootbom 59 667 10 650 70 317
Mr U Jivan 169 500 74 000 243 500
Mr I Kotze 161 500 16 675 178 175
Dr C Kruger 220 800 132 550 353 350
Dr F Mansoor 91 500 – 91 500
Mr E Moolla 589 350 229 950 819 300
Ms P Natesan 91 500 – 91 500
Mr N Nyawo 169 500 39 375 208 875
Dr J Patel 59 667 – 59 667
Mr M Pillay 91 500 – 91 500
Mr P Ranchod 189 400 508 675 698 075
Mr V Rimbault 169 500 – 169 500
Dr S Seoka 369 450 252 500 621 950
Dr M W Sonderup 161 000 – 161 000
Mr B Topham 161 000 44 000 205 000
Mr S Trikamjee 212 800 154 550 367 350
Prof HE Wainer 33 000 798 200 831 200
Total 3 951 050 4 303 400 8 254 450
PPS INTEGRATED REPORT 2017134
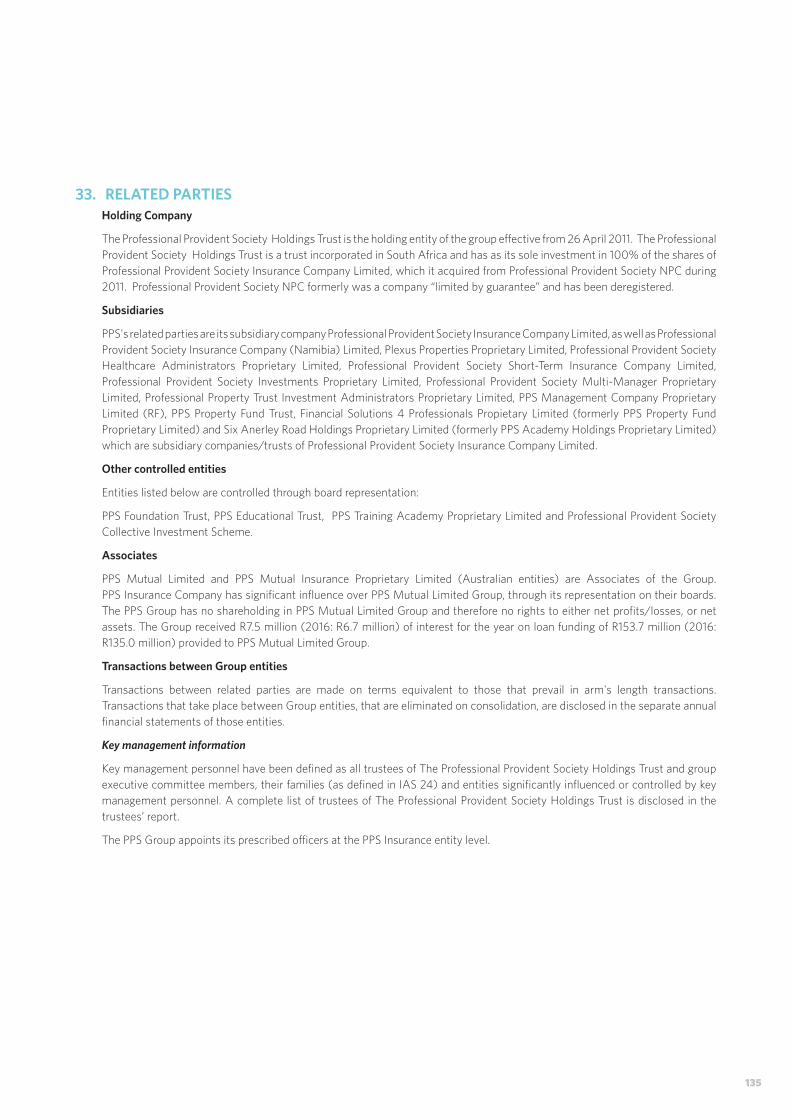
33. RELATED PARTIESHolding Company
The Professional Provident Society Holdings Trust is the holding entity of the group effective from 26 April 2011. The Professional Provident Society Holdings Trust is a trust incorporated in South Africa and has as its sole investment in 100% of the shares of Professional Provident Society Insurance Company Limited, which it acquired from Professional Provident Society NPC during 2011. Professional Provident Society NPC formerly was a company “limited by guarantee” and has been deregistered.
Subsidiaries
PPS's related parties are its subsidiary company Professional Provident Society Insurance Company Limited, as well as Professional Provident Society Insurance Company (Namibia) Limited, Plexus Properties Proprietary Limited, Professional Provident Society Healthcare Administrators Proprietary Limited, Professional Provident Society Short-Term Insurance Company Limited, Professional Provident Society Investments Proprietary Limited, Professional Provident Society Multi-Manager Proprietary Limited, Professional Property Trust Investment Administrators Proprietary Limited, PPS Management Company Proprietary Limited (RF), PPS Property Fund Trust, Financial Solutions 4 Professionals Propietary Limited (formerly PPS Property Fund Proprietary Limited) and Six Anerley Road Holdings Proprietary Limited (formerly PPS Academy Holdings Proprietary Limited) which are subsidiary companies/trusts of Professional Provident Society Insurance Company Limited.
Other controlled entities
Entities listed below are controlled through board representation:
PPS Foundation Trust, PPS Educational Trust, PPS Training Academy Proprietary Limited and Professional Provident Society Collective Investment Scheme.
Associates
PPS Mutual Limited and PPS Mutual Insurance Proprietary Limited (Australian entities) are Associates of the Group. PPS Insurance Company has significant influence over PPS Mutual Limited Group, through its representation on their boards. The PPS Group has no shareholding in PPS Mutual Limited Group and therefore no rights to either net profits/losses, or net assets. The Group received R7.5 million (2016: R6.7 million) of interest for the year on loan funding of R153.7 million (2016: R135.0 million) provided to PPS Mutual Limited Group.
Transactions between Group entities
Transactions between related parties are made on terms equivalent to those that prevail in arm's length transactions. Transactions that take place between Group entities, that are eliminated on consolidation, are disclosed in the separate annual financial statements of those entities.
Key management information
Key management personnel have been defined as all trustees of The Professional Provident Society Holdings Trust and group executive committee members, their families (as defined in IAS 24) and entities significantly influenced or controlled by key management personnel. A complete list of trustees of The Professional Provident Society Holdings Trust is disclosed in the trustees’ report.
The PPS Group appoints its prescribed officers at the PPS Insurance entity level.
135

NOTES TO THE CONSOLIDATED FINANCIAL STATEMENTS (continued)
for the year ended 31 December 2017
Aggregate details of insurance between The Professional Provident Society Holdings Trust, any of its subsidiaries, and key management personnel, their families (as defined in IAS 24) and entities significantly influenced or controlled by key management personnel are set out below:
Group
2017 2016
R’000 R’000
Life and disability cover 327 126 299 106
– Premiums 1 551 1 623
Sickness benefit cover 7 364 5 447
– Premiums 1 303 1 109
– Claims – 85
PPS Profit-Share Account 17 660 15 643
Motor and household cover 308 136 379 509
– Premiums 734 789
– Claims 477 351
Investment contracts 82 606 34 792
The transactions with related parties are made on terms equivalent to those that prevail in arm’s length transactions.
The aggregate compensation of The Professional Provident Society Holdings Trust trustees and Professional Provident Society Insurance Company Limited executives paid by the Group is set out below:
Group
2017 2016
R’000 R’000
Salaries and other employee benefits 30 405 33 091
Performance payments 19 322 24 660
Trustees' remuneration 8 428 7 726
58 155 65 477
34. CRITICAL ACCOUNTING ESTIMATES AND JUDGEMENTS IN APPLYING ACCOUNTING POLICIES The Group makes estimates and assumptions that affect the reported amounts of assets and liabilities at reporting date as well as affecting the reported income and expenses for the year. Estimates and judgements are evaluated annually and are based on historical experience and other factors, including expectations of future events that are believed to be reasonable under the circumstances.
34.1 Valuation of long-term insurance policy liabilities
The determination of the liabilities under insurance contracts is dependent on estimates and assumptions made by the Group. In determining the value of these insurance policy liabilities, assumptions regarding mortality, persistency, investment returns, expense level and inflation, tax and future profit allocations have been made. For details on these assumptions refer to note 12.1.
No allowance was made for any assumed deterioration in mortality and morbidity due to HIV/AIDS. It is expected that the impact of the epidemic on the current membership will not be significant in the near future.
PPS INTEGRATED REPORT 2017136

34.2 Valuation of short-term insurance policy liabilities
One of the purposes of insurance is to enable policyholders to protect themselves against uncertain future events.
Insurance companies accept the transfer of uncertainty from policyholders and seek to add value through the aggregation and management of these risks. The uncertainty inherent in insurance is inevitably reflected in the financial statements of the insurance company, principally in respect of the insurance liabilities of the company. Insurance liabilities include the provisions for unearned premiums (including an evaluation of the necessity for an unexpired risk provision), outstanding claims and incurred but not reported (IBNR) claims. For details on these assumptions refer to note 13.1.
34.3 Income tax
The Group is subject to tax in South Africa and Namibia. There may be transactions and calculations for which the ultimate tax determination has an element of uncertainty during the ordinary course of business. The Group recognises liabilities based on objective estimates of the amount of tax that may be due. Where the final tax determination is different from the amounts that were initially recorded, such difference will impact the income tax and deferred tax provisions in the period in which such determination was made. The corporate tax rate in South Africa was 28% for the year under review, 32% in Namibia and 45% for trusts in South Africa. PPS Insurance Company Limited has four separate tax funds, the individual policyholders’ fund (taxed at 30%), the company policyholders’ fund (taxed at 28%), the corporate fund (taxed at 28%) and the untaxed policyholders' fund (taxed at 0%). PPS Insurance Company Limited in South Africa does not meet the requirements of the Risk Policy Fund.
34.4 Employee benefit liabilities
The cost of the benefits and the present value of post-retirement medical obligations depend on a number of factors that are determined on an actuarial basis using a number of assumptions.
The Group determines the appropriate discount rate at the end of each year, which represents the interest rate that should be used to determine the present value of the estimated future cash flows expected to be required to settle the post-retirement medical obligations. In determining the appropriate discount rate, the Group considers the interest rate on high quality corporate bonds and government bonds that have terms to maturity approximating the terms of the related liability. Additional information is provided in note 18 of these financial statements.
34.5 Valuation of owner-occupied property and investment property
The value of the owner-occupied property and investment property depends on a number of factors that are determined using a number of assumptions. The assumptions used in determining the value was based on a yield range of 8.75% to 9.50% (2016: 8.75% to 9.50%). Any change in these assumptions will impact the values of the buildings.
34.6 Deferred tax asset
Deferred tax assets are recognised for unused tax losses and on deductible temporary differences to the extent that it is probable that future taxable profits will be available against which they can be utilised.
34.7 Valuation of long-term incentive and retention schemes
The cost of the benefits of the long-term incentive scheme depends on a number of assumptions used in calculating the present value under the projected unit credit method. The assumptions used in determining the charge to the Statement of Profit or Loss and other Comprehensive income arising from these obligations include the expected growth in the apportionment account (rolling five-year average historical growth 12.4% (2016: 12.9%), the turnover of staff participating in the scheme (nil) (2016: nil) and the discount rate (an appropriate market-related yield curve as at the reporting date). Any changes in these assumptions will impact the charge to the Statement of Profit or Loss and other Comprehensive income.
The assumptions used in determining the charge to the Statement of Profit or Loss and other Comprehensive income arising from obligations in terms of the Retention Scheme include the expected growth in the PPS Profit-Share Account (rolling five-year average historical growth 13.6% (2016: 13.5%), and the turnover of staff participating in the scheme (nil) (2016: nil).
34.8 Consolidation of entities in which the group holds less than 50%
The trustees have concluded that the Group controls, in the manner contemplated by IFRS, unit trusts managed by Professional Provident Society Investments Proprietary Limited, even though it holds less than half of the economic interest in some of these funds.
137

NOTES TO THE CONSOLIDATED FINANCIAL STATEMENTS (continued)
for the year ended 31 December 2017
35. MANAGEMENT OF RISKS35.1 General
The Board has overall responsibility for the Group's systems of internal control and risk management. The Chief Executive and executive management are responsible for the management and implementation of the PPS Group Enterprise Risk Management Framework and Governance Frameworks.
To assist the Board in the execution of its fiduciary duties in regard to risk management, legal and compliance accountabilities, as set out in detail in policies and frameworks adopted by the PPS Group, the Group Risk Committee has the following responsibilities:
• Assisting the Board in setting risk strategy policies in liaison with management and in the discharge of its duties relating to corporate accountability and associated risk in terms of management assurance and reporting;
• Assisting the Board in overseeing the Group’s compliance with applicable legal and regulatory requirements, industry standards and the Group’s Codes of Conduct;
• Monitoring external developments relating to the practice of corporate accountability and the reporting of specifically associated risk, including emerging and prospective impacts;
• Providing an independent and objective oversight and view of the information presented by management on corporate accountability and specifically associated risk, also taking account of reports by management, the Group Actuarial Committee and the Group Audit Committee to the Board on all categories of identified risks facing PPS;
• Performing the functions as may be prescribed by the Registrar of Long and Short Term Insurance and in particular, ensuring that PPS has implemented an effective ongoing process to identify risk, to measure its potential impact against a broad set of assumptions and then to activate what is necessary to proactively manage these risks and to recommend to the Board, PPS’ appetite and tolerance for risk;
• To discharge the specific responsibilities ascribed to the Committee in terms of policies and frameworks adopted by the Group in compliance with Solvency Assessment and Management regulation;
• Recommending the risk policy and framework to the Board for approval;
• Recommending the risk appetite and tolerance framework to the Board for approval;
• Ensuring the establishment of an independent risk management control function, reviewing its adequacy and effectiveness as well as introduce measures to enhance the function;
• Recommending the risk management plan for approval by the Board and reviewing progress against it;
• Approving the combined assurance plan and reviewing the effectiveness of combined assurance arrangements;
• Annually reviewing the risk bearing capacity of the Group in the light of its reserves, insurance coverage, guarantee funds or other such financial structures for approval by the Board;
• Ensuring that regular periodic independent assessments of the risk management function and risk management system are performed;
• Reviewing the risk report and adequate disclosure of the organisations risk and opportunity;
• Considering, in particular, the management of Information Technology risks;
• Considering the Opportunities Register and making recommendations in this regard to the Board;
• Providing feedback to other PPS Boards and committees on identified risks that may be relevant for those particular Boards and committees.
PPS INTEGRATED REPORT 2017138

The Board has delegated to the PPS Group Audit Committee an oversight role of financial reporting, accounting, the external auditor, appropriate internal controls and the internal auditors, and regulatory compliance, inter alia to ensure the integrity of reporting and financial controls. The internal control systems continue to be enhanced and developed to safeguard the assets of PPS and to ensure timely and reliable monitoring and reporting. These controls encompass suitable policies, processes, tasks and behaviors with the aim of ensuring compliance with applicable laws and regulations to meet the needs of an ever-changing business environment. The PPS Group Audit Committee’s mandate from the Board is to, inter alia:
• ensure compliance with all statutory duties imposed in terms of the Companies Act and the recommendations of the King Code;
• oversee the preparation of an integrated report annually that conveys adequate information about the operations of the Group and its integrated sustainability and financial reporting;
• ensure that a combined assurance model is applied to provide a coordinated approach to all assurance activities;
• review the expertise, resources and experience of the Group’s finance function, and disclose the results of the review in the integrated report;
• oversee internal audit and consider the effectiveness of internal audit at least annually and report to the Board on the assessment from internal audit on the adequacy of the internal controls;
• as an integral component of the risk management process, oversee the financial reporting risks; internal financial controls; IT risks as it relates to financial reporting; and fraud and corruption risk management;
• deal with all aspects of the annual financial statements of the company and the Group and ensure compliance with relevant legislation and, where appropriate, the King Code; make submissions to the board on any matter concerning the Group’s accounting policies;
• oversee and monitor financial and internal control, reporting and regulatory compliance; and
• ensure compliance with all statutory requirements in relation to the external auditors including to review the quality and effectiveness of the audit process and assess whether the external auditors have performed the audit as planned.
The following control functions within the Group are responsible for discharging the operations of risk management:
Risk management
• Directing and assisting in the co-ordination and monitoring of risk management activities within PPS.
• Ensuring adherence to the Risk Management Plan.
• Maintaining the Enterprise Risk Management Framework and Plan for approval by the Board in terms of the appropriate international standards (ISO 31000) and the King Code of Governance Principles.
• Maintain and update the risk matrix for the Group. This includes the identification, assessment, monitoring, mitigation and reporting around the key risks.
• Monitor and report progress on corrective action plans for risks that require mitigating actions.
• Develop systems for monitoring risk management. A software solution (CURA) is used for recording and tracking the risk management process in real-time and to ensure that risks are kept on top of mind.
• Drive risk management in PPS by promoting awareness of risk management to both management and staff;
• Ensure effective risk management training programmes are established.
• Assist management with the embedding of risk management in the day-to-day business activities of the Group.
• Ensure that risk management is considered when setting strategic goals and objectives
139

NOTES TO THE CONSOLIDATED FINANCIAL STATEMENTS (continued)
for the year ended 31 December 2017
Compliance
• Monitors and reports on compliance with regulatory requirements.
• Monitors that systems and controls are in place to ensure that the Group's exposure to legal and/or regulatory risk is minimised.
• Has a risk based compliance monitoring plan/risk matrix.
• Coordinates the Group's relationship with its regulators.
• Evaluates the impact of forthcoming legislative regulatory changes and provides advice on potential process and control changes required and whether the proposed control will be adequate.
• Reports to Group Risk Committee on the status of compliance of the Group.
• Operates in accordance with an approved Compliance Plan.
Internal audit
• Provides independent and objective assurance on, and evaluation of, the overall effectiveness of the Group’s systems of internal financial control.
• Develops a risk based annual audit plan based on a three-year testing rotation of the control environment for review at the Group Risk Committee and approval at the Group Audit Committee.
• Provides an independent assessment of the effectiveness of management’s implementation of the PPS Group Enterprise Risk Management Framework to the Group Risk Committee.
35.2 Insurance product risk management
General
The Group issues contracts that transfer significant insurance risk. This section summarises these risks and the way the Group manages them.
The risk under any one insurance contract is the possibility that the insured event occurs and the uncertainty of the amount of the resulting claim. By the very nature of an insurance contract, this risk is random and therefore unpredictable.
The table below provides an overview of the types of products and the terms and conditions of life insurance contracts written by the Group:
Type of contract Terms and conditions
Sickness and permanent incapacity benefit (PPS Provider Policy)
The PPS Provider Policy offers a variety of sickness and incapacity benefit options. The premiums for these benefits are level or age rated premiums and are payable monthly. However premiums are level for the old unit of benefit product. Premium rates and benefits are not guaranteed and may be revised at the discretion of the insurer.
These benefits entitle a policyholder to claim for periods of sickness and incapacity. The amount of cover obtainable is limited by the applicant’s annual gross professional income and maximum limits applied by the Company. The sickness benefit continues as long as the member continues to practice their occupation.
The sickness and incapacity benefits are non-DPF benefits.
PPS INTEGRATED REPORT 2017140

Type of contract Terms and conditions
Professional Life Provider (PPS Provider Policy)
PPS Life And Disability Policy
The PPS Provider policy also offers lump sum life and disability cover for a specified term or whole life. The premiums are payable monthly, and either an age rated or level option may be selected as the premium pattern. PPS Insurance is the risk carrier.
The PPS Life and Disability Policy which replaced the previous PPS Life Disability Assurance Scheme, is insured by PPS Insurance and is closed to new business. The previous generation of policies (PPS Life and Disability Assurance Scheme) was classified as being part of a grouped individual policy.
The premiums and benefits under both generations of policies are not guaranteed and may be revised at the discretion of the insurer. Reinsurance agreements are in place to reduce the impact on PPS of variability in claims experience.
The life and disability benefits are non-DPF benefits.
Professional Health Provider (PPS Provider Policy)
Professional Health Preserver
These products pay a lump sum benefit according to severity levels on assessment of standard dread disease conditions and physical impairment events. The premiums are payable monthly and are age rated.
The Professional Health Preserver is closed to new business.
The premiums and benefits are not guaranteed and may be revised at the discretion of the insurer. Reinsurance agreements are in place to reduce the impact on PPS of variability in the claims experience.
The dread disease and physical impairment benefits are non-DPF benefits.
141

NOTES TO THE CONSOLIDATED FINANCIAL STATEMENTS (continued)
for the year ended 31 December 2017
Type of contract Terms and conditions
Professional Disability Provider (PPS Provider Policy) The Professional Disability Provider offers lump sum disability cover for a specified term. At age 66, or earlier retirement (if this is over the age of 59), the Professional Disability Provider converts automatically into a severe illness benefit. This is a benefit that pays a one-off lump sum benefit on diagnosis of a severe dread disease (such as a stage 3 or 4 cancer). The premiums are payable monthly and are level or age rated. The premiums and benefits are not guaranteed and may be revised at the discretion of the insurer.
Reinsurance policies are in place to reduce the variability of the claims experience.
The disability benefits are non-DPF benefits.
PPS Provider Policy The PPS Provider Policy contains a DPF component, being the PPS Profit-Share Account™. This component continues until retirement, or earlier cancellation of the policy. No premium is payable for the DPF component.
Business Provider (PPS Provider Policy) The Business Provider Policy provides for the Business Life Provider and the Business Health Provider. The Business Life Provider product provides benefits very similar to those of the Professional Life Provider. The Business Health Provider product provides benefits similar to those of the Professional Health Provider, but tailored to payout for the more severe critical illness and physical impairment conditions only. The premiums and benefits are not guaranteed and may be revised at the discretion of the insurer. Both products are closed for new business.
Reinsurance policies are in place to reduce the variability of the claims experience.
The policies transfer insurance risk only and do not contain a DPF component.
PPS Education Cover The Education Cover Policy pays the actual public or private school and university fees of the child beneficiary, up to PPS determined maximums, directly to the education facility at the beginning of the academic year, upon receipt of a valid invoice, in the event of death, disability or Severe illness of the life insured.
The premiums and benefits under both generations of policies are not guaranteed and may be revised at the discretion of the insurer. Reinsurance agreements are in place to reduce the impact on PPS of variability in claims experience.
The Education Cover benefits are non-DPF benefits.
PPS INTEGRATED REPORT 2017142

Type of contract Terms and conditions
PPS Corporate Endowment The PPS Endowment and PPS Corporate Endowment afford policyholders the ability to save in a cost effective, transparent and flexible manner. The underlying investments are unit trusts, and no guarantees are offered on these products. The policies do not transfer insurance risk and do not contain a DPF component. These products are available to individuals and corporates respectively.
PPS Living Annuity The PPS Living Annuity is a compulsory purchase linked living annuity and does not offer risk benefits or investment guarantees. The underlying investments are unit trusts. The policies do not transfer insurance risk and do not contain a DPF component.
The PPS Provider Policy includes a DPF element. The participating nature of these contracts results in the insurance risk being carried by the insured parties. All variations in claims, persistency or termination rates are carried by the insured parties by means of variations in the amounts allocated to the DPF element.
However, the Group continues to manage the insurance risk in order to sustainably provide for the insurance benefits and to grow the DPF benefits available to policyholders.
For a portfolio of insurance contracts where the theory of probability is applied to pricing and provisioning, the principal risk that the Group faces under its insurance contracts is that the actual claims and benefit payments exceed the allowance made for the payments of these benefits. This could occur because the frequency or severity of claims and benefits are greater than estimated. Insurance events are random and the actual number and amount of claims and benefits will vary from year-to-year from the estimate established using statistical techniques.
Experience shows that the larger the portfolio of similar insurance contracts, the smaller the relative variability about the expected outcome will be. In addition, a more diversified portfolio is less likely to be affected across the board by a change in any subset of the portfolio. The Group has developed its insurance underwriting strategy to appropriately charge for the insurance risks accepted.
The Group has implemented a comprehensive reinsurance strategy to mitigate the risks of variability in the frequency and severity of claims on different portfolios of insurance contacts. This strategy continues to be effective in reducing the impact on PPS of variability in claims.
The table below provides an overview of the types of products and the terms and conditions of short-term insurance contracts written by the Group:
Type of contract Terms and conditions
Motor Covers risks relating to the possession, use or ownership of a motor vehicle. This cover can include risks relating to vehicle accident, theft or damage to third-party property or legal liability arising from the possession, use or ownership of the insured vehicle.
Property Covers risks relating to the use, ownership, loss of or damage to movable or immovable property other than a risk covered more specifically under another insurance contract.
Liability Provides cover for risks relating to the incurring of a liability other than relating to a risk covered more specifically under another insurance contract.
Miscellaneous Provides cover for risks relating to matters not otherwise defined in section 1 of the Short-Term Insurance Act, No. 53 of 1998.
143

NOTES TO THE CONSOLIDATED FINANCIAL STATEMENTS (continued)
for the year ended 31 December 2017
Insurance contracts – Long-term
(a) Frequency and severity of claims
For contracts where morbidity is the insured risk, the most significant factors that could increase the overall frequency of claims are diseases (such as Aids), epidemics (such as Cholera and Severe Acute Respiratory Syndrome), economic conditions, abnormal weather conditions, quality of healthcare and widespread changes in lifestyle, such as eating, smoking and exercise habits, resulting in earlier or more claims than expected.
The Group has comprehensive claims assessing processes and protocols in terms of which all claims received are assessed. Delegation of authority levels are applied to ensure that larger claims and repeat claims are assessed by senior assessors and management, and the forensics team if required, before being paid. The Group also conducts regular claims investigations to monitor experience.
The Group manages these risks through its underwriting strategy. The underwriting strategy ensures that the risks accepted are in line with PPS’ risk appetite. Medical risk selection is included in the underwriting protocols. Premium loadings and benefit exclusions may be imposed which reflect the health and medical history of the applicant. The Group has maximum exposure limits in respect of any single life insured. Maximum exposures are determined relative to gross professional income to ensure that policyholders are not overinsured. These limits are increased annually in line with expected salary inflation for professionals. Policyholders are reminded each year of their benefits and asked to review these benefits to ensure they are not over insured relative to their income as this may impact on future claims.
In some instances, maximum exposures are not increased annually where not appropriate.
Where appropriate, reinsurance contracts are in place to limit the Group’s liability. There is a board approved reinsurance strategy in place, which is regularly reviewed by the Actuarial Committee for its ongoing appropriateness.
The table below presents the total insured benefits per month and the average benefit per month per individual life assured on the basic sickness and disability contract.
Total insured Benefit monthly per month benefit per life Group R’000 Rand
2017 6 034 694 66 8662016 5 826 770 61 635
Insurance risk for contracts disclosed in this note is also affected by the contract holders’ right to terminate the contract completely. As a result, the amount of insurance risk is also subject to contract holder behaviour. On the assumption that contract holders will make decisions rationally, overall insurance risk can be assumed to be aggravated by such behaviour. For example, it is likely that contract holders whose health has deteriorated significantly will be less inclined to terminate contracts insuring death benefits than those contract holders remaining in good health. This results in an increasing trend of expected mortality, as the portfolio of insurance contracts reduces due to voluntary terminations.
The Group has factored the impact of contract holders behaviour into the assumptions used to measure these liabilities (see note 12).
(b) Sources of uncertainty in the estimation of future benefit payments and premium receipts
Uncertainty in the estimation of future benefit payments and premium receipts for long-term insurance contracts arises from the unpredictability of long-term changes in overall levels of mortality and morbidity and the variability in contract holder behaviour.
The Group uses appropriate base tables of standard mortality and morbidity rates. An investigation into the actual experience of the Group over the last or previous year is carried out, to produce a best estimate of the expected morbidity and mortality for the future. The best estimate of future mortality is based on standard industry tables adjusted for the Group’s overall experience and where no such table exists, tables are developed specifically on PPS historic experience.
Lapse experience can have a significant impact on the Group. To manage lapse risk, the group conducts monthly lapse analyses for each of the product lines. Where experience is worse than long-term valuation expected lapse experience management intervention is taken, over and above normal ongoing retention efforts to reduce overall lapse and exits.
PPS INTEGRATED REPORT 2017144

Risk exposure and concentrations of risk
The following table shows the Group’s exposure to insurance risk (based on the carrying value of the long-term insurance liabilities at the reporting date) per category of business. The table also shows the geographical concentration of these risks and the extent to which the Group has covered these risks by reinsurance:
Non-DPF DPF Group component of component of 2017 insurance insurance R'000 liabilities liabilities Total
South Africa Gross 3 899 142 25 617 553 29 516 695Net of reinsurance 3 811 388 25 617 553 29 428 941Namibia Gross 334 312 909 386 1 243 768Net of reinsurance 329 026 909 386 1 238 412
Non-DPF DPF
Group component of component of
2016 insurance insurance
R'000 liabilities liabilities Total
South Africa
Gross 3 665 177 23 080 499 26 745 676
Net of reinsurance 3 602 295 23 080 499 26 682 794
Namibia
Gross 219 346 780 513 999 858
Net of reinsurance 214 284 780 513 994 796
Insurance contracts – Short-term
For a portfolio of insurance contracts where the theory of probability is applied to pricing and provisioning, the principal risk that the Group faces under its insurance contracts is that the actual claims and benefit payments exceed the allowance made for the payments of these benefits. This could occur because the frequency or severity of claims and benefits are greater than estimated. Insurance events are random and the actual number and amount of claims and benefits will vary from year-to-year from the estimate established using statistical techniques.
The Group believes that the larger the portfolio of similar insurance contracts, the smaller the relative variability about the expected outcome will be. In addition, a more diversified portfolio is less likely to be affected across the board by a change in any subset of the portfolio. The Group has developed its insurance underwriting strategy to appropriately charge for the insurance risks accepted.
Pricing for the Group’s short-term insurance products is generally based upon historical claims frequencies and claims severity averages, adjusted for inflation and modelled catastrophes trended forward to recognise anticipated changes in claims patterns. While claims remain the Group’s principal cost, the Group also makes allowance in the pricing procedures for acquisition expenses, administration expenses, investment income, the cost of reinsurance and for a profit loading that adequately covers the cost of the capital.
Underwriting limits are set to ensure that the underwriting policy is consistently applied. Underwriting performance is monitored continuously and the pricing policy is revised accordingly. Risk factors considered as part of the review would typically include factors such as age of the insured person, past loss experiences, past insurance history, type and value of asset covered, security measures taken to protect the asset and major use of the covered item. The Group has the right to reprice and change the conditions for accepting risks on renewal and/or 30 days.
Expenses are monitored by business unit based on an approved budget and business plan. The underwriting strategy aims to ensure that the risks underwritten are well diversified in terms of type and amount of risk, size and geography.
145

NOTES TO THE CONSOLIDATED FINANCIAL STATEMENTS (continued)
for the year ended 31 December 2017
Insurance risk is further mitigated by ensuring that reserve and reinsurance risk is adequately managed. Reserve risk relates to the risk that the claim provisions held for both reported and unreported claims as well as their associated expenses may prove insufficient.
The Group currently calculates its short-term insurance technical reserves on two different methodologies, namely the ‘percentile approach’ and the ‘cost-of-capital approach’. The ‘percentile approach’ is used to evaluate the adequacy of technical reserves for financial reporting purposes, while the ‘cost-of-capital approach’ is used as one of the inputs for regulatory reporting purposes.
(a) Percentile approach
Under this methodology, reserves are held to be at least sufficient at the 75th percentile of the ultimate loss distribution. The first step in the process is to calculate a best-estimate reserve. Being a best-estimate, there is an equally likely chance that the actual amount needed to pay future claims will be higher or lower than this calculated value. The next step is to determine a risk margin. The risk margin is calculated such that there is now at least a 75% probability that the reserves will be sufficient to cover future claims. For more detail on the reserving techniques used in this approach, refer to note 2.
(b) Cost-of-capital approach
The cost-of-capital approach to reserving is aimed at determining a market value for the liabilities on the statement of financial position. This is accomplished by calculating the cost of transferring the liabilities, including their associated expenses, to an independent third party. The cost of transferring the liabilities off the statement of financial position involves calculating a best-estimate of the expected future cost of claims, including all related run-off expenses, as well as a margin for the cost of capital that the independent third party would need to hold to back the future claims payments.
Two key differences between the percentile and cost-of-capital approaches are that under the cost-of-capital approach, reserves must be discounted using a term-dependent interest rate structure and that an allowance must be made for unallocated loss adjustment expenses.
The cost-of-capital approach will result in different levels of sufficiency per class underwritten so as to capture the differing levels of risk inherent within the different classes. This is in line with the principles of risk-based solvency measurement.
The net claims ratio for the Group, which is important in monitoring short-term insurance risk is summarised below:
Loss history 2017 2016
Net claims paid and provided % of net earned premiums 71.80% 72.50%
Reinsurance Risk Management
Reinsurance risk is the risk that the reinsurance cover placed is inadequate and/or inefficient relative to the Group’s risk management strategy and objectives. The Group obtains third-party short-term reinsurance cover to reduce risks from single events or accumulations of risk that could have a significant impact on the current year’s earnings or the Group’s capital. It is believed that the reinsurance programme suits the risk management needs of the business.
The core components of the reinsurance programme comprise:
• A Personal Lines Risk, Clash and Catastrophe Excess of loss treaty with four layers. PPS Short-term Insurance retains the first R2.5 million of each and every claim, excluding reinstatement premiums as a result of a claim against the cover.
• A Personal Lines Liability Insurance and Extended Legal Liability (Personal Umbrella) treaty whereby PPS Short-term Insurance effectively cedes all risk in excess of R1 million to reinsurers by means of a 100% Quota Share Treaty for claims in excess of R1 million.
• A Commercial Liability Risk and Catastrophe Excess of Loss Treaty. PPS short-term insurance retains the first R1 million of each and every claim as a result of a claim against the cover.
PPS INTEGRATED REPORT 2017146

The PPS Short-term Insurance board approves the reinsurance renewal process on an annual basis. The reinsurance programme is placed with external reinsurers that are registered with the FSB and have a domestic credit rating of no less than A-.
Risk exposure and concentrations of risk
The following table shows the Group’s exposure to short-term insurance risk (based on the carrying value of the insurance liabilities at the reporting date) per category of business:
Group Motor Property Liability Miscellaneous2017 R'000 R'000 R'000 R'000
Gross 67 103 30 659 306 (2)Reinsurance (290) (790) – –
Net of reinsurance 66 813 29 869 306 (2)
Group Motor Property Liability Miscellaneous2016 R'000 R'000 R'000 R'000
Gross 42 727 21 129 244 1 120
Reinsurance (352) (1 882) – –
Net of reinsurance 42 375 19 247 244 1 120
Risk management relating to investment contracts
The Group commenced selling investment products during 2007 through its subsidiary PPS Investments (Pty) Limited (‘PPS Investments’). For these policies the investment risk is carried by the policyholders. In PPS Investments there is a risk of reduced income from fees where these are based on the underlying value of the invested assets. There is furthermore a reputational risk if actual investment performance is not in line with policyholders’ expectations. These risks are managed through a rigorous multi-manager investment research process applied by PPS Investments’ investment managers, which includes both technical and fundamental analysis.
The investment products underwritten by PPS Insurance are the PPS Endowment, the PPS Corporate Endowment and the PPS Living Annuity.
35.3 Financial risk management
The Group is exposed to financial risk through its financial assets, financial liabilities (including investment contracts), reinsurance assets and insurance policy liabilities. In particular the key financial risk is that the proceeds from its financial assets are not sufficient to fund the obligations arising from its insurance contracts. The most important components of this financial risk are market risk (comprising interest rate risk, equity price risk and foreign currency risk), liquidity risk and credit risk. The participating nature of the contracts issued results in the financial risk being carried by the insured parties by means of variations in the amounts allocated to the DPF element. However, the Group continues to manage the financial risk in order to maximise the benefits available to policyholders.
These financial risks arise from open positions in interest rate, currency and equity products, all of which are exposed to general and specific market movements. The primary risk that the Group faces arises from the impact of volatility in equity prices and interest rates on the value of assets and liabilities.
The Group manages exposure to investment volatility as part of an annual review of the assets held to back the insurance policy liabilities using asset liability modeling techniques. The asset-liability risk management framework allows for asset liability modeling to drive the optimal long-term asset class composition. This approach ensures the expected return on assets is sufficient to fund the required return on the risk reserves and to maximise the rate of return on the balance of the policy liabilities subject to acceptable levels of risk. Asset class composition is reviewed on a quarterly basis with the respective asset managers.
147

NOTES TO THE CONSOLIDATED FINANCIAL STATEMENTS (continued)
for the year ended 31 December 2017
Credit and counterparty risk
Credit risk refers to the risk of loss arising from the inability of the counterparty to service its debt obligations. The Group’s key areas of exposure to credit risk include:
• debt securities and cash and cash equivalents;
• amounts due from insurance and investment contract policyholders;
• amounts due from intermediaries;
• reinsurers’ share of insurance liabilities;
• amounts due from reinsurers in respect of payments already made to policyholders; and
• amounts due from insurance and other receivables
The nature of the Group’s exposures to credit risk and its objectives, policies and processes for managing credit risk have not changed significantly from the prior period.
In monitoring credit risk, amounts receivable are grouped according to their credit characteristics. The Group also limits its exposure to credit risk by only investing in liquid debt securities and only with counterparties that have a credit rating as set out below as well as only investing with reputable banks which are assessed quarterly.
The Group only enters into insurance contracts with eligible professional individuals. PPS Group operates a Credit Control Policy regarding outstanding long-term insurance premiums, which is formulated on the Long Term Insurance Act (in terms of section 52) recommendations, supported by the Ombudsman for Long-term Insurance and agreed in contracts with our members. In terms of this policy, a formal communication is sent to members after the first month and second month of premium defaults. In the third month of default, members are informed that premium collections have ceased and all benefits are suspended. In the event of default on the part of the individual, where the Apportionment Accounts has vested to the individual, there is a legal right of offset of the Apportionment Account against any outstanding premiums payable. This significantly reduces the credit risk on insurance policyholder recoverables.
The Group only enters into reinsurance agreements with reinsurers registered with the Financial Services Board. The reinsurers contracted with, represent subsidiaries of large international reinsurance companies. No instances of default have been encountered. As such the Group has selected reinsurers with a minimum credit rating of A+ for Long-Term insurance and A- for Short-Term insurance.
Cash and cash equivalents are invested with financial institutions holding credit ratings within the guidelines set by the board, similar to corporate and government debt indicated below, as well as restrictions in the Collective Investment Schemes Control Act, No. 45 of 2002, as amended. The spread of cash between financial institutions is determined in line with limits in Schedule 1 of the Long Term Insurance Act . The financial soundness of counterparties holding the Group’s cash is monitored by management on a monthly basis.
Exposure to credit risk
The maximum exposure to credit risk at the reporting date from financial assets, including unit trusts, and insurance contracts was:
Group R'000 2017 2016
Debt securities 13 119 560 12 821 098
Reinsurance assets 99 825 75 705
Insurance receivables 58 161 32 829
Cash and cash equivalents 3 215 827 2 232 452
Other receivables 369 030 291 524
Reinsurance receivables 42 631 56 657
Total 16 905 034 15 510 265
PPS INTEGRATED REPORT 2017148

Corporate and government debt
Included in the category designated at fair value through profit or loss are interest instruments of corporate and government debt. Management recognises and accepts that losses may occur through the inability of corporate debt issuers to service their debt. To mitigate this risk, management has formulated guidelines based on ratings from Standard and Poor’s, an industry accepted credit ratings agent.
The Group’s total exposure to corporate debt amounted to R13.1 billion (2016: 12.8 billion) at 31 December 2017. The following represent the major industry sectors to which the Group is exposed as at 31 December 2017:
Group R'm 2017 2016
Government 4 991 5 592
Banks 3 835 3 559
Utilities 105 121
Corporate 4 189 3 549
Total 13 120 12 821
Concentrations of credit risk
The maximum exposure to credit risk for its financial assets, including unit trusts, at the reporting date by credit rating category was as follows:
Group AAA Below AAA Below A 2017 and but no lower but no lower BBB- and R'000 Government than A than BBB- Below Unrated Total
Debt securities 5 664 814 4 832 128 516 301 2 106 318 – 13 119 561Reinsurance assets – 98 746 1 079 – – 99 825Insurance receivables – – – – 58 161 58 161Cash and cash equivalents 158 080 2 143 119 81 818 832 810 – 3 215 827Other receivables – – – – 369 030 369 030Reinsurance receivables – 42 631 – – – 42 631
Group AAA Below AAA Below A
2016 and But no lower but no lower BBB- and
R'000 Government than A than BBB- Below Unrated Total
Debt securities 6 100 441 5 055 057 1 665 600 – – 12 821 098
Reinsurance assets – 73 471 2 235 – – 75 706
Insurance receivables – – – – 32 829 32 829
Cash and cash equivalents 308 230 1 542 078 382 144 – – 2 232 452
Other receivables – – – – 291 524 291 524
Reinsurance receivables – 56 657 – – – 56 657
149
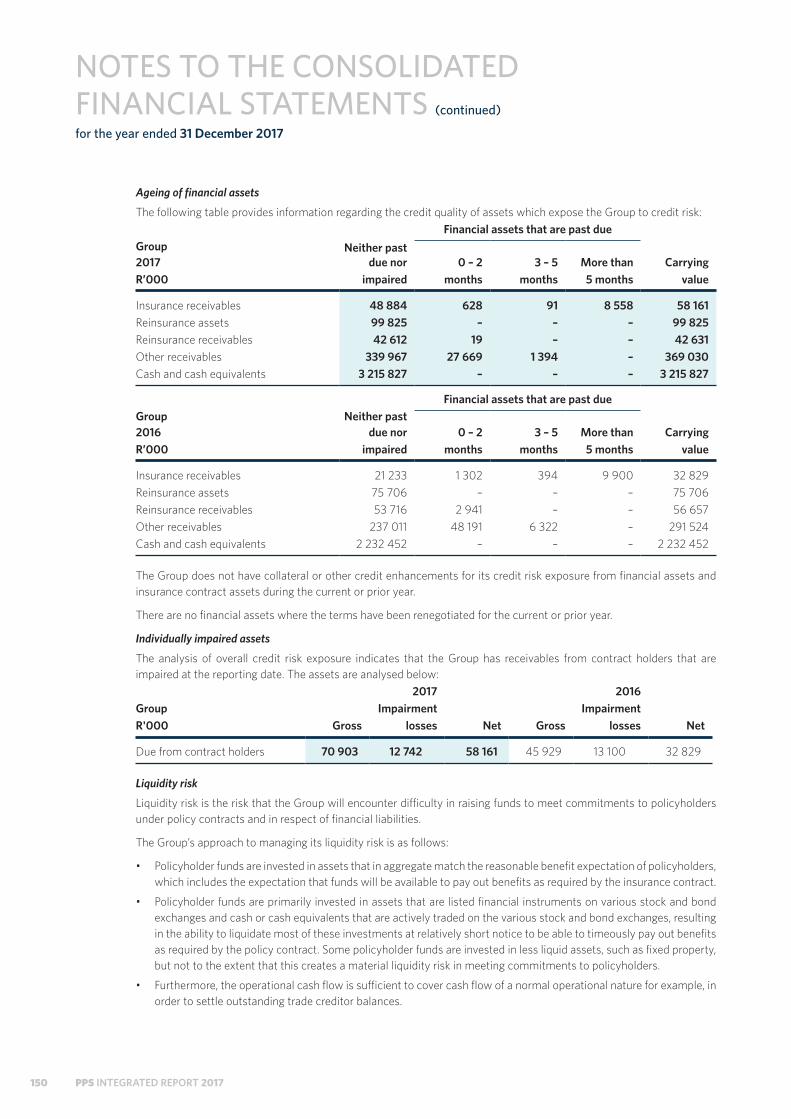
NOTES TO THE CONSOLIDATED FINANCIAL STATEMENTS (continued)
for the year ended 31 December 2017
Ageing of financial assets
The following table provides information regarding the credit quality of assets which expose the Group to credit risk:
Financial assets that are past due Group2017
Neither pastdue nor 0 – 2 3 – 5 More than Carrying
R’000 impaired months months 5 months value
Insurance receivables 48 884 628 91 8 558 58 161Reinsurance assets 99 825 – – – 99 825Reinsurance receivables 42 612 19 – – 42 631Other receivables 339 967 27 669 1 394 – 369 030Cash and cash equivalents 3 215 827 – – – 3 215 827
Financial assets that are past due
Group2016
Neither pastdue nor 0 – 2 3 – 5 More than Carrying
R’000 impaired months months 5 months value
Insurance receivables 21 233 1 302 394 9 900 32 829
Reinsurance assets 75 706 – – – 75 706
Reinsurance receivables 53 716 2 941 – – 56 657
Other receivables 237 011 48 191 6 322 – 291 524
Cash and cash equivalents 2 232 452 – – – 2 232 452
The Group does not have collateral or other credit enhancements for its credit risk exposure from financial assets and insurance contract assets during the current or prior year.
There are no financial assets where the terms have been renegotiated for the current or prior year.
Individually impaired assets
The analysis of overall credit risk exposure indicates that the Group has receivables from contract holders that are impaired at the reporting date. The assets are analysed below:
2017 2016
Group Impairment Impairment
R'000 Gross losses Net Gross losses Net
Due from contract holders 70 903 12 742 58 161 45 929 13 100 32 829
Liquidity risk
Liquidity risk is the risk that the Group will encounter difficulty in raising funds to meet commitments to policyholders under policy contracts and in respect of financial liabilities.
The Group’s approach to managing its liquidity risk is as follows:
• Policyholder funds are invested in assets that in aggregate match the reasonable benefit expectation of policyholders, which includes the expectation that funds will be available to pay out benefits as required by the insurance contract.
• Policyholder funds are primarily invested in assets that are listed financial instruments on various stock and bond exchanges and cash or cash equivalents that are actively traded on the various stock and bond exchanges, resulting in the ability to liquidate most of these investments at relatively short notice to be able to timeously pay out benefits as required by the policy contract. Some policyholder funds are invested in less liquid assets, such as fixed property, but not to the extent that this creates a material liquidity risk in meeting commitments to policyholders.
• Furthermore, the operational cash flow is sufficient to cover cash flow of a normal operational nature for example, in order to settle outstanding trade creditor balances.
PPS INTEGRATED REPORT 2017150

The following are the contractual maturities of financial liabilities and insurance contract liabilities, including interest payments and excluding the impact of netting agreements:
For long-term obligations with non-DPF components, the amounts in the table represent the estimated cash flows, consistent with the valuation methodology followed by the calculation of the non-DPF component of the insurance liabilities on the published reporting basis. All the cash flows are shown gross of reinsurance. Nominal cash flows are shown and the effect of discounting is taken into account to reconcile to total policy liabilities under insurance contracts. Since the DPF component is a retrospective accumulation of past profit declarations, the current value is taken as the value of the underlying assets (shown in the tables above).
Group Contractual cash flows
2017 Carrying Total cash Within 1 2 – 5 6 – 10 11 – 20 Over 20R'000 amount flows year years years years years
Insurance contract liabilities – DPF 26 614 866 26 620 929 1 421 247 3 925 404 5 672 309 9 830 546 5 771 423
Insurance contract liabilities – non-DPF 4 140 414 (13 330 002) 685 691 1 952 632 1 119 245 115 577 (17 203 147)
Short-term Insurance liabilities 28 879 28 879 26 368 2 511 – – –
Reinsurance payables 22 770 22 770 22 770 – – – –
Third-party financial liabilities arising on consolidation of unit trusts 10 709 000 10 709 000 10 709 000 – – – –
Investment contract liabilities 1 876 916 1 876 916 1 876 916 – – – –
Other financial liabilities 704 272 704 272 704 272 – – – –
Group Contractual cash flows
2016 Carrying Total cash Within 1 2 – 5 6 – 10 11 – 20 Over 20R'000 amount flows year years years years years
Insurance contract liabilities – DPF 23 948 940 23 948 940 1 228 557 3 458 041 5 073 715 8 712 692 5 475 936
Insurance contract liabilities – non-DPF 3 816 579 (14 240 040) 573 499 1 561 683 728 789 (380 100) (16 723 911)
Short-term Insurance liabilities 16 463 16 463 15 726 737 – – –
Reinsurance payables 22 270 22 270 22 270 – – – –
Third-party financial liabilities arising on consolidation of unit trusts 9 088 757 9 088 757 9 088 757 – – – –
Investment contract liabilities 1 464 986 1 464 986 1 464 986 – – – –
Other financial liabilities 652 213 652 213 652 213 – – – –
151

NOTES TO THE CONSOLIDATED FINANCIAL STATEMENTS (continued)
for the year ended 31 December 2017
Market risks
Market risk is the risk that changes in market prices, such as interest rate, foreign exchange rates and equity prices will affect the value of the Group’s financial assets and the amount of the Group’s liabilities as well as the Group’s insurance contract assets and liabilities. Market risk arises in the Group due to fluctuation in the value of liabilities and the value of investments held.
The objective of market risk management is to manage and control market risk exposures within acceptable parameters, while optimising the return on assets. The nature of the Group’s exposure to market risk and its objectives, policies and procedures for managing market risks have not changed significantly from the prior period although rigor has been applied to these in light of current market conditions and volatility. Refer below for more detail.
Management of market risk
The management of each of these major components of market risk and the exposure of the Group at the reporting date to each major risk is addressed below.
(a) Interest rate risk
Interest rate risk arises primarily from the Group’s investments in debt securities, cash and cash equivalents and its long-term debt obligations. However, changes in investment values attributable to interest rate changes are mitigated by corresponding and partially offsetting changes in the economic value of insurance and investment contract liabilities. As a result of this, the exposure to interest rate risk is managed by the asset managers though the limit in the investment mandates with regard to investing in debt securities, as well as the internal benchmark performance that the asset managers are measured against.
The nature of the Group’s exposure to interest rate risk and its objectives, policies and procedures for managing interest rate risk have not changed significantly from the prior period.
The cash and cash equivalents and debt securities interest rate sensitivity on profit before movement in insurance liabilities is shown below:
2017 2016
Group R'000 R'000
Cash and cash equivalents
Interest rate decrease: 1% (32 158) (22 325)
Interest rate increase: 1% 32 158 22 325
Debt Securities
Interest rate decrease: 1% (132 654) (129 681)
Interest rate increase: 1% 132 654 129 681
Total interest rate risk
Interest rate decrease: 1% (164 812) (152 006)
Interest rate increase: 1% 164 812 152 006
Fluctuations in the value of assets held to back the DPF component of the policy liabilities will affect the allocations to DPF benefits each year. The choice of assets to back the DPF component of the policy liabilities reflects the Group’s interpretation of the investment risk appetite of the policyholders. The assets held in this regard are as follows:
PPS INTEGRATED REPORT 2017152

Non-
pre-
retirement Pre-
retirement
Groupoption
benefits option
benefits 2017 R'000 % R'000 %
Local Equity 13 992 052 55.5 1 238 284 35.9Fixed interest 4 049 471 16.1 1 293 046 37.5Cash 1 899 831 7.5 267 063 7.7International Equity 5 275 034 20.9 654 173 18.9
Total 25 216 388 100.0 3 452 566 100.0
Non-
pre-
retirement Pre-
retirement
Groupoption
benefits option
benefits
2016 R'000 % R'000 %
Local
Equity 11 580 126 52.3 1 099 680 33.4
Fixed interest 4 142 942 18.7 1 378 067 41.8
Cash 1 598 811 7.2 123 232 3.7
International
Equity 4 828 821 21.8 693 666 21.1
Total 22 150 700 100.0 3 294 645 100.0
The assets held to back the non-DPF component of the liabilities similarly reflect the Group’s understanding of the risk appetite of the policyholders and the results of an asset liability modeling exercise undertaken during the year. Investment profits or losses arising from the impact of fluctuations in market values of assets and interest rates on the value of assets and non-DPF policy liabilities will be transferred to policyholders by adjusting the allocations made to the DPF component of their benefits.
Younger policyholders have more time to recover from the volatility in the financial markets. For that reason the strategic asset allocation for the invested portfolio representing these policyholders has a higher exposure to equity and thus risk. Older policyholders have less time to recover from negative market performance, and are thus given a voluntary option each year to switch to more conservative investment portfolios from age 55, i.e. portfolios where there is reduced exposure to equities.
The assets held to back the non-DPF component of the policy liabilities are as follows:
2017 2016
Group R'000 % R'000 %
Local
Equity 716 332 17.3 593 154 15.5
Fixed interest 3 114 570 75.2 2 971 921 77.9
Cash 101 829 2.5 30 235 0.8
International
Equity 207 683 5.0 221 268 5.8
Total 4 140 414 100.0 3 816 578 100
153

NOTES TO THE CONSOLIDATED FINANCIAL STATEMENTS (continued)
for the year ended 31 December 2017
(b) Currency risk
The Group’s operations in Namibia created no additional sources of foreign currency risk due to the fact that there is no exchange difference between the Namibian Dollar and the South African Rand.
The asset managers actively manage the currency risk when decisions are made in regard to investing internationally. All international investment returns are shown in US Dollars and the effect of the trading in different currencies is reflected in the investment performance which is measured against an internal benchmark. In terms of legislation, up to 25% of the South African long-term insurance company’s investments may be invested in foreign currency and hence that Company has less than 25% exposure to currency risk. The limit for the Namibian long-term insurance company is 30% in terms of local legislation.
The potential impact of currency movements on the share prices of domestic equities with significant foreign currency earnings is addressed by the asset managers in their assessment of the appropriate equities to hold in their mandates with PPS.
The international assets’ currency sensitivity on profit before movement in insurance liabilities is shown below:
2017 2016
Group R'000 R'000
Currency risk
South African Rand exchange rate decrease: 1% (77 481) (67 060)
South African Rand exchange rate increase: 1% 77 481 67 060
(c) Equity price risk
The Group holds a significant portfolio of equities which are subject to price movements. The majority of these assets are held to support contractual liabilities arising from unit-linked insurance contracts, contracts with DPF and investment contracts and therefore the price movements are matched with corresponding movements on contractual obligations.
The exposure to equities is managed to ensure that the Group’s internal capital requirements are met at all times, as well as those mandated by the Group’s external regulators.
Benchmarks and risk parameters are set against which the Group measures the asset managers. A monthly compliance statement is provided by each asset manager stating their adherence to the investment mandate, and highlighting any deviations and the corrective action to be taken to rectify the deviations. The performance of the assets against benchmarks, and the adherence to mandates, are monitored monthly by management. The asset managers present the performance against benchmarks and adherence to mandates, to the board, on a biannual basis.
The nature of the Group’s exposures to equity risk and its objectives, policies and processes for managing equity risk have not changed significantly from the prior period. The assets have performed well compared to the benchmark. This coupled with the long-term view that PPS takes towards its investments, means that the long-term asset strategy and asset allocations have remained unchanged.
The Equity price risk sensitivity on profit before movement in insurance liabilities is shown below:
2017 2016
Group R'000 R'000
Equity Price risk
Price decrease: 1% (277 241) (237 064)
Price increase: 1% 277 241 237 064
PPS INTEGRATED REPORT 2017154

Market risk sensitivity analysis
The table below shows the results of sensitivity testing on the Group’s profit or loss (before tax) and equity for reasonable possible changes in the risk variables. The sensitivity analysis indicates the effect of changes in market risk factors arising from the impact of the changes in these factors on the Group’s financial assets and liabilities and its insurance assets and liabilities.
For the DPF insurance liabilities and investment contracts the assets and liabilities are matched. The market risk is thus carried by policyholders. The impact of any change in the market risk will be in the movement to/from insurance policy liabilities on the Statement of Profit or Loss and other Comprehensive Income.
The only other impact is the change in the investment management fees, which will fluctuate as a percentage of the movement in the assets.
This is also disclosed within the movement in policy liabilities on the Statement of Profit or Loss and other Comprehensive Income. Therefore a market risk sensitivity analysis has not been included for this component of the business.
The market risk sensitivity is shown below:
Contracts with non-DPF Impact on profit/(loss) before movement in insurance policy holder liability
2017 2016
Group R'000 R'000
Interest rate risk
Lower limit: 8.2% Yield (1 482 318) (1 270 522)
Upper limit: 10.2% yield 1 106 453 946 563
The effect of changes in the net capital value of non-DPF contracts due to market movements are fully absorbed by adjusting the net capital value of DPF contracts resulting in a zero impact on total net capital of the Group.
Assumptions, methodology and limitations of sensitivity analysis
The effects of the specified changes in factors are determined using actuarial and statistical models, as relevant. The level of movements in market factors on which the sensitivity analysis is based were determined based on economic forecasts and historical experience of variations in these factors.
The sensitivity table demonstrates the effect of a change in a key assumption while other assumptions remain unchanged. However, the occurrence of a change in a single market factor may lead to changes in other market factors as a result of correlations.
The sensitivity analyses do not take into consideration that the Group’s assets and liabilities are actively managed. Additionally, the sensitivity analysis is based on the Group’s financial position at the reporting date and may vary at the time that any actual market movement occurs. As investment markets move past pre-determined trigger points, management action would be taken which would alter the Group’s position.
155

NOTES TO THE CONSOLIDATED FINANCIAL STATEMENTS (continued)
for the year ended 31 December 2017
Underwriting risk: Long-Term Insurance
Underwriting risk is the risk that the actual exposure to mortality, disability and medical risks in respect of policyholder benefits will exceed prudent exposure.
Underwriting risk is controlled by underwriting principles. The underwriting process takes into account actual and prospective mortality, morbidity and the expense experience.
The Statutory Actuary reports annually on the financial soundness of the premium rates in use and the profitability of the business, taking into consideration the reasonable benefit expectation of policyholders. All new rate tables are approved and authorised by the Statutory Actuary prior to being issued. Regular investigations into the mortality and morbidity experience are conducted. All risk-related mortality lump sum, disability and critical illness liabilities in excess of specified monetary limits are reinsured. A sickness experience report is annually presented analysing claim patterns and trends. The latest report indicated no significant deterioration in claim patterns.
Reinsurance outwards: Long Term insurance
A comprehensive, Board approved, reinsurance strategy is in place for the Group. Certain life, disability, dread disease and physical impairment risks are reinsured. The risks to be reinsured have been decided upon by balancing the need to reduce variability of claims experience against the cost of reinsurance. The reinsurers contracted with have been assessed on their ability to provide the Group with product, pricing, underwriting and claims support, as well on as their global credit rating.
Claims risk: Long Term Insurance
Pro-active training of staff takes place to ensure that fraudulent claims are identified and investigated timeously. The legitimacy of claims is verified by internal, financial and operating controls that are designed to contain and monitor claims risks. The forensic investigation team also advises on improvements to internal control systems and performs forensic investigations on perceived fraudulent claims. The Forensic Investigations department investigates all suspected fraudulent claims.
Products and pricing risk: Long-Term Insurance
Some of the mitigating measures in place to address this risk include:
• Ongoing analysis of risk experience (such as the sickness and mortality investigations).
• Use of reinsurance - this protects the insurer in that some of the risk of insufficient rates is passed onto a reinsurer.
• Margins in the premium rates – generally additional margins are included in the setting of premium rates to arrive at a more prudent set of rates and should protect against experience being slightly worse than anticipated.
• Non-guaranteed rates allows the Group to change its rates should the experience worsen significantly or be anticipated to worsen significantly.
• The thorough testing of proposed products upfront, including testing expected expenses and volumes of business, provides a sense of the expected parameters within which the product pricing will remain appropriate. If expenses or volumes are significantly different from the business plan then the overall offering and position will be revisited and consideration given to making appropriate changes to remedy worsening positions.
• Valuation – the annual valuation provides valuable information about changing parameters (such as mortality, morbidity, long term investment returns, yields, etc).
PPS INTEGRATED REPORT 2017156

Expense risk
There is a risk that the Group may suffer a loss from actual expenses being higher than those assumed when pricing or valuing contracts. This may be caused by factors increasing the expense charge in running the business, higher than expected expense inflation, or by an in force policy book smaller than expected. Alternatively, lower than expected volumes of new business or higher than expected contract terminations may result in higher than expected unit costs per policy.
Expense investigations are performed annually and valuation expense assumptions are set based on the results of this investigation, taking cognisance of the budgeted expenses per policy for the next financial year. Actual expenses are compared against budgeted expenses on a monthly basis. Due to the mutual nature of the Group, expense savings or expenses losses compared to expected expenses will respectively result in a higher or lower profit allocation to the policyholders.
Business volume risk
There is a risk that the Group may not cover the costs of acquisition and distribution if insufficient volumes of new business are sold. A mitigating factor is that a substantial portion of these costs are variable costs. Actual sales volumes are compared against budgeted and annual targeted sales on a monthly basis. This enables management to determine whether there are any factors that could impact the delivery of the targeted volumes. Where these are identified, an investigation occurs and the appropriate corrective action is taken.
Data and model risk
There is a risk that the Group may suffer a loss if the model used to calculate the insurance liabilities does not project the expected cash flows on the contracts accurately. This risk is mitigated by comparing the actual cash flows with the expected cash flows on a product basis at least annually. All new contract designs are also incorporated into the model. Detailed investigations are performed annually to ensure the integrity of the data used in the valuation process. Automated systems have been implemented to flag any anomalous transactions on an ongoing basis.
Capital management
Long-term Insurance
The Group’s capital management objectives are:
• To comply with the insurance regulatory capital requirements in the countries in which the Group operates.
• To safeguard the entity’s ability to continue as a going concern.
• To continue to provide acceptable returns for policyholders and members, and benefits for other stakeholders.
The Board’s policy is to maintain a strong capital base to protect policyholders’ and creditors’ interests and satisfy regulators whilst still creating value for policyholders.
The level of accumulated funds required by the Group is determined by the Long Term Insurance Act 52 of 1998 in South Africa and Namibian legislation (Act 5 of 1998) in Namibia, together with the Group’s licence requirements.
157

NOTES TO THE CONSOLIDATED FINANCIAL STATEMENTS (continued)
for the year ended 31 December 2017
The minimum capital requirements must be maintained at all times during the year. The table below summarises the minimum accumulated funds requirements across the Group and the actual accumulated funds held.
Group 2017 2016R'000 South Africa Namibia South Africa Namibia
Capital held 377 573 6 000 368 117 6 000
Regulatory capital 143 528 4 000 139 391 4 000
The Board considers the capital of the Group to be the total of all accumulated funds held as well as the DPF Insurance Liabilities (refer note 13) as the policy holders are also the members of the Group. A detailed Asset Liability Matching (ALM) investigation is conducted on an annual basis to better understand the potential impact on the capital of the Group of different market conditions, such as interest rate fluctuations and volatility in equity prices. The impact of varying operational conditions (such as variations in deaths, withdrawals and profits) on the Group’s capital is also presented to the Board. The results of the ALM investigations may lead to changes in the approved asset class mixes contained in the Investment Policy, in order to address any increases in the risk of volatility identified in the ALM investigation.
There have been no material changes in the Group’s management of capital during the period. The group has maintained its level of CAR cover at 2.6 times. This decision has resulted in R9.5 million (2016: R38.3 million) being allocated to accumulated funds.
Short-term insurance
The Board’s policy is to maintain an adequate capital base to protect policyholders’ and creditors’ interests and satisfy regulators whilst still creating value for shareholders.
The level of accumulated funds required by the Company is determined by the Short-Term Insurance Act 53 of 1998.
The minimum capital requirements must be maintained at all times during the year.
The Group has a level of CAR cover at 1.93 times (2016: 1.81 times).
The Group has complied with all externally and internally imposed capital requirements throughout the period.
PPS Collective Investment Scheme funds managed by PPS Multi-Managers Pty Ltd
The Group invests in various registered unit trusts in order to match obligations provided in policyholder contracts.
Each fund has its own legal constitution and operates within a defined fund mandate delegated to the appointed fund manager. Market and credit risks assumed within the assets held are controlled by various protection mechanisms within the mandate and in law. For example, the Collective Investment Schemes Control Act, No. 45 of 2001, in South Africa prescribes maximum limits for the concentration of risk exposures.
The Collective Investment Scheme’s oversight board appoints administrators who are responsible to ensure that the fund’s mandate and any internal and legislated control procedures are adhered to. In the event of a breach they are obligated to immediately bring it to the attention of the fund’s trustees, board and management for remedial action.
The unit trust fund vehicle and related procedures for offering investments is mature within South Africa and is well-regulated.
The unit trust funds which are defined as portfolios can be grouped under the group company, namely Professional Provident Society Investments Pty Ltd ('PPS Investments'), a Professional Provident Society Insurance Company (Pty) Ltd subsidiary. Described below is the unit trust subsidiary and its respective mandate and objective.
PPS INTEGRATED REPORT 2017158

Funds managed by PPS Multi-Managers Pty Ltd
PPS Investments employs a multi-manager investment approach that is designed to generate acceptable levels of returns at lower than average levels of risk. This is achieved by:
• thorough and ongoing quantitative and qualitative research process of potential managers in the domestic market;
• selecting specialist asset managers, taking their investment style and specific areas of expertise into consideration;
• determining the optimal blend of selected managers within the portfolio through a portfolio construction and optimisation process;
• writing segregated investment mandates with selected managers to tightly control portfolio risk;
• continuous monitoring of the portfolio risk and return characteristics of each selected manager as well as of the overall portfolio; and
• making manager changes where PPS Investments feels this is in the best interest of investors.
The Collective Investments Scheme Control Act also imposes specific restrictions which the underlying managers have to comply with and also restricts the interest rate and credit risk, where applicable, that they are able to take.
(a) PPS Conservative Fund of Funds
Investment objective
To maximise total portfolio return while outperforming a conservative real return target of CPI + 2% per annum over the medium term.
Investment mandate
This multi-managed fund invests in a number of underlying managers with the specific mandate to employ real return strategies to provide real capital growth. Flexible asset allocation provides diversification across all asset classes and sectors, with equity exposure limit to not more than 40% of the portfolio value.
Typical investments
The managers invest in fixed instruments such as money market and bonds, as well as local and international equities.
Risk exposure
A conservative fund exposed to credit risk, interest rate risk, local and international equity price risk and currency risk.
(b) PPS Moderate Fund of Funds
Investment objective
To maximise total portfolio return while outperforming a moderate real return target of CPI + 4% per annum over the medium term.
Investment mandate
This multi-managed fund invests in a number of underlying managers with the specific mandate to employ real return strategies to provide real capital growth. Flexible asset allocation provides diversification across all asset classes and sectors, with equity exposure limit to not more than 60% of the portfolio value.
Typical investments
The managers invest in fixed instruments such as money market and bonds, as well as local and international equities.
Risk exposure
A moderate fund exposed to credit risk, interest rate risk, local and international equity price risk and currency risk.
159

NOTES TO THE CONSOLIDATED FINANCIAL STATEMENTS (continued)
for the year ended 31 December 2017
(c) PPS Enhanced Yield Fund
Investment objective
To provide an enhanced level of income in excess of a broad short-term fixed interest benchmark.
Investment mandate
This multi-managed flexible fund invests in a number of underlying managers with the specific mandate to actively manage the fund by investing in less than three-year maturity limits. Asset allocation is defensive with exposure to fixed interest instruments, including high-yielding corporate bonds and securities, government bonds, listed property, preference shares and inflation-linked bonds.
Typical investments
The manager invests in income-yielding fixed instruments such as money market, bonds and preference shares.
Risk exposure
An enhanced yield income fund exposed to credit risk and interest rate risk.
(d) PPS Flexible Income Fund
Investment objective
To provide investors with a total return with a strong income bias while also seeking to protect capital in terms of bond market index.
Investment mandate
This multi-managed flexible fund invests in a number of underlying managers with the specific mandate to actively manage the fund by investing without prescribed maturity limits. Asset allocation is defensive with exposure to fixed interest instruments, including high-yielding corporate bonds and securities, government bonds, listed property, preference shares and inflation-linked bonds and to the extent as allowed by the Act.
Typical investments
The manager invests in income-yielding fixed instruments such as money market, bonds and preference shares.
Risk exposure
A flexible income fund exposed to credit risk, interest rate risk and currency risk.
(e) PPS Equity Fund
Investment objective
To provide long-term capital growth that exceeds the return provided by a broad equity market index.
Investment mandate
This multi-managed fund invests in a number of underlying managers with the specific mandate to actively manage exposures to domestic listed equities in order to deliver long-term performance.
Typical investments
This multi-manager invests in equities and cash.
Risk exposure
An equity fund exposed to local equity price risk, company specific risk and indirect currency risk.
PPS INTEGRATED REPORT 2017160

(f) PPS Balanced Fund of Funds
Investment objective
To maximise total portfolio returns while outperforming a peer-relative benchmark over the medium to long term.
Investment mandate
This multi-managed fund invests in a number of underlying managers who invest in a spectrum of local and international securities within the parameters of Regulation 28 of the Pension Funds Act, No 24 of 1956 with the specific focus on long-term growth.
Typical investments
The managers invest in local bonds and property, as well as local and international money market instruments and equities.
Risk exposure
A medium to high risk fund, exposed to credit risk, interest rate risk, local and international equity price risk and currency risk.
(g) PPS Managed Flexible Fund of Funds
Investment objective
To maximise total portfolio returns while outperforming a real return target of CPI+6% per annum over the long term.
Investment mandate
This multi-managed fund invests in a number of underlying managers who invest in a spectrum of local and international securities with the specific mandate to provide real capital growth. Flexible asset allocation provides diversification across all asset classes and sectors.
Typical investments
The managers invest in local bonds and property, as well as local and international money market instruments and equities.
Risk exposure
A medium to high risk fund, exposed to credit risk, interest rate risk, local and international equity price risk and currency risk. The fund can hold up to 100% offshore, but is expected to be between 40% and 60% invested in international assets.
(h) PPS Global Balanced Fund of Funds
Investment objective
To maximise total portfolio returns while outperforming a composite industry benchmark over the medium to long term.
Investment mandate
This multi-managed fund invests in a number of underlying managers who invest in a spectrum of international securities with the specific focus on long-term capital and income growth.
Typical investments
The managers invest in international bonds and property, as well as international money market instruments and equities.
Risk exposure
A medium to high risk fund, exposed to credit risk, interest rate risk, international equity price risk and currency risk.
161

NOTES TO THE CONSOLIDATED FINANCIAL STATEMENTS (continued)
for the year ended 31 December 2017
(i) PPS Balanced Index Tracker Fund
Investment objective
To track the customised PPS Balanced Index, a published multi-asset high equity composite index that is diversified across a number of constituent indices, and calculated and published daily by a recognised index compiler.
Investment mandate
This index tracker invests in the type of securities necessary to effectively track the index.
Typical investments
The multi-asset, high equity composite index that the PPS Balanced Index Tracker Fund tracks includes local and international equities, domestic bonds, domestic cash and domestic property.
Risk exposure
A medium to high risk fund, exposed to credit risk, interest rate risk, international equity price risk and currency risk.
(j) PPS Institutional Multi-Asset Low Equity Fund
Investment objective
Deliver a consistent benchmark beating return over a rolling 36-month period, while aiming to minimise capital loss over any 12 month period.
Investment mandate
This institutional multi-managed fund has a focus on capital protection and diversification. Flexible asset allocation provides diversification across all asset classes and sectors, with equity exposure limit to not more than 40% of the portfolio value.
Typical investments
The manager invests in fixed instruments such as money market and bonds, as well as local property and equities.
Risk exposure
A conservative fund exposed to credit risk, interest rate risk, and local equity price risk.
(k) PPS Institutional Bond Fund
Investment objective
To outperform the broad bond market index within defined duration limits relative to the benchmark, with more consistency than a typical bond fund.
Investment mandate
This institutional multi-managed bond fund invests in underlying managers that invests in a spectrum of fixed interest securities with the focus on benchmark relative performance, together with a regular and high level of income.
Typical investments
The portfolio will invest in a spread of listed and unlisted bonds, fixed deposits and other interest-bearing securities. The portfolio may invest in short, intermediate and long-dated securities.
Risk exposure
A bond fund exposed to credit risk, interest rate risk and inflation risk.
PPS INTEGRATED REPORT 2017162
(l) PPS Institutional Multi-Asset Flexible Fund
Investment objective
To maximise total portfolio return while outperforming CPI for all urban areas over a rolling three year period. The portfolio has a focus on capital protection and diversification.
Investment mandate
This institutional multi-managed fund invests in a number of underlying managers with a specific mandate to allocate assets based on their best view. Flexible asset allocation provides diversification across all asset classes and sectors, with equity exposure limit to not more than 75% of the portfolio value.
Typical investments
The managers may invest in a flexible combination of listed and unlisted investments in equity, bond, money market and property market.
Risk exposure
A moderate to high risk fund exposed to credit risk, interest rate risk and local equity price risk.
163

STATEMENT OF FINANCIAL POSITIONas at 31 December 2017
Trust
2017 2016
Note R’000 R’000
ASSETS
Investment in 100% of the shares issued by subsidiary, PPS Insurance Company Limited, at cost 10 000 10 000
Prepayments and Receivables from PPS Insurance Company Limited 961 4 316
Current income tax asset 1 271 596
Cash at bank 1 597 1 450
TOTAL ASSETS 13 829 16 362
EQUITY AND LIABILITIES
Accumulated funds 1 13 147 15 820
TOTAL EQUITY 13 147 15 820
LIABILITIES
Accruals and Value Added Tax payable 682 542
TOTAL LIABILITIES 682 542
TOTAL EQUITY AND LIABILITIES 13 829 16 362
ANNUAL FINANCIAL STATEMENTSPPS HOLDINGS TRUST
STATEMENT OF PROFIT OR LOSS, OTHER COMPREHENSIVE INCOME AND EQUITYfor the year ended 31 December 2017
Trust
2017 2016
Note R’000 R’000
Administration fees from PPS Insurance Company Limited 11 388 10 673
Total income 11 388 10 673
Total expenses 14 061 7 282
Trustees fees 3 951 3 725
Professional fees 544 426
Marketing expenses 6 511 –
Administration fees 3 055 3 131
(Deficit) / Surplus before tax (2 673) 3 391
Tax 2 – 1 357
(Deficit) / Surplus after tax (2 673) 2 034
Total comprehensive (loss) / income for the year (2 673) 2 034
Accumulated funds at the beginning of the year 15 820 13 786
Accumulated funds at the end of the year 1 13 147 15 820
PPS INTEGRATED REPORT 2017164

STATEMENT OF CASH FLOWS for the year ended 31 December 2017
Trust
2017 2016
R’000 R’000
Cash flows from operating activities
Cash generated from operations 822 1 336
– (Deficit) / Surplus before tax (2 673) 3 391
– Changes in Receivables 3 355 (2 033)
– Changes in Payables 140 (22)
Tax paid (675) (1 827)
– Tax receivable at beginning of year (596) (126)
– Current tax as per Statement of Profit or Loss, other Comprehensive Income and Equity – 1 357
– Tax receivable at end of year 1 271 596
Net cash from / (used in) operating activities 147 (491)
Net increase / (decrease) in cash and bank 147 (491)
Cash and bank at beginning of year 1 450 1 941
Cash and bank at end of year 1 597 1 450
NOTES TO THE ANNUAL FINANCIAL STATEMENTS
1. EQUITYPERMANENT CAPITAL
An amount of R100 was contributed to the trust fund of the beneficiaries on formation of The Professional Provident Society Holdings Trust during 2011.
ACCUMULATED FUNDS
The Accumulated funds balance represents the cumulative profits and losses of the trust since inception.
2. TAX
Trust
2017 2016
R'000 R'000
Current tax
– Current year tax – 1 357
Total tax – 1 357
Tax on the Trust’s profit before tax differs from the theoretical amount that would arise using the tax rate applicable to South African trusts:
(Deficit) / Surplus before tax (2 673) 3 391
Tax calculated at domestic tax rates applicable to trust profits in South Africa (1 203) 1 357
Tax effect of non-deductible expenses 51 –
Current year losses for which no deferred tax asset is recognised 1 152 –
Total tax per Statement of Profit or Loss, other Comprehensive Income and Equity – 1 357
165

ACTION REQUIRED BY MEMBERS IN REGARD TO THE 2018 ANNUAL GENERAL MEETING
The annual general meeting (AGM) of members of The Professional Provident Society Holdings Trust (‘PPS Holdings Trust’) will be held at 18:00 on Tuesday, 22 May 2018 in the PPS Indaba Centre, 6 Anerley Road, Parktown, Johannesburg. This AGM will consider and, if deemed fit, approve the ordinary and special resolutions set out in the notice convening the AGM, which is attached to and forms part of this Integrated Report. A form of proxy, enabling members to vote on the respective resolutions proposed, has also been included in this Integrated Report.
In terms of the Trust Deed of PPS Holdings Trust, only Ordinary Members of PPS Holdings Trust have the right to vote at meetings of its members. The votes of Ordinary Members of PPS Holdings Trust are determined in the manner set out in clause 22.6.2.2 of the Trust Deed.
Please take careful note of the provisions relating to the action required by members regarding the AGM. If you are in any doubt as to what action to take, please consult your professional advisor.
You may attend and vote at the AGM in person or you may appoint a proxy to represent you by completing the form of proxy on page 177 of this Integrated Report (please also refer to the notes to the form of proxy) and forwarding it to one of the following addresses or via facsimile or email, to be received by the Trust Secretary by no later than 18:00 on Thursday, 17 May 2018.
Marked for the attention of the Trust Secretary:
Physical address Postal address6 Anerley Road PO Box 1089
Parktown Houghton
Johannesburg 2041
Telephone Facsimile011 644 4200 011 644 4641
Email [email protected]
PPS INTEGRATED REPORT 2017166

NOTICE TO THE MEMBERS OF THE ANNUAL GENERAL MEETING
THE PROFESSIONAL PROVIDENT SOCIETY HOLDINGS TRUST (Registration number: IT312/2011)
(‘the Trust’)
Notice is hereby given that the eighth annual general meeting ('the meeting') of the members of the Trust will be held on Tuesday, 22 May 2018 at 18:00, in the PPS Indaba Centre, 6 Anerley Road, Parktown, Johannesburg, for the following purposes:1. To adopt, by ordinary resolution, the annual financial statements for the year ended 31 December 2017, including the
reports of the trustees and the auditors of the Trust.
2. To reappoint, by ordinary resolution, PricewaterhouseCoopers Inc. as the auditors of the Trust.
3. To elect and appoint trustees, by ordinary resolutions, in place of those trustees retiring in accordance with the trust deed which established and governs the Trust ('Trust Deed').
Mr E A Moolla, Mr U D Jivan and Dr C M Krüger retire by rotation at the meeting in terms of the Trust Deed.
The following trustees, being eligible for re-election and appointment, offer themselves for re-election and appointment as trustees of the Trust:
3.1 Dr C M Krüger
3.2 Mr E A Moolla
In addition, the following candidates have been nominated for election and appointment as trustees of the Trust in terms of the Trust Deed:
3.3 Adv H Cassim
3.4 Ms R Gopichund
3.5 Dr A C Hurribunce
3.6 Dr N H P Khosa
3.7 Ms L J Page
3.8 Prof M W Sonderup
(Abbreviated biographical details of the persons referred to above are set out on pages 169 to 176 of this Integrated Report).
EXPLANATORY NOTE ON THE APPOINTMENT OF THE TRUSTEES
The board of trustees currently consists of 20 trustees, all of whom were appointed in accordance with the Trust Deed. There are currently 10 elected trustees, of whom three are required to retire by rotation in terms of clause 7.2.1 of the current Trust Deed, following which there will be seven elected trustees in office. In terms of clause 5.3.1 of the Trust Deed, a maximum of 10 trustees may be appointed by the members in general meeting. There are three vacancies and there are eight nominees for these vacant positions (including the trustees who retire by rotation and who offer themselves for re-election and appointment). Each candidate will be voted upon by a separate resolution. In terms of the Trust Deed, if the number of persons approved by such resolutions exceeds the number of vacancies (being three), the result of the voting shall be determined in accordance with the number of votes cast in favour of each resolution so that the vacancies will be filled by the candidates receiving the highest number of favourable votes.
4. To elect the Audit Committee of the Trust by ordinary resolution. The following trustees, who meet the requirements of paragraph 26.1 of the Trust Deed, nominated by the Group Nominations Committee and recommended by the Board, have offered themselves for election:
4.1 Ms D L T Dondur
4.2 Mr E A Moolla
4.3 Mr P Ranchod
167
5. To approve, by special resolution, the following remuneration of the trustees for the period 1 July 2018 to 30 June 2019 (exclusive of VAT):
• remuneration of the chairman, comprising a retainer of R421 750 and an attendance fee of R18 100 per meeting;
• remuneration of the deputy chairman, comprising a retainer of R281 170 and an attendance fee of R13 575 per meeting;
• remuneration of the co-opted members of the board of trustees, comprising a retainer of R201 300 and an attendance fee of R9 050 per meeting;
• remuneration of the remainder of the members of the board of trustees, comprising a retainer of R140 580 and an attendance fee of R9 050 per meeting;
• remuneration of the chairman of the Trust Audit Committee, being an attendance fee of R22 250 per meeting;
• remuneration of the members of the Trust Audit Committee, being an attendance fee of R11 125 per meeting;
• remuneration of the chairman of the Group Nominations Committee, being an attendance fee of R22 690 per meeting;
• remuneration of the members of the Group Nominations Committee, being an attendance fee of R11 345 per meeting.
VOTINGIn voting or passing any resolution:• Associate Members (as defined in clause 18 of the Trust Deed) do not have any votes; and
• Ordinary Members (as defined in clause 18 of the Trust Deed) shall have 100 (one hundred) votes each, plus 1 (one) additional vote for each completed R200 (two hundred Rand) standing to his/her credit in his/her Apportionment Account (as defined in the Trust Deed), as at the most recent date prior to the meeting when the Apportionment Accounts of Ordinary Members were adjusted, provided that an Ordinary Member who is at the date of the vote 3 (three) months or more in arrear with the payment of his/her premiums (payable in terms of the Master Contract (as defined in clause 1.2.25 of the Trust Deed)) shall only have 1 (one) vote at the meeting.
A member who has more than 1 (one) vote may not split votes to exercise his/her votes in voting on any particular resolution but shall exercise all his/her votes either for or against the resolution or the member may abstain from voting on it.
PROXIESAny member who is entitled to attend and vote at the meeting may appoint a proxy (who need not be a member of the Trust) to attend, speak and on a poll to vote or abstain from voting in his/her stead.
A form of proxy is included in this Integrated Report on pages 177 to 178 and is also available for downloading from www.pps.co.za. The form of proxy is accompanied by notes indicating the requirements for its completion. Forms of proxy which do not comply with these requirements will be rejected.
Forms of proxy must be delivered at one of the following addresses physically or via facsimile or email, to be received by, and marked for the attention of, the Secretary, by no later than 18:00 on Thursday, 17 May 2018 (please note that additional requirements apply to proxies submitted in terms of a Power of Attorney or Order of Court, as set out in the notes to the Proxy Form):• Physical address: 6 Anerley Road, Parktown, Johannesburg
• Postal address: PO Box 1089, Houghton, 2041
• Facsimile: 011 644 4641
• Email: [email protected]
By order of the board of trustees
V E BarnardTrust SecretaryThe Professional Provident Society Holdings Trust
28 March 2018
PPS INTEGRATED REPORT 2017168

169
DR CHRISTIAN MARTIN (MANNIE) KRÜGER
DATE OF BIRTH
15 December 1965
PROFESSION
Family physician
TERTIARY QUALIFICATIONS
• MBChB (1989)
• M Prax Med (1995)
• M Pharm Med (2000)
CURRENT POSITIONS
• Private practice in Polokwane as family physician (since 1992)
• Trustee of The Professional Provident Society Holdings Trust (since 2011) and previous Director of PPS Limited (Limited by Guarantee) (2004 to 2011)
• Member of the PPS Group Nominations Committee (since 2013)
• Director of PPS Insurance Company Limited (since 2004)
• Director of PPS Healthcare Administrators Proprietary Limited (since 2009)
• Member of the Executive Committee, National Council on Dispensing (NCD) (since 2003)
FORMER POSITIONS
• Branch Councillor, Soutpansberg Branch, South African Medical Association (SAMA)(1992 to 2015)
• President, SAMA Soutpansberg Branch (1994)
• National Councillor, SAMA, (2000 to 2015)
• Councillor, HPCSA (1998 to 2003)
• Member of the Medical and Dental Professions Board (MDB)(1998 to 2003)
• Member of MDB Committee for General Practice (1998 to 2003)
• Chairperson of the SA Academy for Family Practice, Limpopo Province (1999 to 2007)
• National Councillor, Society of General/Family Practice (SGFP) (1993 to 2013)
ABBREVIATED CURRICULUM VITAE FOR NOMINATED CANDIDATE

PPS INTEGRATED REPORT 2017170
MR EBRAHIM ABOOBAKER MOOLLA
DATE OF BIRTH
24 November 1950
PROFESSION
Practising attorney
TERTIARY QUALIFICATIONS
• B Iuris (1977)
CURRENT POSITIONS
• Chairman of the Board of Trustees, The Professional Provident Society Holdings Trust (since 2012) and previous Director of PPS Limited (Limited by Guarantee) (2002 to 2011)
• Member of the Board of Professional Provident Society Insurance Company Limited (since 2004) and previous Deputy Chairman of the Board of Professional Provident Society Limited (2004 to 2011)
• Member of PPS Group Remuneration Committee, PPS Group Audit Committee and PPS Holdings Trust Audit Committee and Chairman of the PPS Group Nominations Committee
• Chairman of the Board of Professional Provident Society Investments Proprietary Limited (since 2008)
• Proprietor of Ebi Moolla & Singh Attorneys (since 1977)
• Member on various Committees of the Law Society of South Africa and KwaZulu-Natal Law Society (since 1994), including being the Chairman of the Investment Committee, Chairman of the Master’s Liaison Committee and Member of the Finance, Audit and Risk Committee
• Council Member of the KZN Law Society (since 1994) and previous President of the KZN Law Society (2002 to 2003)
• Member of the Board of the Attorneys Fidelity Fund (current) including the Chairperson of the Remuneration Committee and Member of the Audit and Investment Committees and previous Chairman of the Attorneys Fidelity Fund (2007 to 2009)
• Member of the Takeover Regulation Panel (established by the Minister of Trade and Industry in terms of the Companies Act, 2008) (current) and Member of the Takeover Regulation Panel’s Audit and Risk Committee and Chairman of the Remuneration Committee
• Member of the Audit Committee of the Health Systems (NGO) (since 2016)
• Director of the Attorney’s Insurance Indemnity Fund Proprietary Limited (current) and Member of the Audit and Risk Committees, Investment Committee and Chairman of the Investment and Remuneration Committees
• Chairman of the Board of Intembeko Investment Administrators Proprietary Limited (since 2017)
• Member of the IoDSA (current)
FORMER POSITIONS
• Served as an Acting Judge of the Bloemfontein High Court (2010)
• Served as an Acting Judge of the High Court of South Africa (Venda) Division (1999)
• Director of Santam and Member of the Investment and Sustainability Committees (2005 to 2006)
• Trustee of the Legal Provident Fund (2002 to 2004)
• Director and Member of the Audit Committee of the Legal Aid Board of South Africa (now Legal Aid SA) (1994 to 2006)
• Deputy Chairman, Enforcement Committee of the Directorate of Market Abuse of the Financial Services Board (current)

171
ADV HASINA CASSIM
DATE OF BIRTH
22 November 1967
PROFESSION
Practising advocate and registered pharmacist
TERTIARY QUALIFICATIONS
• B Pharm (1990)
• LLB (2011)
• Pharmacoepidemiology (Newcastle University Australia)
• Executive Leadership Programme (Said Business School – Oxford University)
• Certified Mediator (UCT@law)
CURRENT POSITIONS
• Advocate at the Thulamela Chambers and member of the Johannesburg Bar Council (since 2015)
• Member of the South African Medicine Pricing Committee (since 2016)
• Member of the South African Health Products Regulatory Authority (SAHPRA) (since 2017)
FORMER POSITIONS
• Pupil Advocate at the Johannesburg Bar Council (2015)
• Risk Manager at Discovery Health (2005 to 2015)
• Pharmaceutical and Medical Devices Access and Reimbursement Consultant at Metrics (2005)
• Access and Reimbursement Manager at Eli Lilly SA (2000 to 2005)
• Managing Director of Careways (1997 to 2000)
• General Manager at SA Homepatient (Presmed) (1993 to 1997)
• Pharmacist at MBS Hospital (1992 to 1993)
• Pharmacist at Afrox Brenthurst (1991 to 1992)

PPS INTEGRATED REPORT 2017172
MS RIKA GOPICHUND
DATE OF BIRTH
13 September 1981
PROFESSION
Chemical engineer
TERTIARY QUALIFICATIONS
• BSc Chemical Engineering (2004)
• B Eng (Hons) Chemical Engineering (2006)
• M Eng Technology Management (2009)
• MBL (2014)
CURRENT POSITIONS
• Senior Account Manager/Deal Maker at the Industrial Development Corporation of South Africa (IDC) (since 2007)
• Member of the Engineering Council of South Africa (ECSA) (since 2005)
• Member of the South African Institute of Chemical Engineers (SAIChe) (since 2007)
FORMER POSITIONS
• Process Engineer at SA Mint (2006 to 2007)
• Process Control and Implementation Engineer at Mintek (2005 to 2006)

173
DR ASHWIN CHITASON HURRIBUNCE
DATE OF BIRTH
25 November 1960
PROFESSION
Business consultant and medical doctor
TERTIARY QUALIFICATIONS
• MB ChB (1983)
• Fellowship in Diagnostic Radiology (FF Rad (D) SA) (1991)
• MBA (2005)
CURRENT POSITIONS
• Proprietor of Deftlogix South Africa and Australia (since 2013)
• Fellow and Mentor of the Institute of Managers and Leaders (Australia and New Zealand) (since 2014)
• Associate Fellow of the Australasian College of Health Services Management (since 2016)
• Board member of Eriger (since 2015)
• Board member and Vice-chairperson of PinkDrive (2018)
• Board member of Prior Ditema (2018)
FORMER POSITIONS
• Proprietor of Novarum (2006 to 2011)
• Executive and Practice Head for Health and Public Sectors, Capital Ventures at The IQ Business (2006 to 2016) and Trustee of the IQ Pension Fund (2006 to 2011)
• Served at the uMkhonto we Sizwe (MK), MK Military Health Service, Department of Defence, South African National Defence Force (1979 to 2006) and on the Bench of Court of Military Appeals of South Africa (1999 to 2014)
• Served at Baragwanath Hospital, King Edward VIII Hospital, Wentworth Hospital, Coronationville Hospital, Prince Mshiyeni Memorial Hospital, RK Khan Hospital, University of Natal, University of Witwatersrand, University of Pretoria and University of Limpopo (1984 to 2014)
• Council Member of the College of Radiologists (1994 to 2014), President of the College for Radiologists (2011 to 2014), Trustee of the Colleges of Medicine (2008 to 2014) and Senator of Colleges of Medicine of SA (1998 to 2014)
• Member and Chairperson of SAQA National Standards Body 08 (Law, Military Science and Security) (1994 to 2001)
• Country delegate of United Nations Group of Governmental Experts (2004 to 2006)
• Country delegate of The Interallied Confederation of Medical Reserve Officers of NATO (2009 to 2013)
• Member of the Ministerial Advisory Committee on Health Technology at the Ministry of Health of South Africa (1996 to 2004 and 2009 to 2014)
• Board member and Chairperson of PinkDrive (2008 to 2015) and Starfish Greathearts Foundation (2012 to 2013)

PPS INTEGRATED REPORT 2017174
DR NKHENSANE HUBERT PETER KHOSA
DATE OF BIRTH
27 April 1981
PROFESSION
Medical doctor
TERTIARY QUALIFICATION
• MBChB (2005)
• MBA (2017)
CURRENT POSITIONS
• Managing Director and General Practitioner of Hopewell Med Center (since 2009)
• Deputy President of Limpopo IPA (since 2015)
• Non-Executive Director, member of the Community Development Committee of Medicoop CFI (since 2015)
• Member of the Institute of Directors of South Africa (since 2017)
• Director of Khosa & Mathebula Inc. Netcare Pholoso Emergency services (since 2014)
FORMER POSITIONS
• TB, HIV Clinician and Senior Clinical Advisor at Foundation for Professional Development (2008 to 2009)
• Clinical Manager at Khosa & Mathebula Emergency Services in partnership with Polokwane Municipality (2014 to 2017)

175
MS LIZANNE JEAN PAGE
DATE OF BIRTH
30 August 1978
PROFESSION
Chartered accountant
TERTIARY QUALIFICATIONS
• BCom (Hons) (2003)
• CA(SA) (2008)
CURRENT POSITIONS
• Investment Executive at WDB Investment Holdings (since 2014)
• Independent Non-Executive Director of Hannover Reinsurance Group Africa Proprietary Limited, including being a Member of the Audit Committee, Social and Ethics Committee (appointed 2017)
• Independent Non-Executive Director of Hannover Reinsurance Africa Limited (appointed 2017)
• Independent Non-Executive Director of Hannover Life Reinsurance Africa Limited (appointed 2017)
• Independent Non-Executive Director of Compass Insurance Company Limited, including being a Member of the Audit Committee and Social and Ethics Committee (appointed 2017)
• Independent Non-Executive Director of Lireas Holdings Proprietary Limited (appointed 2017)
• Alternate Non-Executive Board Member of Assupol Group, including being an invitee Member of the Audit Committee (appointed 2015)
• Member of the South African institute of Chartered Accountants
FORMER POSITIONS
• Manager of Leverage and Acquisition Finance at the Standard Bank of SA Limited – CIB Division (2011 to 2013)
• Manager of New Business Development, Corporate Banking Division at the Standard Bank of SA Limited (2006 to 2011)
• Manager Finance: Technical Accountant for Stanbic Africa Division at the Standard Bank of SA Limited (2006)
• Trainee Accountant: TOPP/CA(SA) Programme (2004 to 2006)
• Junior Financial Officer: Standard Bank Corporate and Investment Banking Division (2003)

PPS INTEGRATED REPORT 2017176
PROF MARK WAYNE SONDERUP
DATE OF BIRTH
4 February 1969
PROFESSION
Medical doctor
TERTIARY QUALIFICATIONS
• B Pharm (cum laude, 1990, UPE)
• MBChB (first class honours, 1995, UCT)
• Fellowship of the College of Physicians of South Africa (FCP SA, 2002)
• Masters in Medicine (2013, UCT)
• Fellowship of the Royal College of Physicians (FRCP) (2018)
CURRENT POSITIONS
• Trustee of The Professional Provident Society Holdings Trust Board (since 2012)
• Associate Professor, Senior Specialist and Lecturer of the Department of Medicine and Division of Hepatology at the University of Cape Town and Groote Schuur Hospital (since 2007)
• Vice-Chairman of the South African Medical Association, SAMA (2009 to current)
• Board Member of the South African Medical Association, SAMA (2000 to 2004, 2009 to current)
• National Council Member of the South African Gastroenterology Society (2009 to current)
• Member of the SA Rugby Medical Advisory Committee (2017 to current)
• Board Member of the WHO Strategic Advisory Committee of Viral Hepatitis, Geneva (2014 to current)
FORMER POSITIONS
• Chairman of the SAMA Western Cape Branch (2008 to 2012)
• President of the Cape Western Branch, SAMA (2007)
• Council Member of the World Medical Association (WMA, 2011 to 2016)
• Specialist in the Department of Medicine, New Somerset Hospital (2006 to 2007)
• Senior Registrar and Fellow of the MRC/UCT Liver Research Centre at the Groote Schuur Hospital (2002 to 2004)
• Medical Registrar Rotation at the Groote Schuur Hospital (1998 to 2002)
• Senior House Officer at the Groote Schuur Hospital (1997 to 1998)
• Medical Intern in Medicine, Surgery and O&G at the Livingstone Hospital (1996)

FORM OF PROXY
THE PROFESSIONAL PROVIDENT SOCIETY HOLDINGS TRUST(Registration number IT312/2011) (the Trust)
PPS Member’s details:
Full name:
Identity number:
Membership number:
Email address:
Postal address:
Cellphone:
I, the above member of the Trust, hereby appoint:
Proxy’s name: Proxy’s identity number:
or failing him/her, the Chairman of the meeting, as my proxy to attend, speak and on a poll vote for me and on my behalf at the annual general meeting of the Trust to be held at 18:00 on Tuesday, 22 May 2018 in the PPS Indaba Centre, 6 Anerley Road, Parktown, Johannesburg, and at any adjournment thereof, as follows:
No. Business In favour of Against Abstain
1. Ordinary resolution for the adoption of the annual financial statements of the Trust for the year ended 31 December 2017
2. Ordinary resolution for the reappointment of the auditors of the Trust
3. Ordinary resolutions for the election and appointment of trustees#:
3.1 Dr C M Krüger*
3.2 Mr E A Moolla*
3.3 Adv H Cassim
3.4 Ms R Gopichund
3.5 Dr A C Hurribunce
3.6 Dr N H P Khosa
3.7 Dr L J Page
3.8 Prof M W Sonderup
4. Ordinary resolution for the appointment of the members of the Trust Audit Committee
5. Special resolution for the approval of trustees’ remuneration for the period 1 July 2018 to 30 June 2019 as set out in the notice of the annual general meeting**
# There will be three vacancies on the Board of trustees to be filled by elected trustees. These three vacancies will be filled by the three candidates receiving the highest number of favourable votes. Refer to the Notice of the Annual General meeting for an explanation in this regard.
* Trustees who will retire by rotation at the meeting, in accordance with the Trust Deed and, being eligible, offer themselves for re-election.
** Authorisation of at least seventy-five per cent of the votes cast by members present (in person or represented by proxy) at the meeting is required.
Signed this day of 2018
Signature
177

NOTES TO FORM OF PROXY
Instructions and requirements for completion of the form of proxy
1. The form of proxy must be signed, dated and returned so as to be received at the registered office of the Trust by 18:00 on Thursday, 17 May 2018.
2. Forms of proxy are required to be completed and signed by the Member appointing the proxy, or by his attorney or agent duly authorised in terms of a court order, or a power of attorney which was signed by the Member. If the form of proxy is completed in terms of a power of attorney or authority, the ORIGINAL, OR A CERTIFIED COPY of such power of attorney or authority has to be lodged with the form of proxy by 18:00 on Monday, 14 May 2018.
3. The signatory may insert the name of any person whom the signatory wishes to appoint as his/her proxy in the blank space provided for that purpose. If no name is inserted, the chairman of the meeting shall be appointed as the member's proxy.
4. By completing and lodging of the form of proxy, it will not preclude the member who is appointing the proxy from attending the annual general meeting and speaking and voting in person thereat, to the exclusion of any proxy appointed in terms hereof, should such member wish to do so.
5. If the member does not indicate in the appropriate places on the face hereof how he/she wishes to vote in respect of any resolutions, his/her proxy shall be entitled to vote as he/she deems fit in respect of that resolution. In regard to the ordinary resolutions for the election of trustees, any indication of how the member wishes to vote in regard to the candidates will be deemed to be the entire vote of the member, i.e. if the member has only indicated a vote for, or against, or to abstain for one or more candidate(s), the proxy holder shall not be entitled to exercise additional votes in respect of candidates for whom no votes were indicated by the member.
6. In respect of the election of trustees, each candidate will be voted upon by a separate resolution, either “For”, “Against” or Abstain”. In terms of the Trust Deed, if the number of persons approved by such resolutions exceeds the number of vacancies (being three), the result of the voting shall be determined in accordance with the number of votes cast in favour of each resolution so that the vacancies will be filled by the candidates receiving the highest number of favourable votes.
RETURN OPTIONS Either: Deliver to: The Trust Secretary
6 Anerley Road
Parktown, 2193
Johannesburg
or Post to: The Trust Secretary
PO Box 1089
Houghton
2041
or Fax to: The Trust Secretary at
011 644 4641
or Email to: [email protected]
PPS INTEGRATED REPORT 2017178

ADMINISTRATIVE INFORMATION
HEAD OF ACTUARIAL CONTROL FUNCTION AND STATUTORY ACTUARY OFPPS INSURANCE AND PPS NAMIBIA(in terms of the Long-term Insurance Act)
Mr G T Waugh
HEAD OF ACTUARIAL CONTROL FUNCTION OF PPS SHORT-TERM INSURANCE(in terms of the Short-term Insurance Act)
Mr J van der Merwe
EXTERNAL AUDITORPricewaterhouseCoopers Inc.4 Lisbon Lane
Waterfall City, Jukskei View, 2090, South Africa
INTERNAL AUDITORKPMG Services (Pty) LimitedWanooka Place, 1 Albany Road
Parktown, 2193, South Africa
LEGAL ADVISORSWebber Wentzel90 Rivonia Road
Sandton, Johannesburg, 2196, South Africa
ACTUARIAL ADVISORSDeloitteDeloitte Place, Building 33
The Woodlands, 20 Woodlands Drive
Woodmead, 2052, South Africa
FUND MANAGERSCoronation Fund Managers Limited7th Floor, MontClare Place
Corner Camp Ground and Main Road
Claremont, 7708, South Africa
Investec Asset Management (Pty) Limited36 Hans Strijdom Avenue, Foreshore
Cape Town, 8001, South Africa
Allan Gray South Africa (Pty) Limited 1 Silo Square, V&A Waterfront
Cape Town, 8001, South Africa
PPS Multi-Managers (Pty) LimitedPPS House, Boundary Terraces
1 Mariendahl Lane
Newlands, 7700, South Africa
Namibia Asset Management Limited1st Floor, KPMG House, 24 Orban Street
Klein Windhoek, Windhoek, Namibia
Old Mutual Investment Group (Pty) Limited10th Floor, Mutual Tower, 223 Independence Avenue
Windhoek, Namibia
THE PROFESSIONAL PROVIDENT SOCIETY HOLDINGS TRUST AND
PROFESSIONAL PROVIDENT SOCIETY INSURANCE COMPANY LIMITED Principal place of business 6 Anerley Road
Parktown, Johannesburg, 2193
Postal address PO Box 1089
Houghton, 2041
Web address www.pps.co.za
PROFESSIONAL PROVIDENT SOCIETY INSURANCE COMPANY (NAMIBIA) LIMITEDPrincipal place of business 18 Robert Mugabe Avenue
Windhoek
Namibia
Postal address PO Box 1407
Windhoek, Namibia
Web address www.pps.com.na
179

NOTES
PPS INTEGRATED REPORT 2017180

