ppg industries, inc.investor.ppg.com/~/media/files/p/ppg-ir/financial-information/... · form 10-q...
TRANSCRIPT

UNITED STATESSECURITIES AND EXCHANGE COMMISSION
WASHINGTON, D.C. 20549 ________________________________________
FORM 10-Q ––––––––––––––––––––––––––––––––––––––––
QUARTERLY REPORT UNDER SECTION 13 or 15(d) OFTHE SECURITIES EXCHANGE ACT OF 1934
For Quarter Ended June 30, 2017
Commission File Number 1-1687____________________________________________________________
PPG INDUSTRIES, INC.(Exact name of registrant as specified in its charter)
––––––––––––––––––––––––––––––––––––––––––––––––––––––––––––
Pennsylvania 25-0730780(State or other jurisdiction of
incorporation or organization) (I.R.S. Employer
Identification No.)
One PPG Place, Pittsburgh, Pennsylvania 15272(Address of principal executive offices) (Zip Code)
(412) 434-3131(Registrant’s telephone number, including area code)
–––––––––––––––––––––––––––––––––––––––––––––––––––––– Indicate by check mark whether the Registrant (1) has filed all reports required to be filed by Section 13 or 15(d) of the Securities Exchange Act of 1934 during thepreceding 12 months, and (2) has been subject to such filing requirements for the past 90 days. Yes ý No ¨
Indicate by check mark whether the registrant has submitted electronically and posted on its corporate Web site, if any, every Interactive Data File required to besubmitted and posted pursuant to Rule 405 of Regulation S-T (§232.405 of this chapter) during the preceding 12 months (or for such shorter period that theregistrant was required to submit and post such files). Yes ý No ¨
Indicate by check mark whether the Registrant is a large accelerated filer, an accelerated filer, a non-accelerated filer or a smaller reporting company. See thedefinitions of “large accelerated filer,” “accelerated filer” and “smaller reporting company” in Rule 12b-2 of the Exchange Act. (Check one):
Large accelerated filer ý Accelerated filer o
Non-accelerated filer o (Do not check if a smaller reporting company) Smaller reporting company o
Emerging growth company o
If an emerging growth company, indicate by check mark if the Registrant has elected not to use the extended transition period for complying with any new orrevised financial accounting standards provided pursuant to Section 13(a) of the Exchange Act. ¨
Indicate by check mark whether the Registrant is a shell company (as defined in Rule 12b-2 of the Exchange Act). Yes ¨ No ý
As of June 30, 2017 , 256,479,780 shares of the Registrant’s common stock, par value $1.66-2/3 per share, were outstanding.
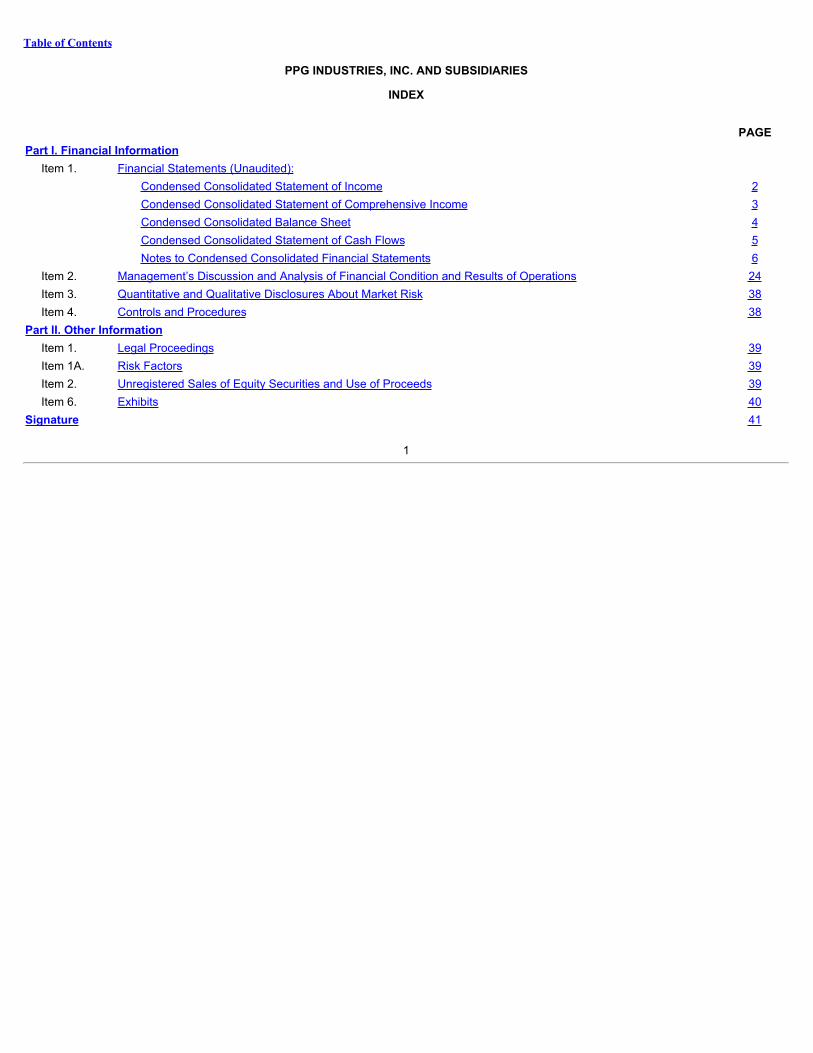
Table of Contents
PPG INDUSTRIES, INC. AND SUBSIDIARIES
INDEX
PAGEPart I. Financial Information
Item 1. Financial Statements (Unaudited): Condensed Consolidated Statement of Income 2 Condensed Consolidated Statement of Comprehensive Income 3 Condensed Consolidated Balance Sheet 4 Condensed Consolidated Statement of Cash Flows 5 Notes to Condensed Consolidated Financial Statements 6
Item 2. Management’s Discussion and Analysis of Financial Condition and Results of Operations 24Item 3. Quantitative and Qualitative Disclosures About Market Risk 38Item 4. Controls and Procedures 38
Part II. Other Information Item 1. Legal Proceedings 39Item 1A. Risk Factors 39Item 2. Unregistered Sales of Equity Securities and Use of Proceeds 39Item 6. Exhibits 40
Signature 41
1

Table of Contents
PART I. FINANCIAL INFORMATIONItem 1. Financial Statements
PPG INDUSTRIES, INC. AND SUBSIDIARIES
Condensed Consolidated Statement of Income (Unaudited)($ in millions, except per share amounts)
Three Months Ended
June 30 Six Months Ended
June 30
2017 2016 2017 2016Net sales $ 3,806 $ 3,782 $ 7,292 $ 7,193Cost of sales, exclusive of depreciation and amortization 2,082 1,988 3,987 3,805Selling, general and administrative 865 930 1,753 1,827Depreciation 81 79 160 158Amortization 32 30 63 60Research and development, net 113 115 223 229Interest expense 26 31 51 62Interest income (4) (7) (8) (14)Pension settlement charge — — 22 —Asbestos settlement, net — 2 — 5Other charges 12 29 26 46Other income (72) (45) (96) (59)Income from continuing operations before income taxes $ 671 $ 630 1,111 1,074Income tax expense 162 285 269 394Income from continuing operations $ 509 $ 345 842 680(Loss)/Income from discontinued operations, net of tax (3) 31 3 50Net income attributable to the controlling and noncontrolling interests $ 506 $ 376 845 730
Less: Net income attributable to noncontrolling interests (5) (6) (10) (13)Net income (attributable to PPG) $ 501 $ 370 $ 835 $ 717
Amounts attributable to PPG: Income from continuing operations, net of tax $ 504 $ 339 $ 832 $ 667(Loss)/Income from discontinued operations, net of tax (3) 31 3 50
Net income (attributable to PPG) $ 501 $ 370 $ 835 $ 717
Earnings per common share:
Income from continuing operations, net of tax $ 1.96 $ 1.26 $ 3.23 $ 2.49(Loss)/Income from discontinued operations, net of tax (0.01) 0.12 0.01 0.19
Net income (attributable to PPG) $ 1.95 $ 1.38 $ 3.24 $ 2.68
Earnings per common share – assuming dilution: Income from continuing operations, net of tax $ 1.95 $ 1.25 $ 3.21 $ 2.47(Loss)/Income from discontinued operations, net of tax (0.01) 0.12 0.01 0.19
Net income (attributable to PPG) $ 1.94 $ 1.37 $ 3.22 $ 2.66
Dividends per common share $ 0.40 $ 0.40 $ 0.80 $ 0.76
The accompanying notes to the condensed consolidated financial statements are an integral part of this condensed consolidated statement.
2

Table of Contents
PPG INDUSTRIES, INC. AND SUBSIDIARIES
Condensed Consolidated Statement of Comprehensive Income (Unaudited)($ in millions)
Three Months Ended
June 30 Six Months Ended
June 30
2017 2016 2017 2016Net income attributable to the controlling and noncontrolling interests $ 506 $ 376 $ 845 $ 730Other comprehensive income (loss), net of tax:
Defined benefit pension and other postretirement benefits, net (55) 24 (34) 43Unrealized foreign currency translation adjustments 82 (135) 361 (84)Derivative financial instruments, net (4) — (17) (8)
Other comprehensive income (loss), net of tax $ 23 $ (111) 310 (49)Total comprehensive income $ 529 $ 265 $ 1,155 $ 681Less: amounts attributable to noncontrolling interests:
Net income (5) (6) (10) (13)Unrealized foreign currency translation adjustments (6) 5 (13) 2
Comprehensive income attributable to PPG $ 518 $ 264 $ 1,132 $ 670
The accompanying notes to the condensed consolidated financial statements are an integral part of this condensed consolidated statement.
3
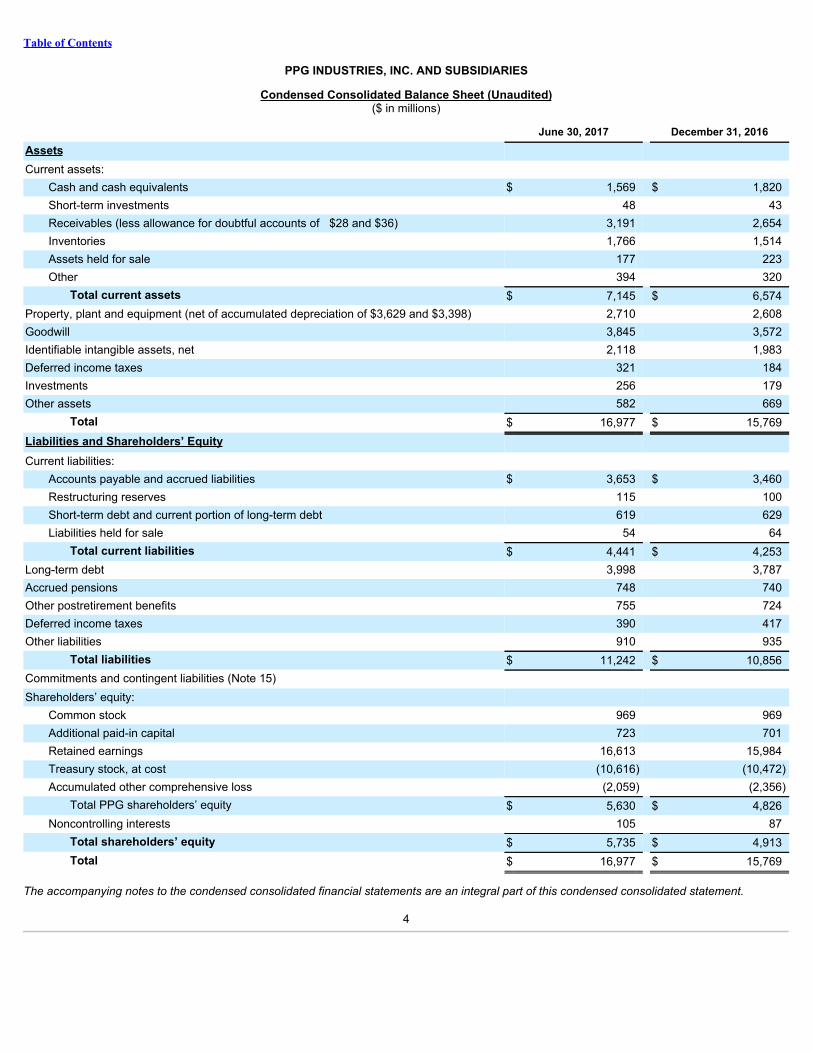
Table of Contents
PPG INDUSTRIES, INC. AND SUBSIDIARIES
Condensed Consolidated Balance Sheet (Unaudited)($ in millions)
June 30, 2017 December 31, 2016Assets Current assets:
Cash and cash equivalents $ 1,569 $ 1,820Short-term investments 48 43Receivables (less allowance for doubtful accounts of $28 and $36) 3,191 2,654Inventories 1,766 1,514Assets held for sale 177 223Other 394 320
Total current assets $ 7,145 $ 6,574Property, plant and equipment (net of accumulated depreciation of $3,629 and $3,398) 2,710 2,608Goodwill 3,845 3,572Identifiable intangible assets, net 2,118 1,983Deferred income taxes 321 184Investments 256 179Other assets 582 669
Total $ 16,977 $ 15,769Liabilities and Shareholders’ Equity Current liabilities:
Accounts payable and accrued liabilities $ 3,653 $ 3,460Restructuring reserves 115 100Short-term debt and current portion of long-term debt 619 629Liabilities held for sale 54 64
Total current liabilities $ 4,441 $ 4,253Long-term debt 3,998 3,787Accrued pensions 748 740Other postretirement benefits 755 724Deferred income taxes 390 417Other liabilities 910 935
Total liabilities $ 11,242 $ 10,856Commitments and contingent liabilities (Note 15) Shareholders’ equity:
Common stock 969 969Additional paid-in capital 723 701Retained earnings 16,613 15,984Treasury stock, at cost (10,616) (10,472)Accumulated other comprehensive loss (2,059) (2,356)
Total PPG shareholders’ equity $ 5,630 $ 4,826Noncontrolling interests 105 87
Total shareholders’ equity $ 5,735 $ 4,913Total $ 16,977 $ 15,769
The accompanying notes to the condensed consolidated financial statements are an integral part of this condensed consolidated statement.
4

Table of Contents
PPG INDUSTRIES, INC. AND SUBSIDIARIESCondensed Consolidated Statement of Cash Flows (Unaudited)
($ in millions)
Six Months Ended
June 30 2017 2016Operating activities:
Net income attributable to controlling and noncontrolling interests $ 845 $ 730Less: Income from discontinued operations (3) (50)
Income from continuing operations $ 842 $ 680Adjustments to reconcile net income to cash from operations:
Depreciation and amortization 223 218Pension expense 34 32Pension settlement 22 —Stock-based compensation expense 24 26Gain from the sale of a business (25) —Gain from the sale of an equity affiliate — (20)Equity affiliate earnings, net of distributions received 3 (5)Deferred income tax (benefit) expense (43) 200Cash contributions to pension plans (37) (13)Cash used for restructuring actions (20) (29)Cash paid for asbestos settlement funding — (813)
Change in certain asset and liability accounts: Receivables (406) (362)Inventories (185) (104)Other current assets (52) (29)Accounts payable and accrued liabilities 141 160Taxes and interest payable (123) (104)Noncurrent assets and liabilities, net (14) 41
Other 50 43Cash from operating activities - continuing operations $ 434 $ (79)Cash from operating activities - discontinued operations 12 78Cash from operating activities $ 446 $ (1)
Investing activities: Capital expenditures (135) (149)Business acquisitions, net of cash balances acquired (62) (10)Payments for acquisition of equity investment (100) —Proceeds from the disposition of a business 52 —Proceeds from the sale of an investment in an equity affiliate — 41Proceeds from maturity of short-term investments — 92Payments for the settlement of cross currency swap contracts (34) (36)Proceeds from the settlement of cross currency swap and foreign currency contracts 19 19Other 2 9Cash used for investing activities - continuing operations $ (258) $ (34)Cash used for investing activities - discontinued operations (3) (19)Cash used for investing activities $ (261) $ (53)
Financing activities: Net change in borrowing with maturities of three months or less (3) 1Net (payments) proceeds on commercial paper and short-term debt (61) 988Repayment of long-term debt (8) (249)Purchase of treasury stock (163) (150)Issuance of treasury stock 20 23Dividends paid (205) (203)Payments related to tax withholding on stock-based compensation awards (20) (24)
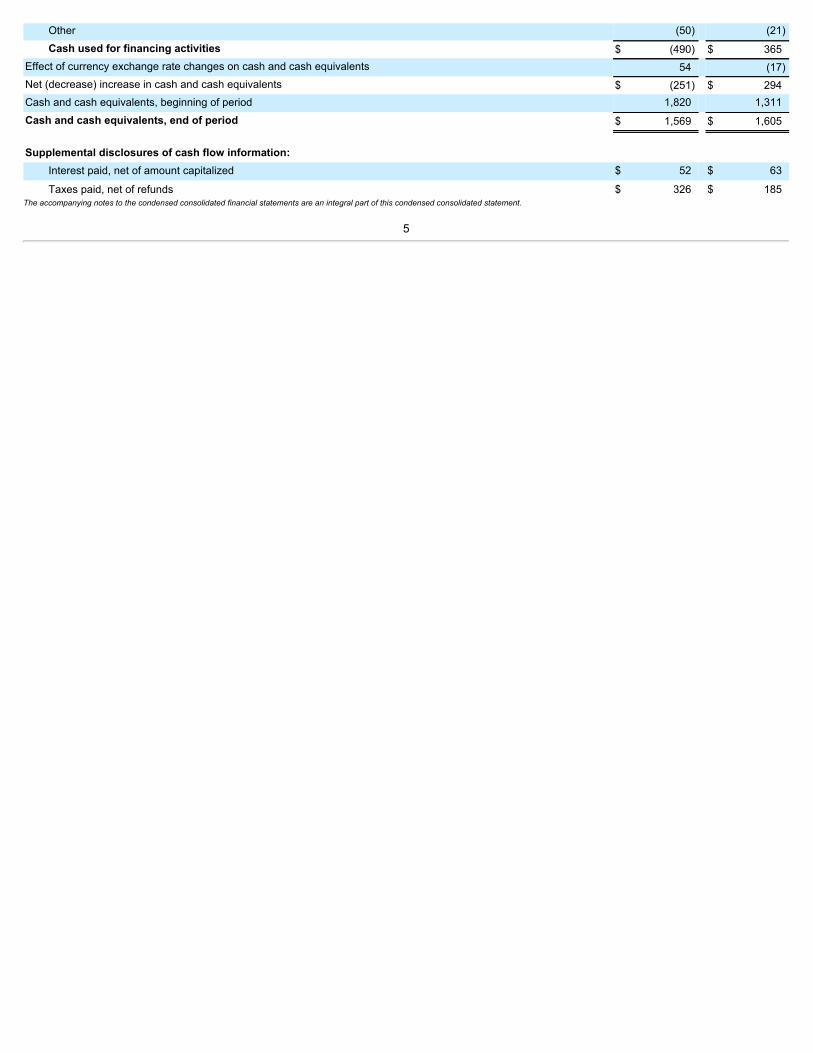
Other (50) (21)Cash used for financing activities $ (490) $ 365
Effect of currency exchange rate changes on cash and cash equivalents 54 (17)Net (decrease) increase in cash and cash equivalents $ (251) $ 294Cash and cash equivalents, beginning of period 1,820 1,311Cash and cash equivalents, end of period $ 1,569 $ 1,605
Supplemental disclosures of cash flow information:
Interest paid, net of amount capitalized $ 52 $ 63
Taxes paid, net of refunds $ 326 $ 185The accompanying notes to the condensed consolidated financial statements are an integral part of this condensed consolidated statement.
5

Table of Contents
PPG INDUSTRIES, INC. AND SUBSIDIARIES
Notes to Condensed Consolidated Financial Statements (Unaudited) 1 . Basis of PresentationThe condensed consolidated financial statements included herein are unaudited and have been prepared following the requirements of theSecurities and Exchange Commission and accounting principles generally accepted in the United States of America ("U.S. GAAP") for interimreporting. Under these rules, certain footnotes and other financial information that are normally required for annual financial statements can becondensed or omitted. These statements include all adjustments, consisting only of normal, recurring adjustments, necessary for a fair presentationof the financial position of PPG Industries, Inc. and its subsidiaries (the "Company" or "PPG") as of June 30, 2017 , and the results of theiroperations and their cash flows for the three and six months ended June 30, 2017 and 2016 . All intercompany balances and transactions havebeen eliminated. Material subsequent events are evaluated through the report issuance date and disclosed where applicable. These condensedconsolidated financial statements should be read in conjunction with the consolidated financial statements and notes included in PPG’s AnnualReport on Form 10-K for the year ended December 31, 2016 .
On May 26, 2017, PPG announced that it had entered into a definitive agreement to sell its North American fiber glass business to Nippon ElectricGlass Co. Ltd. ("NEG"). Refer to Note 3 for additional information. All historical periods have been recast to present the results of operations andcash flows of PPG's North American fiber glass, former European and Asian fiber glass and flat glass businesses, collectively the Glass reportablebusiness segment, as discontinued operations. The balance sheet has been recast to present the assets and liabilities of the North American fiberglass business as assets and liabilities held for sale for all periods presented. PPG now has two reportable business segments, PerformanceCoatings and Industrial Coatings.
The condensed consolidated statement of cash flows has also been recast for the adoption of Accounting Standard Update ("ASU") No. 2016-09,“Improvements to Employee Share-Based Payment Accounting,” as discussed in Note 2.
Net sales, expenses, assets and liabilities can vary during each quarter of the year. Accordingly, the results of operations for the three and sixmonths ended June 30, 2017 and the trends in these unaudited condensed consolidated financial statements may not necessarily be indicative ofthe results to be expected for the full year.
2 . New Accounting StandardsIn May 2017, the Financial Accounting Standards Board ("FASB") issued ASU No. 2017-09, "Stock Compensation - Scope of ModificationAccounting". This ASU requires all modifications to be accounted for as a modification unless the fair value, vesting conditions and classification ofthe award as equity or liability are the same as the classification of the original award immediately before the original award is modified. Theamendments in this ASU are effective for fiscal years beginning after December 15, 2017 and for interim periods therein. PPG does not believe thisASU will have a material impact on its consolidated financial position, results of operation or cash flows.
In March 2017, the FASB issued ASU No. 2017-07, "Improving the Presentation of Net Periodic Pension Cost and Net Periodic PostretirementBenefit Cost." This ASU requires the service cost component of net benefit costs to be disaggregated from all other components and be reported inthe same line item or items as other compensation costs. The other components of net benefit cost are required to be presented in the incomestatement separately from the service cost. The amendments in this ASU are effective for fiscal years beginning after December 15, 2017 and forinterim periods therein. PPG does not believe this ASU will have a material impact on its consolidated financial position, results of operation or cashflows.
In January 2017, PPG adopted ASU No. 2017-04, "Simplifying the Test for Goodwill Impairment." This ASU simplifies how an entity is required totest goodwill for impairment by eliminating Step 2 from the goodwill impairment test. Step 2 measures a goodwill impairment loss by comparing theimplied fair value of a reporting unit’s goodwill with the carrying amount of that goodwill. Adoption of this ASU did not have a material impact onPPG's consolidated financial position, results of operation or cash flows.
In January 2017, PPG adopted ASU No. 2016-18, "Restricted Cash." This ASU eliminates diversity in practice by requiring the statement of cashflows to reconcile total cash, including deposits with restrictions. PPG does not have a material amount of restricted cash. Adoption of this ASU didnot have a material impact on PPG's consolidated financial position, results of operation or cash flows.
In January 2017, PPG adopted ASU No. 2016-09, “Improvements to Employee Share-Based Payment Accounting.” This ASU simplifies certainaspects of the accounting for share-based payment transactions, including income tax
6

Table of Contents
requirements, forfeitures, and presentation on the balance sheet and the statement of cash flows. In conjunction with the adoption of this ASU, PPGrecast the condensed consolidated statement of cash flows to present withholding tax payments related-to stock-based compensation made onbehalf of employees, as financing outflows. Adoption of this ASU did not have a material impact on PPG's consolidated financial position, results ofoperation or cash flows.
In February 2016, the FASB issued ASU No. 2016-02, “Leases.” This ASU requires all lessees to recognize on the balance sheet right to use assetsand lease liabilities for the rights and obligations created by lease arrangements with terms greater than 12 months. The amendments in this ASUare effective for fiscal years beginning after December 15, 2018 and for interim periods therein. PPG is in the process of assessing the impact theadoption of this ASU will have on its consolidated financial position, results of operations and cash flows.
In May 2014, the FASB issued ASU No. 2014-09, “Revenue from Contracts with Customers: Topic 606.” This ASU replaces nearly all existing U.S.GAAP guidance on revenue recognition. The standard prescribes a five-step model for recognizing revenue, the application of which will requiresignificant judgment. The amendments in this ASU are effective for fiscal years beginning after December 15, 2017, and for interim periods therein.The provisions of this ASU may be applied retroactively or on a modified retrospective (cumulative effect) basis. PPG has not yet selected whichtransition method it will apply upon adoption. In addition, PPG is evaluating recently issued guidance on practical expedients as part of its transitiondecision. PPG believes the preponderance of the Company’s contracts with customers are standard ship and bill arrangements. Under theprovisions of this ASU, PPG believes certain costs currently reported in Selling, general and administrative costs will be reclassified to Cost of sales,exclusive of depreciation and amortization on the Condensed Consolidated Statement of Income, as they are tied to the satisfaction of aperformance obligation. In addition, PPG expects the cost of certain customer incentives will be recorded as a reduction of Net sales rather thanCost of sales, exclusive of depreciation and amortization or Selling, general and administrative costs. Given the complexity of certain contractualarrangements, PPG is in the process of assessing the total impact this ASU will have on its consolidated financial position, results of operations andcash flows and has not concluded as to its significance.
3 . Acquisitions and DivestituresAcquisitionsThe Crown GroupOn July 20, 2017, PPG signed a definitive agreement to acquire The Crown Group (“Crown”), a U.S.-based coatings application services business.The transaction is expected to close in the third quarter 2017, subject to customary closing conditions.Crown, headquartered in Warren, Michigan, is one of the leading component and product finishers in North America. Crown applies coatings tocustomers’ manufactured parts and assembled products at 11 U.S. sites. Most of Crown’s facilities, which also provide assembly, warehousing andsequencing services, are located at customer facilities or positioned near customer manufacturing sites. The company serves manufacturers inautomotive, agriculture, construction, heavy truck and alternative energy industries.
Taiwan Chlorine Industries
Taiwan Chlorine Industries (“TCI”) was established in 1986 as a joint venture between PPG and China Petrochemical Development Corporation(“CPDC”) to produce chlorine-based products in Taiwan, at which time PPG owned 60 percent of the venture. In conjunction with the 2013separation of its commodity chemicals business, PPG conveyed to Axiall Corporation ("Axiall") its 60% ownership interest in TCI. Under PPG’sagreement with CPDC, if certain post-closing conditions were not met following the 3 year anniversary of the separation, CPDC had the option tosell its 40% ownership interest in TCI to Axiall for $100 million . In turn, Axiall had a right to designate PPG as its designee to purchase the 40%ownership interest of CPDC. In April 2016, Axiall announced that CPDC had decided to sell its ownership interest in TCI to Axiall. In June 2016,Axiall formally designated PPG to purchase the 40% ownership interest in TCI. In August 2016, Westlake Chemical Corporation acquired Axiall,which became a wholly-owned subsidiary of Westlake. On April 11, 2017, PPG finalized its purchase of CPDC’s 40% ownership interest in TCI. Thedifference between the acquisition date fair value and the purchase price of PPG’s 40% ownership interest in TCI has been recorded as a loss indiscontinued operations during the second quarter 2017.Other
In January 2017, PPG acquired certain assets of automotive refinish coatings company Futian Xinshi (Futian), an automotive refinish coatingscompany based in the Guangdong province of China. Futian distributes its products in China through a network of more than 200 distributors.
7

Table of Contents
Also in January 2017, PPG completed the acquisition of DEUTEK S.A., a leading Romanian paint and architectural coatings manufacturer, from theEmerging Europe Accession Fund. DEUTEK, established in 1993, manufactures and markets a large portfolio of well-known professional andconsumer paint brands, including OSKAR ® and DANKE! ® . The company’s products are sold in more than 120 do-it-yourself stores and 3,500independent retail outlets in Romania.
DivestituresPlaka Business
On June 1, 2017, PPG completed the sale of the assets of its Mexico-based Plaka plasterboard and cement-board business to Knauf InternationalGmbH and recorded a pre-tax gain of $25 million in the second quarter 2017. The Company's balance sheet presents the assets and liabilities of thePlaka business as held for sale as of December 31, 2016.
Glass Segment
On May 26, 2017, PPG announced it had entered into a definitive agreement to sell its North American fiber glass business to NEG. As the sale ofits remaining fiber glass business represents the culmination of a multi-year strategic shift in its business portfolio, resulting in the exit of all PPGfiber glass and flat glass operations, PPG has recast the results of operations and cash flows for its former Glass reportable business segment asdiscontinued operations for all periods presented, including the results of the European fiber glass business, PPG's ownership interest in two Asianjoint ventures and the flat glass business. Accordingly, PPG now has two reportable business segments.
The net sales and income from discontinued operations related to the former Glass reportable business segment for the three and six months endedJune 30, 2017 and 2016 were as follows:
Three Months Ended
June 30 Six Months Ended
June 30($ in millions) 2017 2016 2017 2016Net sales $ 84 $ 282 $ 167 $ 543 Income from operations $ 9 $ 43 $ 18 $ 71Income tax expense 3 12 7 21Income from discontinued operations, net of tax $ 6 $ 31 $ 11 $ 50
North American Fiber Glass Business
The sale of PPG's remaining fiber glass operations is expected to close in the second half of 2017, subject to customary closing conditions. Pre-taxproceeds from the sale are expected to be approximately $545 million .
PPG’s remaining fiber glass operations include manufacturing facilities in Chester, South Carolina, and Lexington and Shelby, North Carolina; andadministrative and research-and-development operations in Shelby and in Harmar, Pennsylvania, near Pittsburgh. The business, which employsmore than 1,000 people and had net sales of approximately $350 million in 2016, supplies the transportation, energy, infrastructure and consumermarkets. In 2016, PPG completed the sale of its European fiber glass operations to NEG and divested its ownership interests in two Asian fiberglass joint ventures.
The Company's balance sheet has been recast to present the assets and liabilities of the North American fiber glass business as held for sale for allperiods presented.
8

Table of Contents
The major classes of assets and liabilities of the North American fiber glass business included in the PPG condensed, consolidated balance sheet atJune 30, 2017 and December 31, 2016 were as follows:
($ in millions) June 30, 2017 December 31, 2016Receivables $ 40 $ 38Inventory 24 32Other current assets — 1Property, plant and equipment 143 151Deferred tax asset (a) (30) (30)Other non-current assets — 1
Assets held for sale $ 177 $ 193Accounts payable and accrued liabilities 47 52Long-term liabilities 7 12
Liabilities held for sale $ 54 $ 64
(a) The net deferred income tax liability is included in assets held for sale due to the Company's tax jurisdictional netting.
Flat Glass Business
In October 2016, PPG completed the sale of its flat glass manufacturing and glass coatings operations to Vitro S.A.B. de C.V. For the three and sixmonths ended June 30, 2016, the results of operations of the flat glass business are presented as discontinued operations on the condensedconsolidated statements of income and cash flows.
4 . Inventories
($ in millions) June 30, 2017 December 31, 2016Finished products $ 1,114 $ 947Work in process 186 165Raw materials 433 370Supplies 33 32
Total Inventories $ 1,766 $ 1,514
Most U.S. inventories are valued using the last-in, first-out method. These inventories represented approximately 35% and 38% of total inventoriesat June 30, 2017 and December 31, 2016 , respectively. If the first-in, first-out method of inventory valuation had been used, inventories would havebeen $102 million and $106 million higher as of June 30, 2017 and December 31, 2016 , respectively.
5 . Goodwill and Other Identifiable Intangible AssetsThe change in the carrying amount of goodwill attributable to each reportable segment for the six months ended June 30, 2017 was as follows:
($ in millions)Performance
Coatings IndustrialCoatings Total
Balance, December 31, 2016 $ 2,870 $ 702 $ 3,572Acquisitions 24 10 34Foreign currency 207 32 239
Balance, June 30, 2017 $ 3,101 $ 744 $ 3,845
9
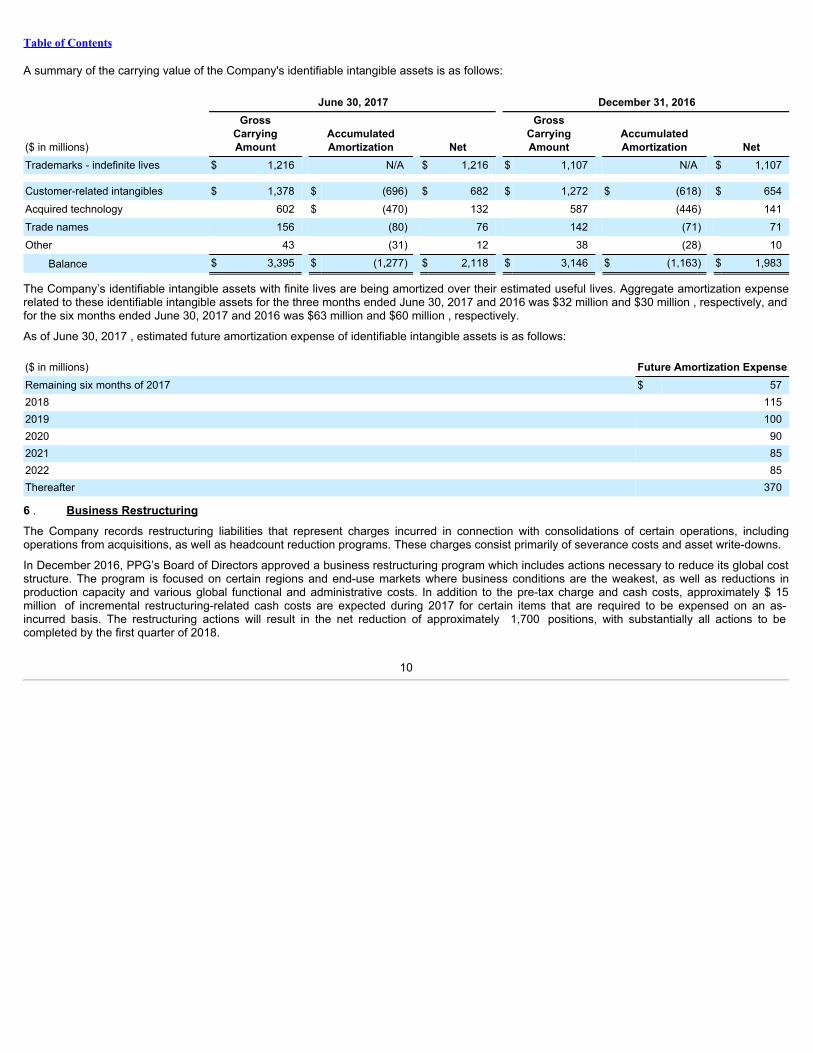
Table of Contents
A summary of the carrying value of the Company's identifiable intangible assets is as follows:
June 30, 2017 December 31, 2016
($ in millions)
GrossCarryingAmount
AccumulatedAmortization Net
GrossCarryingAmount
AccumulatedAmortization Net
Trademarks - indefinite lives $ 1,216 N/A $ 1,216 $ 1,107 N/A $ 1,107 Customer-related intangibles $ 1,378 $ (696) $ 682 $ 1,272 $ (618) $ 654Acquired technology 602 $ (470) 132 587 (446) 141Trade names 156 (80) 76 142 (71) 71Other 43 (31) 12 38 (28) 10
Balance $ 3,395 $ (1,277) $ 2,118 $ 3,146 $ (1,163) $ 1,983
The Company’s identifiable intangible assets with finite lives are being amortized over their estimated useful lives. Aggregate amortization expenserelated to these identifiable intangible assets for the three months ended June 30, 2017 and 2016 was $32 million and $30 million , respectively, andfor the six months ended June 30, 2017 and 2016 was $63 million and $60 million , respectively.
As of June 30, 2017 , estimated future amortization expense of identifiable intangible assets is as follows:
($ in millions) Future Amortization ExpenseRemaining six months of 2017 $ 572018 1152019 1002020 902021 852022 85Thereafter 370
6 . Business RestructuringThe Company records restructuring liabilities that represent charges incurred in connection with consolidations of certain operations, includingoperations from acquisitions, as well as headcount reduction programs. These charges consist primarily of severance costs and asset write-downs.
In December 2016, PPG’s Board of Directors approved a business restructuring program which includes actions necessary to reduce its global coststructure. The program is focused on certain regions and end-use markets where business conditions are the weakest, as well as reductions inproduction capacity and various global functional and administrative costs. In addition to the pre-tax charge and cash costs, approximately $ 15million of incremental restructuring-related cash costs are expected during 2017 for certain items that are required to be expensed on an as-incurred basis. The restructuring actions will result in the net reduction of approximately 1,700 positions, with substantially all actions to becompleted by the first quarter of 2018.
10
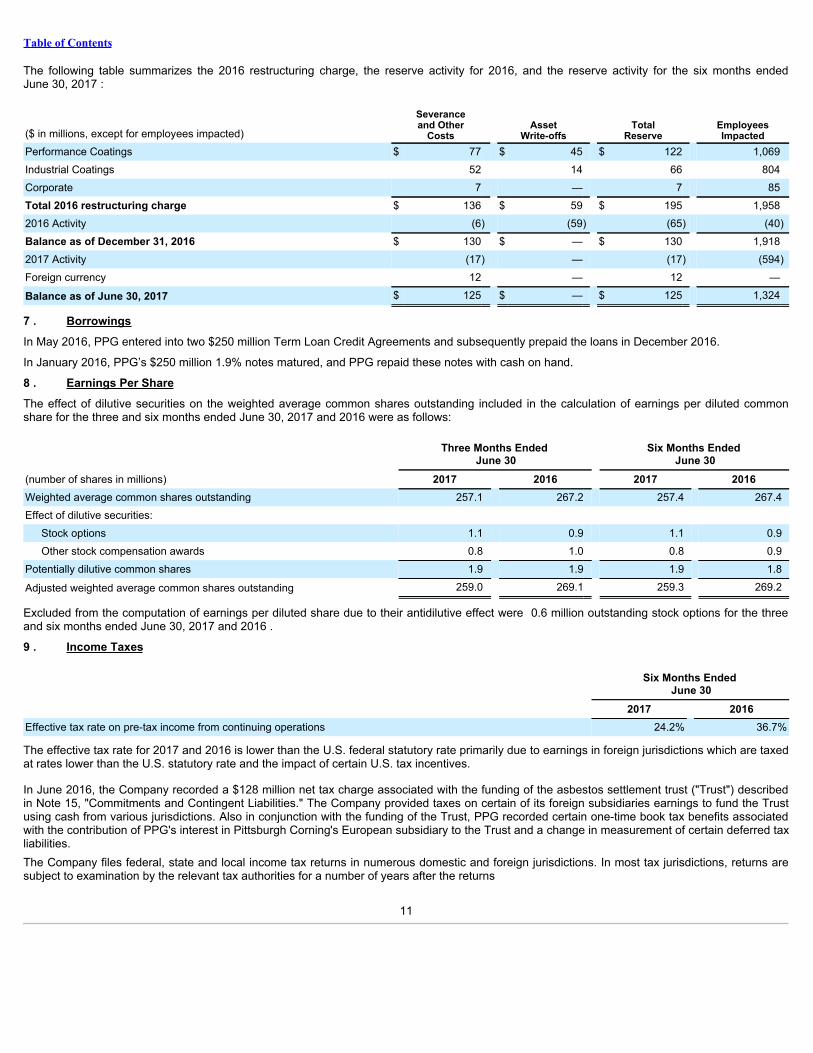
Table of Contents
The following table summarizes the 2016 restructuring charge, the reserve activity for 2016, and the reserve activity for the six months endedJune 30, 2017 :
($ in millions, except for employees impacted)
Severanceand Other
Costs Asset
Write-offs Total
Reserve EmployeesImpacted
Performance Coatings $ 77 $ 45 $ 122 1,069Industrial Coatings 52 14 66 804Corporate 7 — 7 85Total 2016 restructuring charge $ 136 $ 59 $ 195 1,9582016 Activity (6) (59) (65) (40)Balance as of December 31, 2016 $ 130 $ — $ 130 1,9182017 Activity (17) — (17) (594)Foreign currency 12 — 12 —
Balance as of June 30, 2017 $ 125 $ — $ 125 1,324
7 . BorrowingsIn May 2016, PPG entered into two $250 million Term Loan Credit Agreements and subsequently prepaid the loans in December 2016.
In January 2016, PPG’s $250 million 1.9% notes matured, and PPG repaid these notes with cash on hand.
8 . Earnings Per ShareThe effect of dilutive securities on the weighted average common shares outstanding included in the calculation of earnings per diluted commonshare for the three and six months ended June 30, 2017 and 2016 were as follows:
Three Months Ended
June 30 Six Months Ended
June 30(number of shares in millions) 2017 2016 2017 2016Weighted average common shares outstanding 257.1 267.2 257.4 267.4Effect of dilutive securities:
Stock options 1.1 0.9 1.1 0.9Other stock compensation awards 0.8 1.0 0.8 0.9
Potentially dilutive common shares 1.9 1.9 1.9 1.8
Adjusted weighted average common shares outstanding 259.0 269.1 259.3 269.2
Excluded from the computation of earnings per diluted share due to their antidilutive effect were 0.6 million outstanding stock options for the threeand six months ended June 30, 2017 and 2016 .
9 . Income Taxes
Six Months Ended
June 30 2017 2016Effective tax rate on pre-tax income from continuing operations 24.2% 36.7%
The effective tax rate for 2017 and 2016 is lower than the U.S. federal statutory rate primarily due to earnings in foreign jurisdictions which are taxedat rates lower than the U.S. statutory rate and the impact of certain U.S. tax incentives.
In June 2016, the Company recorded a $128 million net tax charge associated with the funding of the asbestos settlement trust ("Trust") describedin Note 15, "Commitments and Contingent Liabilities." The Company provided taxes on certain of its foreign subsidiaries earnings to fund the Trustusing cash from various jurisdictions. Also in conjunction with the funding of the Trust, PPG recorded certain one-time book tax benefits associatedwith the contribution of PPG's interest in Pittsburgh Corning's European subsidiary to the Trust and a change in measurement of certain deferred taxliabilities.The Company files federal, state and local income tax returns in numerous domestic and foreign jurisdictions. In most tax jurisdictions, returns aresubject to examination by the relevant tax authorities for a number of years after the returns
11
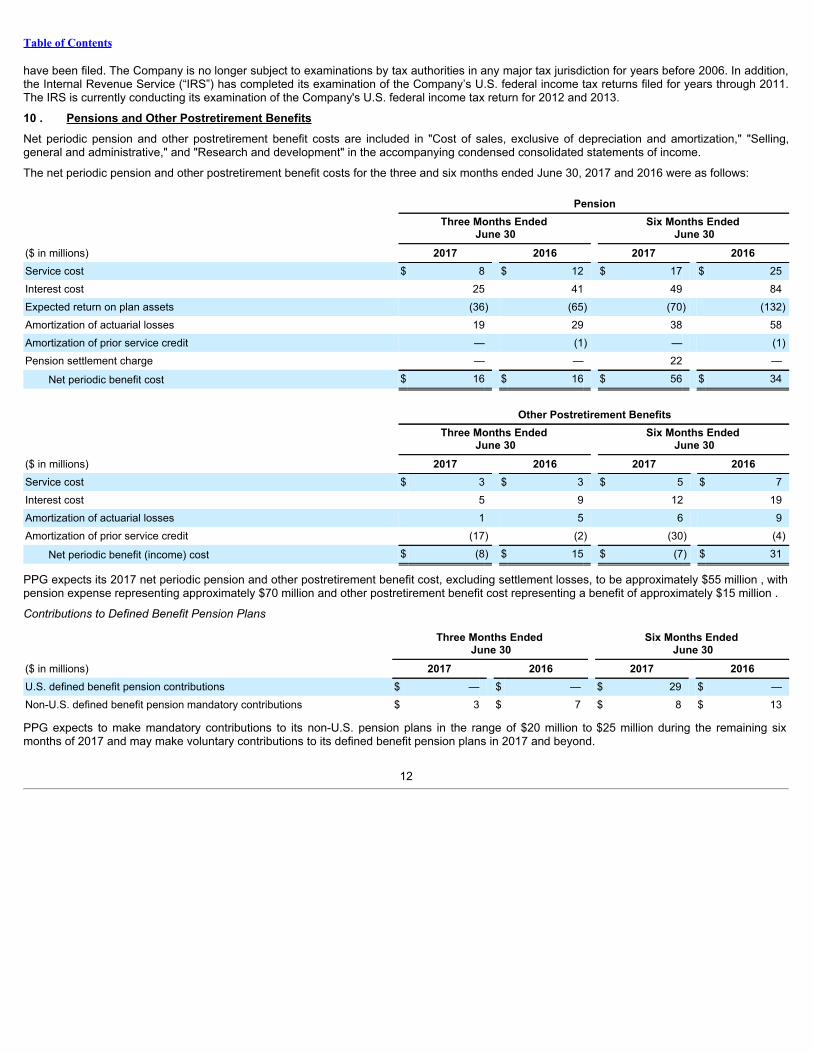
Table of Contents
have been filed. The Company is no longer subject to examinations by tax authorities in any major tax jurisdiction for years before 2006. In addition,the Internal Revenue Service (“IRS”) has completed its examination of the Company’s U.S. federal income tax returns filed for years through 2011.The IRS is currently conducting its examination of the Company's U.S. federal income tax return for 2012 and 2013.
10 . Pensions and Other Postretirement BenefitsNet periodic pension and other postretirement benefit costs are included in "Cost of sales, exclusive of depreciation and amortization," "Selling,general and administrative," and "Research and development" in the accompanying condensed consolidated statements of income.
The net periodic pension and other postretirement benefit costs for the three and six months ended June 30, 2017 and 2016 were as follows:
Pension
Three Months Ended
June 30 Six Months Ended
June 30($ in millions) 2017 2016 2017 2016Service cost $ 8 $ 12 $ 17 $ 25Interest cost 25 41 49 84Expected return on plan assets (36) (65) (70) (132)Amortization of actuarial losses 19 29 38 58Amortization of prior service credit — (1) — (1)Pension settlement charge — — 22 —
Net periodic benefit cost $ 16 $ 16 $ 56 $ 34
Other Postretirement Benefits
Three Months Ended
June 30 Six Months Ended
June 30($ in millions) 2017 2016 2017 2016Service cost $ 3 $ 3 $ 5 $ 7Interest cost 5 9 12 19Amortization of actuarial losses 1 5 6 9Amortization of prior service credit (17) (2) (30) (4)
Net periodic benefit (income) cost $ (8) $ 15 $ (7) $ 31
PPG expects its 2017 net periodic pension and other postretirement benefit cost, excluding settlement losses, to be approximately $55 million , withpension expense representing approximately $70 million and other postretirement benefit cost representing a benefit of approximately $15 million .
Contributions to Defined Benefit Pension Plans
Three Months Ended
June 30 Six Months Ended
June 30($ in millions) 2017 2016 2017 2016U.S. defined benefit pension contributions $ — $ — $ 29 $ —Non-U.S. defined benefit pension mandatory contributions $ 3 $ 7 $ 8 $ 13
PPG expects to make mandatory contributions to its non-U.S. pension plans in the range of $20 million to $25 million during the remaining sixmonths of 2017 and may make voluntary contributions to its defined benefit pension plans in 2017 and beyond.
12
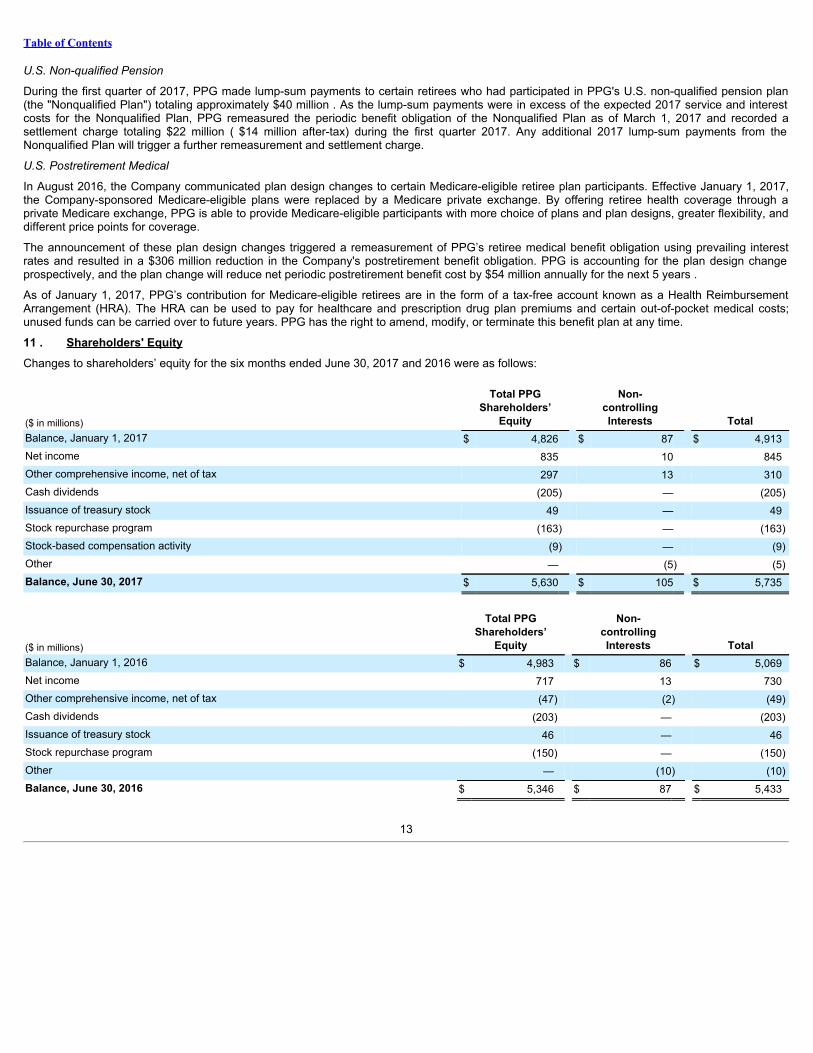
Table of Contents
U.S. Non-qualified Pension
During the first quarter of 2017, PPG made lump-sum payments to certain retirees who had participated in PPG's U.S. non-qualified pension plan(the "Nonqualified Plan") totaling approximately $40 million . As the lump-sum payments were in excess of the expected 2017 service and interestcosts for the Nonqualified Plan, PPG remeasured the periodic benefit obligation of the Nonqualified Plan as of March 1, 2017 and recorded asettlement charge totaling $22 million ( $14 million after-tax) during the first quarter 2017. Any additional 2017 lump-sum payments from theNonqualified Plan will trigger a further remeasurement and settlement charge.
U.S. Postretirement Medical
In August 2016, the Company communicated plan design changes to certain Medicare-eligible retiree plan participants. Effective January 1, 2017,the Company-sponsored Medicare-eligible plans were replaced by a Medicare private exchange. By offering retiree health coverage through aprivate Medicare exchange, PPG is able to provide Medicare-eligible participants with more choice of plans and plan designs, greater flexibility, anddifferent price points for coverage.
The announcement of these plan design changes triggered a remeasurement of PPG’s retiree medical benefit obligation using prevailing interestrates and resulted in a $306 million reduction in the Company's postretirement benefit obligation. PPG is accounting for the plan design changeprospectively, and the plan change will reduce net periodic postretirement benefit cost by $54 million annually for the next 5 years .
As of January 1, 2017, PPG’s contribution for Medicare-eligible retirees are in the form of a tax-free account known as a Health ReimbursementArrangement (HRA). The HRA can be used to pay for healthcare and prescription drug plan premiums and certain out-of-pocket medical costs;unused funds can be carried over to future years. PPG has the right to amend, modify, or terminate this benefit plan at any time.
11 . Shareholders' EquityChanges to shareholders’ equity for the six months ended June 30, 2017 and 2016 were as follows:
($ in millions)
Total PPGShareholders’
Equity
Non-controllingInterests Total
Balance, January 1, 2017 $ 4,826 $ 87 $ 4,913Net income 835 10 845Other comprehensive income, net of tax 297 13 310Cash dividends (205) — (205)Issuance of treasury stock 49 — 49Stock repurchase program (163) — (163)Stock-based compensation activity (9) — (9)Other — (5) (5)Balance, June 30, 2017 $ 5,630 $ 105 $ 5,735
($ in millions)
Total PPGShareholders’
Equity
Non-controllingInterests Total
Balance, January 1, 2016 $ 4,983 $ 86 $ 5,069Net income 717 13 730Other comprehensive income, net of tax (47) (2) (49)Cash dividends (203) — (203)Issuance of treasury stock 46 — 46Stock repurchase program (150) — (150)Other — (10) (10)Balance, June 30, 2016 $ 5,346 $ 87 $ 5,433
13

Table of Contents
12 . Accumulated Other Comprehensive Loss
($ in millions)
Unrealized ForeignCurrency
Translation Adjustments
Pension and OtherPostretirement
Benefit Adjustments, netof tax
Unrealized Gain (Loss)on
Derivatives, net of tax
Accumulated OtherComprehensive (Loss)
IncomeBalance, January 1, 2017 $ (1,798) $ (571) $ 13 $ (2,356)Current year deferrals to AOCI 530 (a) — 530 Current year deferrals to AOCI, tax effected (182) (b) (59) (c) (13) (d) (254) Reclassifications from AOCI to net income — 25 (c) (4) (d) 21 Net change $ 348 $ (34) $ (17) $ 297
Balance, June 30, 2017 $ (1,450) $ (605) $ (4) $ (2,059)
Balance, January 1, 2016 $ (1,332) $ (1,379) $ 9 $ (2,702)Current year deferrals to AOCI (85) (a) — — (85) Current year deferrals to AOCI, tax effected 3 (b) 17 (c) 2 (d) 22 Reclassifications from AOCI to net income — 26 (c) (10) (d) 16 Net change $ (82) $ 43 $ (8) $ (47)
Balance, June 30, 2016 $ (1,414) $ (1,336) $ 1 $ (2,749)
(a) - Unrealized foreign currency translation adjustments related to the translation of foreign denominated balance sheet account balances are not presented net of tax giventhat no deferred U.S. income taxes have been provided on the undistributed earnings of non-U.S. subsidiaries because they are deemed to be reinvested for an indefiniteperiod of time.
(b) - The tax benefit related to unrealized foreign currency translation adjustments on tax inter-branch transactions and net investment hedges for the six months endedJune 30, 2017 and 2016 was $(113) million and ($46) million , respectively. The balance also includes a remeasurement of the tax cost on certain foreign proceeds which havenot been permanently reinvested.
(c) - The tax benefit related to the adjustment for pension and other postretirement benefits for the six months ended June 30, 2017 and 2016 was $(14) million and $(20)million , respectively. Reclassifications from AOCI are included in the computation of net periodic pension and other post-retirement benefit costs (See Note 10, "Pensions andOther Postretirement Benefits").
(d) - The tax benefit related to the changes in the unrealized gain (loss) on derivatives for the six months ended June 30, 2017 and 2016 was $(8) million and $(3) million ,respectively. Reclassifications from AOCI are included in the gain recognized on cash flow hedges (See Note 13, "Financial Instruments, Hedging Activities and Fair ValueMeasurements").
13 . Financial Instruments, Hedging Activities and Fair Value MeasurementsFinancial instruments include cash and cash equivalents, short-term investments, cash held in escrow, marketable equity securities, accountsreceivable, company-owned life insurance, accounts payable, short-term and long-term debt instruments, and derivatives. The fair values of thesefinancial instruments approximated their carrying values at June 30, 2017 and December 31, 2016 , in the aggregate, except for long-term debtinstruments.
Hedging ActivitiesThe Company has exposure to market risk from changes in foreign currency exchange rates and interest rates. Prior to the settlement of theAsbestos Settlement Trust described in Note 15 , " Commitments and Contingent Liabilities ," the Company had exposure to changes in PPG'sstock price. As a result, financial instruments, including derivatives, may be (or had been) used to hedge these underlying economic exposures.Certain of these instruments qualify as cash flow, fair value and net investment hedges upon meeting the requisite criteria, including effectiveness ofoffsetting hedged or underlying exposures. Changes in the fair value of derivatives that do not qualify for hedge accounting are recognized inincome from continuing operations in the period incurred.
PPG’s policies do not permit speculative use of derivative financial instruments. PPG enters into derivative financial instruments with high creditquality counterparties and diversifies its positions among such counterparties in order to reduce its exposure to credit losses. The Company did notrealize a credit loss on derivatives during the three and six month periods ended June 30, 2017 and 2016 .
All of PPG's outstanding derivative instruments are subject to accelerated settlement in the event of PPG’s failure to meet its debt or paymentobligations under the terms of the instruments’ contractual provisions. In addition, should the Company be acquired and its payment obligationsunder the derivative instruments’ contractual arrangements not be assumed by the acquirer, or should PPG enter into bankruptcy, receivership orreorganization proceedings, the instruments would also be subject to accelerated settlement.
14

Table of Contents
There were no derivative instruments de-designated or discontinued as hedging instruments during the three and six month periods ended June 30,2017 and 2016 and there were no gains or losses deferred in AOCI that were reclassified to income from continuing operations during the six monthperiods ended June 31, 2017 and 2016 related to hedges of anticipated transactions there were no longer expected to occur.
Fair Value Hedges
Through September 2016, PPG designated certain foreign currency forward contracts as hedges against the Company's exposure to future changesin fair value of certain firm sales commitments denominated in foreign currency. As of June 30, 2017 and December 31, 2016, there were nooutstanding foreign currency forward contracts designated as hedges against future changes in the fair value of certain firm sales commitments.
Until June 2016, PPG held outstanding renewable equity forward arrangements to hedge the impact to PPG's income from continuing operations forchanges in the fair value of 2,777,778 shares of PPG stock that were contributed to the asbestos settlement trust as discussed in Note 15,“Commitments and Contingent Liabilities.” These financial instruments were recorded at fair value as assets or liabilities and changes in the fairvalue of these financial instruments were reflected in the “Asbestos settlement – net” caption of the accompanying condensed consolidatedstatement of income. In conjunction with the funding of the Asbestos Settlement Trust in June 2016, the equity forward arrangements were settled.At settlement, the aggregated fair value of the equity forward arrangements was an asset of $258 million .
The Company used interest rate swaps from time to time to manage its exposure to changing interest rates. When outstanding, the interest rateswaps were designated as fair value hedges of certain outstanding debt obligations and were recorded at fair value. There were no interest rateswaps outstanding as of June 30, 2017 and December 31, 2016 . However, in prior years, PPG settled interest rate swaps and received cash. Thefair value adjustment of the debt at the time the interest rate swaps were settled is still being amortized as a reduction to interest expense over theremaining term of the related debt, which matures in 2021. The impact of the amortization is insignificant.
Cash Flow Hedges
PPG designates certain foreign currency forward contracts as cash flow hedges of the Company’s exposure to variability in exchange rates onintercompany and third party transactions denominated in foreign currencies. As of June 30, 2017 and December 31, 2016 , the fair value of allforeign currency forward contracts designated as cash flow hedges was a net liability of $11 million and a net asset of $13 million , respectively.
Net Investment Hedges
PPG uses cross currency swaps and Euro-denominated debt to hedge a portion of its net investment in its European operations.
As of June 30, 2017 , U.S. dollar to Euro cross currency swap contracts with a total notional amount of $560 million were outstanding and arescheduled to expire in March 2018. On settlement of the outstanding contracts, PPG will receive $560 million U.S. dollars and pay Euros to thecounterparties. During the term of these contracts, PPG receives semiannual payments in March and September of each year based on a U.S.dollar, long-term interest rate fixed as of the contract inception date, and PPG makes annual payments in March of each year to the counterpartiesbased on a Euro, long-term interest rate fixed as of the contract inception date. As of June 30, 2017 and December 31, 2016 , the fair value of thesecontracts was a net asset of $42 million and $65 million , respectively.
As of June 30, 2017 and December 31, 2016 , PPG had designated €2.8 billion of Euro-denominated borrowings as hedges of a portion of its netinvestment in the Company's European operations. The carrying value of these instruments as of June 30, 2017 and December 31, 2016 was $3.2billion and $2.9 billion , respectively.
Gains/Losses Deferred in AOCI
As of June 30, 2017 and December 31, 2016 , the Company had accumulated pre-tax unrealized net foreign currency translation gains in AOCIrelated to the Euro-denominated borrowings, foreign currency forward contracts and the cross currency swaps of $187 million and $482 million ,respectively.
15

Table of Contents
The following tables summarize the location within the financial statements and amount of gains (losses) related to derivative financial instrumentsfor the six months ended June 30, 2017 and 2016 . All dollar amounts are shown on a pre-tax basis.
($ in millions) June 30, 2017
Hedge Type
Loss Deferred in
OCI
Gain Recognized
Amount CaptionCash Flow
Foreign currency forward contracts (a) $ (20) $ 6 Other charges
Total Cash Flow $ (20) $ 6
Net Investment Foreign currency forward contracts $ (3) Cross currency swaps (38) Foreign denominated debt (254)
Total Net Investment $ (295)
(a) The ineffective portion related to this item was $4 million of expense.
($ in millions) June 30, 2016
Hedge Type
Loss Deferred in
OCI
Gain (Loss) Recognized
Amount CaptionFair Value
Equity forward arrangements 35 Asbestos settlement - net
Total Fair Value $ 35
Cash Flow Foreign currency forward contracts (a) (13) (2) Other charges
Total Cash Flow $ (13) $ (2)
Net Investment Cross currency swaps $ (6) Foreign denominated debt (43)
Total Net Investment $ (49)
(a) The ineffective portion related to this item was $2 million of income.
Fair Value MeasurementsThe Company follows a fair value measurement hierarchy to measure its assets and liabilities. As of June 30, 2017 and December 31, 2016 , theassets and liabilities measured at fair value on a recurring basis were cash equivalents, equity securities and derivatives. In addition, the Companymeasures its pension plan assets at fair value (see Note 12, "Employee Benefit Plans" under Item 8 in the Company's Annual Report on Form 10-Kfor the year ended December 31, 2016 for further details). The Company's financial assets and liabilities are measured using inputs from thefollowing three levels:
Level 1 inputs are quoted prices (unadjusted) in active markets for identical assets and liabilities that the Company has the ability to accessat the measurement date. Level 1 inputs are considered to be the most reliable evidence of fair value as they are based on unadjustedquoted market prices from various financial information service providers and securities exchanges.
Level 2 inputs are directly or indirectly observable prices that are not quoted on active exchanges, which include quoted prices for similarassets and liabilities in active markets, quoted prices for identical or similar assets or liabilities in markets that are not active, inputs otherthan quoted prices that are observable for the asset or liability and inputs that are derived principally from or corroborated by observablemarket data by correlation or other means. The fair values of the derivative instruments reflect the instruments' contractual terms, includingthe period to maturity, and uses observable market-based inputs, including forward curves.
16
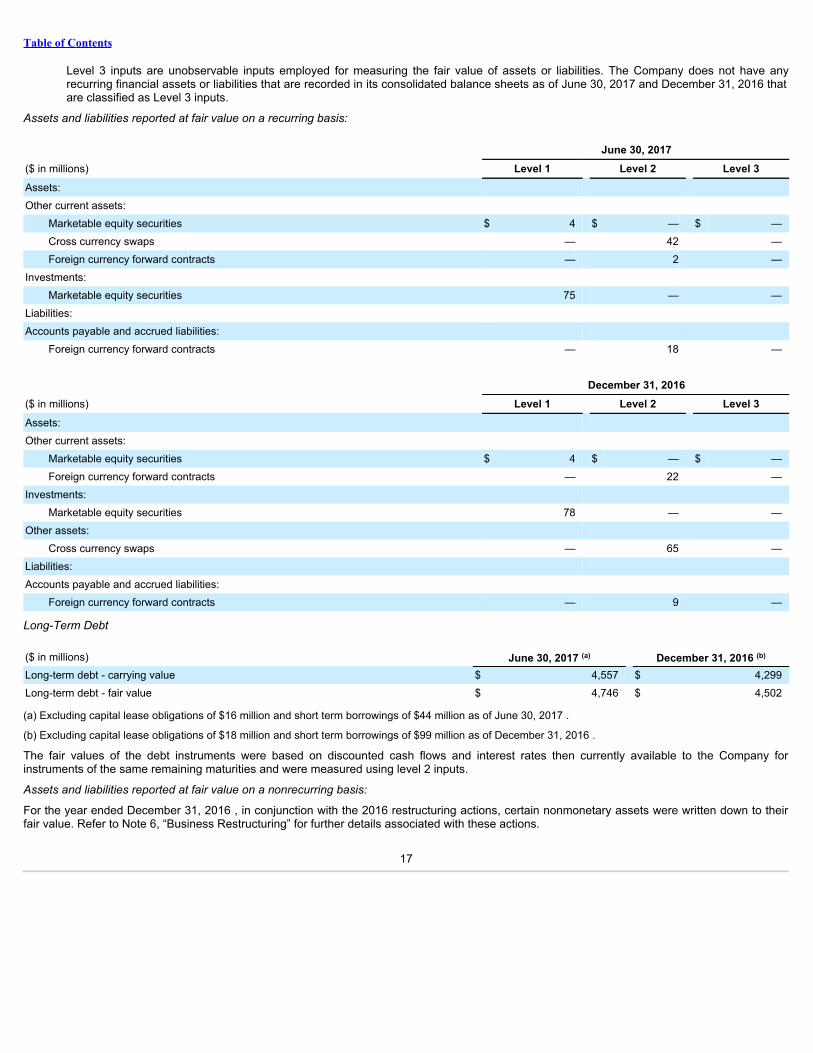
Table of Contents
Level 3 inputs are unobservable inputs employed for measuring the fair value of assets or liabilities. The Company does not have anyrecurring financial assets or liabilities that are recorded in its consolidated balance sheets as of June 30, 2017 and December 31, 2016 thatare classified as Level 3 inputs.
Assets and liabilities reported at fair value on a recurring basis:
June 30, 2017($ in millions) Level 1 Level 2 Level 3Assets: Other current assets:
Marketable equity securities $ 4 $ — $ —Cross currency swaps — 42 —Foreign currency forward contracts — 2 —
Investments: Marketable equity securities 75 — —
Liabilities: Accounts payable and accrued liabilities:
Foreign currency forward contracts — 18 — December 31, 2016($ in millions) Level 1 Level 2 Level 3Assets: Other current assets:
Marketable equity securities $ 4 $ — $ —Foreign currency forward contracts — 22 —
Investments: Marketable equity securities 78 — —
Other assets: Cross currency swaps — 65 —
Liabilities: Accounts payable and accrued liabilities:
Foreign currency forward contracts — 9 —
Long-Term Debt
($ in millions) June 30, 2017 (a) December 31, 2016 (b)
Long-term debt - carrying value $ 4,557 $ 4,299Long-term debt - fair value $ 4,746 $ 4,502
(a) Excluding capital lease obligations of $16 million and short term borrowings of $44 million as of June 30, 2017 .
(b) Excluding capital lease obligations of $18 million and short term borrowings of $99 million as of December 31, 2016 .
The fair values of the debt instruments were based on discounted cash flows and interest rates then currently available to the Company forinstruments of the same remaining maturities and were measured using level 2 inputs.
Assets and liabilities reported at fair value on a nonrecurring basis:
For the year ended December 31, 2016 , in conjunction with the 2016 restructuring actions, certain nonmonetary assets were written down to theirfair value. Refer to Note 6, “Business Restructuring” for further details associated with these actions.
17
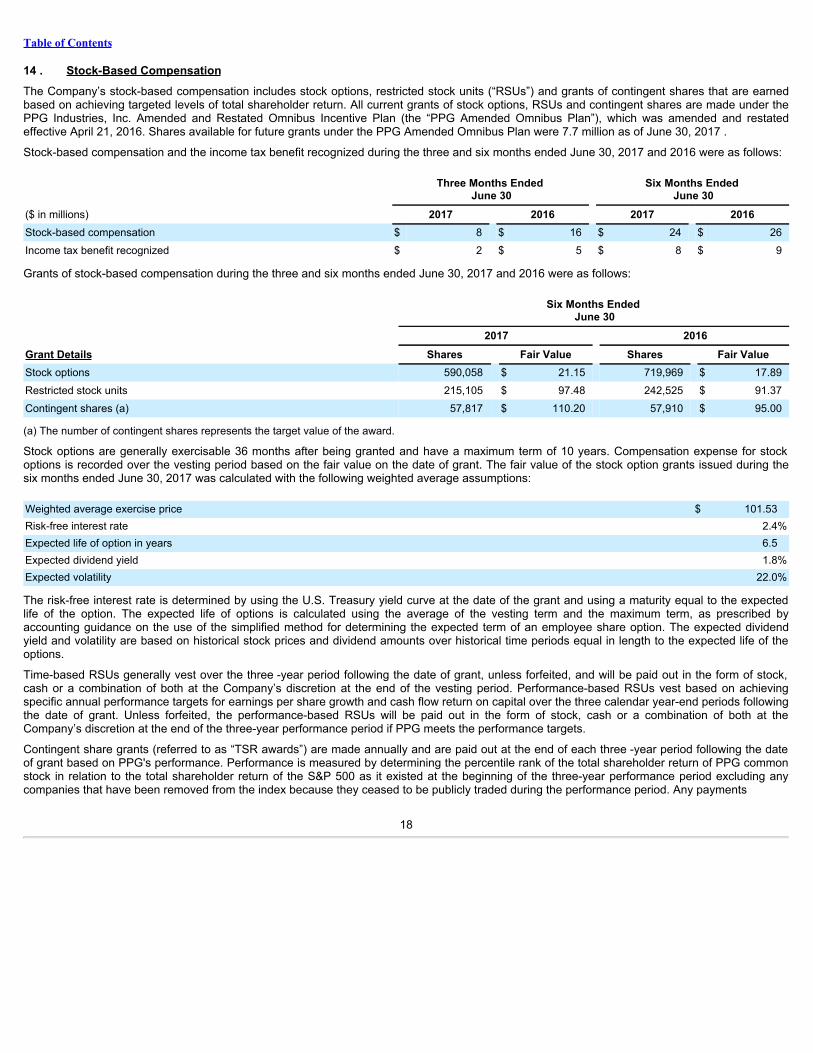
Table of Contents
14 . Stock-Based CompensationThe Company’s stock-based compensation includes stock options, restricted stock units (“RSUs”) and grants of contingent shares that are earnedbased on achieving targeted levels of total shareholder return. All current grants of stock options, RSUs and contingent shares are made under thePPG Industries, Inc. Amended and Restated Omnibus Incentive Plan (the “PPG Amended Omnibus Plan”), which was amended and restatedeffective April 21, 2016. Shares available for future grants under the PPG Amended Omnibus Plan were 7.7 million as of June 30, 2017 .
Stock-based compensation and the income tax benefit recognized during the three and six months ended June 30, 2017 and 2016 were as follows:
Three Months Ended
June 30 Six Months Ended
June 30($ in millions) 2017 2016 2017 2016Stock-based compensation $ 8 $ 16 $ 24 $ 26Income tax benefit recognized $ 2 $ 5 $ 8 $ 9
Grants of stock-based compensation during the three and six months ended June 30, 2017 and 2016 were as follows:
Six Months Ended
June 30 2017 2016Grant Details Shares Fair Value Shares Fair ValueStock options 590,058 $ 21.15 719,969 $ 17.89Restricted stock units 215,105 $ 97.48 242,525 $ 91.37Contingent shares (a) 57,817 $ 110.20 57,910 $ 95.00
(a) The number of contingent shares represents the target value of the award.
Stock options are generally exercisable 36 months after being granted and have a maximum term of 10 years. Compensation expense for stockoptions is recorded over the vesting period based on the fair value on the date of grant. The fair value of the stock option grants issued during thesix months ended June 30, 2017 was calculated with the following weighted average assumptions:
Weighted average exercise price $ 101.53Risk-free interest rate 2.4%Expected life of option in years 6.5Expected dividend yield 1.8%Expected volatility 22.0%
The risk-free interest rate is determined by using the U.S. Treasury yield curve at the date of the grant and using a maturity equal to the expectedlife of the option. The expected life of options is calculated using the average of the vesting term and the maximum term, as prescribed byaccounting guidance on the use of the simplified method for determining the expected term of an employee share option. The expected dividendyield and volatility are based on historical stock prices and dividend amounts over historical time periods equal in length to the expected life of theoptions.
Time-based RSUs generally vest over the three -year period following the date of grant, unless forfeited, and will be paid out in the form of stock,cash or a combination of both at the Company’s discretion at the end of the vesting period. Performance-based RSUs vest based on achievingspecific annual performance targets for earnings per share growth and cash flow return on capital over the three calendar year-end periods followingthe date of grant. Unless forfeited, the performance-based RSUs will be paid out in the form of stock, cash or a combination of both at theCompany’s discretion at the end of the three-year performance period if PPG meets the performance targets.
Contingent share grants (referred to as “TSR awards”) are made annually and are paid out at the end of each three -year period following the dateof grant based on PPG's performance. Performance is measured by determining the percentile rank of the total shareholder return of PPG commonstock in relation to the total shareholder return of the S&P 500 as it existed at the beginning of the three-year performance period excluding anycompanies that have been removed from the index because they ceased to be publicly traded during the performance period. Any payments
18

Table of Contents
made at the end of the award period may be in the form of stock, cash or a combination of both. The TSR awards qualify as liability awards, andcompensation expense is recognized over the three-year award period based on the fair value of the awards (giving consideration to the Company’spercentile rank of total shareholder return) remeasured in each reporting period until settlement of the awards.
15 . Commitments and Contingent LiabilitiesPPG is involved in a number of lawsuits and claims, both actual and potential, including some that it has asserted against others, in whichsubstantial monetary damages are sought. These lawsuits and claims may relate to contract, patent, environmental, product liability, asbestosexposure, antitrust, employment and other matters arising out of the conduct of PPG’s current and past business activities. To the extent that theselawsuits and claims involve personal injury and property damage, PPG believes it has adequate insurance; however, certain of PPG’s insurers arecontesting coverage with respect to some of these claims, and other insurers, as they had prior to the asbestos settlement described below, maycontest coverage in the future. PPG’s lawsuits and claims against others include claims against insurers and other third parties with respect to actualand contingent losses related to environmental, asbestos and other matters.
The results of any current or future litigation and claims are inherently unpredictable. However, management believes that, in the aggregate, theoutcome of all lawsuits and claims involving PPG, including asbestos-related claims, will not have a material effect on PPG’s consolidated financialposition or liquidity; however, such outcome may be material to the results of operations of any particular period in which costs, if any, arerecognized.
Asbestos MattersPrior to 2000, the Company had been named as a defendant in numerous claims alleging bodily injury from (i) exposure to asbestos-containingproducts allegedly manufactured, sold or distributed by the Company, its subsidiaries, or for which they are otherwise alleged to be liable; (ii)exposure to asbestos allegedly present at a facility owned or leased by the Company; or (iii) exposure to asbestos-containing products of PittsburghCorning Corporation (“PC”) for which the Company was alleged to be liable under a variety of legal theories (the Company and Corning Incorporatedwere each 50% shareholders in PC).
Pittsburgh Corning Corporation asbestos bankruptcy
In 2000, PC filed for Chapter 11 in the U.S. Bankruptcy Court for the Western District of Pennsylvania in an effort to permanently andcomprehensively resolve all of its pending and future asbestos-related liability claims. At the time of the bankruptcy filing, the Company had beennamed as one of many defendants in approximately 114,000 open claims. The Bankruptcy Court subsequently entered a series of orderspreliminarily enjoining the prosecution of asbestos litigation against PPG until after the effective date of a confirmed PC plan of reorganization.During the pendency of this preliminary injunction staying asbestos litigation against PPG, PPG and certain of its historical liability insurersnegotiated a settlement with representatives of present and future asbestos claimants. That settlement was incorporated into a PC plan ofreorganization that was confirmed by the Bankruptcy Court on May 24, 2013 and ultimately became effective on April 27, 2016. With theeffectiveness of the plan, the preliminary injunction staying the prosecution of asbestos litigation against PPG expired by its own terms on May 27,2016. In accordance with the settlement, the Bankruptcy Court issued a permanent channeling injunction under Section 524(g) of the BankruptcyCode that prohibits present and future claimants from asserting claims against PPG that arise, in whole or in part, out of exposure to asbestos orasbestos-containing products manufactured, sold and/or distributed by PC or asbestos on or emanating from any PC premises. The channelinginjunction, by its terms, also prohibits codefendants in cases that are subject to the channeling injunction from asserting claims against PPG forcontribution, indemnification or other recovery. The channeling injunction also precludes the prosecution of claims against PPG arising from allegedexposure to asbestos or asbestos-containing products to the extent that a claimant is alleging or seeking to impose liability, directly or indirectly, forthe conduct of, claims against, or demands on PC by reason of PPG’s: (i) ownership of a financial interest in PC; (ii) involvement in the managementof PC, or service as an officer, director or employee of PC or a related party; (iii) provision of insurance to PC or a related party; or (iv) involvementin a financial transaction affecting the financial condition of PC or a related party. The foregoing PC related claims are referred to as “PCRelationship Claims.”
The channeling injunction channels the Company’s liability for PC Relationship Claims to a trust funded in part by PPG and its participating insurersfor the benefit of current and future PC asbestos claimants (the “Trust”). The Trust is the sole recourse for holders of PC Relationship Claims. PPGand its affiliates have no further liability or responsibility for, and will be permanently protected from, pending and future PC Relationship Claims. Thechanneling injunction does not extend to present and future claims against PPG that arise out of alleged exposure to asbestos or asbestos-containing products historically manufactured, sold and/or distributed by PPG or its subsidiaries or for which they are alleged to be liable that are notPC Relationship Claims, and does not extend to claims against PPG alleging personal
19
Table of Contents
injury allegedly caused by asbestos on premises presently or formerly owned, leased or occupied by PPG. These claims are referred to as non-PCRelationship Claims.
In accordance with the PC plan of reorganization, PPG's equity interest in PC was canceled. PPG satisfied its funding obligations to the Trust onJune 9, 2016, when it conveyed to the Trust the stock it owned in Pittsburgh Corning Europe and 2,777,778 shares of PPG’s common stock andmade a cash payment to the Trust in the amount of $764 million . PPG’s historical insurance carriers participating in the PC plan of reorganizationare required to make cash payments to the Trust of approximately $1.7 billion , subject to a right of prepayment at a 5.5% discount rate.
On October 13, 2016, the Bankruptcy Court issued an order entering a final decree and closing the Chapter 11 case. That order provided that theBankruptcy Court retained jurisdiction to enforce any order issued in the case and any agreements approved by the court, enforce the terms andconditions of the modified third amended Plan, and consider any requests to reopen the case.
Non-PC relationship asbestos claims
At the time PC filed for bankruptcy, PPG had been named as one of many defendants in one or more of the categories of asbestos-related claimsidentified above. Over the course of the 16 years during which the PC bankruptcy proceedings, and corresponding preliminary injunction staying theprosecution of asbestos-related claims against PPG, were pending, certain plaintiffs alleging premises claims filed motions seeking to lift the staywith respect to more than 1,000 individually-identified premises claims. The Bankruptcy Court granted motions to lift the stay in respect to certain ofthese premises claims and directed PPG to engage in a process to address any additional premises claims that were the subject of pending oranticipated lift-stay motions. As a result of the overall process as directed by the Bankruptcy Court involving more than 1,000 premises claimsbetween 2006 and May 27, 2016, hundreds of these claims were withdrawn or dismissed without payment and approximately 650 premises claimswere dismissed upon agreements by PPG and its insurers to resolve such claims in exchange for monetary payments.
With respect to the remaining claims still reportable within the inventory of 114,000 asbestos-related claims at the time PC filed for bankruptcy, theCompany considers such claims to fall within one or more of the following categories: (1) claims that have been closed or dismissed as a result ofprocesses undertaken during the bankruptcy; (2) claims that may have been previously filed on the dockets of state and federal courts in variousjurisdictions, but are inactive as to the Company; and (3) claims that are subject, in whole or in part, to the channeling injunction and thus will beresolved, in whole or in part, in accordance with the Trust procedures established under the PC bankruptcy reorganization plan. As a result of theforegoing, the Company does not consider these three categories of claims to be open or active litigation against it, although the Company cannotnow determine whether, or the extent to which, any of these claims may in the future be reinstituted, reinstated, or revived such that they maybecome open and active asbestos-related claims against it.
Current open and active claims post-Pittsburgh Corning bankruptcy
As of June 30, 2017, the Company is aware of approximately 650 open and active asbestos-related claims pending against the Company andcertain of its subsidiaries. These claims consist primarily of non-PC Relationship Claims and claims against a subsidiary of PPG. The Company isdefending the remaining open and active claims vigorously.
Since April 1, 2013, a subsidiary of PPG has been implicated in claims alleging death or injury caused by asbestos-containing productsmanufactured, distributed or sold by a North American architectural coatings business or its predecessors which was acquired by PPG. All suchclaims have been either served upon or tendered to the seller for defense and indemnity pursuant to obligations undertaken by the seller inconnection with the Company’s purchase of the North American architectural coatings business. The seller has accepted the defense of theseclaims subject to the terms of various agreements between the Company and the seller. The seller’s defense and indemnity obligations inconnection with newly filed claims will cease with respect to claims filed after April 1, 2018.
PPG has established reserves totaling approximately $180 million for asbestos-related claims that would not be channeled to the Trust which, basedon presently available information, we believe will be sufficient to encompass all of PPG’s current and potential future asbestos liabilities. Thesereserves include a $162 million reserve established in 2009 in connection with an amendment to the PC plan of reorganization. These reserves,which are included within "Other liabilities" on the accompanying consolidated balance sheets, represent PPG’s best estimate of its liability for theseclaims. PPG does not have sufficient current claim information or settlement history on which to base a better estimate of this liability in light of thefact that the Bankruptcy Court’s injunction staying most asbestos claims against the Company was in effect from April 2000 through May 2016. PPGwill monitor the activity associated with its remaining asbestos claims and evaluate, on a periodic basis, its estimated liability for such claims, itsinsurance assets then available, and all underlying assumptions to determine whether any adjustment to the reserves for these claims is required.
20
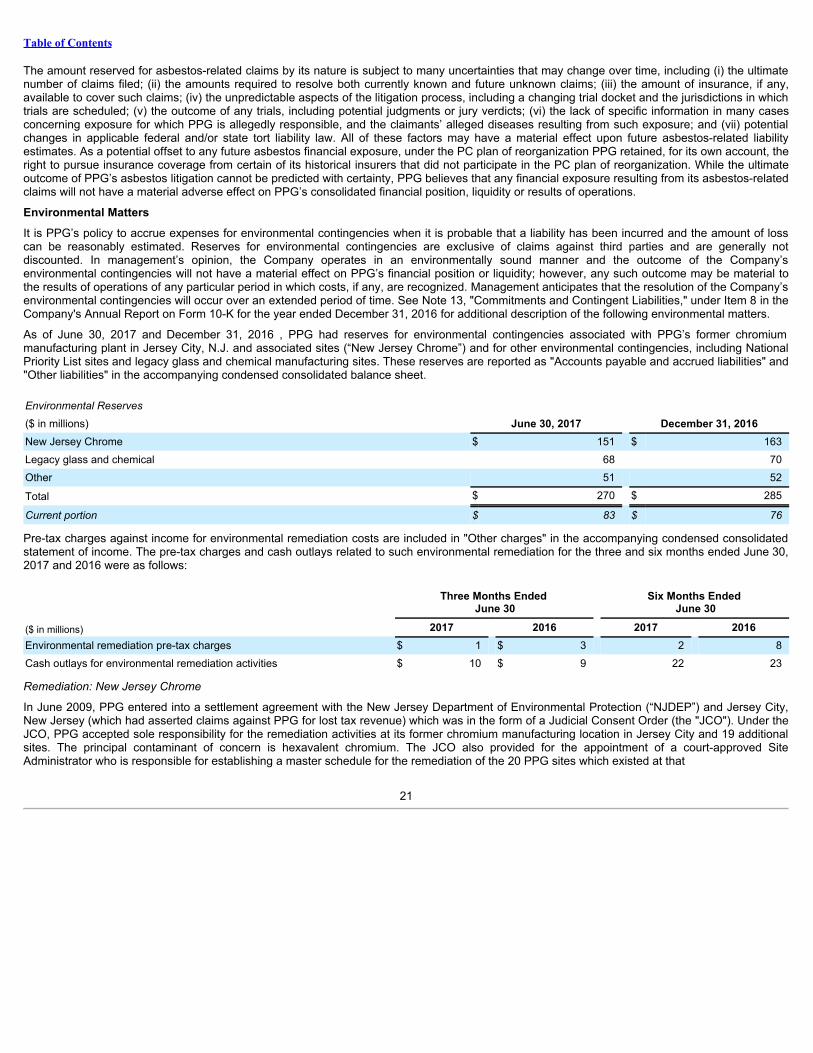
Table of Contents
The amount reserved for asbestos-related claims by its nature is subject to many uncertainties that may change over time, including (i) the ultimatenumber of claims filed; (ii) the amounts required to resolve both currently known and future unknown claims; (iii) the amount of insurance, if any,available to cover such claims; (iv) the unpredictable aspects of the litigation process, including a changing trial docket and the jurisdictions in whichtrials are scheduled; (v) the outcome of any trials, including potential judgments or jury verdicts; (vi) the lack of specific information in many casesconcerning exposure for which PPG is allegedly responsible, and the claimants’ alleged diseases resulting from such exposure; and (vii) potentialchanges in applicable federal and/or state tort liability law. All of these factors may have a material effect upon future asbestos-related liabilityestimates. As a potential offset to any future asbestos financial exposure, under the PC plan of reorganization PPG retained, for its own account, theright to pursue insurance coverage from certain of its historical insurers that did not participate in the PC plan of reorganization. While the ultimateoutcome of PPG’s asbestos litigation cannot be predicted with certainty, PPG believes that any financial exposure resulting from its asbestos-relatedclaims will not have a material adverse effect on PPG’s consolidated financial position, liquidity or results of operations.
Environmental MattersIt is PPG’s policy to accrue expenses for environmental contingencies when it is probable that a liability has been incurred and the amount of losscan be reasonably estimated. Reserves for environmental contingencies are exclusive of claims against third parties and are generally notdiscounted. In management’s opinion, the Company operates in an environmentally sound manner and the outcome of the Company’senvironmental contingencies will not have a material effect on PPG’s financial position or liquidity; however, any such outcome may be material tothe results of operations of any particular period in which costs, if any, are recognized. Management anticipates that the resolution of the Company’senvironmental contingencies will occur over an extended period of time. See Note 13, "Commitments and Contingent Liabilities," under Item 8 in theCompany's Annual Report on Form 10-K for the year ended December 31, 2016 for additional description of the following environmental matters.
As of June 30, 2017 and December 31, 2016 , PPG had reserves for environmental contingencies associated with PPG’s former chromiummanufacturing plant in Jersey City, N.J. and associated sites (“New Jersey Chrome”) and for other environmental contingencies, including NationalPriority List sites and legacy glass and chemical manufacturing sites. These reserves are reported as "Accounts payable and accrued liabilities" and"Other liabilities" in the accompanying condensed consolidated balance sheet.
Environmental Reserves
($ in millions) June 30, 2017 December 31, 2016New Jersey Chrome $ 151 $ 163Legacy glass and chemical 68 70Other 51 52
Total $ 270 $ 285
Current portion $ 83 $ 76
Pre-tax charges against income for environmental remediation costs are included in "Other charges" in the accompanying condensed consolidatedstatement of income. The pre-tax charges and cash outlays related to such environmental remediation for the three and six months ended June 30,2017 and 2016 were as follows:
Three Months Ended
June 30 Six Months Ended
June 30
($ in millions) 2017 2016 2017 2016Environmental remediation pre-tax charges $ 1 $ 3 2 8Cash outlays for environmental remediation activities $ 10 $ 9 22 23
Remediation: New Jersey Chrome
In June 2009, PPG entered into a settlement agreement with the New Jersey Department of Environmental Protection (“NJDEP”) and Jersey City,New Jersey (which had asserted claims against PPG for lost tax revenue) which was in the form of a Judicial Consent Order (the "JCO"). Under theJCO, PPG accepted sole responsibility for the remediation activities at its former chromium manufacturing location in Jersey City and 19 additionalsites. The principal contaminant of concern is hexavalent chromium. The JCO also provided for the appointment of a court-approved SiteAdministrator who is responsible for establishing a master schedule for the remediation of the 20 PPG sites which existed at that
21

Table of Contents
time. One site was subsequently removed from the JCO process during 2014 and will be remediated separately at a future date. A total of 19 sitesremain subject to the JCO process.
The most significant assumptions underlying the estimate of remediation costs for all New Jersey Chrome sites are those related to the extent andconcentration of chromium impacts in the soil, as these determine the quantity of soil that must be treated in place, the quantity that will have to beexcavated and transported for offsite disposal, and the nature of disposal required. The reserve for the estimated costs to remediate all New JerseyChrome sites are exclusive of any third party indemnification, as the recovery of any such amounts is uncertain.
Groundwater remediation at PPG's former chromium manufacturing site in Jersey City and five adjacent sites is expected to occur over severalyears after NJDEP's approval of a work plan. Ongoing groundwater monitoring will be utilized to develop a final groundwater remedial action workplan which is currently expected to be submitted to NJDEP no later than 2020.
PPG’s financial reserve for remediation of all New Jersey Chrome sites is $151 million at June 30, 2017 . The major cost components of this liabilitycontinue to be related to excavation, transportation and disposal of impacted soil, as well as construction services. These components each accountfor approximately 30% , 29% and 27% of the accrued amount, respectively.
There are multiple, future events yet to occur, including further remedy selection and design, remedy implementation and execution and applicablegovernmental agency or community organization approvals. Considerable uncertainty exists regarding the timing of these future events for the NewJersey Chrome sites. Final resolution of these events is expected to occur over the next several years. As these events occur and to the extent thatthe cost estimates of the environmental remediation remedies change, the existing reserve for this environmental remediation matter will beadjusted.
Remediation: Other Legacy Sites
Among other sites at which PPG is managing environmental liabilities, remedial actions are occurring at a legacy chemical manufacturing site inBarberton, Ohio, where PPG has completed a Facility Investigation and Corrective Measure Study under USEPA’s Resource Conservation andRecovery Act (“RCRA”) Corrective Action Program. PPG has also been addressing the impacts from a legacy plate glass manufacturing site inKokomo, Indiana under the Voluntary Remediation Program of the Indiana Department of Environmental Management. PPG is currently performingadditional investigation activities at this location. With respect to certain waste sites, the financial condition of other potentially responsible partiesalso contributes to the uncertainty of estimating PPG’s final costs. Although contributors of waste to sites involving other potentially responsibleparties may face governmental agency assertions of joint and several liability, in general, final allocations of costs are made based on the relativecontributions of wastes to such sites. PPG is generally not a major contributor to such sites.
Remediation: Reasonably Possible Matters
In addition to the amounts currently reserved for environmental remediation, the Company may be subject to loss contingencies related toenvironmental matters estimated to be as much as $100 million to $200 million . Such unreserved losses are reasonably possible but are notcurrently considered to be probable of occurrence. These reasonably possible unreserved losses relate to environmental matters at a number ofsites, none of which are individually significant. The loss contingencies related to these sites include significant unresolved issues such as the natureand extent of contamination at these sites and the methods that may have to be employed to remediate them.
The impact of evolving programs, such as natural resource damage claims, industrial site re-use initiatives and domestic and internationalremediation programs, also adds to the present uncertainties with regard to the ultimate resolution of this unreserved exposure to future loss. TheCompany’s assessment of the potential impact of these environmental contingencies is subject to considerable uncertainty due to the complex,ongoing and evolving process of investigation and remediation, if necessary, of such environmental contingencies, and the potential fortechnological and regulatory developments.
Other MattersThe Company had outstanding letters of credit and surety bonds of $177 million and guarantees of $12 million as of June 30, 2017 . The Companydoes not believe any loss related to such guarantees is likely.
22
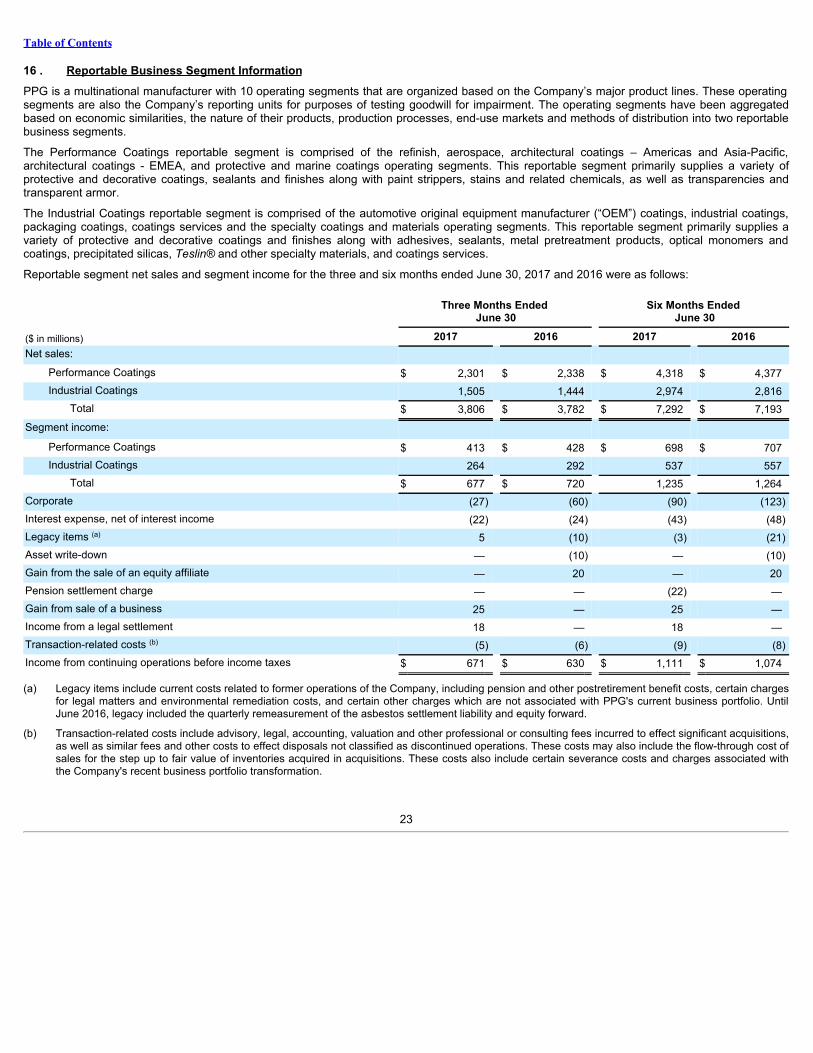
Table of Contents
16 . Reportable Business Segment InformationPPG is a multinational manufacturer with 10 operating segments that are organized based on the Company’s major product lines. These operatingsegments are also the Company’s reporting units for purposes of testing goodwill for impairment. The operating segments have been aggregatedbased on economic similarities, the nature of their products, production processes, end-use markets and methods of distribution into two reportablebusiness segments.
The Performance Coatings reportable segment is comprised of the refinish, aerospace, architectural coatings – Americas and Asia-Pacific,architectural coatings - EMEA, and protective and marine coatings operating segments. This reportable segment primarily supplies a variety ofprotective and decorative coatings, sealants and finishes along with paint strippers, stains and related chemicals, as well as transparencies andtransparent armor.
The Industrial Coatings reportable segment is comprised of the automotive original equipment manufacturer (“OEM”) coatings, industrial coatings,packaging coatings, coatings services and the specialty coatings and materials operating segments. This reportable segment primarily supplies avariety of protective and decorative coatings and finishes along with adhesives, sealants, metal pretreatment products, optical monomers andcoatings, precipitated silicas, Teslin® and other specialty materials, and coatings services.
Reportable segment net sales and segment income for the three and six months ended June 30, 2017 and 2016 were as follows:
Three Months Ended
June 30 Six Months Ended
June 30
($ in millions) 2017 2016 2017 2016Net sales:
Performance Coatings $ 2,301 $ 2,338 $ 4,318 $ 4,377Industrial Coatings 1,505 1,444 2,974 2,816
Total $ 3,806 $ 3,782 $ 7,292 $ 7,193Segment income:
Performance Coatings $ 413 $ 428 $ 698 $ 707Industrial Coatings 264 292 537 557
Total $ 677 $ 720 1,235 1,264Corporate (27) (60) (90) (123)Interest expense, net of interest income (22) (24) (43) (48)Legacy items (a) 5 (10) (3) (21)Asset write-down — (10) — (10)Gain from the sale of an equity affiliate — 20 — 20Pension settlement charge — — (22) —Gain from sale of a business 25 — 25 —Income from a legal settlement 18 — 18 —Transaction-related costs (b) (5) (6) (9) (8)Income from continuing operations before income taxes $ 671 $ 630 $ 1,111 $ 1,074
(a) Legacy items include current costs related to former operations of the Company, including pension and other postretirement benefit costs, certain chargesfor legal matters and environmental remediation costs, and certain other charges which are not associated with PPG's current business portfolio. UntilJune 2016, legacy included the quarterly remeasurement of the asbestos settlement liability and equity forward.
(b) Transaction-related costs include advisory, legal, accounting, valuation and other professional or consulting fees incurred to effect significant acquisitions,as well as similar fees and other costs to effect disposals not classified as discontinued operations. These costs may also include the flow-through cost ofsales for the step up to fair value of inventories acquired in acquisitions. These costs also include certain severance costs and charges associated withthe Company's recent business portfolio transformation.
23
Table of Contents
Item 2. Management’s Discussion and Analysis of Financial Condition and Results of Operations
Executive Overview
Below are our key financial results for the three months ended June 30, 2017 :
• Net sales were $3.8 billion , up nearly 1% compared to the prior year, despite unfavorable foreign currency translation of approximately $65million.
• Cost of sales, exclusive of depreciation and amortization was nearly $2.1 billion , up 4.7% versus prior year.
• Selling, general and administrative ("SG&A") expense was $0.9 billion , down 7.0% . As a percentage of sales, SG&A decreased 1.9% .
• Income before income taxes was $671 million .
• The effective tax rate was 24.1% .
• Net income from continuing operations was $504 million .
• Earnings per diluted share from continuing operations was $1.95 .
For the six months ended June 30, 2017, Cash flows from operating activities - continuing operations was $434 million , an increase of $513 millionyear over year, due largely to the absence of the prior year funding of the Pittsburgh Corning asbestos trust.
Capital expenditures, including acquisitions (net of cash acquired), was $197 million for the six months ended June 30, 2017. In addition, PPG spent$100 million during the three and six months ended June 30, 2017 to acquire a 40% ownership interest in TCI.
During the six months ended June 30, 2017, the Company paid $205 million in dividends and also repurchased $163 million of its outstandingcommon stock.
24

Table of Contents
Performance in the second quarter of 2017 compared to the second quarter of 2016
Performance Overview
Net Sales
Three Months Ended
June 30 Percent Change($ in millions, except percentages) 2017 2016 2017 vs. 2016United States and Canada $ 1,683 $ 1,686 (0.2)%Europe, Middle East and Africa (EMEA) 1,152 1,153 (0.1)%Asia-Pacific 608 599 1.5 %Latin America 363 344 5.5 %
Total $ 3,806 $ 3,782 0.6 %
2017 vs. 2016Net sales increased $24 million due to the following:
● Net sales from acquired businesses (+2%)Partially offset by:
● Unfavorable foreign currency translation (-2%)Selling prices were up slightly, while sales volumes were flat year over year.In the United States and Canada, sales volumes were down slightly versus the prior year, including the effects from the macro regional impacts oflower automotive industry production along with fewer selling days due to the timing of the Easter holiday. Strong, above market performancecontinued in general industrial coatings due to customer adoption of key PPG technologies coupled with above regional market growth inaerospace and automotive refinish. PPG volumes were below market demand in automotive original equipment manufacturer (OEM) coatings,although the Company outperformed industry production rates on a global basis. PPG sales volumes were also below market demand levels inarchitectural coatings, including the unfavorable effects from the Company's channel mix where the national accounts (DIY) and independent dealerchannels are not currently achieving the same growth trajectory as the professional/trade channel.Overall sales volumes were flat in the Europe, Middle East and Africa (EMEA) region versus the prior year, primarily due to the unfavorable impactfrom the timing of the Easter holiday. The automotive OEM, aerospace and protective coatings businesses all delivered volume growth aboveprojected market demand in the region. Packaging coatings volumes were below market, primarily due to a difficult prior year comparison when thebusiness grew volumes by a high single-digit percentage based on customer adoption of new technologies.Asia-Pacific sales volumes expanded by a mid-single-digit percentage year-over-year led by continued strong performance in automotive OEM andgeneral industrial coatings along with solid growth in architectural coatings, partly offset by industry-related declines in marine coatings demand.From a country and sub-region perspective, sales volumes grew in India, China, and Southeast Asia versus the prior year. Korea continued todecline year-over-year primarily due to continued weakness in new shipbuilding.Latin America sales volumes expanded by a low-single-digit percentage versus the prior year primarily due to above-market growth in ourautomotive OEM and general industrial coatings businesses, partially offset by declines in automotive refinish.Net sales from acquired businesses, net of dispositions added approximately $90 million in the second quarter of 2017, primarily MetoKote,supplemented by several other acquisitions.Foreign currency translation reduced net sales by about $65 million as the U.S. dollar strengthened against most foreign currencies versus the prioryear, most notably the Mexican peso, British pound and the euro.
25

Table of Contents
Cost of Sales, exclusive of depreciation and amortization
Three Months Ended
June 30 Percent Change
($ in millions, except percentages) 2017 2016 2017 vs. 2016Cost of sales, exclusive of depreciation and amortization $ 2,082 $ 1,988 4.7%
Cost of sales as a percentage of net sales 54.7% 52.6% 2.1%
2017 vs. 2016Cost of sales, exclusive of depreciation and amortization, increased $94 million (+4.7%) primarily due to the following:
● Increasing raw material costs● Cost of sales attributable to acquired businesses
Partially offset by:● Foreign currency translation● Lower manufacturing costs
Selling, general and administrative expenses
Three Months Ended
June 30 Percent Change($ in millions, except percentages) 2017 2016 2017 vs. 2016Selling, general and administrative expenses (SG&A) $ 865 $ 930 (7.0)%
Selling, general and administrative expenses as a percentage of net sales 22.7% 24.6% (1.9)%
2017 vs. 2016SG&A decreased $65 million (-7.0%) primarily due to the following:
● Lower selling and advertising expense● Lower incentive compensation expense● Foreign currency translation● Lower net periodic other postretirement benefit costs● Restructuring cost savings
Partially offset by:● Wage and other cost inflation● SG&A expenses attributable to acquired businesses
Other costs and income
Three Months Ended
June 30 Percent Change($ in millions, except percentages) 2017 2016 2017 vs. 2016Interest expense, net of Interest income $ 22 $ 24 (8.3)%Asbestos settlement, net $ — $ 2 (100.0)%Other charges $ 12 $ 29 (58.6)%Other income $ (72) $ (45) 60.0 %
Other charges
Other charges decreased $17 million from the prior year, primarily due to the absence of a prior year asset impairment charge of $10 million.
Other income
Other income increased $27 million from the prior year primarily due to a second quarter 2017 gain on the sale of the Plaka business and incomefrom a legal settlement, partially offset by the absence of a prior year gain on the sale of an investment in an equity affiliate.
26
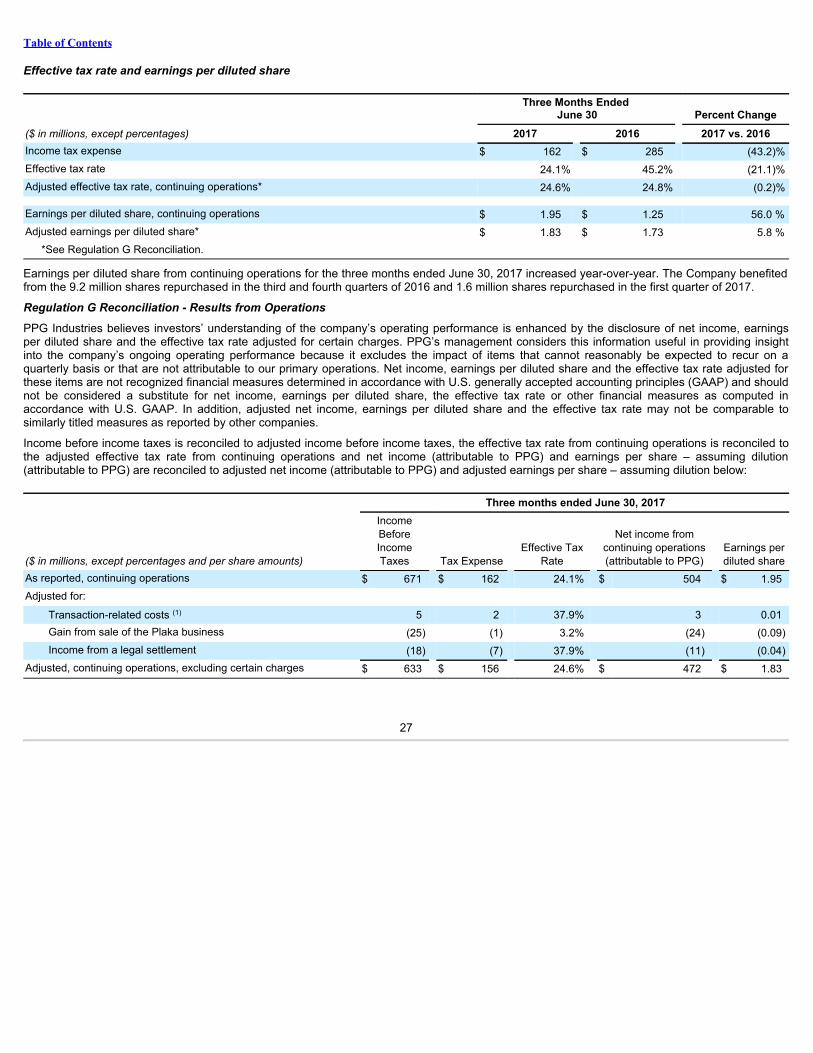
Table of Contents
Effective tax rate and earnings per diluted share
Three Months Ended
June 30 Percent Change($ in millions, except percentages) 2017 2016 2017 vs. 2016Income tax expense $ 162 $ 285 (43.2)%Effective tax rate 24.1% 45.2% (21.1)%Adjusted effective tax rate, continuing operations* 24.6% 24.8% (0.2)% Earnings per diluted share, continuing operations $ 1.95 $ 1.25 56.0 %Adjusted earnings per diluted share* $ 1.83 $ 1.73 5.8 %
*See Regulation G Reconciliation.
Earnings per diluted share from continuing operations for the three months ended June 30, 2017 increased year-over-year. The Company benefitedfrom the 9.2 million shares repurchased in the third and fourth quarters of 2016 and 1.6 million shares repurchased in the first quarter of 2017.
Regulation G Reconciliation - Results from Operations
PPG Industries believes investors’ understanding of the company’s operating performance is enhanced by the disclosure of net income, earningsper diluted share and the effective tax rate adjusted for certain charges. PPG’s management considers this information useful in providing insightinto the company’s ongoing operating performance because it excludes the impact of items that cannot reasonably be expected to recur on aquarterly basis or that are not attributable to our primary operations. Net income, earnings per diluted share and the effective tax rate adjusted forthese items are not recognized financial measures determined in accordance with U.S. generally accepted accounting principles (GAAP) and shouldnot be considered a substitute for net income, earnings per diluted share, the effective tax rate or other financial measures as computed inaccordance with U.S. GAAP. In addition, adjusted net income, earnings per diluted share and the effective tax rate may not be comparable tosimilarly titled measures as reported by other companies.
Income before income taxes is reconciled to adjusted income before income taxes, the effective tax rate from continuing operations is reconciled tothe adjusted effective tax rate from continuing operations and net income (attributable to PPG) and earnings per share – assuming dilution(attributable to PPG) are reconciled to adjusted net income (attributable to PPG) and adjusted earnings per share – assuming dilution below:
Three months ended June 30, 2017
($ in millions, except percentages and per share amounts)
IncomeBeforeIncomeTaxes Tax Expense
Effective TaxRate
Net income fromcontinuing operations(attributable to PPG)
Earnings perdiluted share
As reported, continuing operations $ 671 $ 162 24.1% $ 504 $ 1.95Adjusted for:
Transaction-related costs (1) 5 2 37.9% 3 0.01Gain from sale of the Plaka business (25) (1) 3.2% (24) (0.09)Income from a legal settlement (18) (7) 37.9% (11) (0.04)
Adjusted, continuing operations, excluding certain charges $ 633 $ 156 24.6% $ 472 $ 1.83
27

Table of Contents
Three months ended June 30, 2016
($ in millions, except percentages and per share amounts)
IncomeBeforeIncomeTaxes Tax Expense
Effective TaxRate
Net income fromcontinuing operations(attributable to PPG)
Earnings perdiluted share
As reported, continuing operations $ 630 $ 285 45.2% $ 339 $ 1.25Adjusted for:
Gain on the sale of an investment in an equity affiliate (20) (7) 37.6% (13) (0.05)
Transaction-related costs (1) 6 2 37.6% 4 0.02Net tax effect of asbestos settlement funding — (128) N/A 128 0.48Asset write-down 10 3 25.0% 8 0.03
Adjusted, continuing operations, excluding certain charges $ 626 $ 155 24.8% $ 466 $ 1.73
(1) Transaction-related costs include advisory, legal, accounting, valuation, and other professional or consulting fees incurred to effect significant acquisitions, as well as similarfees and other costs to effect disposals not classified as discontinued operations. These costs also include certain charges associated with the Company’s business portfoliotransformation.
Performance of Reportable Business Segments
Performance Coatings
Three Months Ended
June 30 $ Change % Change($ in millions, except per share amounts) 2017 2016 2017 vs. 2016 2017 vs. 2016Net sales $ 2,301 $ 2,338 $ (37) (1.6)%Segment income $ 413 $ 428 $ (15) (3.5)%
2017 vs. 2016Performance Coatings net sales decreased $37 million (-1.6%) due to the following:
● Unfavorable foreign currency translation of approximately $40 million (-1.6%)● Lower sales volumes (-2%)
Partially offset by:● Higher selling prices (+1%)● Net sales from acquisitions (+1%)
Architectural coatings - EMEA sales volumes decreased by a low-single-digit percentage year-over-year primarily due to fewer selling days versusthe prior year quarter. However, average daily sales per available selling day improved by a low-single-digit percentage in the quarter versus lastyear. In addition, selling prices improved based on various pricing initiatives implemented during the quarter.Architectural coatings - Americas and Asia-Pacific sales volumes declined by a low-single-digit percentage versus the prior year, including effectsfrom fewer selling days in the quarter versus the prior year. In the U.S. and Canada, we implemented initial selling price actions. Sales volumesincreased by a mid-single-digit percentage in U.S. company-owned stores aided by higher professional/trade painting demand and marking the 6thconsecutive quarterly improvement versus prior year. These gains were offset by volume declines in the U.S. and Canada independent dealernetwork and mixed volume results in national retail (DIY) accounts, as both of these distribution channels continue to experience sluggish demand.Organic sales improved in both the Latin America and Asia-Pacific regions.Protective and marine coatings sales volumes declined year-over-year with low-double-digit-percentage declines in marine coatings, partially offsetby modest protective coatings sales volumes expansion.Aerospace coatings sales volumes grew by a low-single-digit percentage versus the prior year. This growth is due to higher customer use of keyPPG technologies and the absence of customer inventory management, which negatively impacted several previous sequential quarters.Automotive refinish coatings organic sales grew by a low-single-digit percentage year-over-year, led by above-market performance in U.S. andCanada and solid performance in the EMEA region. In Asia, net sales were aided by the recent Futian Xinshi acquisition in China.Segment income decreased $15 million (-3.5%) year-over-year primarily due to significant increases in raw material costs, wage and other costinflation, lower sales volumes, and unfavorable foreign currency translation, which reduced segment income by approximately $10 million (Mexicanpeso, British pound and the euro). These cost increases were partially offset by disciplined cost management actions, including further benefitsfrom the Company's 2016 restructuring program, as well as the impact on segment income of initial selling price actions.
28
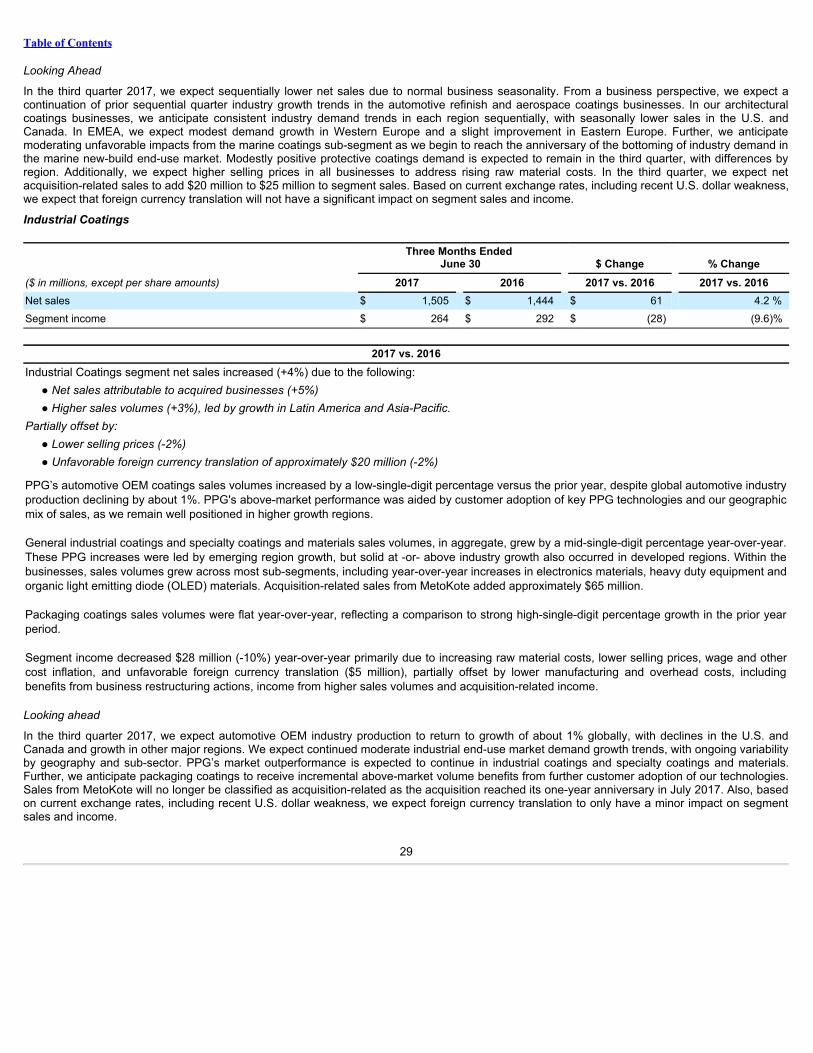
Table of Contents
Looking Ahead
In the third quarter 2017, we expect sequentially lower net sales due to normal business seasonality. From a business perspective, we expect acontinuation of prior sequential quarter industry growth trends in the automotive refinish and aerospace coatings businesses. In our architecturalcoatings businesses, we anticipate consistent industry demand trends in each region sequentially, with seasonally lower sales in the U.S. andCanada. In EMEA, we expect modest demand growth in Western Europe and a slight improvement in Eastern Europe. Further, we anticipatemoderating unfavorable impacts from the marine coatings sub-segment as we begin to reach the anniversary of the bottoming of industry demand inthe marine new-build end-use market. Modestly positive protective coatings demand is expected to remain in the third quarter, with differences byregion. Additionally, we expect higher selling prices in all businesses to address rising raw material costs. In the third quarter, we expect netacquisition-related sales to add $20 million to $25 million to segment sales. Based on current exchange rates, including recent U.S. dollar weakness,we expect that foreign currency translation will not have a significant impact on segment sales and income.
Industrial Coatings
Three Months Ended
June 30 $ Change % Change($ in millions, except per share amounts) 2017 2016 2017 vs. 2016 2017 vs. 2016Net sales $ 1,505 $ 1,444 $ 61 4.2 %Segment income $ 264 $ 292 $ (28) (9.6)%
2017 vs. 2016Industrial Coatings segment net sales increased (+4%) due to the following:
● Net sales attributable to acquired businesses (+5%)● Higher sales volumes (+3%), led by growth in Latin America and Asia-Pacific.
Partially offset by:● Lower selling prices (-2%)● Unfavorable foreign currency translation of approximately $20 million (-2%)
PPG’s automotive OEM coatings sales volumes increased by a low-single-digit percentage versus the prior year, despite global automotive industryproduction declining by about 1%. PPG's above-market performance was aided by customer adoption of key PPG technologies and our geographicmix of sales, as we remain well positioned in higher growth regions.
General industrial coatings and specialty coatings and materials sales volumes, in aggregate, grew by a mid-single-digit percentage year-over-year.These PPG increases were led by emerging region growth, but solid at -or- above industry growth also occurred in developed regions. Within thebusinesses, sales volumes grew across most sub-segments, including year-over-year increases in electronics materials, heavy duty equipment andorganic light emitting diode (OLED) materials. Acquisition-related sales from MetoKote added approximately $65 million.
Packaging coatings sales volumes were flat year-over-year, reflecting a comparison to strong high-single-digit percentage growth in the prior yearperiod.
Segment income decreased $28 million (-10%) year-over-year primarily due to increasing raw material costs, lower selling prices, wage and othercost inflation, and unfavorable foreign currency translation ($5 million), partially offset by lower manufacturing and overhead costs, includingbenefits from business restructuring actions, income from higher sales volumes and acquisition-related income.
Looking ahead
In the third quarter 2017, we expect automotive OEM industry production to return to growth of about 1% globally, with declines in the U.S. andCanada and growth in other major regions. We expect continued moderate industrial end-use market demand growth trends, with ongoing variabilityby geography and sub-sector. PPG’s market outperformance is expected to continue in industrial coatings and specialty coatings and materials.Further, we anticipate packaging coatings to receive incremental above-market volume benefits from further customer adoption of our technologies.Sales from MetoKote will no longer be classified as acquisition-related as the acquisition reached its one-year anniversary in July 2017. Also, basedon current exchange rates, including recent U.S. dollar weakness, we expect foreign currency translation to only have a minor impact on segmentsales and income.
29

Table of Contents
Performance in the first six months of 2017 compared to the first six months of 2016
Performance Overview
Net Sales
Six Months Ended
June 30 Percent Change($ in millions, except percentages) 2017 2016 2017 vs. 2016United States and Canada $ 3,226 $ 3,197 0.9%EMEA 2,175 2,167 0.4%Asia-Pacific 1,191 1,169 1.9%Latin America 700 660 6.1%
Total $ 7,292 $ 7,193 1.4%
2017 vs. 2016Net sales increased $99 million due to the following:
● Net sales from acquired businesses (+2%)● Higher sales volumes (+1%)
Partially offset by:● Unfavorable foreign currency translation (-2%)
In the United States and Canada, sales volumes declined a low-single-digit percentage year-over-year, with demand mixed by end-use marketsegment. Automotive refinish and packaging coatings expanded sales volumes, as customers continued to adopt PPG’s innovative and sustainablenew products. Aerospace and protective coatings experienced year-over-year sales volume growth. Sales volumes in the general industrialcoatings business improved year-over-year, as growth in general finish coatings helped to offset modest declines in the automotive parts sub-segment related to lower automotive industry production in the region. In architectural coatings, increased volume growth in the company-ownedstores channel was more than offset by lower independent dealer and national retail account demand. Sales volumes declined in automotive OEMcoatings, in large-part due to lower industry production.EMEA sales volumes increased modestly versus the prior year. Our automotive OEM and aerospace coatings businesses experienced year-over-year sales volume growth. Automotive refinish and protective coatings organic sales increased a low-single-digit percentage. Sales volumesdeclined slightly in architectural coatings as increased demand in Western Europe was offset by declines in Eastern Europe. Sales volumesdeclined in general industrial coatings primarily due to strong above-market growth in the prior year.Asia-Pacific sales volumes expanded by a mid-single-digit percentage year-over-year led by growth in each business within the Industrial Coatingssegment, along with sales volume growth in the architectural coatings business. From a country and sub-region perspective, sales volumes grew inIndia, China, and Southeast Asia versus the prior year. Korea continued to decline year-over-year primarily due to continued weakness in newshipbuilding.Latin America sales volumes expanded by a mid-single-digit percentage versus the prior year primarily due to above market growth in ourautomotive OEM and general industrial coatings businesses. Automotive industry production expanded significantly in the region year-over-year,primarily due to the opening of new assembly facilities in Mexico. Regional sales volumes were lower in architectural coatings versus the prior yeardriven by Brazil.Net sales from acquired businesses, net of dispositions added approximately $160 million in the first half of 2017, primarily MetoKote,supplemented by several other acquisitions.Foreign currency translation reduced net sales by about $125 million as the U.S. dollar strengthened against most foreign currencies versus theprior year, most notably the Mexican peso, British pound and the euro.
30

Table of Contents
Cost of Sales, exclusive of depreciation and amortization
Six Months Ended
June 30 Percent Change($ in millions, except percentages) 2017 2016 2017 vs. 2016Cost of sales, exclusive of depreciation and amortization $ 3,987 $ 3,805 4.8%
Cost of sales as a percentage of net sales 54.7% 52.9% 1.8%
2017 vs. 2016Cost of sales, exclusive of depreciation and amortization, increased $182 million (+4.8%) primarily due to the following:
● Increasing raw material costs● Higher sales volumes● Cost of sales attributable to acquired businesses
Partially offset by:● Foreign currency translation● Lower manufacturing costs
Selling, general and administrative expenses
Six Months Ended
June 30 Percent Change($ in millions, except percentages) 2017 2016 2017 vs. 2016Selling, general and administrative expenses (SG&A) $ 1,753 $ 1,827 (4.1)%
Selling, general and administrative expenses as a percentage of net sales 24.0% 25.4% (1.4)%
2017 vs. 2016SG&A decreased $74 million (-4.1%) primarily due to the following:
● Lower selling and advertising expense● Foreign currency translation● Lower net periodic other postretirement benefit costs● Lower incentive compensation expense● Restructuring cost savings
Partially offset by:● Wage and other cost inflation● SG&A expenses attributable to acquired businesses
Other costs and income
Six Months Ended
June 30 Percent Change($ in millions, except percentages) 2017 2016 2017 vs. 2016Interest expense, net of Interest income $ 43 $ 48 (10.4)%Pension settlement charge $ 22 $ — N/AAsbestos settlement, net $ — $ 5 (100.0)%Other charges $ 26 $ 46 (43.5)%Other income $ (96) $ (59) 62.7 %
Pension settlement charge
During the first quarter 2017, PPG made lump-sum payments to certain retirees who had participated in PPG's U.S. non-qualified pension plan (the"Nonqualified Plan") totaling approximately $40 million . As the lump-sum payments were in excess of the expected 2017 service and interest costsfor the Nonqualified Plan, PPG remeasured the periodic benefit obligation of the Nonqualified Plan as of March 1, 2017 and recorded a settlementcharge totaling $22 million during the first six-months of 2017.
31
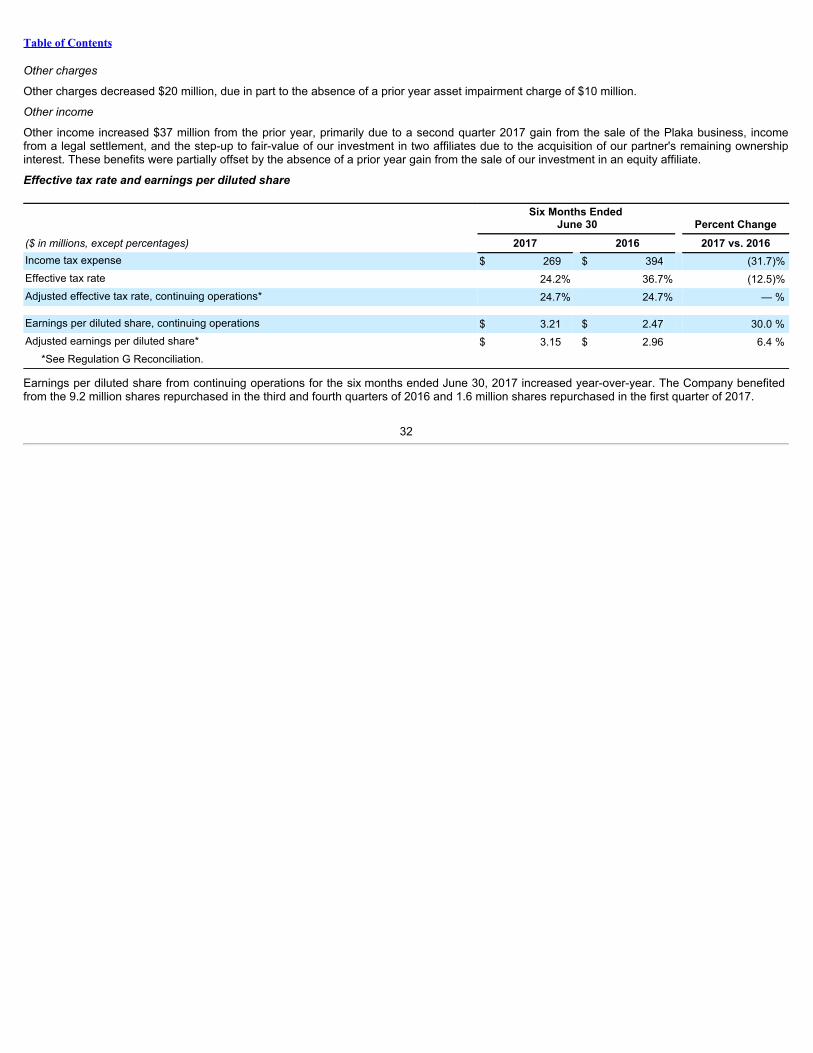
Table of Contents
Other charges
Other charges decreased $20 million, due in part to the absence of a prior year asset impairment charge of $10 million.
Other income
Other income increased $37 million from the prior year, primarily due to a second quarter 2017 gain from the sale of the Plaka business, incomefrom a legal settlement, and the step-up to fair-value of our investment in two affiliates due to the acquisition of our partner's remaining ownershipinterest. These benefits were partially offset by the absence of a prior year gain from the sale of our investment in an equity affiliate.
Effective tax rate and earnings per diluted share
Six Months Ended
June 30 Percent Change($ in millions, except percentages) 2017 2016 2017 vs. 2016Income tax expense $ 269 $ 394 (31.7)%Effective tax rate 24.2% 36.7% (12.5)%Adjusted effective tax rate, continuing operations* 24.7% 24.7% — % Earnings per diluted share, continuing operations $ 3.21 $ 2.47 30.0 %Adjusted earnings per diluted share* $ 3.15 $ 2.96 6.4 %
*See Regulation G Reconciliation.
Earnings per diluted share from continuing operations for the six months ended June 30, 2017 increased year-over-year. The Company benefitedfrom the 9.2 million shares repurchased in the third and fourth quarters of 2016 and 1.6 million shares repurchased in the first quarter of 2017.
32
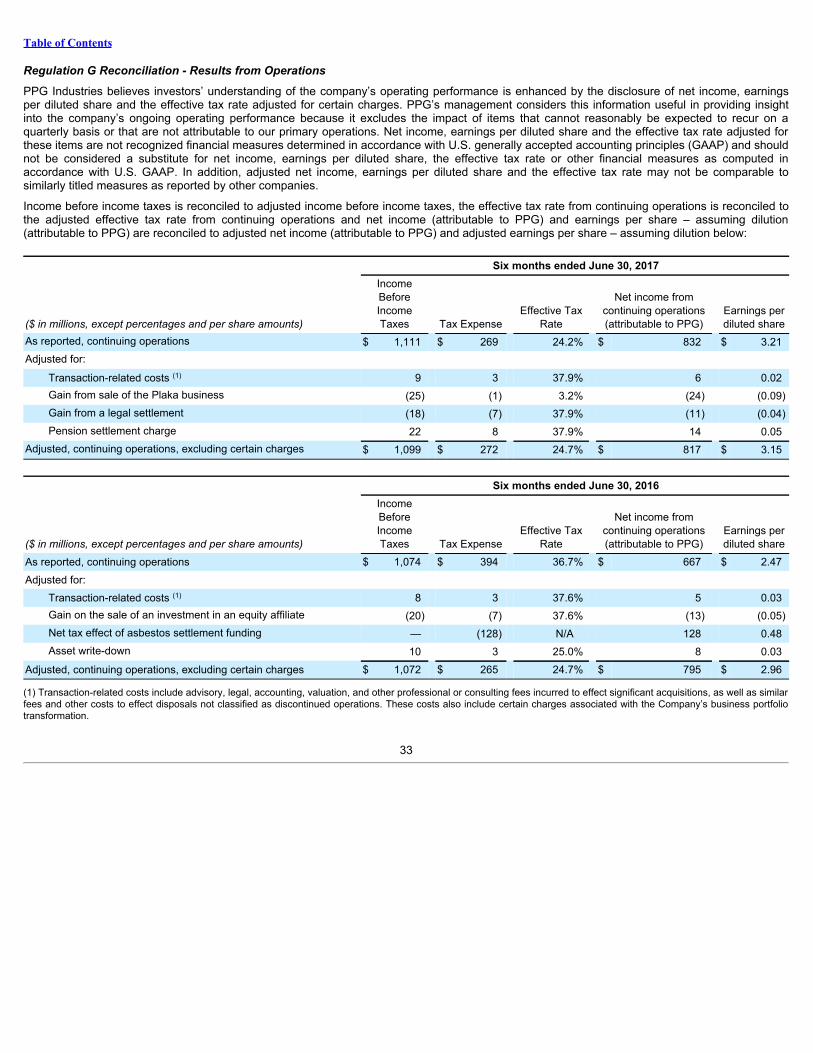
Table of Contents
Regulation G Reconciliation - Results from Operations
PPG Industries believes investors’ understanding of the company’s operating performance is enhanced by the disclosure of net income, earningsper diluted share and the effective tax rate adjusted for certain charges. PPG’s management considers this information useful in providing insightinto the company’s ongoing operating performance because it excludes the impact of items that cannot reasonably be expected to recur on aquarterly basis or that are not attributable to our primary operations. Net income, earnings per diluted share and the effective tax rate adjusted forthese items are not recognized financial measures determined in accordance with U.S. generally accepted accounting principles (GAAP) and shouldnot be considered a substitute for net income, earnings per diluted share, the effective tax rate or other financial measures as computed inaccordance with U.S. GAAP. In addition, adjusted net income, earnings per diluted share and the effective tax rate may not be comparable tosimilarly titled measures as reported by other companies.
Income before income taxes is reconciled to adjusted income before income taxes, the effective tax rate from continuing operations is reconciled tothe adjusted effective tax rate from continuing operations and net income (attributable to PPG) and earnings per share – assuming dilution(attributable to PPG) are reconciled to adjusted net income (attributable to PPG) and adjusted earnings per share – assuming dilution below:
Six months ended June 30, 2017
($ in millions, except percentages and per share amounts)
IncomeBeforeIncomeTaxes Tax Expense
Effective TaxRate
Net income fromcontinuing operations(attributable to PPG)
Earnings perdiluted share
As reported, continuing operations $ 1,111 $ 269 24.2% $ 832 $ 3.21Adjusted for:
Transaction-related costs (1) 9 3 37.9% 6 0.02Gain from sale of the Plaka business (25) (1) 3.2% (24) (0.09)Gain from a legal settlement (18) (7) 37.9% (11) (0.04)Pension settlement charge 22 8 37.9% 14 0.05
Adjusted, continuing operations, excluding certain charges $ 1,099 $ 272 24.7% $ 817 $ 3.15
Six months ended June 30, 2016
($ in millions, except percentages and per share amounts)
IncomeBeforeIncomeTaxes Tax Expense
Effective TaxRate
Net income fromcontinuing operations(attributable to PPG)
Earnings perdiluted share
As reported, continuing operations $ 1,074 $ 394 36.7% $ 667 $ 2.47Adjusted for:
Transaction-related costs (1) 8 3 37.6% 5 0.03Gain on the sale of an investment in an equity affiliate (20) (7) 37.6% (13) (0.05)Net tax effect of asbestos settlement funding — (128) N/A 128 0.48Asset write-down 10 3 25.0% 8 0.03
Adjusted, continuing operations, excluding certain charges $ 1,072 $ 265 24.7% $ 795 $ 2.96
(1) Transaction-related costs include advisory, legal, accounting, valuation, and other professional or consulting fees incurred to effect significant acquisitions, as well as similarfees and other costs to effect disposals not classified as discontinued operations. These costs also include certain charges associated with the Company’s business portfoliotransformation.
33

Table of Contents
Performance of Reportable Business Segments
Performance Coatings
Six Months Ended
June 30 $ Change % Change($ in millions, except per share amounts) 2017 2016 2017 vs. 2016 2017 vs. 2016Net sales $ 4,318 $ 4,377 $ (59) (1.3)%Segment income $ 698 $ 707 $ (9) (1.3)%
2017 vs. 2016Performance Coatings net sales decreased $59 million (-1.3%) due to the following:
● Unfavorable foreign currency translation of approximately $85 million (-2%)● Lower sales volumes (-1%)
Partially offset by:● Higher selling prices (+1%)● Net sales from acquisitions (+1%)
Architectural coatings - EMEA net sales increased by a low-to-mid-single-digit percentage year-over-year, despite unfavorable foreign currencytranslation. Sales volumes were down slightly year-over-year. Aggregate pricing improved as announced selling price increases in company-ownedstores became effective. Acquisition-related sales, principally DEUTEK, contributed approximately $50 million to net sales.Architectural coatings - Americas and Asia-Pacific sales volumes declined a low-single-digit-percentage versus the prior year. During the first half of2017, initial pricing actions were implemented and sales volumes increased by a mid-single-digit percentage in company-owned stores in the U.S.and Canada. These benefits were offset by sales volumes declines in the U.S. and Canada independent dealer network and mixed sales volumeresults in national retail accounts. Sales volumes improved in the Asia-Pacific region year-over-year, while Latin America results varied by sub-region.Protective and marine coatings sales volumes declined by a low-double-digit percentage year-over-year. Protective coatings sales volumesexpanded in most regions but were more than offset by significant weakness in new shipbuilding activity, primarily in the Asia-Pacific region.Aerospace coatings sales volumes were up modestly versus the prior year as industry growth rates remained tepid despite solid commercial airlinerproduction levels.Automotive refinish coatings organic sales grew by a low-single-digit percentage, led by above-market performance in U.S. and Canada. In Asia,net sales increased partially due to the recent Futian Xinshi acquisition in China.Segment income decreased $9 million (-1.3%) year-over-year primarily due to increasing raw material costs, lower sales volumes, wage and othercost inflation and unfavorable foreign currency translation, which reduced segment income by approximately $20 million (Mexican peso, Britishpound and the euro). These cost increases were partially offset by lower manufacturing and overhead costs, including the initial benefits frombusiness restructuring actions and initial selling price increases.
34

Table of Contents
Industrial Coatings
Six Months Ended
June 30 $ Change % Change($ in millions, except per share amounts) 2017 2016 2017 vs. 2016 2017 vs. 2016Net sales $ 2,974 $ 2,816 $ 158 5.6 %Segment income $ 537 $ 557 $ (20) (3.6)%
2017 vs. 2016Industrial Coatings net sales increased $158 million (+6%) due to the following:
● Higher sales volumes (+4%), led by growth in Latin America and Asia-Pacific.● Net sales attributable to acquired businesses (+4%)
Partially offset by:● Lower selling prices (-1%)● Unfavorable foreign currency translation of approximately $40 million (-1%)
PPG’s automotive OEM coatings sales volumes increased by a mid-single-digit percentage versus the prior year, outpacing the global automotiveindustry production growth rate, led by Europe, China, Mexico and Brazil. Sales volumes declined in the U.S. and Canada, partially reflecting loweryear-over-year industry production.
General industrial coatings and specialty coatings and materials sales volumes, in aggregate, grew by a mid-single-digit percentage year-over-year.Demand levels remained mixed by end-use market and geography, with strong year-over-year growth led by Asia-Pacific, which outpaced regionalindustrial production demand growth. Sales volumes grew across most sub-segments, including year-over-year increases in electronics materials,heavy duty equipment and organic light emitting diode (OLED) materials. Acquisition-related sales from MetoKote added approximately $120million.
Packaging coatings sales volumes grew by a low-single-digit percentage year-over-year, primarily driven by ongoing industry conversions to PPG’snew can coatings technologies led by the U.S.
Segment income decreased $20 million (-4%) year-over-year primarily due to lower selling prices, increasing raw material costs, wage and othercost inflation, higher transitory global transportation and logistics costs required to meet increased customer demand in Asia and unfavorableforeign currency translation ($10 million), partially offset by income from higher sales volumes, lower manufacturing and overhead costs, includingthe initial benefits from business restructuring actions, and acquisition-related income.
Liquidity and Capital Resources
PPG had cash and short-term investments totaling $1.6 billion and $1.9 billion at June 30, 2017 and December 31, 2016 , respectively.
Cash from operating activities - continuing operations for the six months ended June 30, 2017 was $434 million . Cash used for operating activities -continuing operations was $79 million for the six months ended June 30, 2016 . Operating cash flow increased primarily due to the absence of thecash paid to fund the PC asbestos bankruptcy trust in June 2016. This benefit was offset by higher working capital ($167 million) and higher cashtax and interest payments ($130 million).
Other approximate uses of cash during the six months ended June 30, 2017 included:
• Capital expenditures, excluding acquisitions, of $135 million , or about 2% of sales.
• Purchase of an investment in an equity affiliate of $100 million.
• Business acquisition cash spending of $62 million.
• Contributions to PPG's pension plans of $37 million.
• Cash dividends paid of $205 million .
• Share repurchases of $163 million .
In May 2016, PPG entered into two $250 million Term Loan Credit Agreements and subsequently prepaid the loans in December 2016.
In January 2016, PPG’s $250 million 1.9% notes matured, and PPG repaid these notes with cash on hand.
35

Table of Contents
Total capital spending in 2017 is expected to be in the range of 2.5% to 3.0% of full year sales. PPG expects to make mandatory contributions to itsnon-U.S. pension plans in the range of $15 million to $25 million in the second half of 2017.
We believe that our cash on hand and short term investments, cash from operations and the Company’s available borrowing capacity will continueto be sufficient to fund operating activities, capital spending, including acquisitions, dividend payments, debt service, share repurchases andcontributions to pension plans. We intend to deploy our cash in a timely, disciplined manner with a continued emphasis on incremental earningsaccretive initiatives, including additional acquisitions and share repurchases. The Company expects cash deployment for acquisitions and sharerepurchases of at least $3.5 billion for the years 2017 and 2018 combined.
PPG's total debt to equity ratio (total debt, including capital leases, to total debt and PPG shareholders’ equity) was 45% at June 30, 2017 and 47%at December 31, 2016 .
Operating Working Capital is a subset of total working capital and represents (1) trade receivables – net of the allowance for doubtful accounts,(2) inventories and (3) trade liabilities. We believe Operating Working Capital represents the key components of working capital under the operatingcontrol of our businesses. A key metric we use to measure improvement in our working capital management is Operating Working Capital as apercentage of sales (current quarter sales annualized).
($ in millions, except percentages) June 30, 2017 December 31, 2016 June 30, 2016
Trade Receivables, Net $ 2,786 $ 2,288 $ 2,659Inventories, FIFO 1,868 1,620 1,830Trade Creditors’ Liabilities 2,187 1,907 2,025Operating Working Capital $ 2,467 $ 2,001 $ 2,464Operating Working Capital as a % of Sales 16.2% 14.6% 16.3%Days sales outstanding 59 54 56
Other Liquidity Information
Environmental
Three Months Ended
June 30 Six Months Ended
June 30($ in millions) 2017 2016 2017 2016Cash outlays for environmental remediation activities $ 10 $ 9 $ 22 $ 23
($ in millions)Remainder
of 2017 Annually
2018 - 2021Projected future cash outlays for environmental remediation activities $35 - $55 $25 - $50
Restructuring
The 2016 restructuring actions have anticipated annual savings of approximately $125 million once fully implemented. The company expects toachieve $40 million to $50 million in savings in 2017 with the remainder of the projected annual savings to be substantially realized by year-end2018.
Taiwan Chlorine Industries
On April 11, 2017, PPG paid $100 million to acquire a 40% interest in Taiwan Chlorine Industries from China Petrochemical DevelopmentCorporation. Refer to Note 3, "Acquisitions and Divestitures" for additional information.
Akzo Nobel
From March to May 2017, PPG made several proposals to Akzo Nobel N.V. ("AkzoNobel") inviting AkzoNobel to enter into negotiations with PPG ona potential transaction to form a combined company, each of which AkzoNobel rejected. On June 1, 2017, PPG withdrew its proposal to combinewith AkzoNobel and announced that it would not pursue a public offer for all the issued and outstanding shares of AkzoNobel.
36

Table of Contents
Currency
Comparing exchange rates as of December 31, 2016 to June 30, 2017 , the U.S. dollar weakened against numerous currencies in which PPGoperates, most notably the Mexican peso. As a result, consolidated net assets at June 30, 2017 increased by $348 million, compared toDecember 31, 2016 .
Comparing exchange rates during the first six months of 2017 to those of the first six months of 2016 , the U.S. dollar strengthened against thecurrencies of most countries in which PPG operates, most notably the euro, Mexican peso and British pound. This had an unfavorable impact onincome from continuing operations before income taxes for the six months ended June 30, 2017 of $29 million from the translation of these foreignearnings into U.S. dollars.
New Accounting Standards
See Note 2 , “ New Accounting Standards ,” to the accompanying condensed consolidated financial statements for further details on recently issuedaccounting guidance.
Commitments and Contingent Liabilities, including Environmental Matters
PPG is involved in a number of lawsuits and claims, both actual and potential, including some that it has asserted against others, in whichsubstantial monetary damages are sought. See Part II, Item 1, “Legal Proceedings” of this Form 10-Q and Note 15 , “ Commitments and ContingentLiabilities ,” to the accompanying condensed consolidated financial statements for a description of certain of these lawsuits.
As discussed in Part II, Item 1 and Note 15 , although the result of any future litigation of such lawsuits and claims is inherently unpredictable,management believes that, in the aggregate, the outcome of all lawsuits and claims involving PPG, including asbestos-related claims, will not have amaterial effect on PPG's consolidated financial position or liquidity; however, any such outcome may be material to the results of operations of anyparticular period in which costs, if any, are recognized.
As also discussed in Note 15 , PPG has significant reserves for environmental contingencies. Please refer to the Environmental Matters section ofNote 15 for details of these reserves. A significant portion of our reserves for environmental contingencies relate to ongoing remediation at PPG'sformer chromium manufacturing plant in Jersey City, N.J. and associated sites ("New Jersey Chrome"). The Company continues to analyze, assessand remediate the environmental issues associated with New Jersey Chrome. Information will continue to be generated from the ongoinggroundwater remedial investigation activities related to New Jersey Chrome and will be incorporated into a final draft remedial action work plan forgroundwater expected to be submitted to the New Jersey Department of Environmental Protection no later than 2020.
It is possible that technological, regulatory and enforcement developments, the results of environmental studies and other factors could alter theCompany’s expectations with respect to future charges against income and future cash outlays. Specifically, the level of expected future remediationcosts and cash outlays is highly dependent upon activity related to New Jersey Chrome.
Forward-Looking Statements
The Private Securities Litigation Reform Act of 1995 provides a safe harbor for forward-looking statements made by or on behalf of the Company.Management’s Discussion and Analysis and other sections of this Quarterly Report contain forward-looking statements that reflect the Company’scurrent views with respect to future events and financial performance.You can identify forward-looking statements by the fact that they do not relatestrictly to current or historic facts. Forward-looking statements are identified by the use of the words “aim,” “believe,” “expect,” “anticipate,” “intend,”“estimate,” “project,” “outlook,” “forecast” and other expressions that indicate future events and trends. Any forward-looking statement speaks onlyas of the date on which such statement is made, and the Company undertakes no obligation to update any forward looking statement, whether as aresult of new information, future events or otherwise. You are advised, however, to consult any further disclosures we make on related subjects inour reports to the Securities and Exchange Commission. Also, note the following cautionary statements.
Many factors could cause actual results to differ materially from the Company’s forward-looking statements. Such factors include global economicconditions, increasing price and product competition by foreign and domestic competitors, fluctuations in cost and availability of raw materials, theability to maintain favorable supplier relationships and arrangements, the timing of and the realization of anticipated cost savings from restructuringinitiatives, difficulties in integrating acquired businesses and achieving expected synergies therefrom, economic and political conditions ininternational markets, the ability to penetrate existing, developing and emerging foreign and domestic markets, foreign exchange rates andfluctuations in such rates, fluctuations in tax rates, the impact of future legislation, the impact of environmental regulations, unexpected businessdisruptions and the unpredictability of existing and possible future litigation.
37

Table of Contents
Consequently, while the list of factors presented here and in the Company’s Annual Report on Form 10-K for the year ended December 31, 2016under the caption “Item 1A Risk Factors” are considered representative, no such list should be considered to be a complete statement of all potentialrisks and uncertainties. Unlisted factors may present significant additional obstacles to the realization of forward-looking statements.
Consequences of material differences in the results compared with those anticipated in the forward-looking statements could include, among otherthings, lower sales or earnings, business disruption, operational problems, financial loss, legal liability to third parties, other factors set forth in “Item1A. Risk Factors” of the Company’s Annual Report on Form 10-K for the year ended December 31, 2016 and similar risks, any of which could havea material adverse effect on the Company’s consolidated financial condition, results of operations or liquidity.
Item 3. Quantitative and Qualitative Disclosures About Market RiskAs of June 30, 2017 and December 31, 2016, PPG had non-U.S. dollar denominated borrowings outstanding of $3.2 billion and $3.1 billion,respectively. A weakening of the U.S. dollar by 10% against European currencies and by 20% against Asian and South American currencies wouldhave resulted in unrealized translation losses on these borrowings of approximately $366 million as of June 30, 2017 and $344 million as ofDecember 31, 2016 .
The fair value of foreign currency forward contracts outstanding as of June 30, 2017 and 2016 was a liability of $16 million and $2 million,respectively. The potential reduction in PPG's income from continuing operations resulting from the impact of adverse changes in exchange rates onthe fair value of its outstanding foreign currency hedge contracts of 10% for European and Canadian currencies and 20% for Asian and LatinAmerican currencies for the six months ended June 30, 2017 and 2016 was $75 million and $45 million, respectively.
There were no other material changes in the Company’s exposure to market risk from December 31, 2016 to June 30, 2017 . See Note 13 , “Financial Instruments, Hedging Activities and Fair Value Measurements ” for a description of our instruments subject to market risk.
Item 4. Controls and Proceduresa. Evaluation of disclosure controls and procedures. Based on their evaluation as of the end of the period covered by this Form 10-Q, theCompany’s principal executive officer and principal financial officer have concluded that the Company’s disclosure controls and procedures (asdefined in Rules 13a-15(e) and 15d-15(e) under the Securities Exchange Act of 1934 (the “Exchange Act”)) are effective to ensure that informationrequired to be disclosed by the Company in reports that it files or submits under the Exchange Act is recorded, processed, summarized and reportedwithin the time periods specified in Securities and Exchange Commission rules and forms and to ensure that information required to be disclosed bythe Company in the reports that it files or submits under the Exchange Act is accumulated and communicated to the Company’s management,including its principal executive and principal financial officers, as appropriate, to allow timely decisions regarding required disclosure.
b. Changes in internal control. There were no changes in the Company’s internal control over financial reporting that occurred during the Company’smost recent fiscal quarter that have materially affected, or are reasonably likely to materially affect, the Company’s internal control over financialreporting.
38
Table of Contents
PART II. OTHER INFORMATION
Item 1. Legal ProceedingsPPG is involved in a number of lawsuits and claims, both actual and potential, including some that it has asserted against others, in whichsubstantial monetary damages are sought. These lawsuits and claims may relate to contract, patent, environmental, product liability, asbestosexposure, antitrust, employment and other matters arising out of the conduct of PPG’s current and past business activities. To the extent that theselawsuits and claims involve personal injury and property damage, PPG believes it has adequate insurance; however, certain of PPG’s insurers arecontesting coverage with respect to some of these claims, and other insurers may contest coverage. PPG’s lawsuits and claims against othersinclude claims against insurers and other third parties with respect to actual and contingent losses related to environmental, asbestos and othermatters.
The results of any future litigation and claims are inherently unpredictable. However, management believes that, in the aggregate, the outcome of alllawsuits and claims involving PPG, including asbestos-related claims, will not have a material effect on PPG’s consolidated financial position orliquidity; however, such outcome may be material to the results of operations of any particular period in which costs, if any, are recognized.
For many years, PPG has been a defendant in lawsuits involving claims alleging personal injury from exposure to asbestos. For a description ofasbestos litigation affecting the Company, see Note 15 , “ Commitments and Contingent Liabilities ” to the accompanying condensed consolidatedfinancial statements under Part I, Item 1 of this Form 10-Q.
In the past, the Company and others have been named as defendants in several cases in various jurisdictions claiming damages related toexposure to lead and remediation of lead-based coatings applications. PPG has been dismissed as a defendant from most of these lawsuits andhas never been found liable in any of these cases.
In March 2016, the Natural Resource Trustees for the Calcasieu River Estuary (the United States Department of the Interior, acting through theUnited States Fish and Wildlife Service, the National Oceanic and Atmospheric Administration of the United States Department of Commerce, theLouisiana Department of Environmental Quality and the Louisiana Department of Wildlife and Fisheries) reached an agreement in principle withPPG and two other potentially responsible parties to resolve the Trustees’ claims for natural resource damages alleged to have been caused by therelease of hazardous substances into the Estuary. PPG’s share of this settlement is $3,600,000.
In December 2011, the United States Environmental Protection Agency (“EPA”) issued a Finding of Violation alleging that PPG’s Delaware, Ohiofacility violated certain leak detection and repair ("LDAR”) requirements of the federal Clean Air Act. In 2016, PPG and the EPA reached anagreement in principle to settle this matter with a total civil penalty of $225,000 and certain enhancements to the facility’s LDAR program. PPG andthe EPA are in the process of finalizing the terms of a Consent Decree for this matter which will memorialize the terms of this settlement.
Item 1A. Risk FactorsThere were no material changes in the Company’s risk factors from the risks disclosed in the Company's Annual Report on Form 10-K for the yearended December 31, 2016 .
Item 2. Unregistered Sales of Equity Securities and Use of ProceedsDirectors who are not also officers of the Company receive common stock equivalents pursuant to the PPG Industries, Inc. Deferred CompensationPlan for Directors (“PPG Deferred Compensation Plan for Directors”). Common stock equivalents are hypothetical shares of common stock having avalue on any given date equal to the value of a share of common stock. Common stock equivalents earn dividend equivalents that are convertedinto additional common stock equivalents but carry no voting rights or other rights afforded to a holder of common stock. The common stockequivalents credited to directors under both plans are exempt from registration under Section 4(a)(2) of the Securities Act of 1933 as privateofferings made only to directors of the Company in accordance with the provisions of the plans.
Under the PPG Deferred Compensation Plan for Directors, each director may elect to defer the receipt of all or any portion of the compensation paidto such director for serving as a PPG director. All deferred payments are held in the form of common stock equivalents. Payments out of thedeferred accounts are made in the form of common stock of the Company (and cash as to any fractional common stock equivalent). In the secondquarter of 2017 , the directors, as a group, were credited with 8,594 common stock equivalents under this plan. The value of these common stockequivalents, when credited, ranged from $105.00 to $110.14.
Issuer Purchases of Equity Securities
No shares were repurchased in the quarter ended June 30, 2017 under the current $2 billion share repurchase program approved in October 2016.The maximum number of shares that may yet be purchased under this
39

Table of Contents
program is 15,518,321 shares. The remaining shares yet to be purchased under the 2016 program have been calculated using PPG’s closing stockprice on the last business day of June 2017. This repurchase program has no expiration date.
Item 6. ExhibitsSee the Index to Exhibits on Page 42.
40
Table of Contents
SIGNATURES
Pursuant to the requirements of the Securities Exchange Act of 1934, the Registrant has duly caused this report to be signed on its behalf by theundersigned thereunto duly authorized.
PPG INDUSTRIES, INC. (Registrant)
Date: July 21, 2017 By: /s/ Vincent J. Morales
Vincent J. MoralesSenior Vice President and Chief Financial Officer(Principal Financial Officer and Duly Authorized Officer)
By: /s/ Mark C. Kelly
Mark C. KellyVice President and Controller(Principal Accounting Officer and Duly Authorized Officer)
41

Table of Contents
PPG INDUSTRIES, INC. AND SUBSIDIARIES
Index to Exhibits
The following exhibits are filed as part of, or incorporated by reference into, this Form 10-Q.
†12 Computation of Ratio of Earnings to Fixed Charges for the Six Months Ended June 30, 2017 and for the Five YearsEnded December 31, 2016.
†31.1 Certification of Principal Executive Officer Pursuant to Rule 13a-14(a) or 15d-14(a) of the Exchange Act, asAdopted Pursuant to Section 302 of the Sarbanes-Oxley Act of 2002.
†31.2 Certification of Principal Financial Officer Pursuant to Rule 13a-14(a) or 15d-14(a) of the Exchange Act, asAdopted Pursuant to Section 302 of the Sarbanes-Oxley Act of 2002.
††32.1 Certification of Chief Executive Officer Pursuant to 18 U.S.C. Section 1350, as Adopted Pursuant to Section 906 ofthe Sarbanes-Oxley Act of 2002.
††32.2 Certification of Chief Financial Officer Pursuant to 18 U.S.C. Section 1350, as Adopted Pursuant to Section 906 ofthe Sarbanes-Oxley Act of 2002.
101.INS* XBRL Instance Document101.SCH* XBRL Taxonomy Extension Schema Document101.CAL* XBRL Taxonomy Extension Calculation Linkbase Document101.DEF* XBRL Taxonomy Extension Definition Linkbase Document101.LAB* XBRL Taxonomy Extension Label Linkbase Document101.PRE* XBRL Taxonomy Extension Presentation Linkbase Document
† Filed herewith.†† Furnished herewith.* Attached as Exhibit 101 to this report are the following documents formatted in XBRL (Extensible Business Reporting Language): (i) theCondensed Consolidated Statement of Income for the three and six months ended June 30, 2017 and 2016, (ii) the Condensed ConsolidatedBalance Sheet at June 30, 2017 and December 31, 2016, (iii) the Condensed Consolidated Statement of Cash Flows for the three and six monthsended June 30, 2017 and 2016, and (iv) Notes to Condensed Consolidated Financial Statements for the three and six months ended June 30,2017.
42

Exhibit 12
PPG INDUSTRIES, INC. AND CONSOLIDATED SUBSIDIARIESComputation of Ratio of Earnings to Fixed Charges
(Dollars in millions)
Six MonthsEnded June 30 Year Ended December 31
2017 2016 2015 2014 2013 2012
Earnings: Earnings before income taxes and net earnings in equityaffiliates $ 1,104 $ 773 $ 1,735 $ 1,216 $ 1,177 $ 764Plus: Fixed charges exclusive of capitalized interest 97 215 210 278 280 277Amortization of capitalized interest 3 5 5 5 4 5Adjustments for equity affiliates 8 2 73 5 1 —
Total $ 1,212 $ 995 $ 2,023 $ 1,504 $ 1,462 $ 1,046
Fixed Charges: Interest expense including amortization of debtdiscount/premium and debt expense $ 51 $ 125 $ 125 $ 187 $ 196 $ 210Rentals - portion representative of interest 46 90 85 91 84 67Fixed charges exclusive of capitalized interest 97 215 210 278 280 277Capitalized interest 4 8 9 16 10 8
Total $ 101 $ 223 $ 219 $ 294 $ 290 $ 285
Ratio of earnings to fixed charges 12.0 4.5 9.2 5.1 5.0 3.7
Note: The financial information of all prior periods has been reclassified to reflect discontinued operations.

Exhibit 31.1
PRINCIPAL EXECUTIVE OFFICER CERTIFICATION
I, Michael H. McGarry, certify that:
1. I have reviewed this quarterly report on Form 10-Q of PPG Industries, Inc.;
2. Based on my knowledge, this report does not contain any untrue statement of a material fact or omit to state a material fact necessary to make thestatements made, in light of the circumstances under which such statements were made, not misleading with respect to the period covered by this report;
3. Based on my knowledge, the financial statements, and other financial information included in this report, fairly present in all material respects thefinancial condition, results of operations and cash flows of the registrant as of, and for, the periods presented in this report;
4. The registrant’s other certifying officer and I are responsible for establishing and maintaining disclosure controls and procedures (as defined in ExchangeAct Rules 13a-15(e) and 15d-15(e)) and internal control over financial reporting (as defined in Exchange Act Rules 13a-15(f) and 15d-15(f)) for theregistrant and have:
a) Designed such disclosure controls and procedures, or caused such disclosure controls and procedures to be designed under our supervision, toensure that material information relating to the registrant, including its consolidated subsidiaries, is made known to us by others within thoseentities, particularly during the period in which this report is being prepared;
b) Designed such internal control over financial reporting, or caused such internal control over financial reporting to be designed under oursupervision, to provide reasonable assurance regarding the reliability of financial reporting and the preparation of financial statements forexternal purposes in accordance with generally accepted accounting principles;
c) Evaluated the effectiveness of the registrant’s disclosure controls and procedures and presented in this report our conclusions about theeffectiveness of the disclosure controls and procedures, as of the end of the period covered by this report based on such evaluation; and
d) Disclosed in this report any change in the registrant’s internal control over financial reporting that occurred during the registrant’s most recentfiscal quarter (the registrant’s fourth fiscal quarter in the case of an annual report) that has materially affected, or is reasonably likely tomaterially affect, the registrant’s internal control over financial reporting; and
5. The registrant’s other certifying officer and I have disclosed, based on our most recent evaluation of internal control over financial reporting, to theregistrant’s auditors and the audit committee of the registrant’s board of directors (or persons performing the equivalent functions):
a) All significant deficiencies and material weaknesses in the design or operation of internal control over financial reporting which are reasonablylikely to adversely affect the registrant’s ability to record, process, summarize and report financial information; and
b) Any fraud, whether or not material, that involves management or other employees who have a significant role in the registrant’s internal controlover financial reporting.
Date: July 21, 2017 /s/ Michael H. McGarry
Michael H. McGarryChairman and Chief Executive Officer

Exhibit 31.2
PRINCIPAL FINANCIAL OFFICER CERTIFICATION
I, Vincent J. Morales, certify that:
1. I have reviewed this quarterly report on Form 10-Q of PPG Industries, Inc.;
2. Based on my knowledge, this report does not contain any untrue statement of a material fact or omit to state a material fact necessary to make thestatements made, in light of the circumstances under which such statements were made, not misleading with respect to the period covered by this report;
3. Based on my knowledge, the financial statements, and other financial information included in this report, fairly present in all material respects thefinancial condition, results of operations and cash flows of the registrant as of, and for, the periods presented in this report;
4. The registrant’s other certifying officer and I are responsible for establishing and maintaining disclosure controls and procedures (as defined in ExchangeAct Rules 13a-15(e) and 15d-15(e)) and internal control over financial reporting (as defined in Exchange Act Rules 13a-15(f) and 15d-15(f)) for theregistrant and have:
a) Designed such disclosure controls and procedures, or caused such disclosure controls and procedures to be designed under our supervision, toensure that material information relating to the registrant, including its consolidated subsidiaries, is made known to us by others within thoseentities, particularly during the period in which this report is being prepared;
b) Designed such internal control over financial reporting, or caused such internal control over financial reporting to be designed under oursupervision, to provide reasonable assurance regarding the reliability of financial reporting and the preparation of financial statements forexternal purposes in accordance with generally accepted accounting principles;
c) Evaluated the effectiveness of the registrant’s disclosure controls and procedures and presented in this report our conclusions about theeffectiveness of the disclosure controls and procedures, as of the end of the period covered by this report based on such evaluation; and
d) Disclosed in this report any change in the registrant’s internal control over financial reporting that occurred during the registrant’s most recentfiscal quarter (the registrant’s fourth fiscal quarter in the case of an annual report) that has materially affected, or is reasonably likely tomaterially affect, the registrant’s internal control over financial reporting; and
5. The registrant’s other certifying officer and I have disclosed, based on our most recent evaluation of internal control over financial reporting, to theregistrant’s auditors and the audit committee of the registrant’s board of directors (or persons performing the equivalent functions):
a) All significant deficiencies and material weaknesses in the design or operation of internal control over financial reporting which are reasonablylikely to adversely affect the registrant’s ability to record, process, summarize and report financial information; and
b) Any fraud, whether or not material, that involves management or other employees who have a significant role in the registrant’s internal controlover financial reporting.
Date: July 21, 2017 /s/ Vincent J. Morales
Vincent J. MoralesSenior Vice President and Chief Financial Officer(Principal Financial Officer)

Exhibit 32.1
CERTIFICATION PURSUANT TO18 U.S.C. SECTION 1350,
AS ADOPTED PURSUANT TOSECTION 906 OF THE SARBANES-OXLEY ACT OF 2002
In connection with the Quarterly Report on Form 10-Q of PPG Industries, Inc. for the period ended June 30, 2017 as filed with the Securities and ExchangeCommission on the date hereof (the “Report”), I, Michael H. McGarry, Chairman and Chief Executive Officer of PPG Industries, Inc., certify to the best of myknowledge, pursuant to 18 U.S.C. §1350, as adopted pursuant to §906 of the Sarbanes-Oxley Act of 2002, that:
(1) The Report fully complies with the requirements of section 13(a) or 15(d) of the Securities Exchange Act of 1934; and
(2) The information contained in the Report fairly presents, in all material respects, the financial condition and results of operations of PPG Industries, Inc.
/s/ Michael H. McGarryMichael H. McGarry Chairman and Chief Executive OfficerJuly 21, 2017
A signed original of this written statement required by Section 906 has been provided to PPG Industries, Inc. and will be retained by PPG Industries, Inc. andfurnished to the Securities and Exchange Commission or its staff upon request.

Exhibit 32.2
CERTIFICATION PURSUANT TO18 U.S.C. SECTION 1350,
AS ADOPTED PURSUANT TOSECTION 906 OF THE SARBANES-OXLEY ACT OF 2002
In connection with the Quarterly Report on Form 10-Q of PPG Industries, Inc. for the period ended June 30, 2017 as filed with the Securities and ExchangeCommission on the date hereof (the “Report”), I, Vincent J. Morales, Senior Vice President and Chief Financial Officer of PPG Industries, Inc., certify to the bestof my knowledge, pursuant to 18 U.S.C. §1350, as adopted pursuant to §906 of the Sarbanes-Oxley Act of 2002, that:
(1) The Report fully complies with the requirements of section 13(a) or 15(d) of the Securities Exchange Act of 1934; and
(2) The information contained in the Report fairly presents, in all material respects, the financial condition and results of operations of PPG Industries, Inc.
/s/ Vincent J. MoralesVincent J. MoralesSenior Vice President and Chief Financial Officer(Principal Financial Officer)July 21, 2017
A signed original of this written statement required by Section 906 has been provided to PPG Industries, Inc. and will be retained by PPG Industries, Inc. andfurnished to the Securities and Exchange Commission or its staff upon request.