ppb group berhad
DESCRIPTION
PPB GROUP BERHAD. Press and Analyst Briefing. Unaudited FY10 Results. 3 March 2011. - PowerPoint PPT PresentationTRANSCRIPT
1
PPB GROUP BERHAD
Disclaimer: The contents of this presentation include materials which may be capable of being interpreted as forward-looking statements. Such statements are merely estimates and targets, based on circumstances and reasonable assumptions which apply only at the date of such statements. Accordingly, no reliance should be placed on any forward-looking statements, express or implied, contained in this presentation.
Press and Analyst BriefingUnaudited FY10 Results3 March 2011
Agenda
2
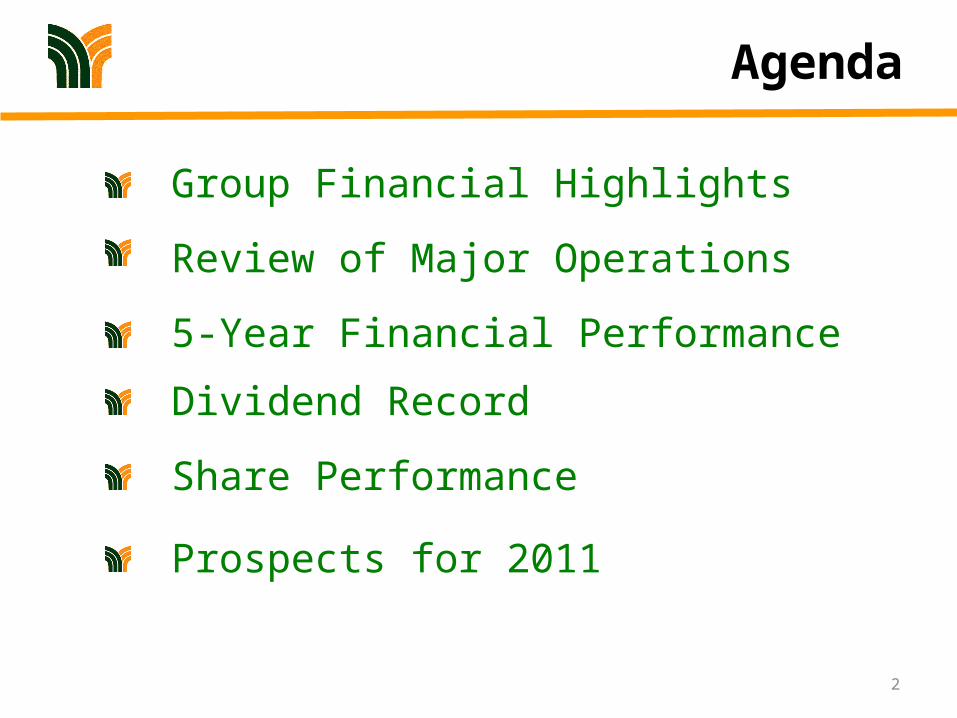
Group Financial Highlights
Share PerformanceProspects for 2011
Dividend Record
Review of Major Operations5-Year Financial Performance

3
Group Financial
Highlights

4
Financial Results FOR THE YEAR ENDED 31 DEC 2010
Grains Trading, Flour & Feed Milling
Consumer Products Distribution
Film Exhibition & Distribution
Waste Management & Utilities
Property Development, Management & Investment
Others
5
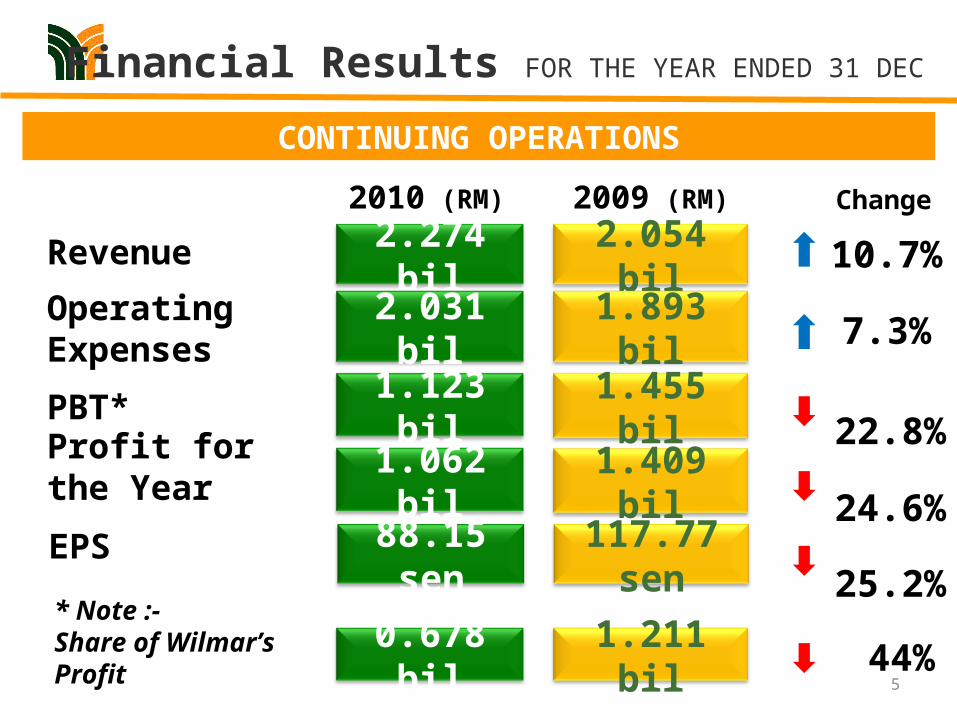
Financial Results FOR THE YEAR ENDED 31 DEC
2.274 bil 2.054 bil2010 (RM) 2009 (RM) Change
10.7%
7.3%
22.8%
2.031 bil
1.123 bil
1.893 bil
1.455 bilPBT*
Operating Expenses
Revenue
CONTINUING OPERATIONS
25.2%88.15 sen 117.77 senEPS
1.062 bilProfit for the Year 1.409 bil 24.6%
44%0.678 bil 1.211 bil* Note :-Share of Wilmar’s Profit
6
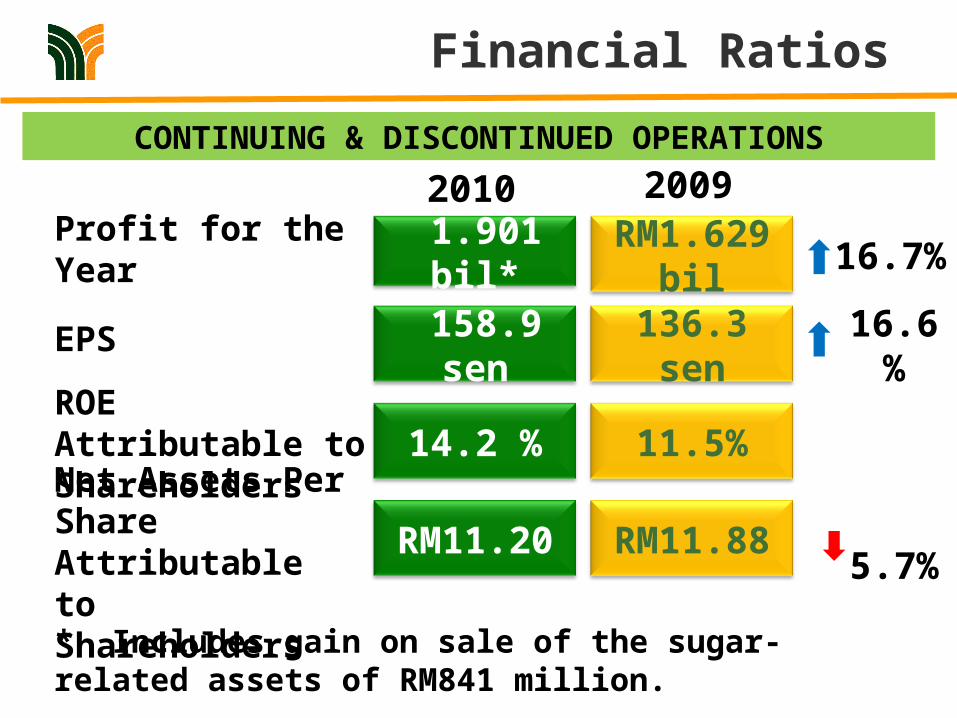
Financial Ratios
2009
ROE Attributable to Shareholders 14.2 % 11.5%
RM11.20 RM11.88Net Assets Per Share Attributable to Shareholders
136.3 sen 158.9 senEPS
2010 CONTINUING & DISCONTINUED OPERATIONS
RM1.629 bil 1.901 bil*Profit for the Year 16.7%
5.7%
16.6%
* Includes gain on sale of the sugar-related assets of RM841 million.

Segmental InformationFOR THE YEAR ENDED 31 DEC 2010
7
Grains Trading,Flour & Feed
Milling52.01%
Waste Management &
Utilities4.49%
Film Exhibition10.42%
Property1.73%
Others*16.11%
Total RevenueContinuing OperationsRM2.274 billion
*Others :-•Chemicals Trading & Manufacturing [4.83%]•Livestock Farming [3.93%]•Dividends [1.76%]•Packaging [2.51%]•Engineering [1.72%]•Shipping [0.77%]•Others [0.59%]
ConsumerProducts15.24%
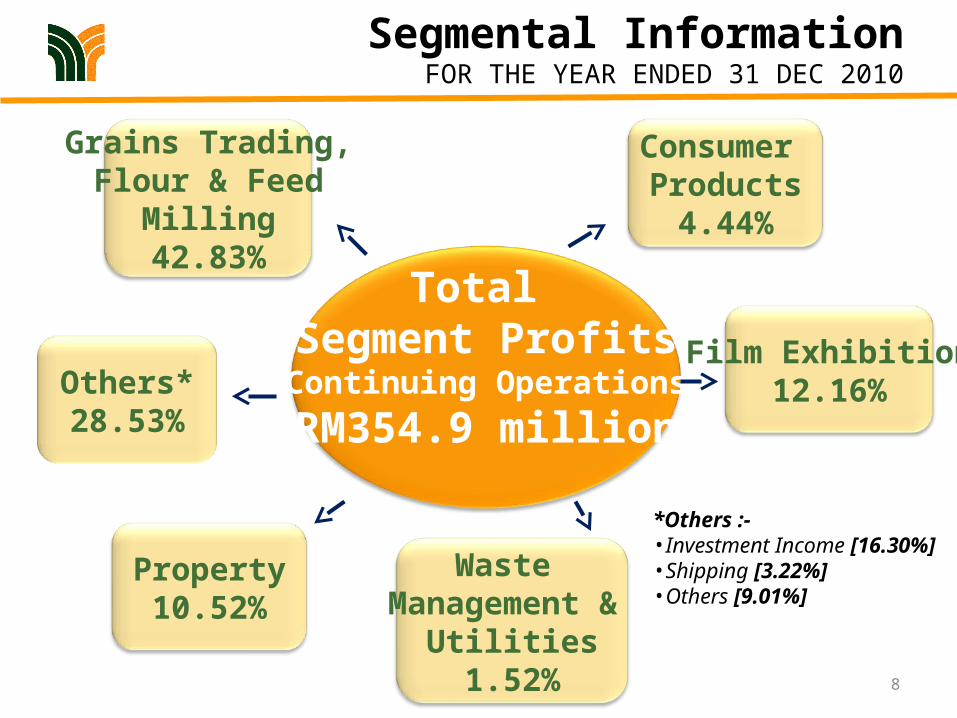
Segmental InformationFOR THE YEAR ENDED 31 DEC 2010
8
Grains Trading,Flour & Feed
Milling42.83%
Film Exhibition12.16%
Waste Management &
Utilities1.52%
Others*28.53%
Total Segment Profits
Continuing OperationsRM354.9 million
*Others :-•Investment Income [16.30%]•Shipping [3.22%]•Others [9.01%]
Consumer Products
4.44%
Property10.52%
9
ReviewOf
MajorOperations
Review of Major Operations
10
0.00200.00400.00600.00800.00
1,000.001,200.001,400.00
1,15
2.4
93.2
1,26
0.7
154.
9
FYE 2009FYE 2010
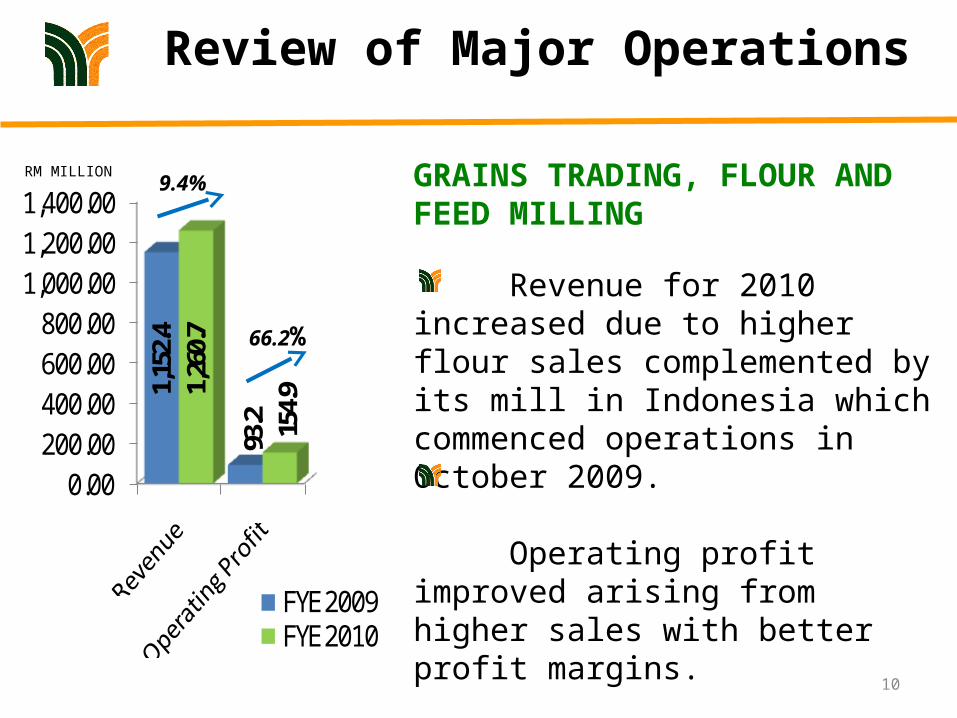
GRAINS TRADING, FLOUR AND FEED MILLING
Revenue for 2010 increased due to higher flour sales complemented by its mill in Indonesia which commenced operations in October 2009.
Operating profit improved arising from higher sales with better profit margins.
RM MILLION 9.4%
66.2%

Review of Major Operations
11
0.00
20.00
40.00
60.00
80.00
100.00
120.0010
4.2
4.4
108.
7
5.5
FYE 2009FYE 2010
ENVIRONMENTAL ENGINEERING, WASTE MANAGEMENT & UTILITIES
The revenue and operating profit improved marginally due to better cost management and higher profit margin.
RM MILLION4.3%
25%
Review of Major Operations
12
0
50
100
150
200
250
300
205.
7
28.5
252.
6
44.0
FYE 2009FYE 2010
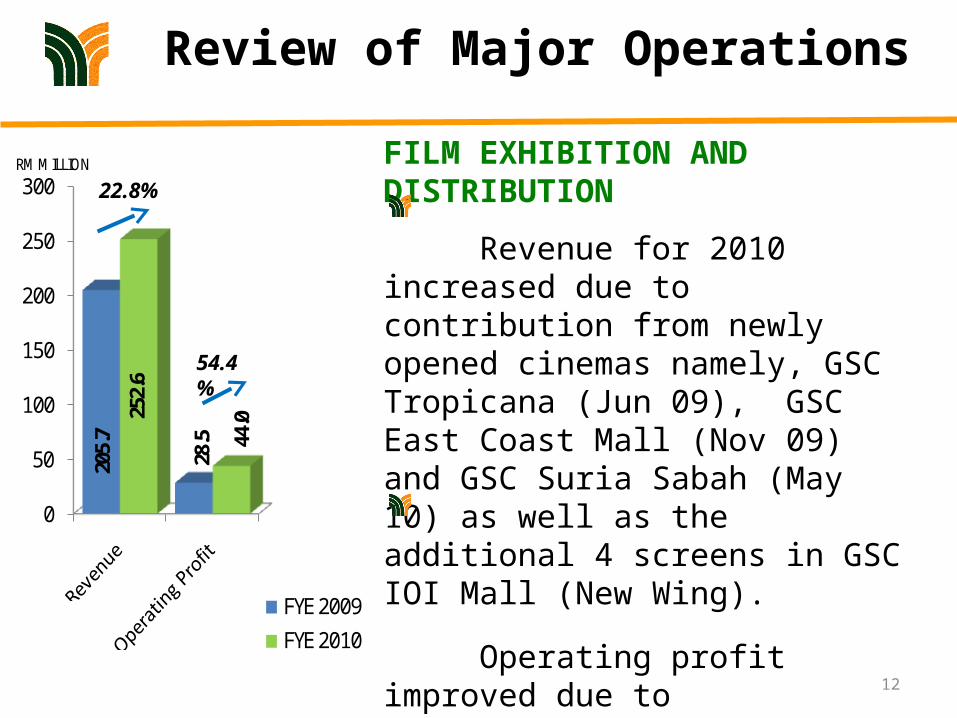
RM MILLION FILM EXHIBITION AND DISTRIBUTION
Revenue for 2010 increased due to contribution from newly opened cinemas namely, GSC Tropicana (Jun 09), GSC East Coast Mall (Nov 09) and GSC Suria Sabah (May 10) as well as the additional 4 screens in GSC IOI Mall (New Wing).
Operating profit improved due to contribution from new cinemas and the overall improved performance of cinemas driven by the strong films released in the year.
22.8%
54.4%

Review of Major Operations
13
05
1015202530354045
40.8
16.141
.9
38.1
FYE 2009FYE 2010
PROPERTY INVESTMENT & DEVELOPMENT
Revenue for 2010 increased marginally due to higher contribution from Cheras Leisure Mall.
Operating profit improved due to the creation of a new F&B area called “Cravings Lane” and upward revision of tenancy rates in Cheras Leisure Mall.
Gains from disposal of properties totalling RM22.3 million also contributed to the significant jump in the FY10 profit.
RM MILLION
>100%2.7%
Review of Major Operations
14
0
50
100
150
200
250
300
350
400
Revenue Operating Profit
339.
9
13.4
369.
5
16.0
FYE 2009FYE 2010
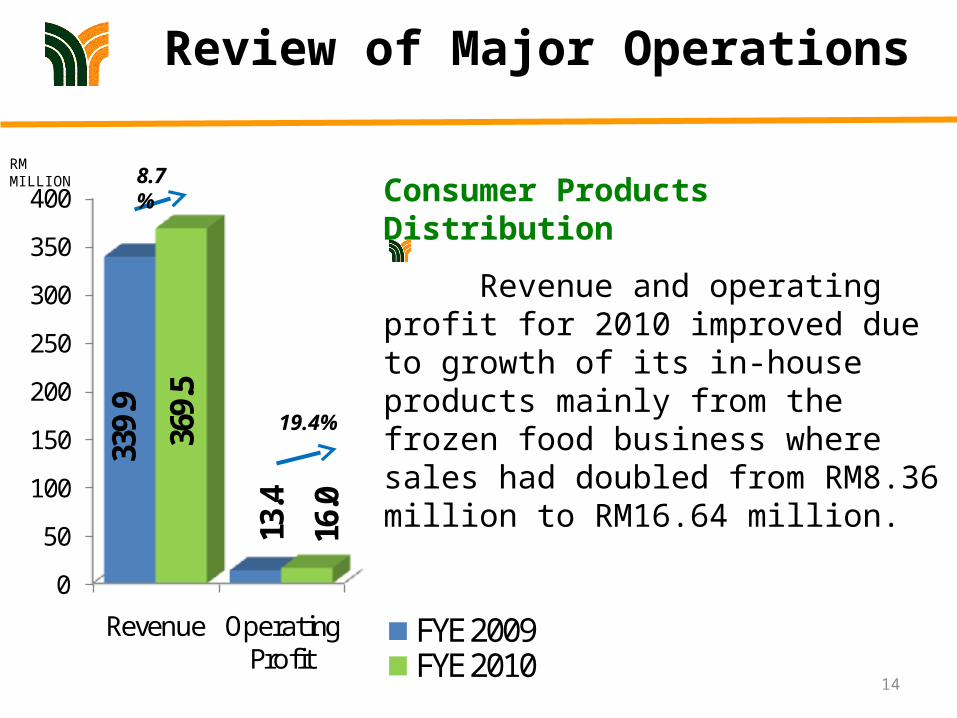
Consumer Products Distribution
Revenue and operating profit for 2010 improved due to growth of its in-house products mainly from the frozen food business where sales had doubled from RM8.36 million to RM16.64 million.
RM MILLION
19.4%
8.7%
15
5-YearFinancial
Performance
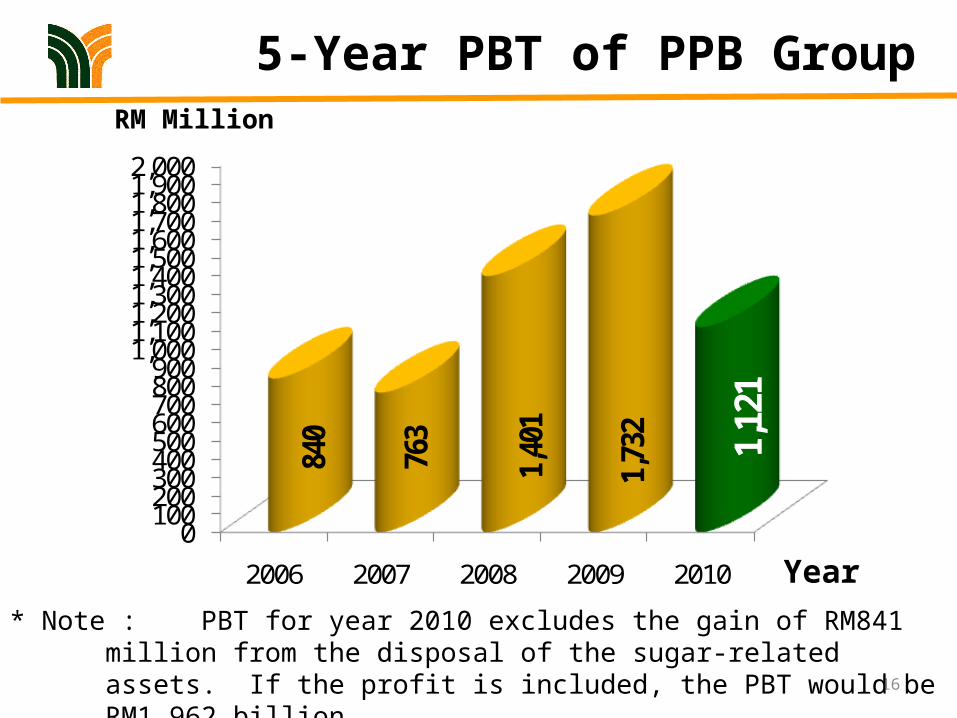
5-Year PBT of PPB Group
16
0100200300400500600700800900
1,0001,1001,2001,3001,4001,5001,6001,7001,8001,9002,000
2006 2007 2008 2009 2010
840
763
1,401
1,732 1,
121
RM Million
Year* Note : PBT for year 2010 excludes the gain of RM841 million from the disposal of the sugar-
related assets. If the profit is included, the PBT would be RM1.962 billion

17
DividendRecord
Dividend Record
18
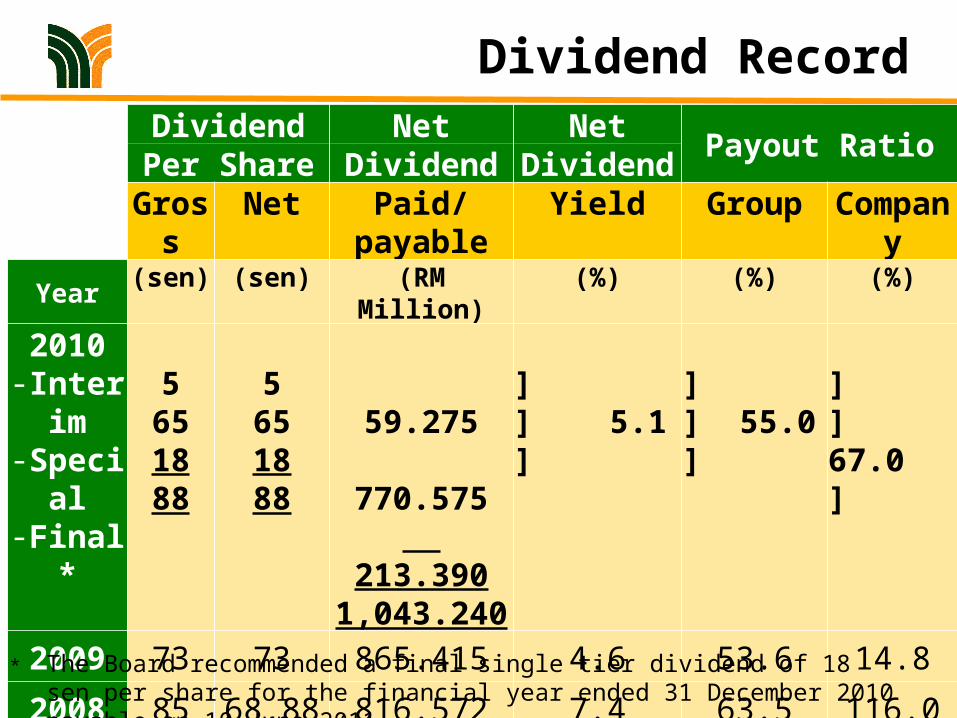
Dividend Net Net Payout RatioPer Share Dividend Dividend Gross Net Paid/payable Yield Group Company
Year (sen) (sen) (RM Million) (%) (%) (%)2010
-Interim-Special-Final*
5651888
5651888
59.275 770.575 213.3901,043.240
]] 5.1]
]] 55.0]
]]67.0]
2009 73 73 865.415 4.6 53.6 14.8
2008 85 68.88 816.572 7.4 63.5 116.02007 30 22.15 262.588 2.0 41.9 63.7
2006 20 14.55 172.490 2.7 30.8 103.6* The Board recommended a final single tier dividend of 18 sen per share for the financial year
ended 31 December 2010 payable on 10 June 2011.

19
SharePerformance
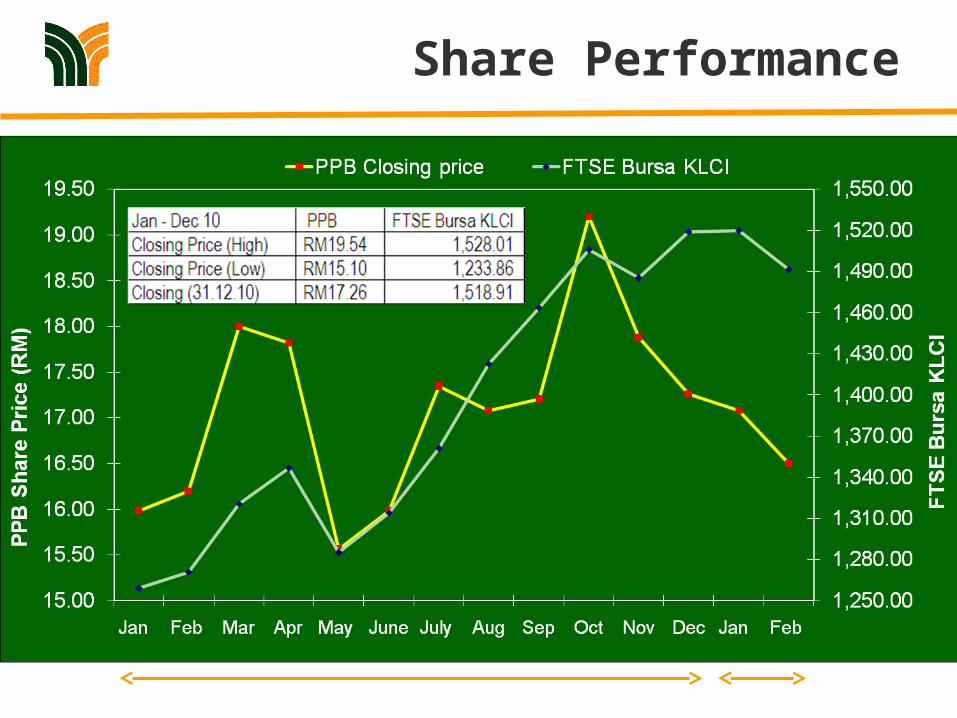
Share Performance
2010 2011

21
Prospectsfor
2011

22
Prospects for 2011
Rising commodity prices and fuel costs, coupled with fluctuating currency exchange rates are the main challenging factors which are expected to impact the Group’s operating results for 2011.
The outlook for consumer demand in Malaysia and the Asian region remains positive. The Group is confident that the performance for 2011 will be satisfactory.

?23
Questions&
Answers