ppa 415 – research methods in public administration lecture 6 – one-sample and two-sample tests
Post on 22-Dec-2015
222 views
TRANSCRIPT
PPA 415 – Research Methods in Public Administration
Lecture 6 – One-Sample and Two-Sample Tests

Five-step Model of Hypothesis Testing
Step 1. Making assumptions and meeting test requirements.
Step 2. Stating the null hypothesis. Step 3. Selecting the sampling distribution
and establishing the critical region. Step 4. Computing the test statistic. Step 5. Making a decision and interpreting
the results of the test.
Five-step Model of Hypothesis Testing – One-sample Z Scores
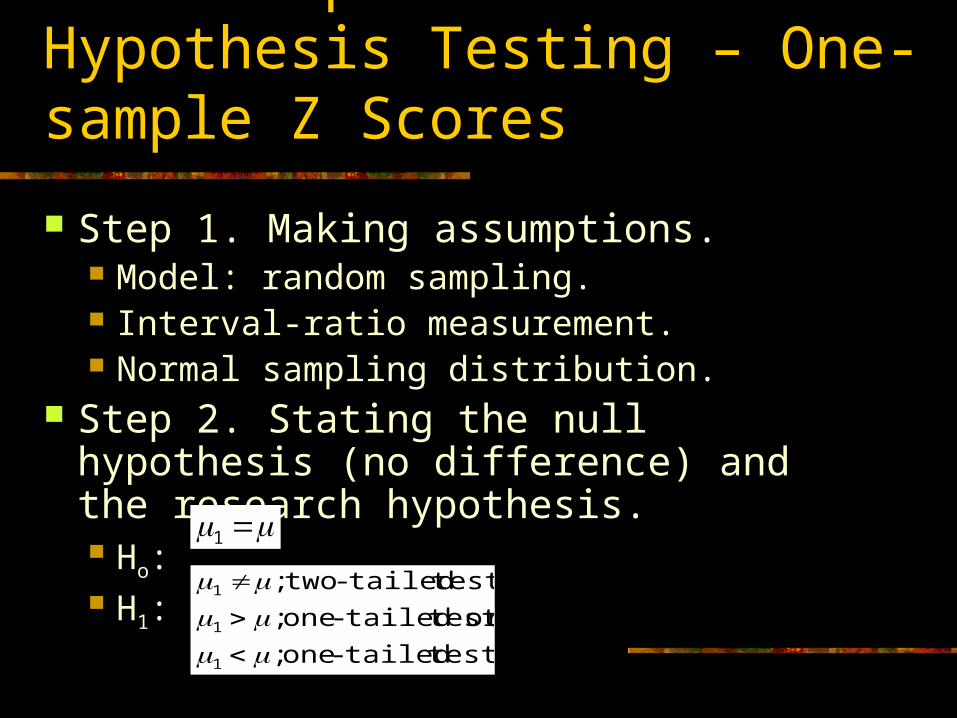
Step 1. Making assumptions. Model: random sampling. Interval-ratio measurement. Normal sampling distribution.
Step 2. Stating the null hypothesis (no difference) and the research hypothesis. Ho: H1:
1
testtailed-one;
or test tailed-one;
testtailed-two;
1
1
1
Five-step Model of Hypothesis Testing – One-sample Z Scores
Step 3. Selecting the sampling distribution and establishing the critical region. Sampling distribution = Z distribution. Α=0.05. Z(critical)=1.96 (two-tailed); +1.65 or -1.65
(two-tailed).
Five-step Model of Hypothesis Testing – One-sample Z Scores
Step 4. Computing the test statistic. Use z-formula.
Step 5. Making a decision. Compare z-critical to z-obtained. If z-
obtained is greater in magnitude than z-critical, reject null hypothesis. Otherwise, accept null hypothesis.

Five-Step Model: Critical Choices
Choice of alpha level: .05, .01, .001. Selection of research hypothesis.
Two-tailed test: research hypothesis simplify states that means of sample and population are different.
One-tailed test: mean of sample is larger or smaller than mean of population.
Type of error to maximize: Type I or Type II. Type I – rejecting a null hypothesis that is true. Type II – accepting a null hypothesis that is false.
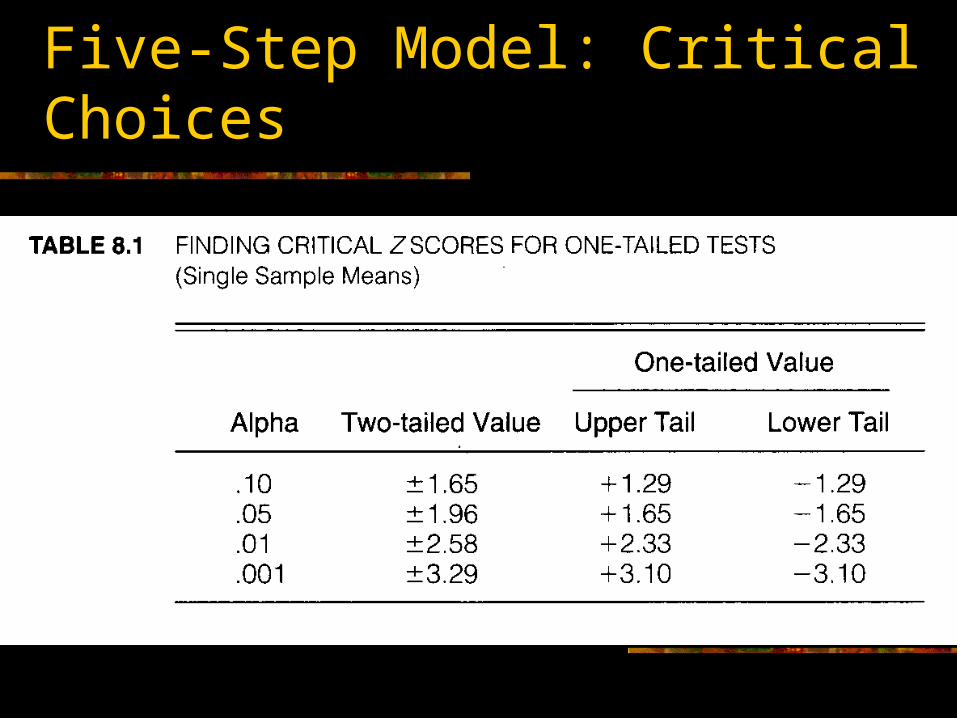
Five-Step Model: Critical Choices
Five-step Model: Example
Is the average age of voters in the 2000 National Election Study different than the average age of all adults in the U.S. population?

Five-step Model of Hypothesis Testing – Large-sample Z Scores
Step 1. Making assumptions. Model: random sampling. Interval-ratio measurement. Normal sampling distribution.
Step 2. Stating the null hypothesis (no difference) and the research hypothesis. Ho: H1:
24.451
testtailed-two;1

Five-step Model of Hypothesis Testing – Large-sample Z Scores
Step 3. Selecting the sampling distribution and establishing the critical region. Sampling distribution = Z distribution. α=0.05. Z(critical)=1.96 (two-tailed)

Five-step Model of Hypothesis Testing – Large-sample Z Scores
Step 4. Computing the test statistic.
Step 5. Making a decision.
67.44217.
97.1
179888.17
24.4521.47)(
N
XobtainedZ
population age voting theolder thantly significan is sample The
.difference no of hypothesis null Reject the
96.167.4)()(
criticalZobtainedZ
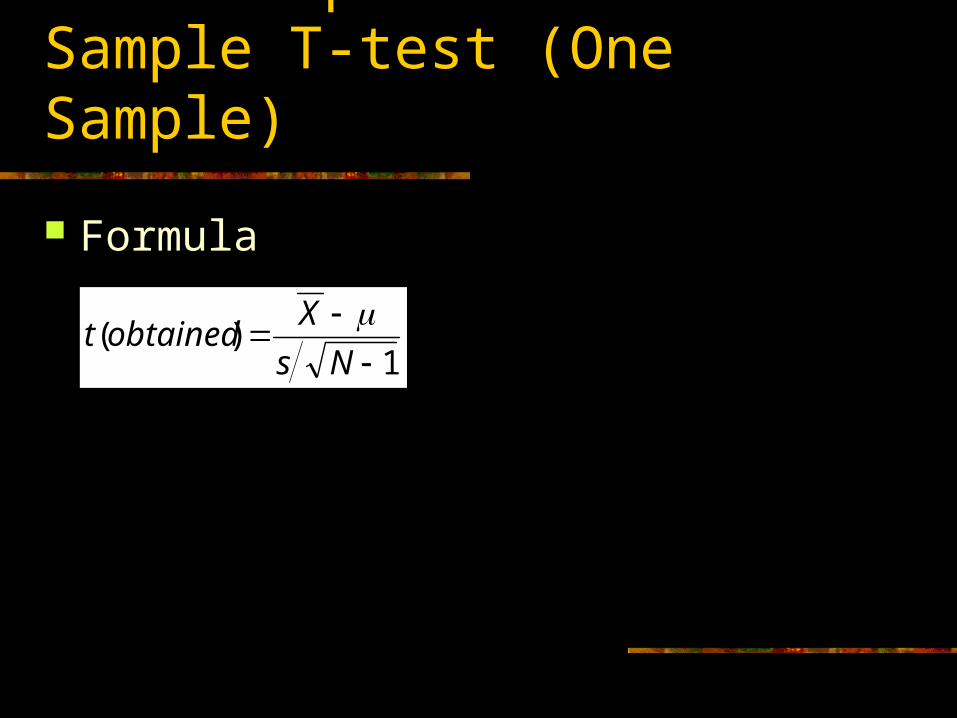
Five-Step Model: Small Sample T-test (One Sample)
Formula
1)(
Ns
Xobtainedt
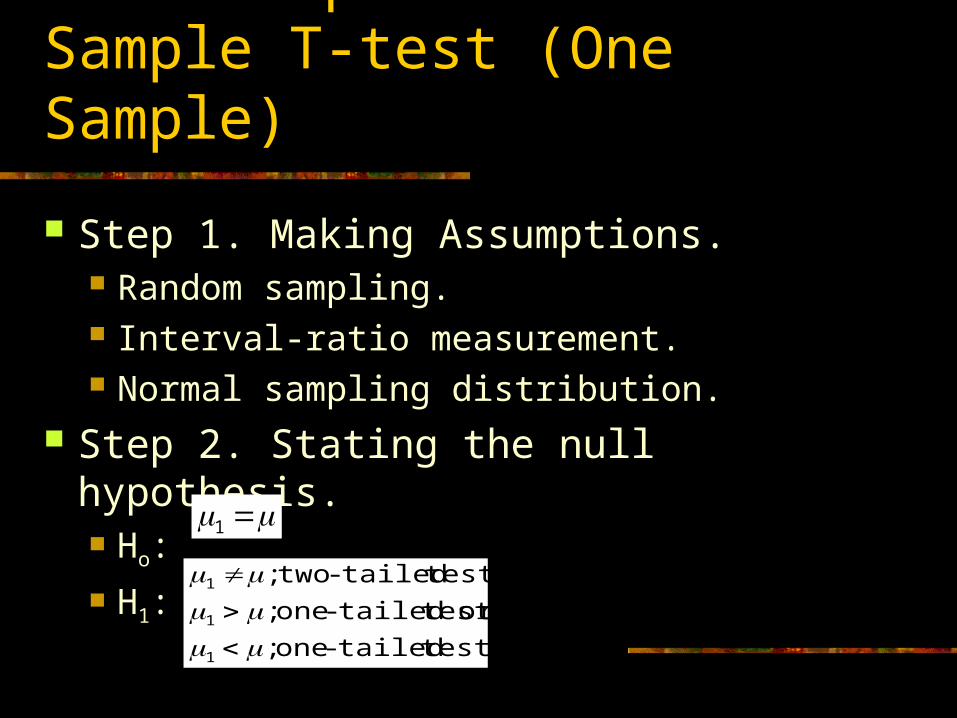
Five-Step Model: Small Sample T-test (One Sample)
Step 1. Making Assumptions. Random sampling. Interval-ratio measurement. Normal sampling distribution.
Step 2. Stating the null hypothesis. Ho:
H1:
1
testtailed-one;
or test tailed-one;
testtailed-two;
1
1
1

Five-step Model of Hypothesis Testing – One-sample Z Scores
Step 3. Selecting the sampling distribution and establishing the critical region. Sampling distribution = t distribution. Α=0.05. Df=N-1. t(critical) from Appendix B, p. 359 in Healey.
Five-step Model of Hypothesis Testing – One-sample Z Scores
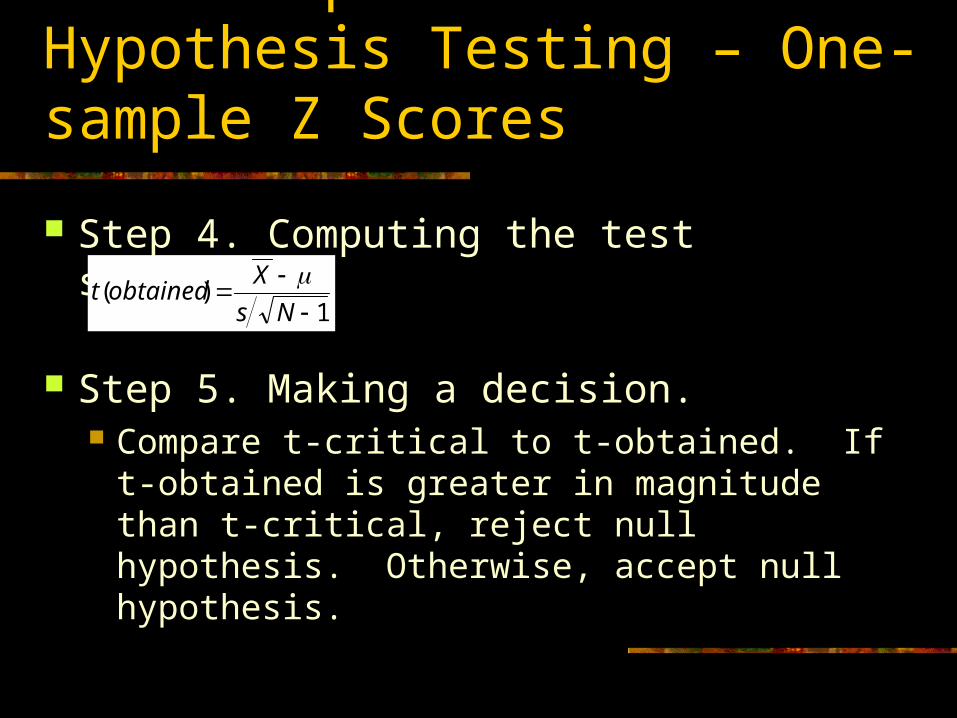
Step 4. Computing the test statistic.
Step 5. Making a decision. Compare t-critical to t-obtained. If t-obtained
is greater in magnitude than t-critical, reject null hypothesis. Otherwise, accept null hypothesis.
1)(
Ns
Xobtainedt

Five-step Model of Hypothesis Testing – One-sample Z Scores
Is the average age of individuals in the JCHA 2000 sample survey older than the national average age for all adults? (One-tailed).
Five-Step Model: Small Sample T-test (One Sample) – JCHA 2000
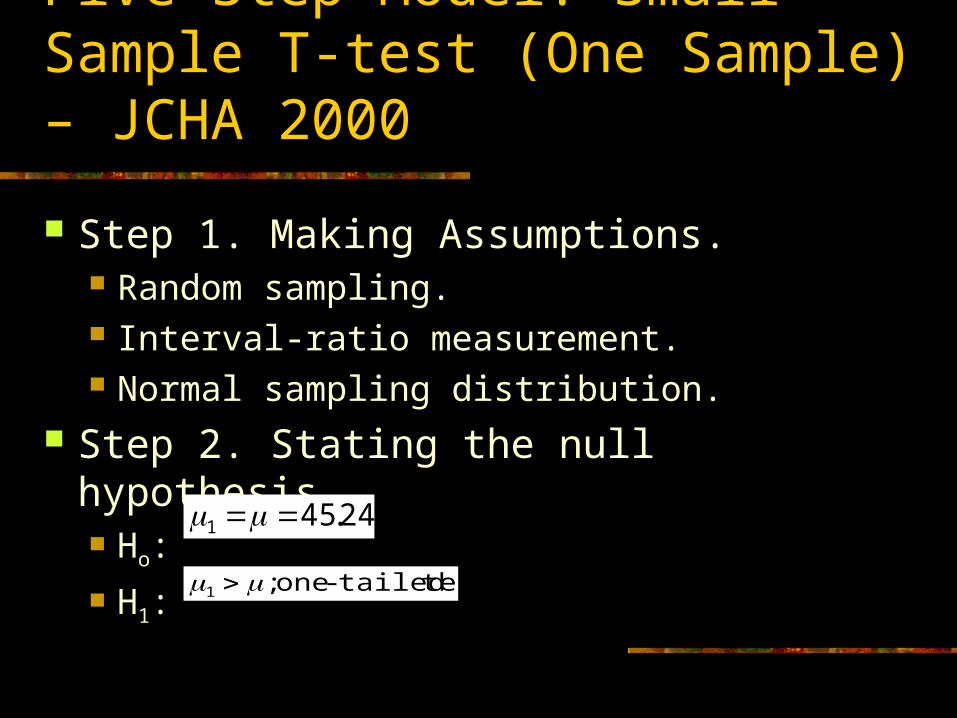
Step 1. Making Assumptions. Random sampling. Interval-ratio measurement. Normal sampling distribution.
Step 2. Stating the null hypothesis. Ho:
H1:
24.451
testtailed-one;1
Five-Step Model: Small Sample T-test (One Sample) – JCHA 2000
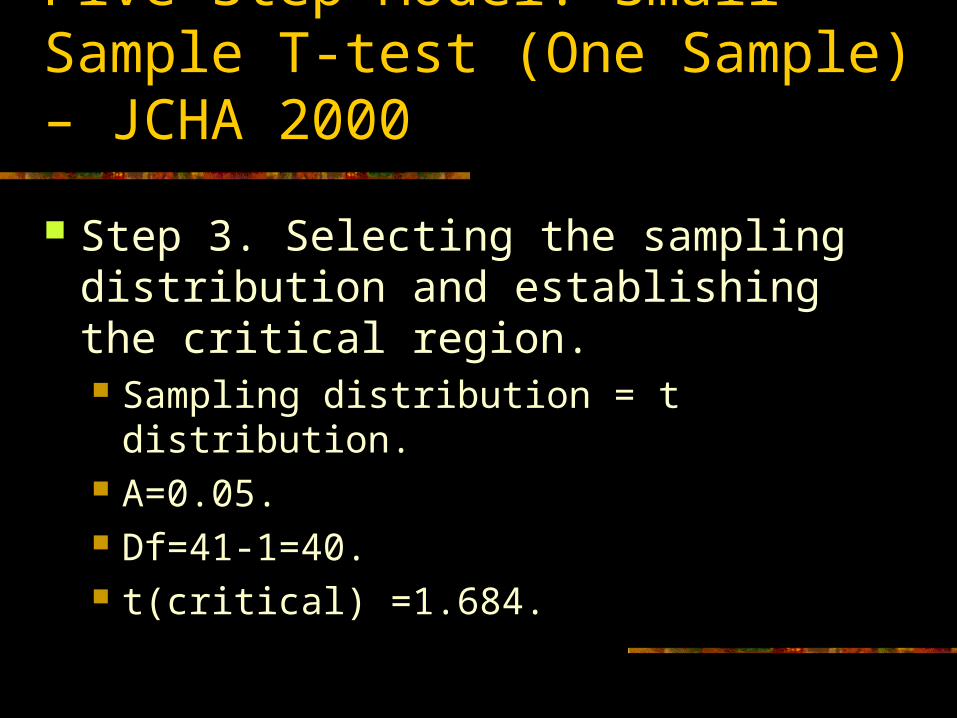
Step 3. Selecting the sampling distribution and establishing the critical region. Sampling distribution = t distribution. Α=0.05. Df=41-1=40. t(critical) =1.684.
Five-Step Model: Small Sample T-test (One Sample) – JCHA 2000
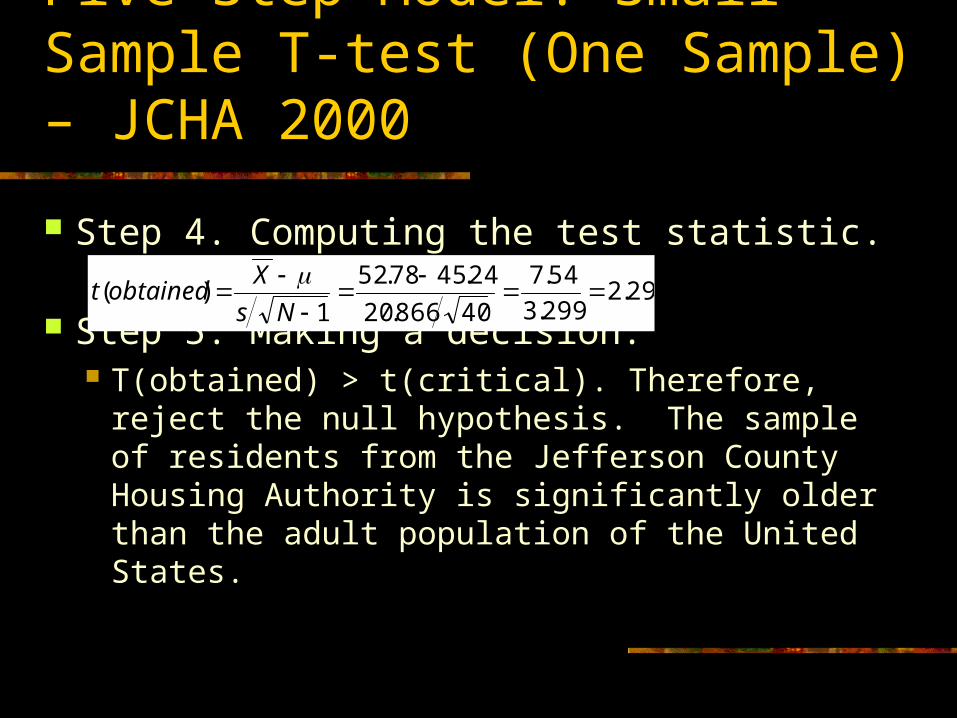
Step 4. Computing the test statistic.
Step 5. Making a decision. T(obtained) > t(critical). Therefore, reject the
null hypothesis. The sample of residents from the Jefferson County Housing Authority is significantly older than the adult population of the United States.
29.2299.3
54.7
40866.20
24.4578.52
1)(
Ns
Xobtainedt
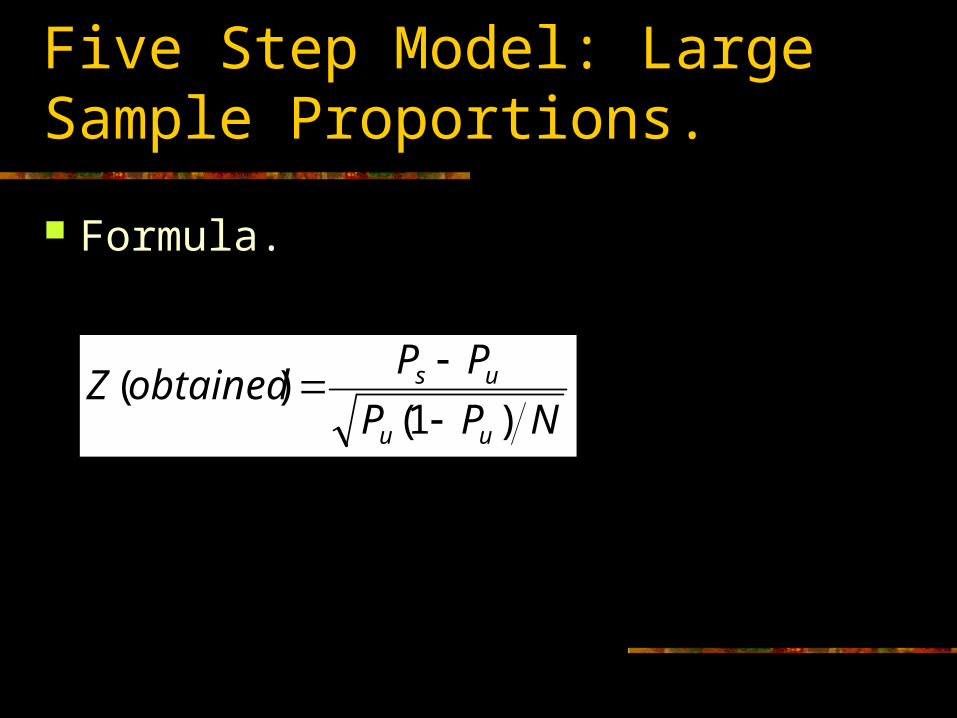
Five Step Model: Large Sample Proportions.
Formula.
NPP
PPobtainedZ
uu
us
)1()(

Five Step Model: Large Sample Proportions
Step 1. Making assumptions. Model: random sampling. Nominal measurement. Normal shaped sampling distribution.
Step 2. Stating the null hypothesis (no difference) and the research hypothesis. Ho: H1:
uu PP 1
testtailed-one;
or test tailed-one;
testtailed-two;
1
1
1
PP
PP
PP
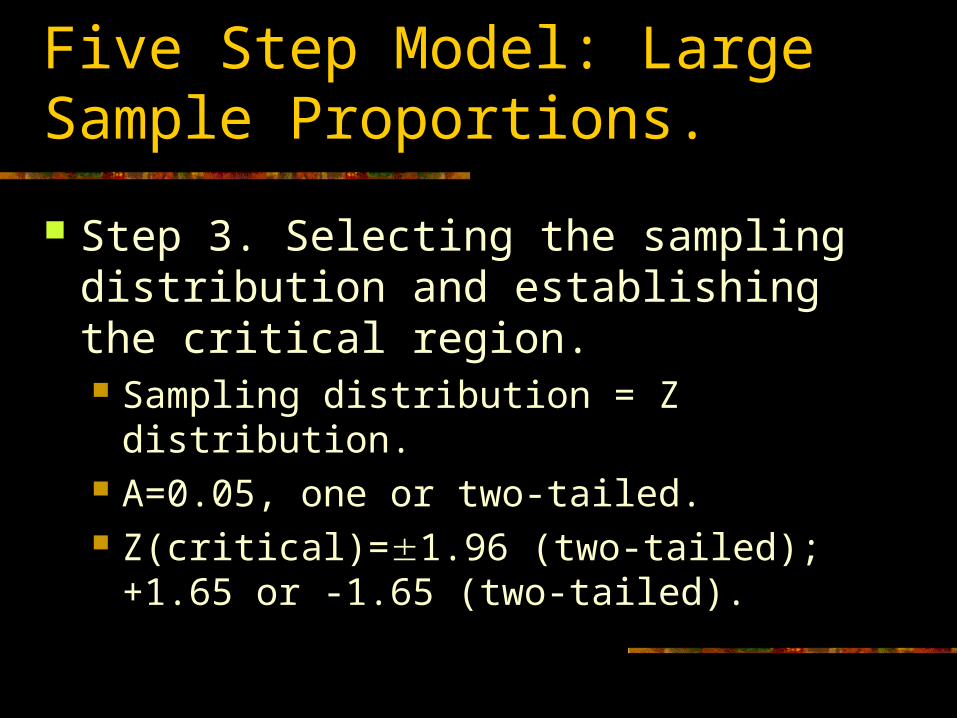
Five Step Model: Large Sample Proportions.
Step 3. Selecting the sampling distribution and establishing the critical region. Sampling distribution = Z distribution. Α=0.05, one or two-tailed. Z(critical)=1.96 (two-tailed); +1.65 or -1.65
(two-tailed).
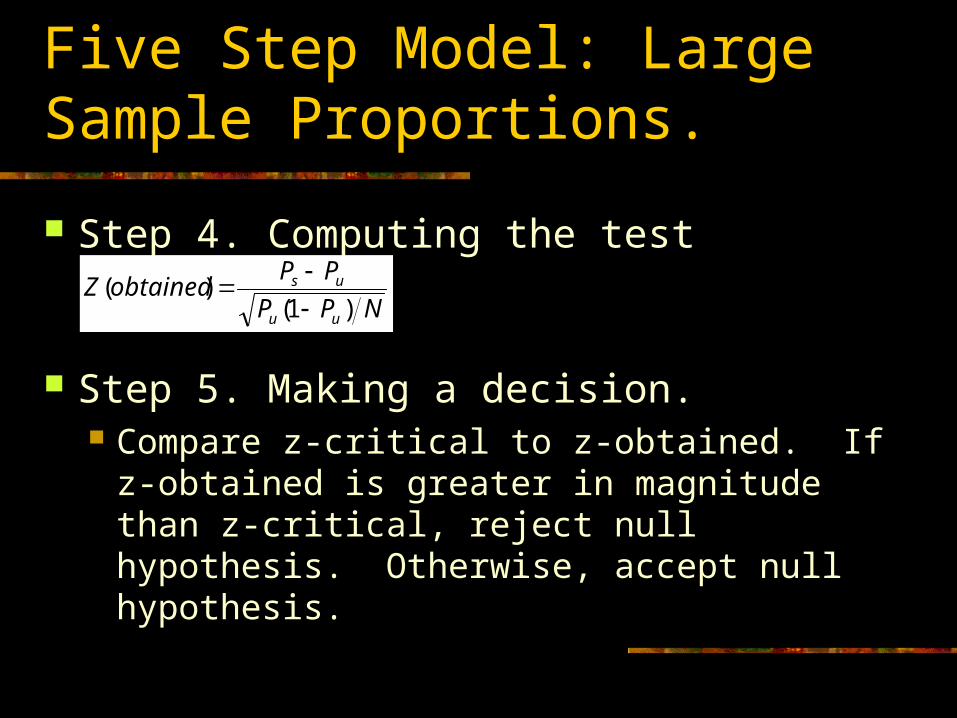
Five Step Model: Large Sample Proportions.
Step 4. Computing the test statistic.
Step 5. Making a decision. Compare z-critical to z-obtained. If z-
obtained is greater in magnitude than z-critical, reject null hypothesis. Otherwise, accept null hypothesis.
NPP
PPobtainedZ
uu
us
)1()(

Five Step Model: Large Sample Proportions.
Do residents of Birmingham, Alabama, have significantly different homeownership rates than all residents of the United States?

Five Step Model: Large Sample Proportions. Homeownership in Birmingham, Alabama
Step 1. Making assumptions. Model: random sampling. Nominal measurement. Normal shaped sampling distribution.
Step 2. Stating the null hypothesis (no difference) and the research hypothesis. Ho: H1:
%2.671 uu PP
testtailed-two;1 PP
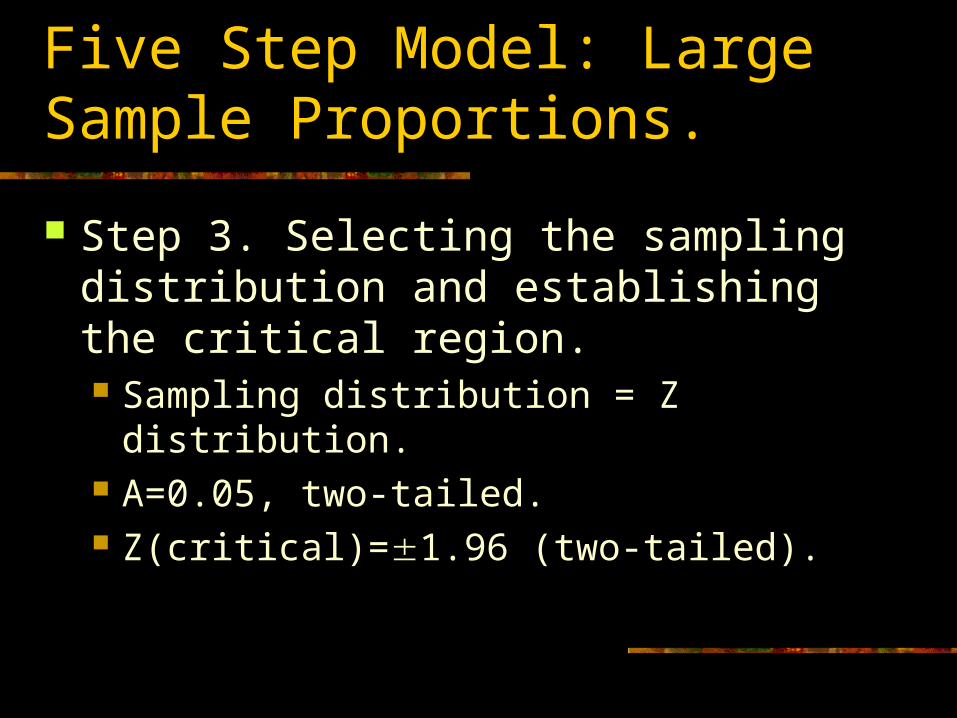
Five Step Model: Large Sample Proportions.
Step 3. Selecting the sampling distribution and establishing the critical region. Sampling distribution = Z distribution. Α=0.05, two-tailed. Z(critical)=1.96 (two-tailed).
Five Step Model: Large Sample Proportions.
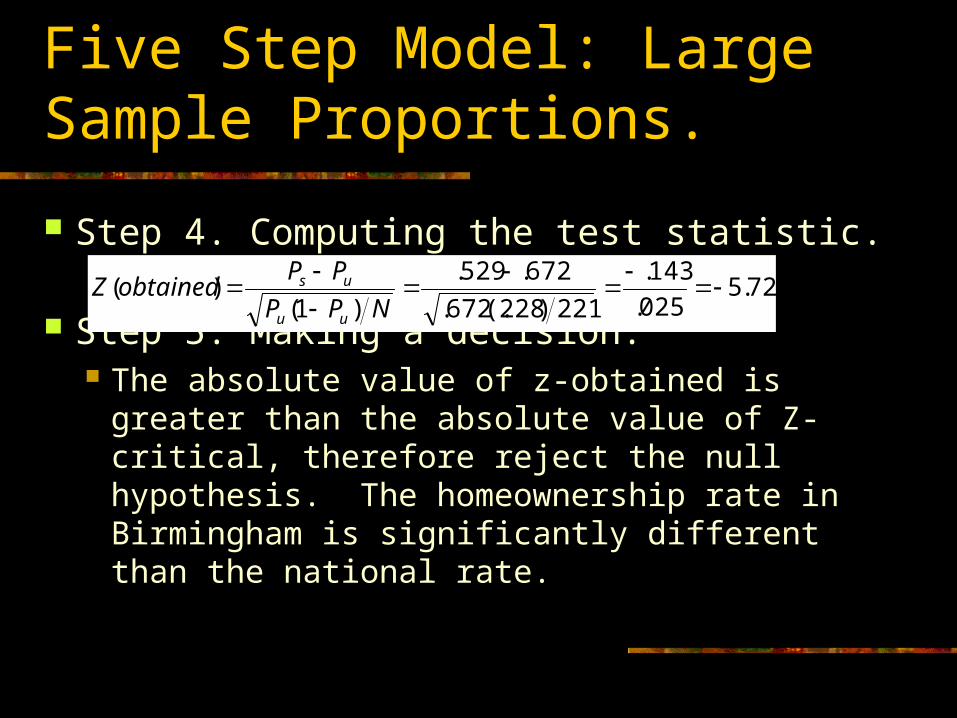
Step 4. Computing the test statistic.
Step 5. Making a decision. The absolute value of z-obtained is greater
than the absolute value of Z-critical, therefore reject the null hypothesis. The homeownership rate in Birmingham is significantly different than the national rate.
72.5025.
143.
221)228(.672.
672.529.
)1()(
NPP
PPobtainedZ
uu
us
Two-Sample Models – Large Samples
Most of the time we do not have the population means or proportions. All we can do is compare the means or proportions of population subsamples.
Adds the additional assumption of independent random samples.
Two-Sample Models – Large Samples
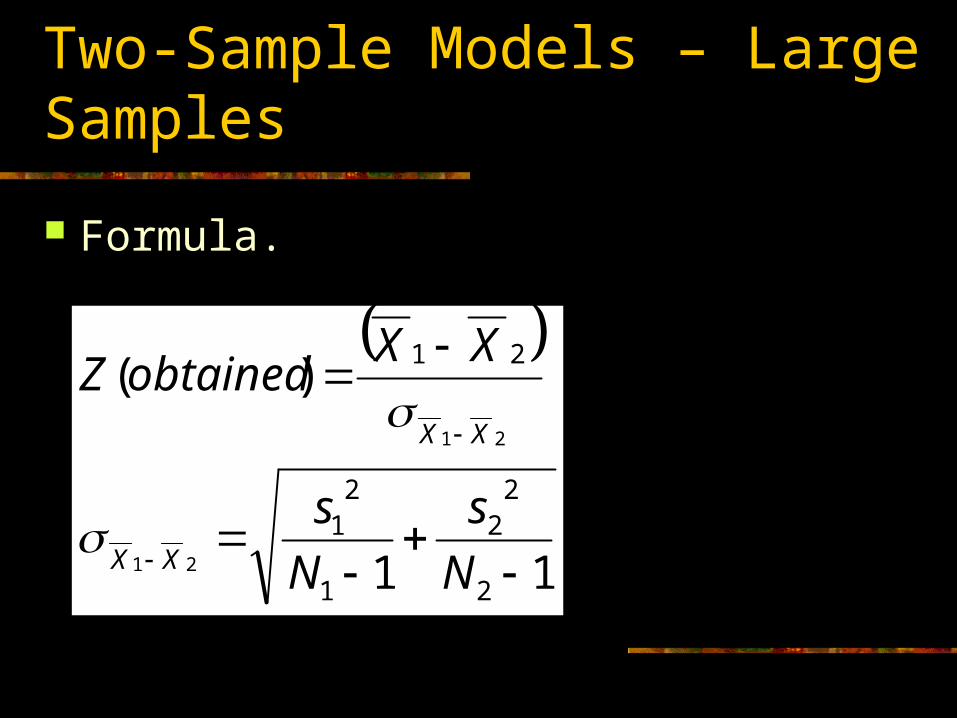
Formula.
11
)(
2
22
1
21
21
21
21
N
s
N
s
XXobtainedZ
XX
XX

Five-Step Model – Large Two-Sample Tests (Z Distribution)
Step 1. Making assumptions. Model: Independent random samples. Interval-ratio measurement. Normal sampling distribution.
Step 2. Stating the null hypothesis (no difference) and the research hypothesis. Ho: H1:
21
testtailed-one;
or test tailed-one;
testtailed-two;
21
21
21
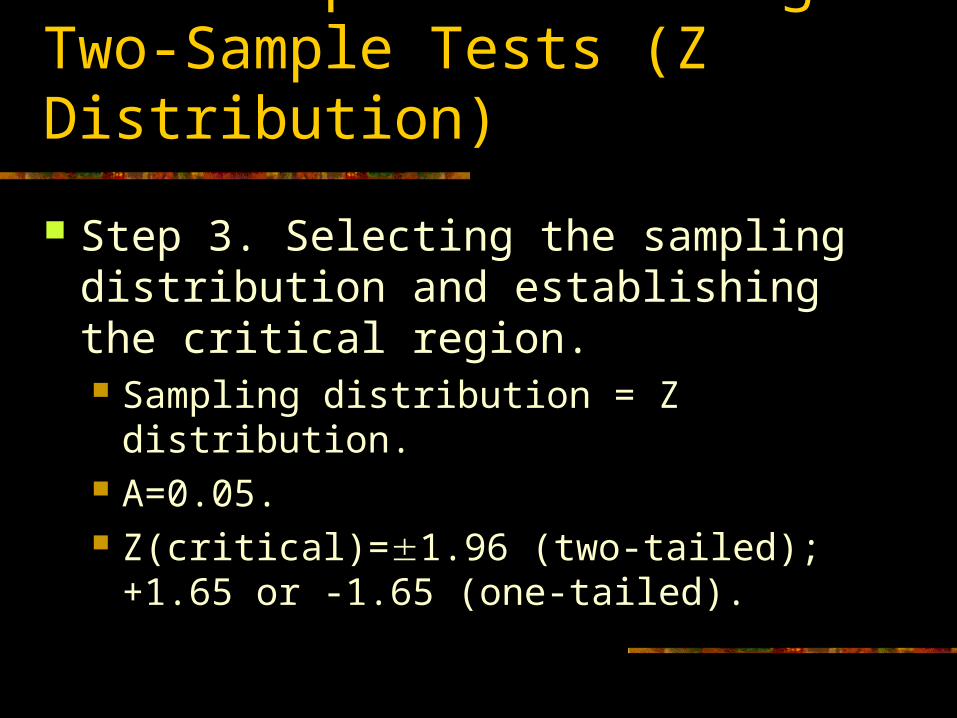
Five-Step Model – Large Two-Sample Tests (Z Distribution)
Step 3. Selecting the sampling distribution and establishing the critical region. Sampling distribution = Z distribution. Α=0.05. Z(critical)=1.96 (two-tailed); +1.65 or -1.65
(one-tailed).
Five-Step Model – Large Two-Sample Tests (Z Distribution)
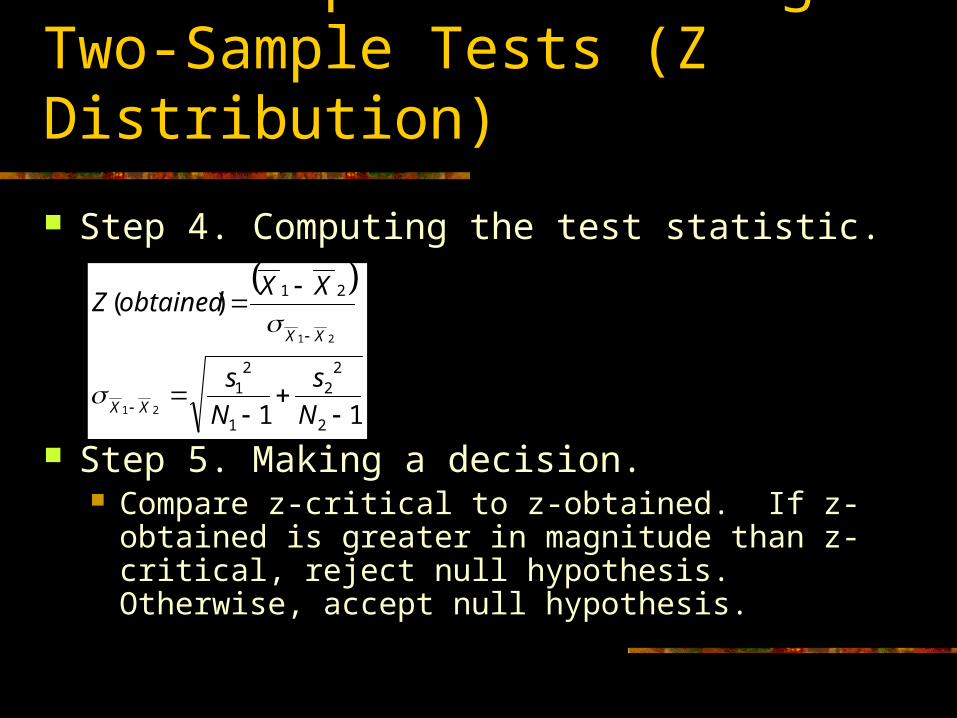
Step 4. Computing the test statistic.
Step 5. Making a decision. Compare z-critical to z-obtained. If z-obtained is
greater in magnitude than z-critical, reject null hypothesis. Otherwise, accept null hypothesis.
11
)(
2
22
1
21
21
21
21
N
s
N
s
XXobtainedZ
XX
XX

Five-Step Model – Large Two-Sample Tests (Z Distribution)
Do non-white citizens of Birmingham, Alabama, believe that discrimination is more of a problem than white citizens?
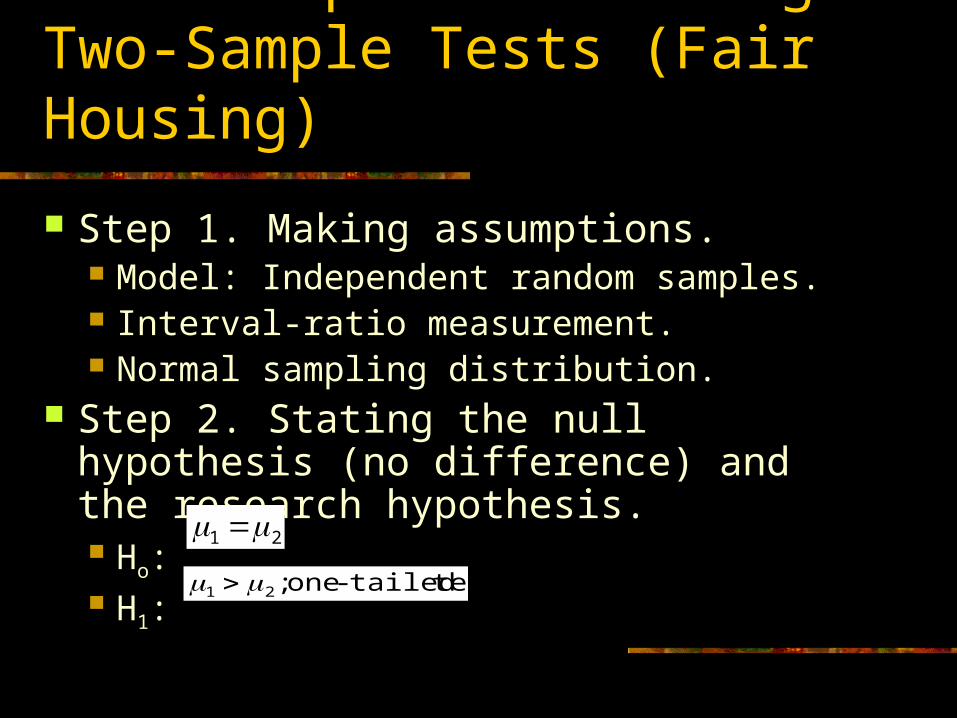
Five-Step Model – Large Two-Sample Tests (Fair Housing)
Step 1. Making assumptions. Model: Independent random samples. Interval-ratio measurement. Normal sampling distribution.
Step 2. Stating the null hypothesis (no difference) and the research hypothesis. Ho: H1:
21
testtailed-one;21
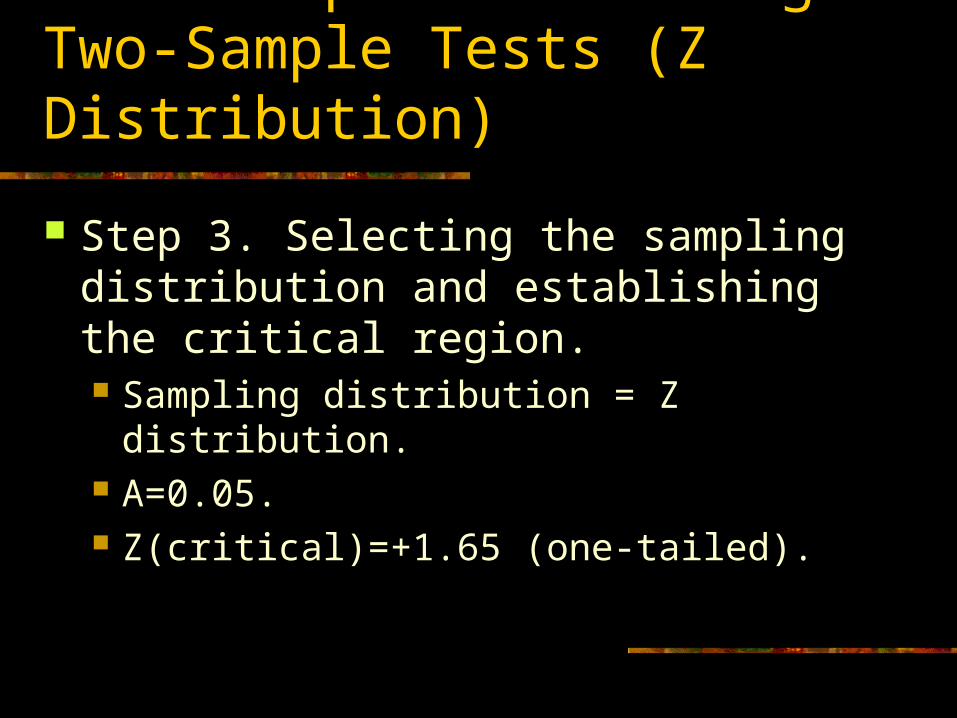
Five-Step Model – Large Two-Sample Tests (Z Distribution)
Step 3. Selecting the sampling distribution and establishing the critical region. Sampling distribution = Z distribution. Α=0.05. Z(critical)=+1.65 (one-tailed).

Five-Step Model – Large Two-Sample Tests (Z Distribution)
Step 4. Computing the test statistic.
Step 5. Making a decision. Z(obtained) is greater than Z(critical), therefore reject
the null hypothesis of no difference. Non-whites believe that discrimination is more of a problem in Birmingham.
224.3
173.
56.
022.008.
56.
42966.
141058.1
14.270.2
11
)(22
2
22
1
21
21
Ns
Ns
XXobtainedZ
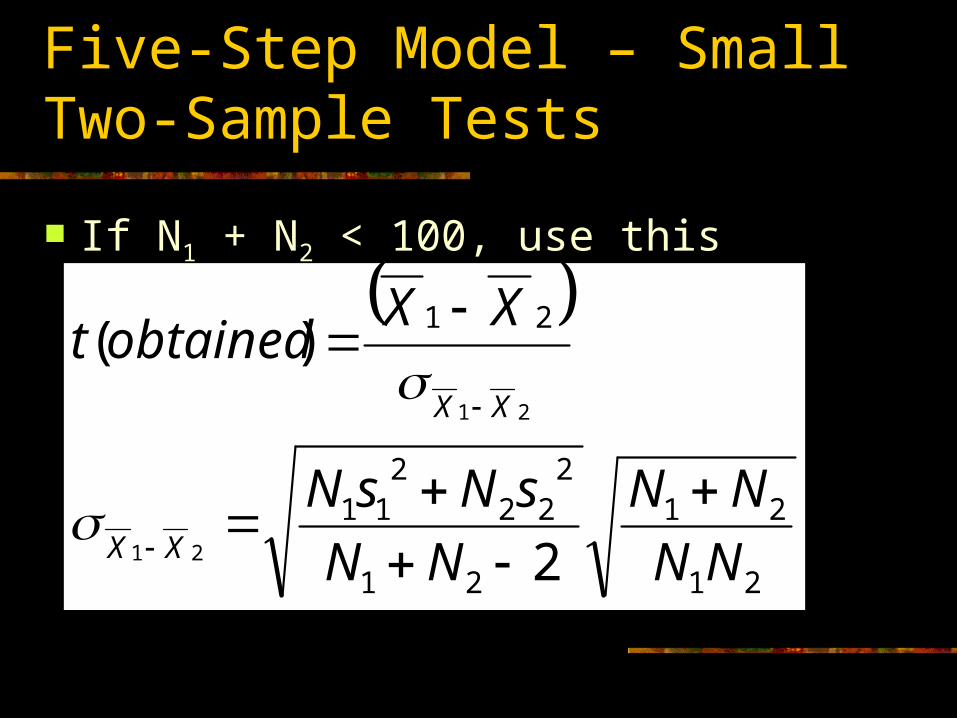
Five-Step Model – Small Two-Sample Tests
If N1 + N2 < 100, use this formula.
21
21
21
222
211
21
2
)(
21
21
NN
NN
NN
sNsN
XXobtainedt
XX
XX
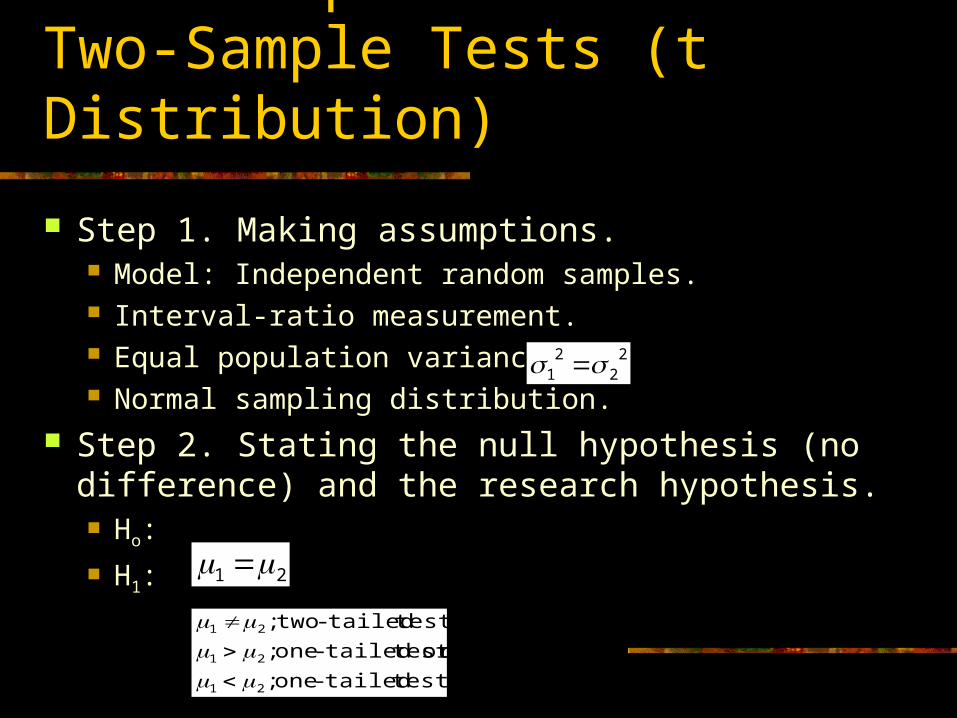
Five-Step Model – Small Two-Sample Tests (t Distribution)
Step 1. Making assumptions. Model: Independent random samples. Interval-ratio measurement. Equal population variances Normal sampling distribution.
Step 2. Stating the null hypothesis (no difference) and the research hypothesis. Ho:
H1:
21
testtailed-one;
or test tailed-one;
testtailed-two;
21
21
21
22
21

Five-Step Model – Small Two-Sample Tests (t Distribution)
Step 3. Selecting the sampling distribution and establishing the critical region. Sampling distribution = t distribution. Α=0.05. Df=N1+N2-2 t(critical). See Appendix B, p. 359.

Five-Step Model – Small Two-Sample Tests (t Distribution)
Step 4. Computing the test statistic.
Step 5. Making a decision. Compare t-critical to t-obtained. If t-obtained is
greater in magnitude than t-critical, reject null hypothesis. Otherwise, accept null hypothesis.
21
21
21
222
211
21
2
)(
21
21
NN
NN
NN
sNsN
XXobtainedt
XX
XX

Five-Step Model – Small Two-Sample Tests (t Distribution)
Did white and nonwhite residents of the Jefferson County Housing Authority have significantly different lengths of residence in 2000?

Five-Step Model – Small Two-Sample Tests (JCHA 2000)
Step 1. Making assumptions. Model: Independent random samples. Interval-ratio measurement. Equal population variances Normal sampling distribution.
Step 2. Stating the null hypothesis (no difference) and the research hypothesis. Ho:
H1:
21
testtailed-two;21
22
21

Five-Step Model – Small Two-Sample Tests (JCHA 2000)
Step 3. Selecting the sampling distribution and establishing the critical region. Sampling distribution = t distribution. Α=0.05, two-tailed. Df=N1+N2-2=14+25-2=37 t(critical) from Appendix B = 2.042

Five-Step Model – Small Two-Sample Tests (t Distribution)
Step 4. Computing the test statistic.
Step 5. Making a decision. Z(obtained) is less than Z(critical) in magnitude.
Accept the null hypothesis. Whites and nonwhites in the JCHA 2000 survey do not have different lengths of residence in public housing.
448.2002.28
63.12
)3338(.4909.84
63.12
1114.7147.7138
63.12
)14(251425
21425)744.93(25)337.56(14
84.8221.70
2
)(22
21
21
21
222
211
21
NNNN
NNsNsN
XXobtainedZ
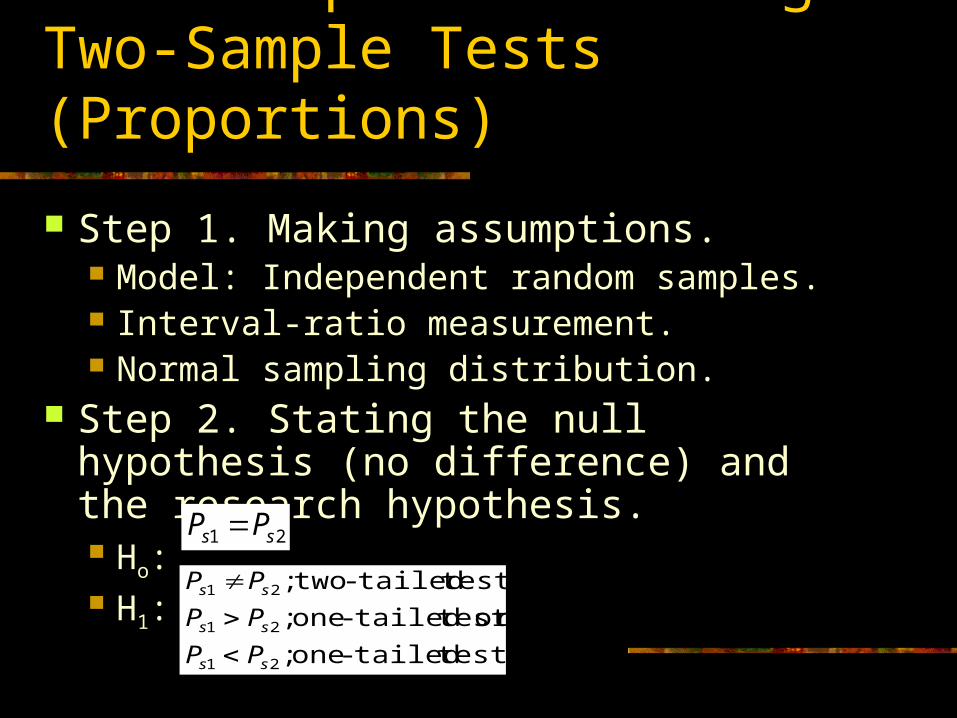
Five-Step Model – Large Two-Sample Tests (Proportions)
Step 1. Making assumptions. Model: Independent random samples. Interval-ratio measurement. Normal sampling distribution.
Step 2. Stating the null hypothesis (no difference) and the research hypothesis. Ho: H1:
21 ss PP
testtailed-one;
or test tailed-one;
testtailed-two;
21
21
21
ss
ss
ss
PP
PP
PP
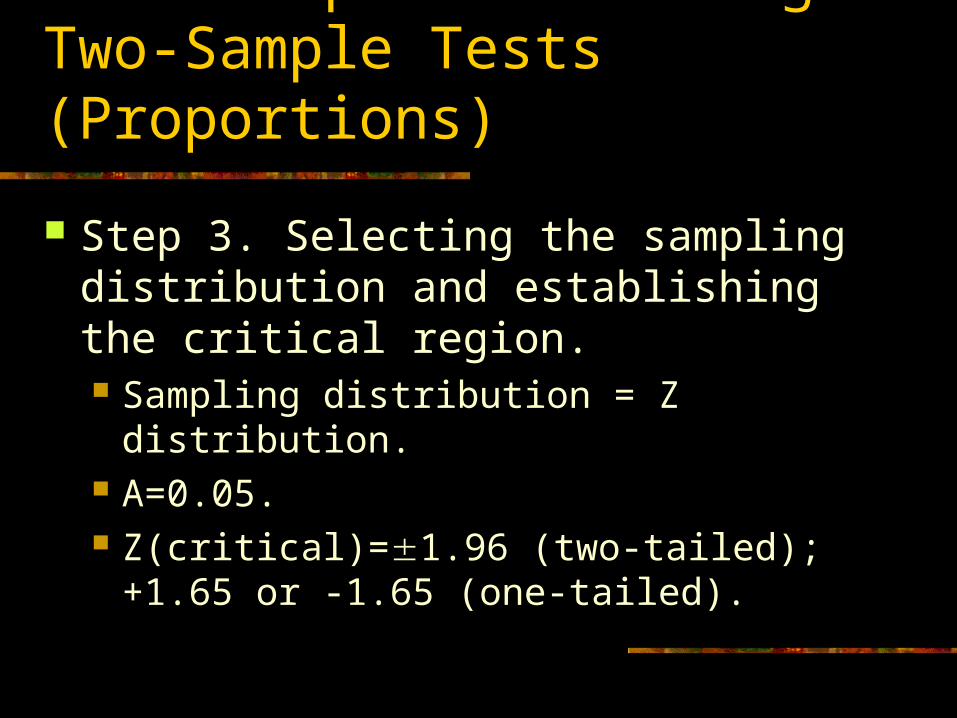
Five-Step Model – Large Two-Sample Tests (Proportions)
Step 3. Selecting the sampling distribution and establishing the critical region. Sampling distribution = Z distribution. Α=0.05. Z(critical)=1.96 (two-tailed); +1.65 or -1.65
(one-tailed).

Five-Step Model – Large Two-Sample Tests (Proportions)
Step 4. Computing the test statistic.
Step 5. Making a decision. Compare z-critical to z-obtained. If z-obtained is
greater in magnitude than z-critical, reject null hypothesis. Otherwise, accept null hypothesis.
21
2211
2121
21
)()1(
)(
21
21
NN
PNPNP
NNNNPP
PPobtainedZ
ssu
uupp
pp
ss
ss
ss

Five-Step Model – Large Two-Sample Tests (Proportions)
Did Presidents Ford and Carter have different approval rates for major disaster declarations?

Five-Step Model – Large Two-Sample Proportions (Example)
Step 1. Making assumptions. Model: Independent random samples. Interval-ratio measurement. Normal sampling distribution.
Step 2. Stating the null hypothesis (no difference) and the research hypothesis. Ho: H1:
21 ss PP
testtailed-two;21 ss PP

Five-Step Model – Large Two-Sample Proportions (Example)
Step 3. Selecting the sampling distribution and establishing the critical region. Sampling distribution = Z distribution. Α=0.05. Z(critical)=1.96 (two-tailed).
Five-step Model – Large Two-sample Proportions (Example)
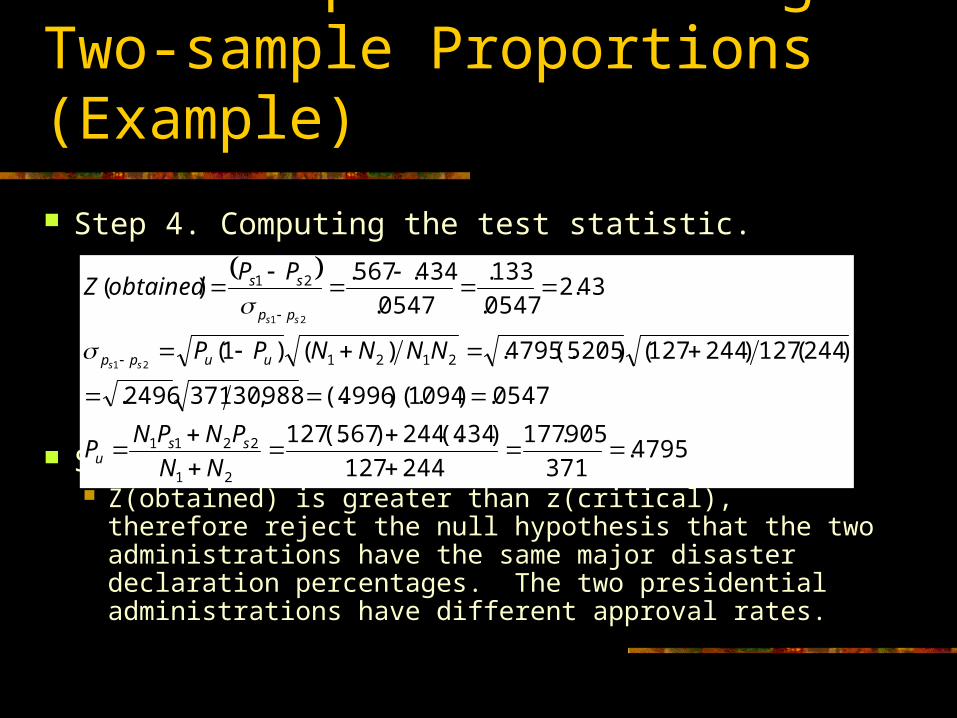
Step 4. Computing the test statistic.
Step 5. Making a decision. Z(obtained) is greater than z(critical), therefore reject the
null hypothesis that the two administrations have the same major disaster declaration percentages. The two presidential administrations have different approval rates.
4795.371
905.177
244127
)434(.244)567(.127
0547.)1094)(.4996(.988,303712496.
)244(127)244127()5205(.4795.)()1(
43.20547.
133.
0547.
434.567.)(
21
2211
2121
21
21
21
NN
PNPNP
NNNNPP
PPobtainedZ
ssu
uupp
pp
ss
ss
ss