powerpoint presentationeditool.vdm.berlin/archiv_akademie/1498662921_vdm_london...contrary to the...
TRANSCRIPT

June 2017
Economic Outlook
Metals Market Economic Drivers
Frederick R. Demler, Ph.D.
Executive Vice President, LME Metals
INTL FCStone Financial Inc. – FCM Division
+1-917-297-3045; [email protected]

The INTL FCStone Inc. group of companies conducts a global full-service, integrated commodities, futures, investment banking, derivatives trading and risk-management business. Our
research department may provide research, market commentary and general or specific analyses as may be requested from time to time by our clients, which may reflect opinions that are
contrary to the illustrations in this presentation. INTL FC Stone Inc. has adopted policies designed to preserve the independence of our research analysts. These policies prohibit non-
research personnel from influencing research personnel to issue favorable research or offer to change a research rating or price target as consideration for an inducement to obtain
business or other compensation. The INTL FCStone proprietary trading desks and investing businesses may make investment decisions that are inconsistent with the materials in this
document. INTL FCStone Inc. and its affiliates, officers, directors, and employees, will from time to time have long or short positions in, act as principal in, and buy or sell instruments the
derivatives that are identical or economically related to the derivatives referred to in this document.
This presentation is not an offer to sell or a solicitation of an offer to buy any derivative or security and is not a commitment to enter into any derivative or other transaction, and does not
create a binding obligation on INTL FCStone Inc. or any of its affiliates. This presentation does not constitute investment research or a personal recommendation or take into account the
particular investment objectives, financial situations, or needs of individual clients or recipients of this material. You are directed to seek professional and tax advice. Past performance is
not a guide to future performance, future returns are not guaranteed, and a loss of original capital may occur. Fluctuations in exchange rates could have adverse effects on the value or
price of, or income derived from, certain investments. Risks presented by commodities, futures (and options thereon), swaps and other OTC products (“derivatives”) depend upon the
terms of the transaction and your circumstances. Options are not suitable for all investors. Option buyers may lose their entire investment. Option sellers may have an unlimited loss.
Certain derivative contracts contain a variety of selling prices, knock out prices and accumulation periods and require an understanding of the contract’s specific pricing mechanisms
before you enter into such contracts. Derivatives generally involve credit risk, market risk, liquidity risk, funding risk, operational risk, legal and documentation risk, regulatory and tax risk.
You should refrain from entering into derivatives unless you fully understand the risks, including the extent of your potential loss. In evaluating risk, you should consider that an OTC
derivative transaction may be modified or terminated only by mutual consent of the original parties and subject to agreement on individually negotiated terms. Accordingly, it may not be
possible for you to modify, terminate or offset your obligations or your exposure to the risk associated with a transaction prior to its scheduled termination date.
In addition to the general risks associated with derivatives, highly customized derivative transactions may increase liquidity risk and introduce other significant risks. Leveraged
transactions may create exposure to substantial gains or losses in response to relatively small market fluctuations. INTL FCStone Inc. and its affiliates may from time to time take
proprietary positions and make a market in instruments identical or economically related to derivative transactions entered into with you, or may have an investment banking or other
commercial relationship with and access to information from the issuer(s) of securities, financial instruments or other interests underlying derivative transactions entered into with you. INTL
FCStone Inc. and its affiliates may choose to hedge their obligations by trading in derivatives. The costs associated with hedging activity could affect the market value of, or the price at
which we would be willing to enter into a transaction. Further, we may internalize and match order flow or route it externally for execution. If we choose to match orders internally, our
compensation is greater than if we execute the order externally. INTL FCStone Inc. and its affiliates make no representation, warranty or guarantee as to, and shall not be responsible for,
the accuracy or completeness of the information contained in this presentation and have no obligation to update the information.
Any illustrations provided are strictly hypothetical and no representation is being made that any person will, or is likely to achieve profits or losses similar to those examples. You are
advised to undertake an independent review of the potential legal, tax, regulatory and accounting implications of any derivatives transaction to determine whether derivatives or any
particular structure would be suitable for you, and if necessary seek professional advice. Derivatives give rise to substantial risk and are not suitable for all recipients of this presentation.
The INTL FC Stone Inc. group of companies act solely in the capacity of an arm’s length counterparty and not in the capacity of your financial adviser or fiduciary. Prior to undertaking any
transaction, you should discuss with your tax or other adviser how a particular transaction may affect you. Any opinions expressed are subject to change without notice and certain
information is based upon information from third party sources which we have not independently verified.
All references to and discussions of Structured OTC products are made solely on behalf of INTL FCStone Markets, LLC (“IFM”), a subsidiary of INTL FCStone Inc., and a member of the
National Futures Association (“NFA”) and provisionally registered with the U.S. Commodity Futures Trading Commission (“CFTC”) as a swap dealer. IFM’s products are available only to
individuals or firms who qualify under CFTC rules as an ‘Eligible Contract Participant’ (“ECP”).
References to exchange-traded futures and options are made on behalf of FCStone, Financial Inc (IFI) an NFA member and CFTC-registered futures commission merchant, and INTL
FCStone Ltd (“IFL”), a company registered in England and Wales (5616586) which is authorized & regulated by the Financial Conduct Authority [FRN 446717]. IFL is a wholly owned
subsidiary of INTL FCStone Inc., a public company incorporated in the United States, and listed on the NASDAQ stock exchange [Ticker: INTL].
No part of this presentation may be (i) copied, photocopied or duplicated in any form by any means or (ii) redistributed without the prior written consent of INTL FCStone Inc. © Copyright
2017. All rights reserved.
2
Disclaimer
This section of the page should be blank except when footnotes are present.
Economic Briefing
& Metal Outlook
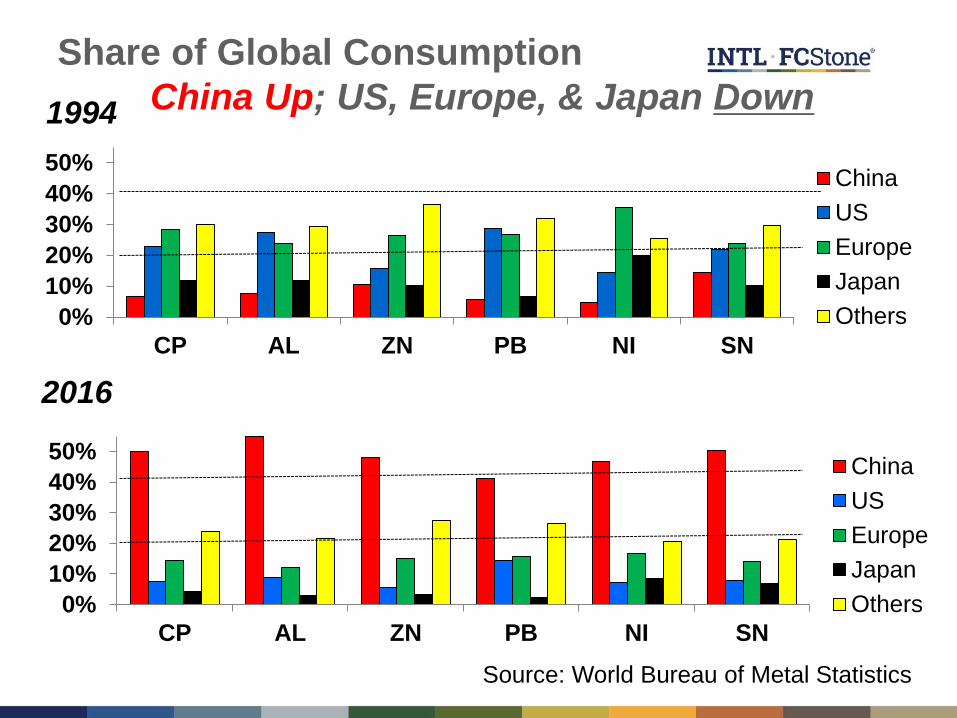
Share of Global Consumption
China Up; US, Europe, & Japan Down
2016
1994
Source: World Bureau of Metal Statistics
0%
10%
20%
30%
40%
50%
CP AL ZN PB NI SN
China
US
Europe
Japan
Others
0%
10%
20%
30%
40%
50%
CP AL ZN PB NI SN
China
US
Europe
Japan
Others

7
8
9
10
11
12
13
14
15
Feb-15 Jun-15 Oct-15 Feb-16 Jun-16 Oct-16 Feb-17
Fixed Asset Investment
Retail Sales
%yoy
China, GDP Growth
Sources: Bloomberg, INTL FCStone estimates
GDP
Fixed Asset Investment
vs Retail Sales
6.4
6.5
6.6
6.7
6.8
6.9
7.0
7.1
7.2
7.3
Q4 1
4
Q1 1
5
Q2 1
5
Q3 1
5
Q4 1
5
Q1 1
6
Q2 1
6
Q3 1
6
Q4 1
6
Q1 1
7
% yoy
-40
-30
-20
-10
0
10
20
30
40
50
Mar-15 Sep-15 Mar-16 Sep-16 Mar-17
Exports Imports
% yoy
GDP Growth is Accelerating
Fixed Investment Firming
Retail Sales Steady
Exports/Imports Slow
from Early ’17 Surge

-10
-5
0
5
10
15
20
25
30
Feb-15 Jun-15 Oct-15 Feb-16 Jun-16 Oct-16 Feb-17
%yoy
-10
-5
0
5
10
15
20
Feb-15 Jun-15 Oct-15 Feb-16 Jun-16 Oct-16 Feb-17
China, Sector Growth
Electricity Consumption Growth
Passenger Car Sales Growth
Sources: Bloomberg, INTL FCStone estimates
Rail Traffic Growth
%yoy
Real Estate Construction Growth
-15
-10
-5
0
5
10
15
20
Feb-15 Jun-15 Oct-15 Feb-16 Jun-16 Oct-16 Feb-17
%yoy
-2
0
2
4
6
8
10
Feb-15 Jun-15 Oct-15 Feb-16 Jun-16 Oct-16 Feb-17
%yoy
• Underlying Strength in Metals-
Using Sectors from Mid 2016,
• BUT Some Recent Softening
– Credit Tightening Slows
Construction
– Autos Hurt by Higher Taxes

China, IP and PMI
Industrial Production
Sources: Bloomberg, INTL FCStone estimates
PMI Index
%yoy
47
48
49
50
51
52
Feb-15 Jun-15 Oct-15 Feb-16 Jun-16 Oct-16 Feb-17
Govt
Caixin
5
5.5
6
6.5
7
7.5
8
Mar-15 Jul-15 Nov-15 Mar-16 Jul-16 Nov-16 Mar-17
• Mixed Signals in PMIs
• Official Caixin
– Domestic Demand Slows
– External Demand Firm
– Construction Slowing
• Govt Efforts to Rein in Credit
Growth (notably in Property)
• IP Steadies at 6.5% after
Early 2017 Surge
– Construction and Real
Estate Slow but Firm
– Investment Growth
Slows But Firm at 8%
– Private Investment Up

China, Some Inflation Concerns
Sources: Bloomberg, INTL FCStone estimates
New Residential Prices…
-8
-6
-4
-2
0
2
4
6
8
10
12
Jan/15 Jun/15 Nov/15 Apr/16 Sep/16 Feb/17
% yoy
0
0.5
1
1.5
2
2.5
3
Feb-15 Jun-15 Oct-15 Feb-16 Jun-16 Oct-16 Feb-17
CPI Core CPI
%yoy
Inflation Accelerates end ‘16
But Some Recent Tapering…
• Underpin by a Weaker
Commodity Prices and
Credit Tightening

China, Credit “Bubble”
0
50
100
150
200
250
300
2011 2012 2013 2014 2015 2016
% of GDP Corporate DebtHousehold DebtGovt Debt
190
195
200
205
210
215
220
Q115
Q215
Q315
Q415
Q116
Q216
Q316
Q416
Q117
% of GDP ,
Social
Financing
Moody’s Downgrades China
but still Investment Grade
• Concern:
– Debt Growth
– Government Stimulus
Officials Focused on
Financial Risks and
Maintaining Demand
• Focus: Slow Credit Growth
• Tighter Monetary Policy
– IR Up but Hold Steady
• Restrictions on Residential
Home Purchases
• Regulatory Crackdown on
Shadow Credit
• Regulators Slowing IPO
Approvals (Good and Bad)
22
23
23
24
24
25
25
26
26
27
27
May-15 Oct-15 Feb-16 Jun-16 Oct-16 Feb-17
Tau
sen
de trillion CNY
Shadow
Banking
Loans
8500
9000
9500
10000
10500
15000
17000
19000
21000
23000
25000
27000
May-15Oct-15 Feb-16 Jun-16 Oct-16 Feb-17
bn CNY bn CNY
Total Household Loans
Med & LongTerm(LHS)
ShortTerm(RHS)
Source: Bloomberg, INTL FCStone estimates

China, Summary
• Key Concern: High Debt (notably Private Debt) and Retain Growth
• Shift from Investment Growth to Consumer Economy & Structural Reforms
– SOE Debt Restructuring, Address Credit Risk/Property Bubble
– Investment to Consumer Econ; Clampdown on Pollution, Excess Cap
– Capital/Property Controls, Tighter Fiscal/Money Policies (Reign in Credit)
– Crackdown on Local Government Borrowing But Retain One Belt/One Road
• Growth Slowdown ‘15/16, Fiscal Stimulus Early ‘16, Firm End ‘16/Start ‘17,
– IR policy eased, credit growth boosts property sales,
– Strength in Construction & Fixed Investment (Power Grid, Railway)
– Business/Consumer Confidence Up, Imports Up, Corp Profits Up
• But Evidence of Recent Slowdown with Credit Tightening
– Auto Production/Sales Soft (with Tax Incentives cut)
– PMI mixed, IP slows, Construction Slows
• Overall: China Economy Growing at Steady Pace, Down from Late ’16/Early ‘17
• Pressure on RMB (But PBOC looks to hold Steady)
• Trump:: Softening/Delayed, Trump now working w China (Korea/own Problems)

-60
-40
-20
0
20
40
(15)
(10)
(5)
0
5
10
Feb/00 Jan/03 Nov/05 Sep/08 Jul/11 May/14 Apr/17
% yoy
(60)
(40)
(20)
0
20
40
60
Feb/00 Jan/03 Nov/05 Sep/08 Jul/11 May/14 Apr/17
% yoy
(25)
(20)
(15)
(10)
(5)
0
5
10
15
Jun/00 Feb/03 Oct/05 Jun/08 Feb/11 Oct/13 Jun/16
% yoy
48
50
52
54
56
58
60
62
Jul/14 Apr/15 Dec/15 Aug/16 Apr/17
Mfg Services
(4)
(3)
(2)
(1)
0
1
2
3
4
5
6
Jun/00 Feb/03 Oct/05 Jun/08 Feb/11 Oct/13 Jun/16
% yoy
United States Growth: Up
Housing
Starts
Vehicle Sales
PMI Index
Industrial Production
GDP
Gross Private
Fixed Investment
Sources: Bloomberg, INTL FCStone estimates
%yoy
Growth Trends Up
Economy is “Resilient”
But Mixed Signals:
• Unemployment Low,
AND Inflation low
Core Growth Good
• Payrolls, PMI, ISM,
Housing, Orders,
Consumers , Invest,
• Apr IP Up (weak Q1),
Weakness: Autos, Orders
Money Policy (IR Up)
(’17: 3x +1; ’18: 3x, ‘19: 3x
• Slow Purchases of
Treasury /Mortgage
Securities (no reinvest)
Trump Factor?
• Less Optimism Chng
• Infrastructure, Regs,
Trade,Tax Cuts, Health
• Political Headwinds

(40)
(30)
(20)
(10)
0
10
20
30
40
Feb/00 Jan/03 Nov/05 Sep/08 Jul/11 May/14 Apr/17
% yoy
-60
-40
-20
0
20
40
60
80
100
Feb/00 Dec/02 Oct/05 Aug/08 Jun/11 Apr/14 Feb/17
(15)
(10)
(5)
0
5
10
15
Jun/00 Feb/03 Oct/05 Jun/08 Feb/11 Oct/13 Jun/16
% yoy
47
48
49
50
51
52
53
54
Jul/14 Apr/15 Dec/15 Sep/16 May/17
Mfg Services
Japan Growth: Up
Although Debt/GDP
Ratio High & Private
Consumption Soft
• GDP Firms
Manufacturing
Sectors Improve
• PMI, Exports,
Autos, Labor,
IP, & Business,
Investment Up,
Inflation Low,
• & Biz/Consumer
Sentiment Up,
IR to Remain Low
• BoJ to Buy
Assets w No
Tightening til ‘18
Housing Starts
Vehicle Sales
PMI Index
Industrial
Production
GDP
Gross Private Fixed Investment
Sources: Bloomberg, INTL FCStone estimates
%yoy
(4)
(2)
0
2
4
6
Jun/00 Jun/03 Jun/06 Jun/09 Jun/12 Jun/15
% yoy
(20)
(15)
(10)
(5)
0
5
10
15
20
Feb/00 Jan/03 Nov/05 Sep/08 Jul/11 May/14 Apr/17
% yoy
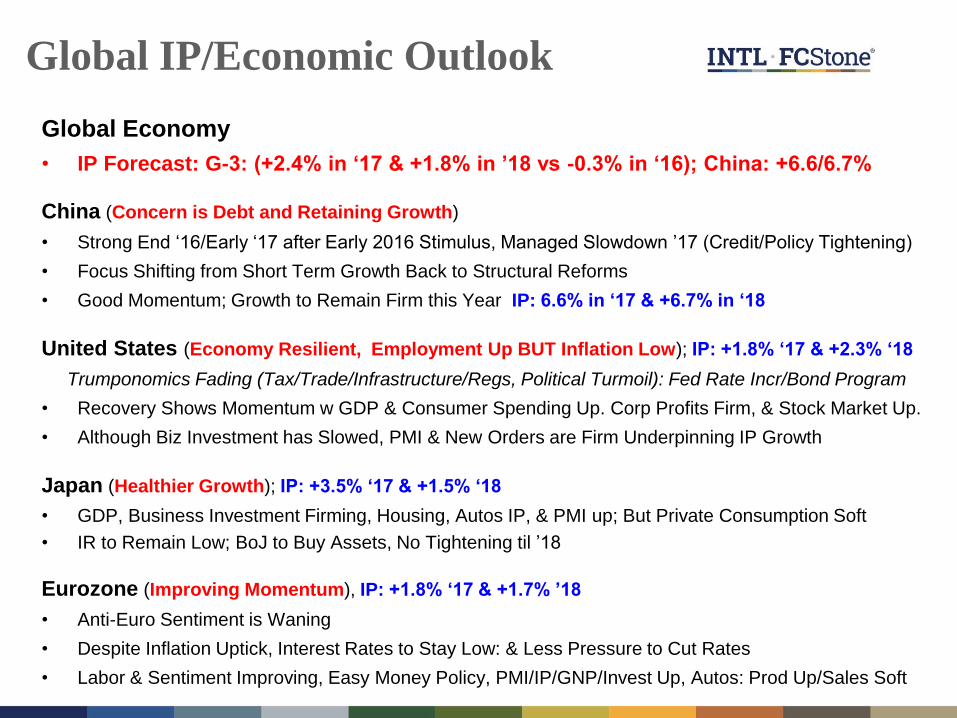
Global IP/Economic Outlook
Global Economy
• IP Forecast: G-3: (+2.4% in ‘17 & +1.8% in ’18 vs -0.3% in ‘16); China: +6.6/6.7%
China (Concern is Debt and Retaining Growth)
• Strong End ‘16/Early ‘17 after Early 2016 Stimulus, Managed Slowdown ’17 (Credit/Policy Tightening)
• Focus Shifting from Short Term Growth Back to Structural Reforms
• Good Momentum; Growth to Remain Firm this Year IP: 6.6% in ‘17 & +6.7% in ‘18
United States (Economy Resilient, Employment Up BUT Inflation Low); IP: +1.8% ‘17 & +2.3% ‘18
Trumponomics Fading (Tax/Trade/Infrastructure/Regs, Political Turmoil): Fed Rate Incr/Bond Program
• Recovery Shows Momentum w GDP & Consumer Spending Up. Corp Profits Firm, & Stock Market Up.
• Although Biz Investment has Slowed, PMI & New Orders are Firm Underpinning IP Growth
Japan (Healthier Growth); IP: +3.5% ‘17 & +1.5% ‘18
• GDP, Business Investment Firming, Housing, Autos IP, & PMI up; But Private Consumption Soft
• IR to Remain Low; BoJ to Buy Assets, No Tightening til ’18
Eurozone (Improving Momentum), IP: +1.8% ‘17 & +1.7% ’18
• Anti-Euro Sentiment is Waning
• Despite Inflation Uptick, Interest Rates to Stay Low: & Less Pressure to Cut Rates
• Labor & Sentiment Improving, Easy Money Policy, PMI/IP/GNP/Invest Up, Autos: Prod Up/Sales Soft
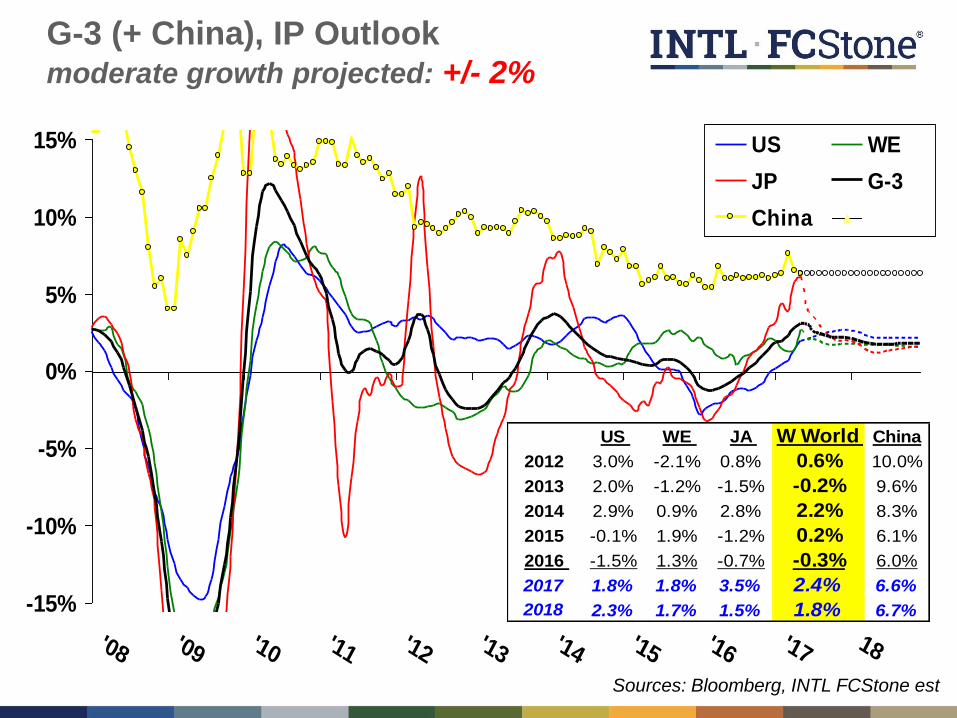
-15%
-10%
-5%
0%
5%
10%
15%
'08 '09 '10 '11 '12 '13 '14 '15 '16 '17 18
US WE
JP G-3
China
G-3 (+ China), IP Outlook moderate growth projected: +/- 2%
Sources: Bloomberg, INTL FCStone est
US WE JA W World China
2012 3.0% -2.1% 0.8% 0.6% 10.0%
2013 2.0% -1.2% -1.5% -0.2% 9.6%
2014 2.9% 0.9% 2.8% 2.2% 8.3%
2015 -0.1% 1.9% -1.2% 0.2% 6.1%
2016 -1.5% 1.3% -0.7% -0.3% 6.0%
2017 1.8% 1.8% 3.5% 2.4% 6.6%
2018 2.3% 1.7% 1.5% 1.8% 6.7%

This section of the page should be blank except when footnotes are present.
Role of Funds

Metals Volumes: Funds vs Trade excludes broker crosses
0
10
20
30
40
50
60
70
80
90
100
'90 '91 '92 '93 '94 '95 '96 '97 '98 '99 '00 '01 '02 '03 '04 '05 '06 '07 '08 '09 '10 '11 '12 '13 '14 '15 '16 '17
Funds
Trade/Other
“funds” account for 60+% of client volumes
Sources: BarclayHedge, Bloomberg, CFTC, LME, INTL FCStone estimates
$0
$20
$40
$60
$80
$100
$120
$140
$160
$180
$200
$220
$240
$260
'90 '91 '92 '93 '94 '95 '96 '97 '98 '99 '00 '01 '02 '03 '04 '05 '06 '07 '08 '09 '10 '11 '12 '13 '14 '15 '16 '17
$0
$500
$1,000
$1,500
$2,000
$2,500
$3,000
$3,500
$4,000
Macro
Hedge
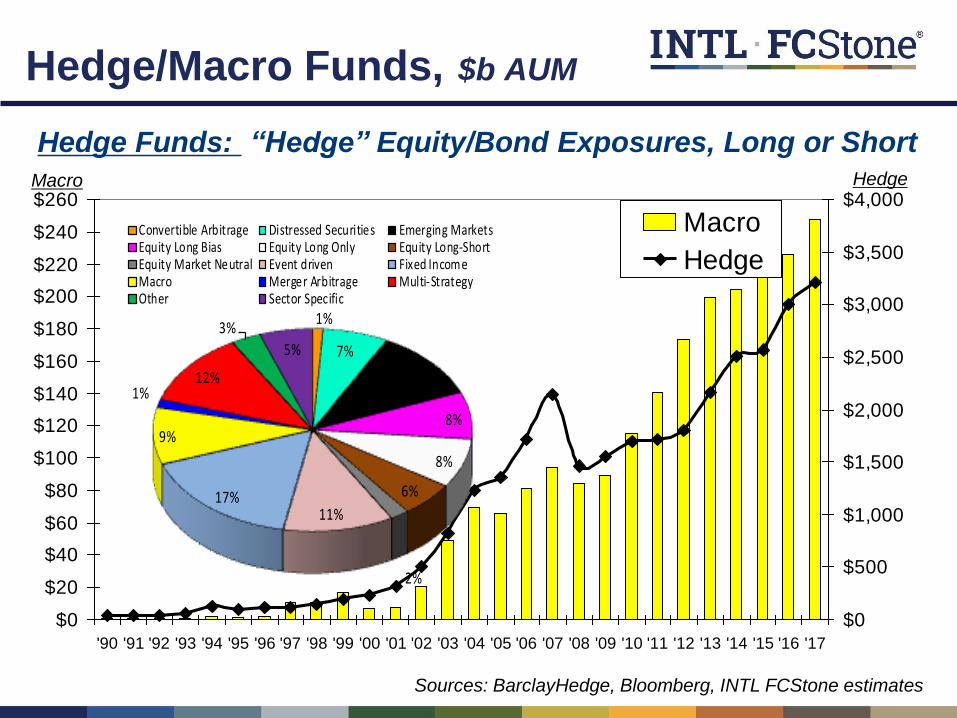
1%
7%
11%
8%
8%
6%
2%
11%17%
9%
1%12%
3%
5%
Convertible Arbitrage Distressed Securities Emerging MarketsEquity Long Bias Equity Long Only Equity Long-ShortEquity Market Neutral Event driven Fixed IncomeMacro Merger Arbitrage Multi-StrategyOther Sector Specific
Hedge/Macro Funds, $b AUM
Hedge Funds: “Hedge” Equity/Bond Exposures, Long or Short
Sources: BarclayHedge, Bloomberg, INTL FCStone estimates
Macro Hedge
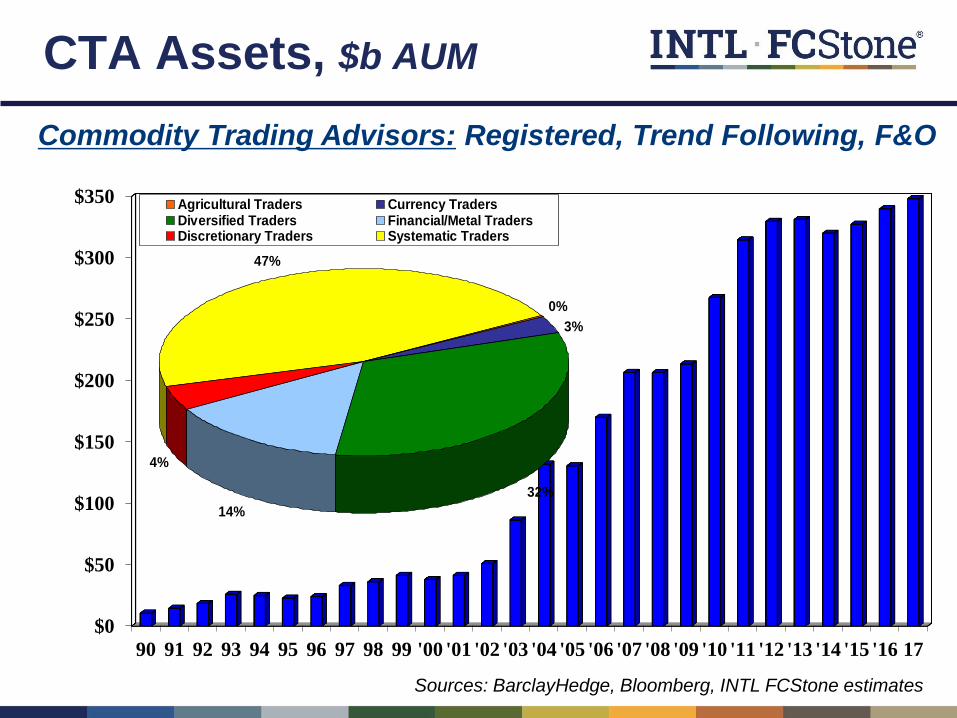
CTA Assets, $b AUM
$0
$50
$100
$150
$200
$250
$300
$350
90 91 92 93 94 95 96 97 98 99 '00 '01 '02 '03 '04 '05 '06 '07 '08 '09 '10 '11 '12 '13 '14 '15 '16 17
Commodity Trading Advisors: Registered, Trend Following, F&O
0%
32%
14%
4%
47%
3%
Agricultural Traders Currency TradersDiversified Traders Financial/Metal TradersDiscretionary Traders Systematic Traders
Sources: BarclayHedge, Bloomberg, INTL FCStone estimates

$0
$50
$100
$150
$200
$250
90 91 92 93 94 95 96 97 98 99 '00 '01'02'03'04 '05'06'07'08'09 '10'11'12'13'14 '15'16'17
Energy Agric PrecM IndusM
GSCI 70% 20% 4% 7%
DJ-UBS 33% 36% 13% 19%
Rodgers 46% 33% 7% 14%
Merrill Lynch 60% 25% 5% 10%
Average 52% 28% 7% wtd avg 12%
Copper Alum Zinc Nickel Lead
GSCI 48.2% 28.9% 7.2% 9.6% 6.0%
DJ-UBS 42.9% 29.0% 13.2% 14.9% 0.0%
Rodgers 28.6% 28.6% 14.3% 7.1% 14.3%
Merrill Lynch 52.6% 29.6% 8.4% 9.5% 0.0%
Average 43.1% 29.0% 10.8% 10.3% 5.1%
Index Funds, $b AUM
Index of Commodities, Commodity Super Cycle, Diversification
Sources: BarclayHedge, Bloomberg, INTL FCStone estimates
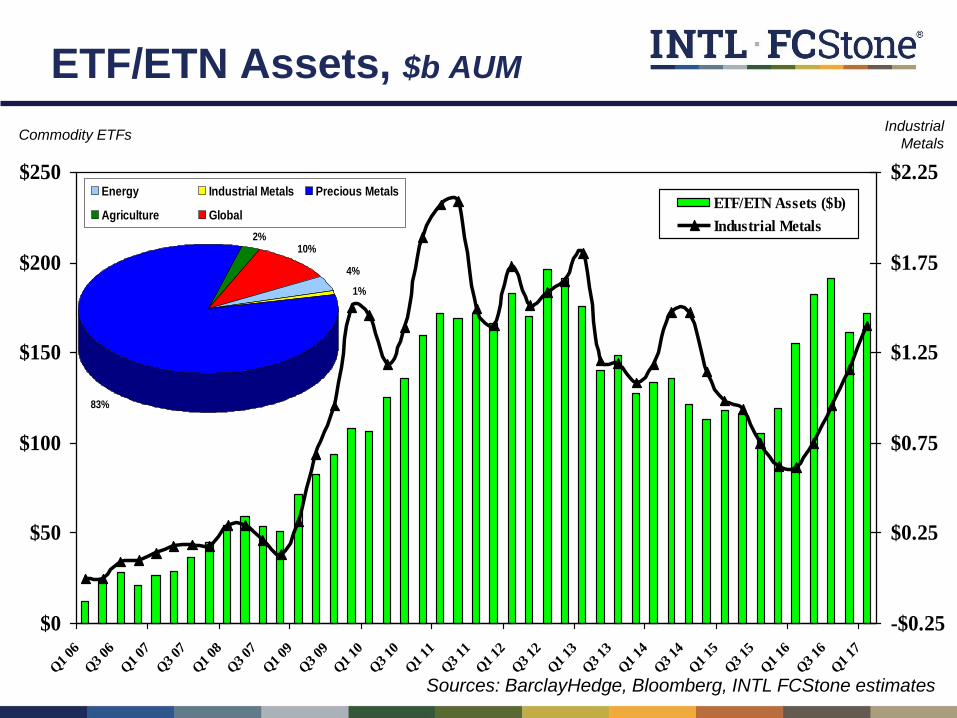
ETF/ETN Assets, $b AUM
$0
$50
$100
$150
$200
$250
Q1
06
Q3
06
Q1
07
Q3
07
Q1
08
Q3
07
Q1
09
Q3
09
Q1
10
Q3
10
Q1
11
Q3
11
Q1
12
Q3
12
Q1
13
Q3
13
Q1
14
Q3
14
Q1
15
Q3
15
Q1
16
Q3
16
Q1
17
-$0.25
$0.25
$0.75
$1.25
$1.75
$2.25
ETF/ETN Assets ($b)
Industrial Metals
4%
83%
2%10%
1%
Energy Industrial Metals Precious Metals
Agriculture Global
Industrial
Metals Commodity ETFs
Sources: BarclayHedge, Bloomberg, INTL FCStone estimates

Industrial Metals, Fund Alloc, $b
$0
$5
$10
$15
$20
$25
$30
$35
$40
$45
$50
'00 '01 '02 '03 '04 '05 '06 '07 '08 '09 '10 '11 '12 '13 '14 '15 '16 '17
Macro CTA
Index ETF/ETN
Sources: BarclayHedge, Bloomberg, CFTC, INTL FCStone estimates
1,000
2,000
3,000
4,000
5,000
6,000
7,000
8,000
9,000
10,000
'94 '95 '96 '97 '98 '99 '00 '01 '02 '03 '04 '05 '06 '07 '08 '09 '10 '11 '12 '13 '14 '15 '16 '17
-18
-15
-12
-9
-6
-3
0
3
6
9
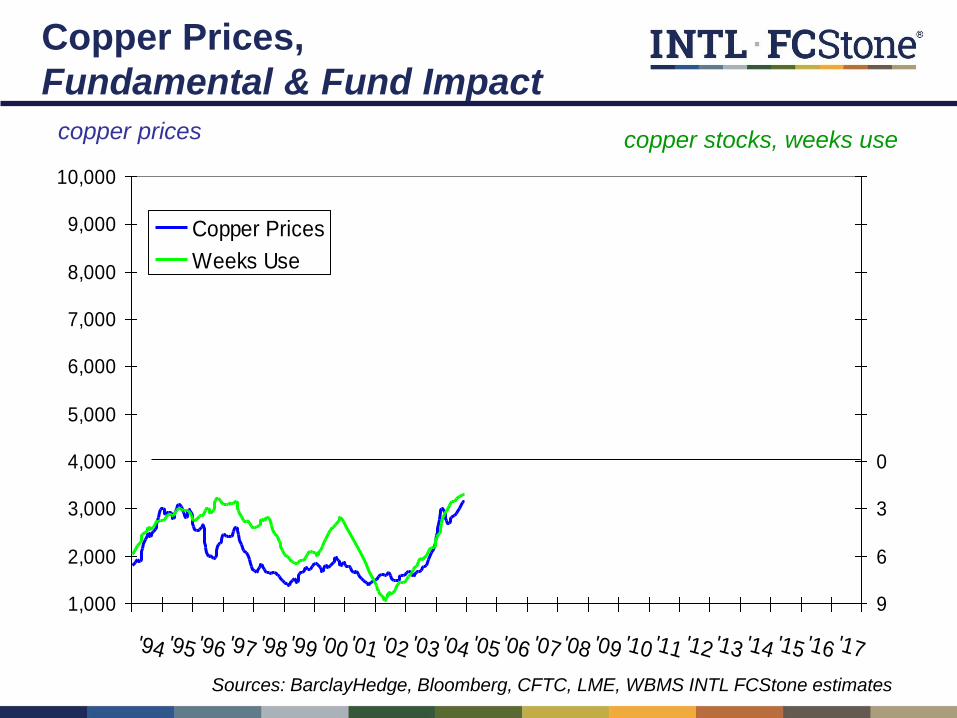
Copper Prices
Weeks Use
copper prices copper stocks, weeks use
Copper Prices,
Fundamental & Fund Impact
Sources: BarclayHedge, Bloomberg, CFTC, LME, WBMS INTL FCStone estimates

1,000
2,000
3,000
4,000
5,000
6,000
7,000
8,000
9,000
10,000
'94 '95 '96 '97 '98 '99 '00 '01 '02 '03 '04 '05 '06 '07 '08 '09 '10 '11 '12 '13 '14 '15 '16 '17
-18
-15
-12
-9
-6
-3
0
3
6
9
Copper Prices
Funds $ Index
Weeks Use
copper prices, fund index ($AUM, metals) copper stocks, weeks use
Sources: BarclayHedge, Bloomberg, CFTC, LME, WBMS INTL FCStone estimates
Copper Prices,
Fundamental & Fund Impact

Funds, AUM Trends $b
$1,000
$1,500
$2,000
$2,500
$3,000
$3,500
Jan-06 Jan-08 Jan-10 Jan-12 Jan-14 Jan-16
Hedge Funds
$100
$150
$200
$250
$300
$350
$400
Jan-06 Jan-08 Jan-10 Jan-12 Jan-14 Jan-16
CTA
$50
$100
$150
$200
$250
$300
Jan-06 Jan-08 Jan-10 Jan-12 Jan-14 Jan-16
Macro
$50
$100
$150
$200
$250
$300
Jan-06 Jan-08 Jan-10 Jan-12 Jan-14 Jan-16
Index Funds
Sources: BarclayHedge, Bloomberg, CFTC, INTL FCStone estimates

0
100,000
200,000
300,000
400,000
500,000
600,000
700,000
800,000
Aug-14 Oct-14 Jan-15 Mar-15 Jun-15 Sep-15 Nov-15 Feb-16 Apr-16 Jul-16 Oct-16 Dec-16 Mar-17 Jun-17
Ag
gre
ga
te L
ots
Money Managers' Aggregate Positions Net Shorts Longs
0
100,000
200,000
300,000
400,000
500,000
600,000
700,000
800,000
Jan-17 Feb-17 Mar-17 Mar-17 May-17 Jun-17
Ag
gre
ga
te L
ots
Money Managers' Aggregate Positions Past Year Net Shorts Longs
LME Commitment of Traders Money Managers
Source: LME

60
70
80
90
100
110
120
-600,000
-400,000
-200,000
0
200,000
400,000
August-14 April-15 December-15 August-16 April-17
Ind
ex
Net
Po
sit
ion
s
LME Non-Ferrous CoT
Brokers Money Managers Producer/Merchant/Processor Index
LME Commitment of Traders
Source: LME
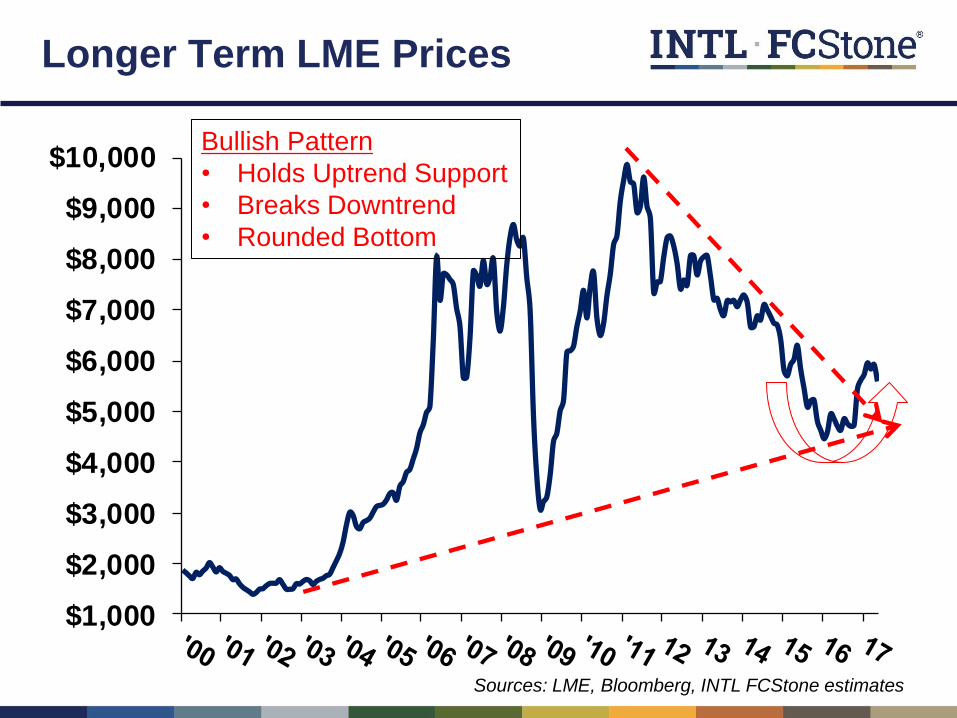
Longer Term LME Prices
$1,000
$2,000
$3,000
$4,000
$5,000
$6,000
$7,000
$8,000
$9,000
$10,000
Sources: LME, Bloomberg, INTL FCStone estimates
Bullish Pattern
• Holds Uptrend Support
• Breaks Downtrend
• Rounded Bottom

This section of the page should be blank except when footnotes are present.
Metals Outlook
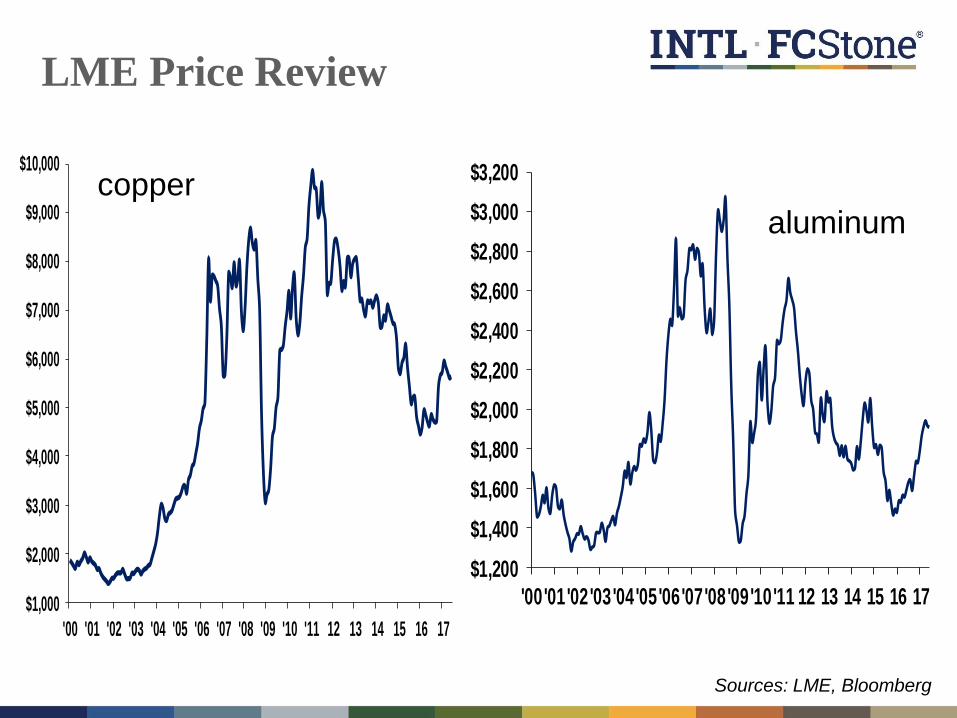
LME Price Review
$1,000
$2,000
$3,000
$4,000
$5,000
$6,000
$7,000
$8,000
$9,000
$10,000
'00 '01 '02 '03 '04 '05 '06 '07 '08 '09 '10 '11 12 13 14 15 16 17
copper
aluminum
Sources: LME, Bloomberg
$1,200
$1,400
$1,600
$1,800
$2,000
$2,200
$2,400
$2,600
$2,800
$3,000
$3,200
'00'01'02'03'04'05'06'07'08'09'10'11 12 13 14 15 16 17

LME Price Review
zinc
tin
$0
$5,000
$10,000
$15,000
$20,000
$25,000
$30,000
$35,000
$40,000
$45,000
$50,000
$55,000
'00 '01 '02 '03 '04 '05 '06 '07 '08 '09 '10 '11 '12 '13 '14 '15 '16 '17
$3,000
$8,000
$13,000
$18,000
$23,000
$28,000
$33,000
$38,000
'00 '01 '02 '03 '04 '05 '06 '07 '08 '09 '10 '11 '12 '13 '14 '15 '16 '17
nickel
lead
$500
$1,000
$1,500
$2,000
$2,500
$3,000
$3,500
$4,000
$4,500
'00'01
'02'03
'04'05
'06'07
'08'09
'10'11
'12'13
'14'15
'16'17
Sources: LME, Bloomberg
$0
$500
$1,000
$1,500
$2,000
$2,500
$3,000
$3,500
$4,000

LME Price Review, Copper
Sources: LME, Bloomberg

LME Price Review, Aluminum
Sources: LME, Bloomberg

LME Price Review, Zinc
Sources: LME, Bloomberg

LME Price Review, Lead
Sources: LME, Bloomberg

LME Price Review, Nickel
Sources: LME, Bloomberg

LME Price Review, Tin
Sources: LME, Bloomberg
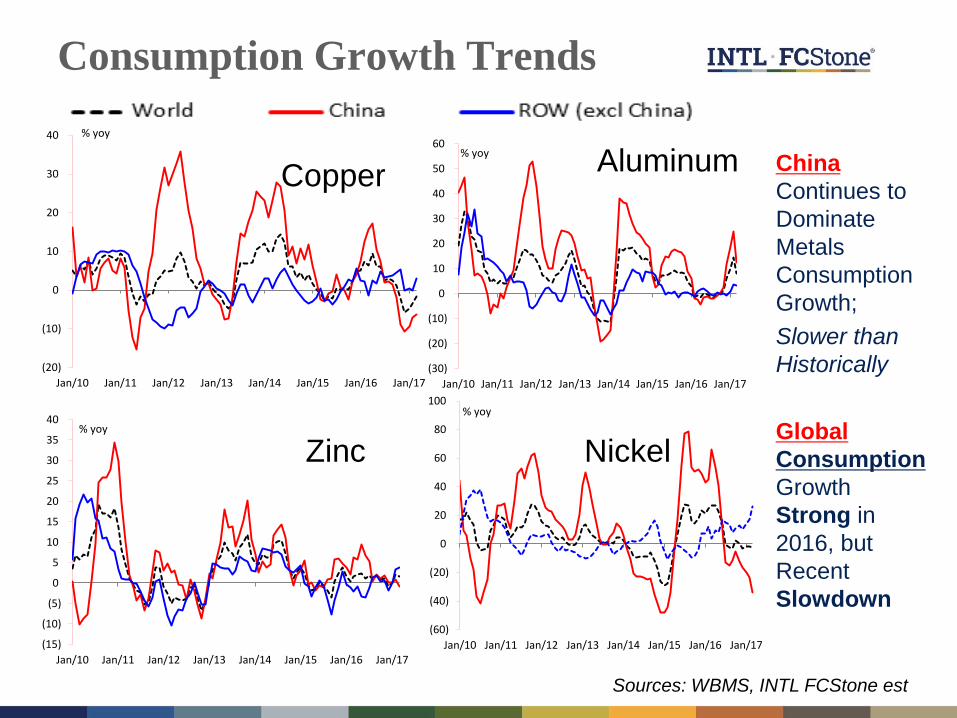
Consumption Growth Trends
Aluminum
Nickel Zinc
Copper China
Continues to
Dominate
Metals
Consumption
Growth;
Slower than
Historically
Global
Consumption
Growth
Strong in
2016, but
Recent
Slowdown
Sources: WBMS, INTL FCStone est
(20)
(10)
0
10
20
30
40
Jan/10 Jan/11 Jan/12 Jan/13 Jan/14 Jan/15 Jan/16 Jan/17
% yoy
(30)
(20)
(10)
0
10
20
30
40
50
60
Jan/10 Jan/11 Jan/12 Jan/13 Jan/14 Jan/15 Jan/16 Jan/17
% yoy
(15)
(10)
(5)
0
5
10
15
20
25
30
35
40
Jan/10 Jan/11 Jan/12 Jan/13 Jan/14 Jan/15 Jan/16 Jan/17
% yoy
(60)
(40)
(20)
0
20
40
60
80
100
Jan/10 Jan/11 Jan/12 Jan/13 Jan/14 Jan/15 Jan/16 Jan/17
% yoy

Mine and Refined Production
Aluminum
Nickel
Zinc
Copper
Copper
Production
Curtailed By
Mine Strikes
/Other but New
& Expanded
Capacity
Aluminum
Grows with
China (but Govt
Mandated Cuts
Soon?)
Zinc: significant
cuts in 2016
(Glencore)?
Nickel:
significant cuts
in 2015/16; Indo
and Phil supply?
Sources: WBMS, INTL FCStone est

China’s Net Metal Trade Reduced: Exports – Imports
-400,000-350,000-300,000-250,000-200,000-150,000-100,000
-50,0000
50,000100,000
2006 2007 2008 2009 2010 2011 2012 2013 2014 2015 2016
Tons Aluminum
-120,000-90,000-60,000-30,000
030,00060,000
2006 2007 2008 2009 2010 2011 2012 2013 2014 2015 2016 2017
Tons Zinc
-50,000
-25,000
0
25,000
50,000
75,000
2006 2007 2008 2009 2010 2011 2012 2013 2014 2015 2016 2017
Tons Lead
-50,000
-40,000
-30,000
-20,000
-10,000
0
20062007200820092010201120122013201420152016
Tons
Nickel
-3,000-2,000-1,000
01,0002,0003,000
20062007200820092010201120122013201420152016
Tin
-400,000
-350,000
-300,000
-250,000
-200,000
-150,000
-100,000
-50,000
0
50,000
2006 2007 2008 2009 2010 2011 2012 2013 2014 2015 2016 2017
Copper
Sources: WBMS, INTL FCStone est

$0
$1,000
$2,000
$3,000
$4,000
$5,000
$6,000
$7,000
$8,000
$9,000
$10,000
80' 82' 84' 86' 88' 90' 92' 94' 96' 98' 00' 02' 04' 06' 08' 10' 12' 14' 16'
Copper Prices vs 70th %-tile Cost
$0
$1,000
$2,000
$3,000
$4,000
$5,000
$6,000
$7,000
$8,000
Copper Cost Curves
2016 2015 2014 2013
2012 2011 2010
Sources: LME, WBMS, INTL FCStone est

500
1000
1500
2000
2500
3000
3500
4000
80' 82' 84' 86' 88' 90' 92' 94' 96' 98' 00' 02' 04' 06' 08' 10' 12' 14' 16'
LME Aluminum Prices vs 70th Percentile Costs
Aluminum Monthly Avg Price Al Costs (70th percentile)
$1,000
$1,500
$2,000
$2,500
$3,000
$3,500
Aluminum Cost Curve
2016 2015 2014 2013
2012 2011 2010 2009
Sources: LME, WBMS, INTL FCStone est

$0
$10,000
$20,000
$30,000
$40,000
$50,000
$60,000
80' 82' 84' 86' 88' 90' 92' 94' 96' 98' 00' 02' 04' 06' 08' 10' 12' 14' 16'
LME Nickel Prices vs 70th Percentile Cost
$0
$5,000
$10,000
$15,000
$20,000
$25,000
$30,000
Nickel Cost Curve
2016 2015 2014 20132012 2011 2010 2009
Sources: LME, WBMS, INTL FCStone est

-
500.00
1,000.00
1,500.00
2,000.00
2,500.00
3,000.00
3,500.00
4,000.00
4,500.00
5,000.00
80' 82' 84' 86' 88' 90' 92' 94' 96' 98' 00' 02' 04' 06' 08' 10' 12' 14' 16'
LME Zinc Prices vs 70th Percentile Costs
$0
$500
$1,000
$1,500
$2,000
$2,500
$3,000
$3,500
$4,000
Zinc Cost Curve
2016 2015 2014 2013
2012 2011 2010 2009
Sources: LME, WBMS, INTL FCStone est

0
1,000
2,000
3,000
4,000
5,000
6,000LME
Comex
IPAI
Shang
Inventory Trends
alum
-
200
400
600
800
1,000
1,200
1,400 Producer Consumer
LME Mrchnt
SHFE
zinc
0
50
100
150
200
250
300
350
400
450
500
LME
Prod
Cons
Shang
0
100
200
300
400
500
600
700
05 06 07 08 09 10 11 12 13 14 15 16 17
Producer
Consumer
Comex
LME
SHFE
nickel
copper
Sources: LME, WBMS, INTL FCStone est

0
50
100
150
200
250
300
350
400
15 16 17 18
Comex LME SHFE
0
500
1,000
1,500
2,000
2,500
3,000
3,500
4,000
Inventory Trends
alum
-
100
200
300
400
500
600
zinc
0
50
100
150
200
250
300
350
400
450
500
nickel
copper
Sources: LME, WBMS, INTL FCStone est

Copper, Supply-Demand Balance, k tonnes
Supply:
• New Mine Builds in ’15/‘16
to Slow w Little in Pipeline
• Recent Mine Strikes/Losses
More Labor Contracts this Yr
• Shuttered Capacity
• High Prices: High Scrap
Demand
• Hope for China demand
• Questions on Trump Investing
• Europe Steady
• Fund Index Buying
Stocks/Premiums
• Stocks Up (notably China)
• Premiums Low
Forecast: deficit deficit
• Reuters: ‘17: -17k, ‘18: -72k
Sources: LME, WBMS, INTL FCStone est
2013 2014 2015 2016 Jan-Mar'17 2017f 2018f
Total Consumption 21,154 22,702 22,830 23,331 5,614 23,914 24,632
4.3% 7.3% 0.6% 2.2% 2.5% 3.0%
China 9,830 11,303 11,353 11,642 2,671
10.5% 15.0% 0.4% 2.5%
World less China 11,324 11,399 11,477 11,689 2,943
-0.5% 0.7% 0.7% 1.9%
Total Mine Prod 18,188 18,548 19,325 20,719 4,966 21,755 22,843
7.2% 2.0% 4.2% 7.2% 5.0% 5.0%
Total Refined Prod* 20,975 22,426 22,968 23,527 5,762 24,116 24,598
3.0% 6.9% 2.4% 2.4% 2.5% 2.0%
China Refined 6,667 7,649 7,964 8,436 2,133
13.4% 14.7% 4.1% 5.9%
World less China 14,308 14,777 15,004 15,091 3,629
-1.2% 3.3% 1.5% 0.6%
Apparent Balance -180 -276 138 196 148 201 -34
Reported Balance -145 -148 157 59 191 201 -34
Unreported Balance -35 -129 -19 137 -43 0 0
Producers 284 316 299 295 308
Merchants 14 17 16 18 19
Consumers 111 127 128 137 128
Exchange 230 308 483 538 721
Total Stocks** 916 768 926 985 1,176 1,186 1,152
Weeks Use 2.3 1.8 2.1 2.2 2.7 2.6 2.4
Copper Supply/Demand Annual Balances (k tonnes)
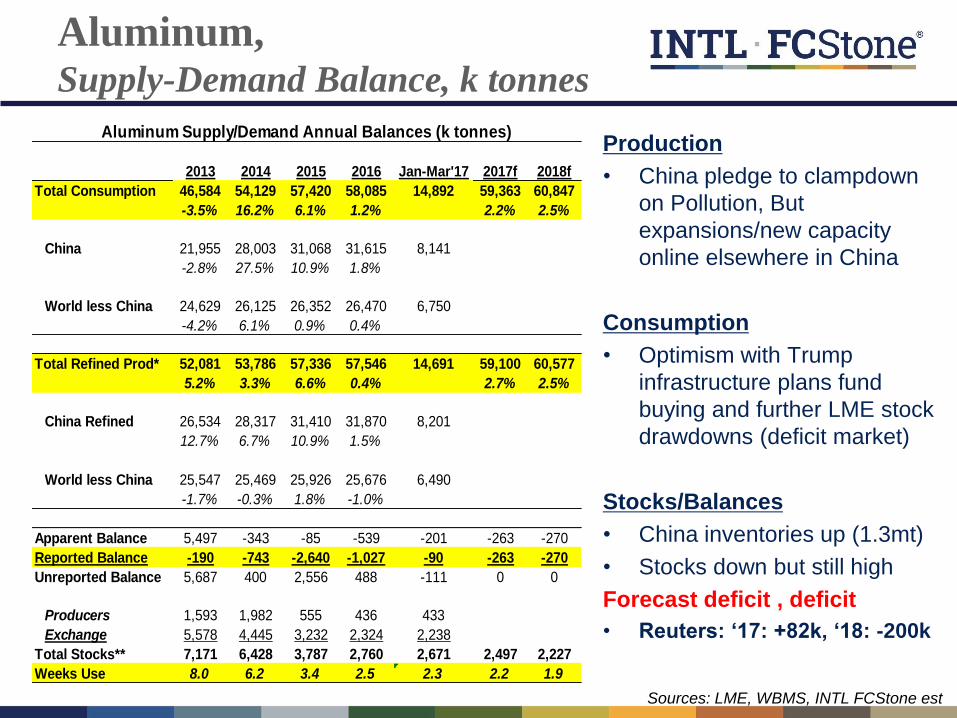
Aluminum, Supply-Demand Balance, k tonnes
Production
• China pledge to clampdown
on Pollution, But
expansions/new capacity
online elsewhere in China
Consumption
• Optimism with Trump
infrastructure plans fund
buying and further LME stock
drawdowns (deficit market)
Stocks/Balances
• China inventories up (1.3mt)
• Stocks down but still high
Forecast deficit , deficit
• Reuters: ‘17: +82k, ‘18: -200k
Sources: LME, WBMS, INTL FCStone est
2013 2014 2015 2016 Jan-Mar'17 2017f 2018f
Total Consumption 46,584 54,129 57,420 58,085 14,892 59,363 60,847
-3.5% 16.2% 6.1% 1.2% 2.2% 2.5%
China 21,955 28,003 31,068 31,615 8,141
-2.8% 27.5% 10.9% 1.8%
World less China 24,629 26,125 26,352 26,470 6,750
-4.2% 6.1% 0.9% 0.4%
Total Refined Prod* 52,081 53,786 57,336 57,546 14,691 59,100 60,577
5.2% 3.3% 6.6% 0.4% 2.7% 2.5%
China Refined 26,534 28,317 31,410 31,870 8,201
12.7% 6.7% 10.9% 1.5%
World less China 25,547 25,469 25,926 25,676 6,490
-1.7% -0.3% 1.8% -1.0%
Apparent Balance 5,497 -343 -85 -539 -201 -263 -270
Reported Balance -190 -743 -2,640 -1,027 -90 -263 -270
Unreported Balance 5,687 400 2,556 488 -111 0 0
Producers 1,593 1,982 555 436 433
Exchange 5,578 4,445 3,232 2,324 2,238
Total Stocks** 7,171 6,428 3,787 2,760 2,671 2,497 2,227
Weeks Use 8.0 6.2 3.4 2.5 2.3 2.2 1.9
Aluminum Supply/Demand Annual Balances (k tonnes)
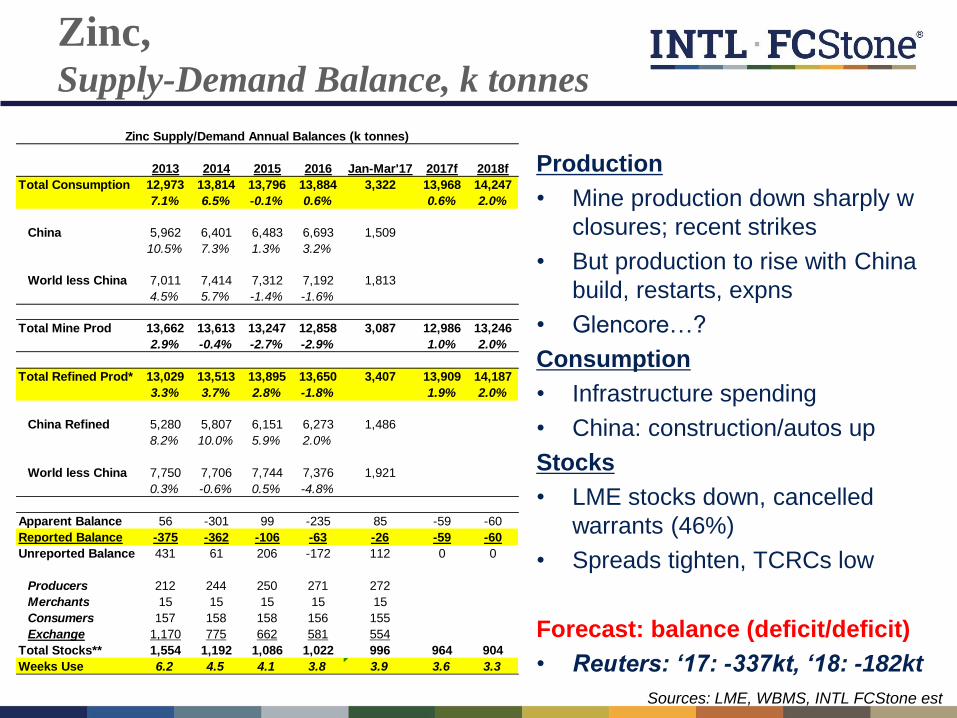
Zinc, Supply-Demand Balance, k tonnes
Production
• Mine production down sharply w
closures; recent strikes
• But production to rise with China
build, restarts, expns
• Glencore…?
Consumption
• Infrastructure spending
• China: construction/autos up
Stocks
• LME stocks down, cancelled
warrants (46%)
• Spreads tighten, TCRCs low
Forecast: balance (deficit/deficit)
• Reuters: ‘17: -337kt, ‘18: -182kt
Sources: LME, WBMS, INTL FCStone est
2013 2014 2015 2016 Jan-Mar'17 2017f 2018f
Total Consumption 12,973 13,814 13,796 13,884 3,322 13,968 14,247
7.1% 6.5% -0.1% 0.6% 0.6% 2.0%
China 5,962 6,401 6,483 6,693 1,509
10.5% 7.3% 1.3% 3.2%
World less China 7,011 7,414 7,312 7,192 1,813
4.5% 5.7% -1.4% -1.6%
Total Mine Prod 13,662 13,613 13,247 12,858 3,087 12,986 13,246
2.9% -0.4% -2.7% -2.9% 1.0% 2.0%
Total Refined Prod* 13,029 13,513 13,895 13,650 3,407 13,909 14,187
3.3% 3.7% 2.8% -1.8% 1.9% 2.0%
China Refined 5,280 5,807 6,151 6,273 1,486
8.2% 10.0% 5.9% 2.0%
World less China 7,750 7,706 7,744 7,376 1,921
0.3% -0.6% 0.5% -4.8%
Apparent Balance 56 -301 99 -235 85 -59 -60
Reported Balance -375 -362 -106 -63 -26 -59 -60
Unreported Balance 431 61 206 -172 112 0 0
Producers 212 244 250 271 272
Merchants 15 15 15 15 15
Consumers 157 158 158 156 155
Exchange 1,170 775 662 581 554
Total Stocks** 1,554 1,192 1,086 1,022 996 964 904
Weeks Use 6.2 4.5 4.1 3.8 3.9 3.6 3.3
Zinc Supply/Demand Annual Balances (k tonnes)

Nickel, Lead Supply-Demand Balance, k tonnes
Nickel Lead
Sources: LME, WBMS, INTL FCStone est
2013 2014 2015 2016 Q1'17 2017f 2018f
Total Consumption 11,304 10,919 10,199 11,291 3,069 11,404 11,632
8.3% -3.4% -6.6% 10.7% 1.0% 2.0%
China 4,927 4,682 3,804 4,655 1,306
6.7% -5.0% -18.8% 22.4%
World less China 6,377 6,237 6,396 6,636 1,763
9.7% -2.2% 2.5% 3.8%
Total Mine Prod 5,294 5,269 4,999 4,710 1,365 4,710 4,757
4.0% -0.5% -5.1% -5.8% 0.0% 1.0%
Total Refined Prod* 11,312 10,932 10,182 11,119 2,965 11,342 11,569
6.5% -3.4% -6.9% 9.2% 2.0% 2.0%
China Refined 4,935 4,704 3,845 4,665 1,281
7.5% -4.7% -18.3% 21.3%
World less China 6,377 6,227 6,337 6,454 1,684
5.8% -2.3% 1.8% 1.8%
Apparent Balance 8 12 -17 -172 -104 -62 -64
Reported Balance -41 -22 -100 15 20 -62 -64
Unreported Balance 49 35 83 -187 -124 0 0
Producers 140 135 118 113 101
Consumers 139 138 137 138 138
Exchange 304 286 205 224 256
Total Stocks** 582 560 460 475 495 413 349
Weeks Use 2.7 2.7 2.4 2.2 2.1 1.9 1.6
Lead Supply/Demand Annual Balances (k tonnes)
2013 2014 2015 2016 Q1'17 2017f 2018f
Total Consumption 1,801 1,587 1,741 1,867 388 1,901 1,939
3.8% -11.9% 9.7% 7.2% 1.8% 2.0%
China 909 654 836 873 137
13.0% -28.1% 27.8% 4.4%
World less China 892 933 905 994 251
-4.1% 4.7% -3.0% 9.8%
Total Mine Prod 2,539 2,063 2,125 1,981 417 2,001 2,041
12.0% -18.7% 3.0% -6.8% 1.0% 2.0%
Total Refined Prod* 1,979 1,831 1,830 1,805 392 1,823 1,869
6.2% -7.4% -0.1% -1.4% 1.0% 2.5%
China Refined 711 537 446 412 61
20.3% -24.4% -16.9% -7.7%
World less China 1,268 1,294 1,384 1,393 331
-0.3% 2.1% 6.9% 0.7%
Apparent Balance 178 244 89 -62 4 -77 -70
Reported Balance 123 161 66 -20 -5 -77 -70
Unreported Balance 54 83 23 -41 9 0 0
Producers
Merchants/Cons 24 31 25 25 26
Exchange 262 415 487 466 460
Total Stocks** 285 446 511 491 486 414 344
Weeks Use 8.3 14.6 15.3 13.7 16.3 11.4 9.3
Nickel Supply/Demand Annual Balances (k tonnes)

Metals Outlook
• Prices recover in late 2016/early 2017 after 5 year bear market
• Global economy (IP) expected to grow slowly (no recession, no boom)
– Labor markets improving, low inflation, monetary/fiscal policy favorable
– China expansion continues but slows from early this year
– US economy growing, Trump infrastructure delayed, some Fed tightening
– Europe holds steady to higher; reduced political uncertainties
• Prices slip below production costs in 2016, forcing cutbacks
– Unplanned production losses offset reduced cap builds, China cuts?
• Inventories starting to decline
– Market shifts into deficit with mine cutbacks and economic recovery
• Fund investment high, albeit down from prior years, but growing
• Prices expected to hold steady to modestly recover over next 2 yrs
– Downside limited with prices below mine cash costs
– Upside capped w still surplus stocks and only modest economic growth
– Supply-demand fundamentals to play important role in base metal prices

Analysts Price Forecasts
Source: Consensus Economics
Current Sep-17 Dec-17 Mar-18 Jun-18 Sep-18 Dec-18 Mar-19
CP $5,640 $5,817 $5,746 $5,794 $5,816 $5,841 $5,857 $5,946
AL $1,865 $1,833 $1,881 $1,861 $1,850 $1,843 $1,853 $1,857
ZN $2,500 $2,804 $2,782 $2,779 $2,762 $2,731 $2,694 $2,609
PB $2,080 $2,203 $2,175 $2,148 $2,116 $2,098 $2,076 $2,099
NI $8,830 $10,475 $10,655 $10,975 $11,088 $11,295 $11,281 $12,067
SN $19,500 $20,219 $20,309 $20,232 $20,419 $20,306 $20,414 $20,520