powerpoint presentation ring temperature reconstructions show that spring temperatures over the last...
TRANSCRIPT
1

2

3
4

5

6

7

8

9
10

Plot showing the 50 Percent Chance of Exceedance Forecast. There is a 50 percent chance that the actual streamflow volume will exceed this forecast value, and there is a 50 percent chance that the actual streamflow volume will be less than this forecast value. Generally, this forecast is the middle of the range of possible streamflow volumes that can be produced given current conditions.
11

This shows the persistent pattern we have observed for most of this winter so far.
12

The ridge in the western US has led to strongly elongated low pressure in the eastern US with another downstream blocking high pressure over Greenland.
13

Typical eastern Pacific surface plot for an Omega Block pattern.
14

15

16
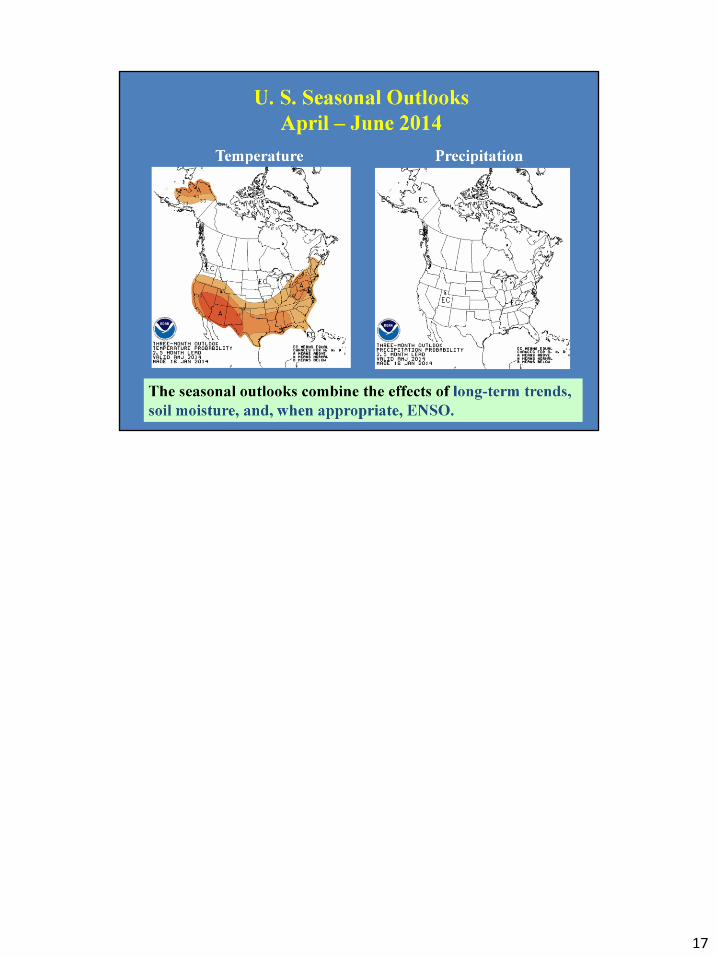
17

18

We have been in ENSO neutral conditions since early 2012.
19

Most models and the ensemble (black dashed line) show an El Nino developing by the April-May-June time period.
20
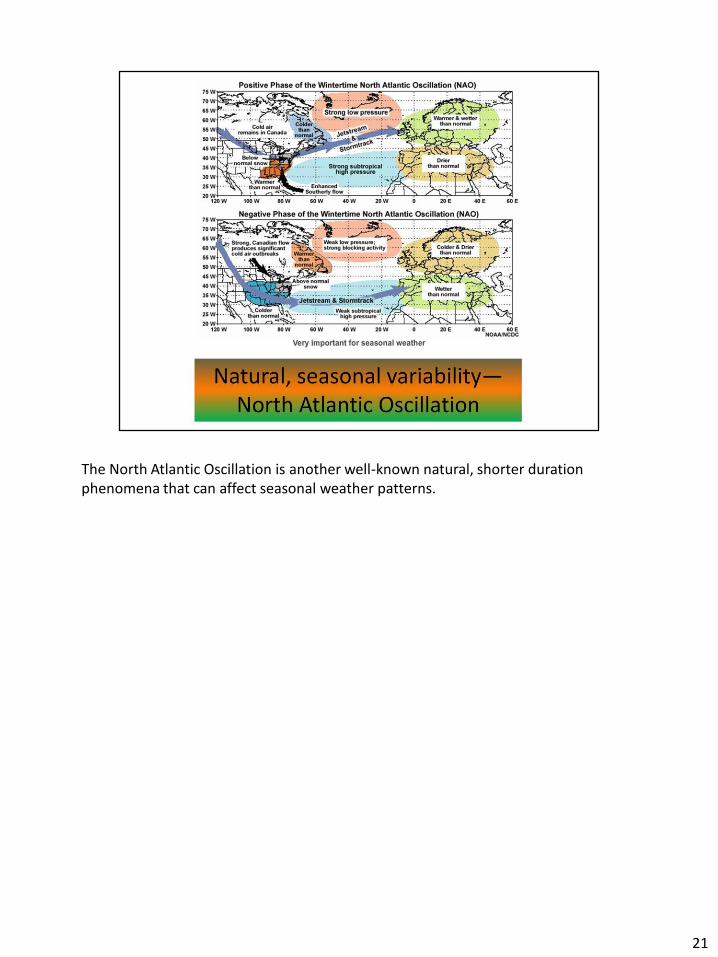
The North Atlantic Oscillation is another well-known natural, shorter duration phenomena that can affect seasonal weather patterns.
21

Folks need to understand the difference between weather and climate—they are different but commonly misunderstood.
22
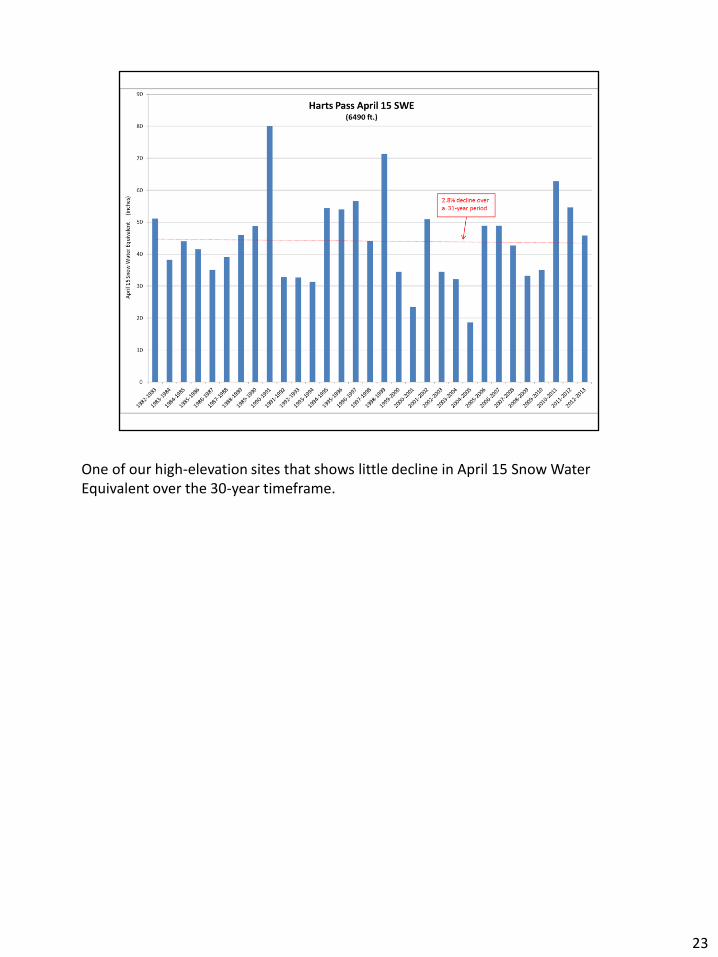
One of our high-elevation sites that shows little decline in April 15 Snow Water Equivalent over the 30-year timeframe.
23
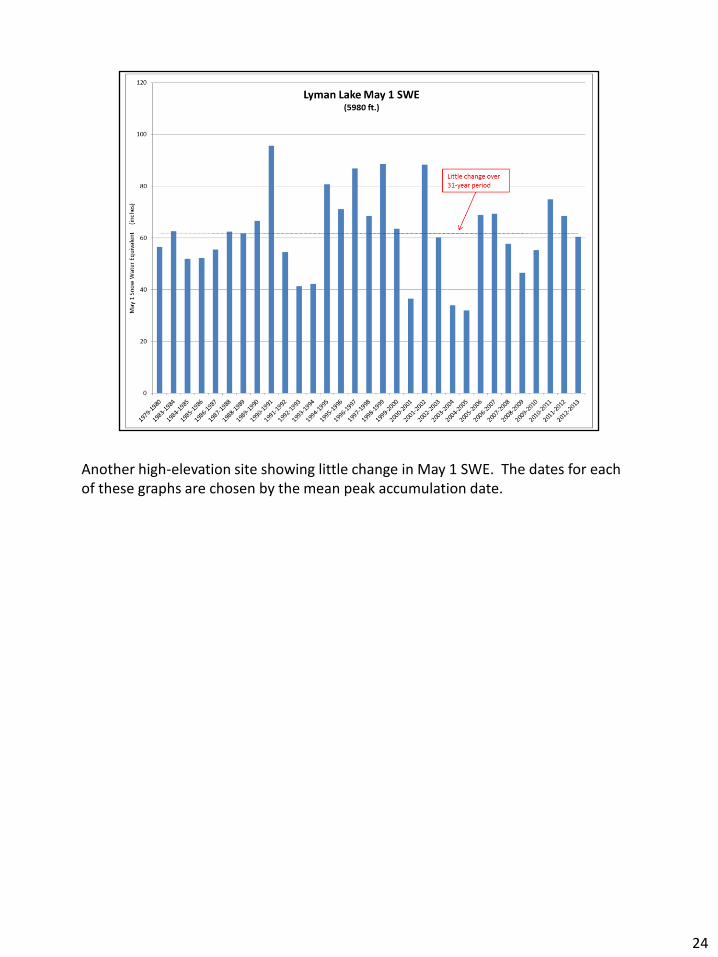
Another high-elevation site showing little change in May 1 SWE. The dates for each of these graphs are chosen by the mean peak accumulation date.
24

Below 1800m (5900 ft) we begin to see a stronger decline in peak date SWE. This seems to indicate earlier melting at lower elevation sites, as others in the literature have shown.
25

Another site below 1800m (5900 ft) showing a stronger decline in peak date SWE. This would indicate earlier melting at lower elevation sites, as others in the literature have shown.
26

Another site below 1800m (5900 ft) showing a stronger decline in peak date SWE. This would indicate earlier melting at lower elevation sites, as others in the literature have shown.
27

Mote (2003) evidence of largely negative trends in SWE decline on April 1st going back to 1950. Trends would likely be even stronger if data for 2001-2013 were included as these were generally earlier melting years in the PNW.
28

Mote (2003) evidence showing strongly negative trends, particularly below 1800m (5900 ft).
29

Westwide trends showing earlier onset of spring pulse (i.e., when hydrograph begins to spike upward) and center of mass (i.e., middle of hydrograph). Note that coastal rain-dominated basins are showing later trends in CT.
30

Shift toward earlier onset spring pulse dates (i.e., onset of runoff) is more pronounced for lower elevation sites than higher.
31
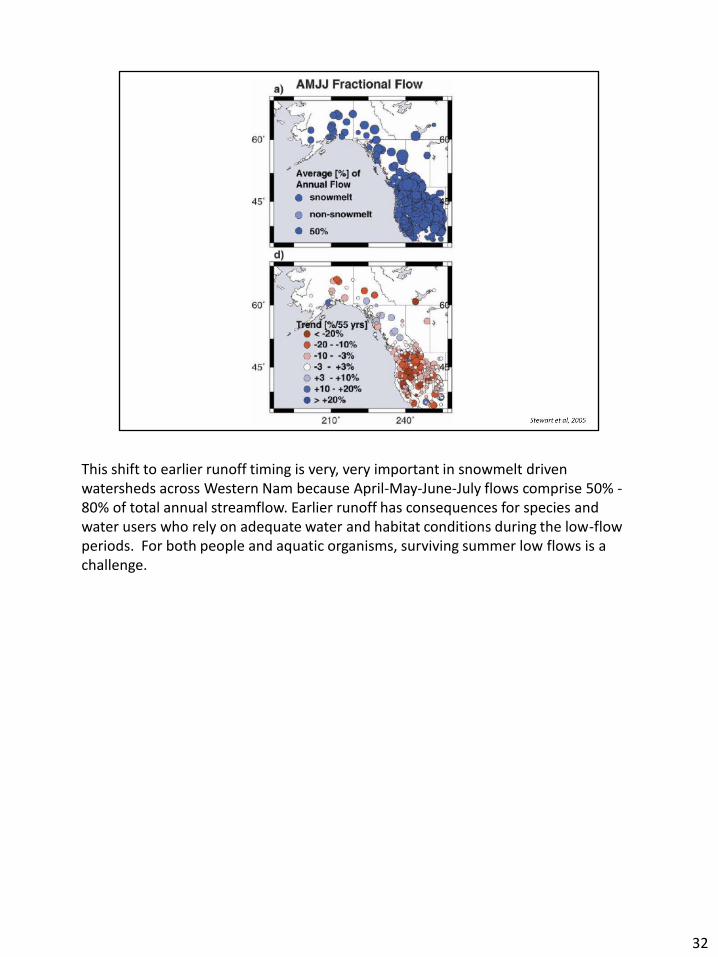
This shift to earlier runoff timing is very, very important in snowmelt driven watersheds across Western Nam because April-May-June-July flows comprise 50% - 80% of total annual streamflow. Earlier runoff has consequences for species and water users who rely on adequate water and habitat conditions during the low-flow periods. For both people and aquatic organisms, surviving summer low flows is a challenge.
32

Relationship between PDO phase and (for example) the driest 25% of years. The Pacific Decadal Oscillation (PDO) is the leading EOF of monthly sea surface temperature anomalies (SSTA) over the North Pacific (poleward of 20° N) after the global mean SSTA has been removed, the PDO index is the standardizedprincipal component time series.[1] The PDO is detected as warm or cool surface waters in the Pacific Ocean, north of 20° N. During a "warm", or "positive", phase, the west Pacific becomes cool and part of the eastern ocean warms; during a "cool" or "negative" phase, the opposite pattern occurs. It shifts phases on at least inter-decadal time scale, usually about 20 to 30 years. The Pacific (inter-)decadal oscillation was named by Steven R. Hare, who noticed it while studying salmon production pattern results in 1997. The prevailing hypothesis is that the PDO is caused by a "reddening" of the El Niño–Southern Oscillation (ENSO) combined with stochastic atmospheric forcing.
33

Some changes in Center Timing (CT) of runoff can be explained by PDO, particularly in the PNW where it’s effect is known to be greatest (Mantua et. al. 1997) but little correlation with ENSO (Southern Oscillation Index; SOI). However, strong west-wide decreases in CT (earlier runoff) are seen irrespective of PDO phase (warm or cool).
34

Statistical correlations of the influence of temperature (TI) and the PDO on earlier observed runoff timing. a) shows that removing the effects of warmer winter/spring temperatures but keeping PDO influences results in little correlation. b) however, when the PDO is removed, temperature alone exerts a strong control on runoff timing (CT). In other words, temperature-dependent streamflow timing variations remain when PDO influences are removed, but not vice versa.
35
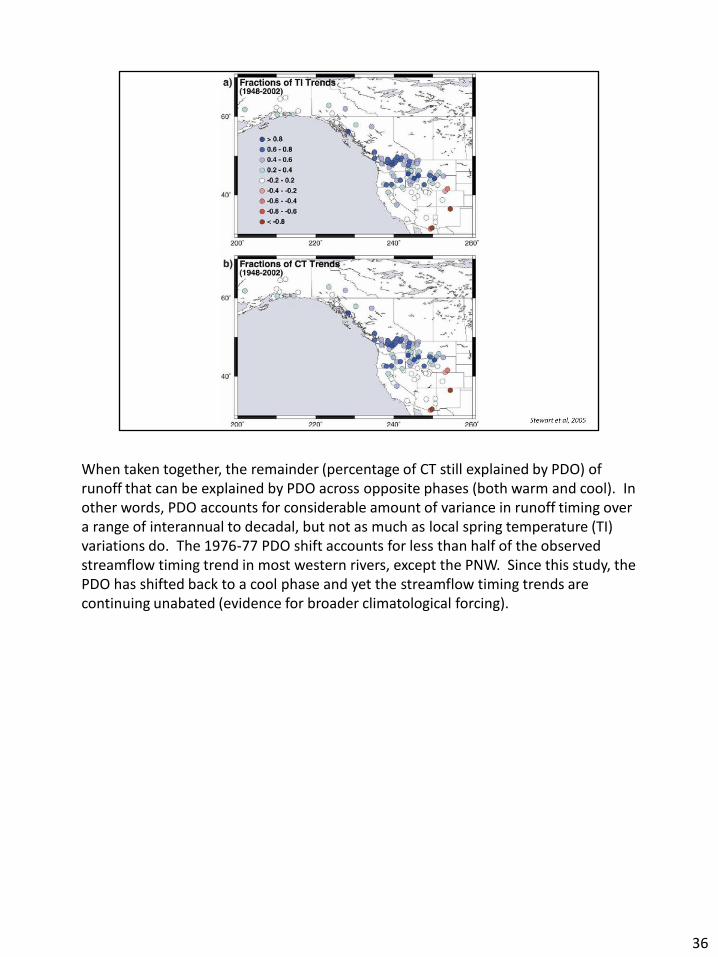
When taken together, the remainder (percentage of CT still explained by PDO) of runoff that can be explained by PDO across opposite phases (both warm and cool). In other words, PDO accounts for considerable amount of variance in runoff timing over a range of interannual to decadal, but not as much as local spring temperature (TI) variations do. The 1976-77 PDO shift accounts for less than half of the observed streamflow timing trend in most western rivers, except the PNW. Since this study, the PDO has shifted back to a cool phase and yet the streamflow timing trends are continuing unabated (evidence for broader climatological forcing).
36
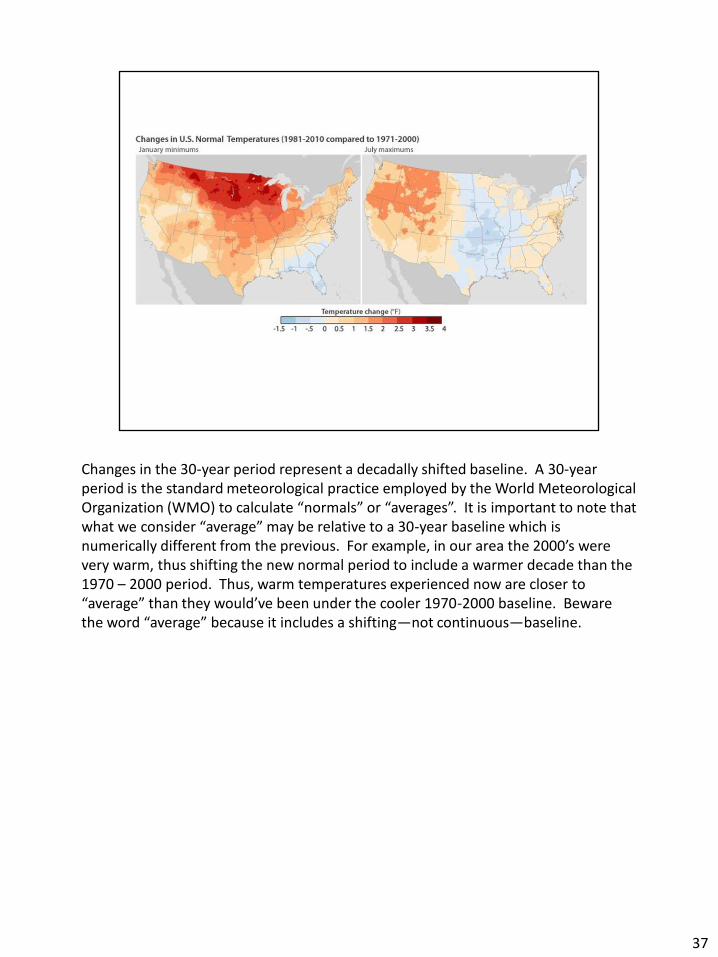
Changes in the 30-year period represent a decadally shifted baseline. A 30-year period is the standard meteorological practice employed by the World Meteorological Organization (WMO) to calculate “normals” or “averages”. It is important to note that what we consider “average” may be relative to a 30-year baseline which is numerically different from the previous. For example, in our area the 2000’s were very warm, thus shifting the new normal period to include a warmer decade than the 1970 – 2000 period. Thus, warm temperatures experienced now are closer to “average” than they would’ve been under the cooler 1970-2000 baseline. Beware the word “average” because it includes a shifting—not continuous—baseline.
37

Winter temperature trends over the most recent 40-year period. Note stronger warming in the northern US and in the WA Cascades.
38

Annual changes in temperature over a longer time scale (120 years) for the eastern Cascades region. Note that considerable warming has been seen since the mid-1980s. Tree ring temperature reconstructions show that spring temperatures over the last 50 years are higher now than they’ve been at any time in the last 900 years. (Jones et al 2001).
39

Winter precipitation trends over the most recent 40-year period. Note the sharply drier conditions in the Pacific Northwest.
40

Annual changes in precipitation over a longer time scale (120 years). Generally no clear pattern emerges for the eastern Cascades region.
41

Previous studies have generally shown nonsignificant trends in precipitation over the past 50 years, despite an significant decrease in annual streamflow. This paradox has been hypothesized to be caused by increased evapotranspiration (ET) but since the precip stations do not fall within the watersheds where streamflow is measured, this makes quantitative comparison impossible. Physical calculations of energy balance (i.e., increases in ET cannot exceed incoming solar energy) have been computed and show that while there has been a small increase in ET, the observed reductions in streamflow cannot be explained by this factor alone.
42

Plots showing significant correlations with precipitation and 700mb (~10,000 ft) winds over the recent 30-year period on the windward side of the Cascades. Note the much lower correlations on the leeward side of mountain ranges where measured precipitation is not driven by orographic forcing. Strong evidence that orographic forcing has been reduced on the windward side of the Cascades and Rockies which better explains the reduction in annual streamflow over this timeframe (previous slide).
43

Late 21st century projections for 700mb (~10,000 ft) winds during the winter snow accumulation season. Strong reductions in wind speeds would have dramatic repercussions for mountain watersheds that rely on snowmelt. These physical relationships are likely not well-captured in most current climate models.
44

Summary of most recent predicted changes to the Pacific Northwest.
45

http://www.youtube.com/watch?v=_nzwJg4Ebzo Video describing possible relationships between Arctic Amplification (warmer arctic largely due to a loss of sea ice and reduced albedo) and reduced jet stream velocities. Also results in increased jet meandering and patterns getting “stuck” longer. There is still considerable disagreement about this hypothesis in the published meteorological literature.
46

47

The National Operational Hydrologic Remote Sensing Center (NOHRSC) produces many great products now available on the web that are derived from remotely sensed (i.e., satellites) sources that cover an entire area (as opposed to SNOTEL sites which are only single points).
48
49

50