powerpoint presentation - marel.com · healthy mix of revenues deriving from greenfields,...
TRANSCRIPT

Q2 2019
25 July 2019
Investor meeting

Chief Financial Officer
LINDA JÓNSDÓTTIR
Chief Executive Officer
ÁRNI ODDUR THÓRDARSON

• Orders received were EUR
311m, up 6.9% YoY
• Revenues in 2Q19 were
EUR 327m, up 10.0% YoY
• EBIT1 up by 14.8% YoY. EBIT1
margin of 15.2% in 2Q19
• Book-to-bill ratio was 0.95, and
order book stands at 36% of
12 month trailing revenues
• Net profit in 2Q19 was
up 16.3% YoY
• Timing impacted cash flow in
the quarter, mostly due to work
in progress and taxes paid
• Leverage at 0.6x at the end of
2Q19 following the 15% share
capital increase
Q2 2019 FINANCIAL HIGHLIGHTS
Revenues increased by 10% year-on-year and 15% increase in EBIT1
HIGHLIGHTS
3
1Operating income adjusted for purchase price allocation (PPA) costs related to acquisitions
REVENUES
EUR m
ORDERS RECEIVED
EUR m
ORDER BOOK
EUR m
297 282331 325 327
3Q182Q18 4Q18 1Q19 2Q19
14.6 14.2 14.6 14.6 15.2
4Q183Q182Q18 1Q19 2Q19
291268
296323 311
2Q18 3Q18 1Q194Q18 2Q19
34.8
10.4
40.544.0
2Q18 4Q183Q18 1Q19 2Q19
523 511476 475 459
3Q182Q18 4Q18 1Q19 2Q19
1.8x2.1x 2.0x
2.2x
0.6x
1Q193Q182Q18 4Q18 2Q19
EBIT1 MARGIN
%
FREE CASH FLOW
EUR m
LEVERAGE
Net debt/EBITDA
-1.7

GOOD QUALITY OF EARNINGS
Strong track record of a well diversified revenue structure across
industries, geographies and business mix
REVENUES BY INDUSTRY
%
REVENUES BY GEOGRAPHY
%
REVENUES BY BUSINESS MIX
%
4
25%
45%
30%
2Q19
North-America
Europe
Rest of the world
11%
32%
56%
2Q19
1%
1/3
1/3
1/338%
31%
31%
2Q19
Maintenance
Service and repairs
Greenfield and large projects
Modernization and
standard equipment
EUR
327m
Other
Poultry
Meat
Fish

BALANCED REVENUE MIX
Global reach and focus on full-line offering across the poultry, meat and fish industries
counterbalance fluctuations in customer demand
POULTRY MEAT FISH
• Revenues down 21.3% year-on-year, mainly
due to soft orders received in 2H18.
• EBIT is low in the quarter, at a level of 2.3%.
Main reason being lower volume to cover
operational expenses, although gross profit is
at good level. In addition to changes in product
mix delay revenue and profit recognition.
• Standard equipment sales at good level and
large projects activities picking up in the
Nordics and both North and South America
• Management is targeting medium and long-
term EBIT margin expansion for Marel Fish
• Revenues up 10.5% year-on-year, in part due
to strong growth in Russia, Asia and Oceania
• Orders received in the quarter was strong in
Meat, specially in primary processing, with
large projects booked in the quarter coming
from the Netherlands, Russia and Brazil
• Total order book for Marel Meat remains
robust with strong momentum in Europe as
well as Russia
• Management is targeting medium and long
term EBIT1 margin expansion for Marel Meat
• Revenues up 17.9% year-on-year, and Marel
Poultry continues to deliver strong growth and
operational performance as the most
advanced industry within Marel
• High growth in maintenance revenues and
pipeline building up in standard equipment to
advance and modernize existing plants
• Large orders booked in Vietnam, China,
Canada and the US. Europe and North
America market is softer in new greenfields
while demand has shifted to Asia, in particular
to China
EUR 35.2m revenues 2Q19
2.3% EBIT margin 2Q19
5.0% EBIT margin YTD 2019
EUR 104.1m revenues 2Q19
11.2% EBIT1 margin 2Q19
11.9% EBIT1 margin YTD 2019
EUR 182.5m revenues 2Q19
20.2% EBIT margin 2Q19
18.9% EBIT margin YTD 2019
Full-line offering with one of the largest installed
bases world-wide, focus on roll-out of innovative
products and market penetration through cross-selling
of secondary and further processing solutions
Full-line since 2016, focus going forward on strong
product development, increased standardization,
modularization and market penetration and further
cross-selling and up-selling
Aim to fill certain primary processing applications
with innovation and / or M&A to accelerate full-line
offering of data-driven processing focused on
salmon, wild whitefish and farmed whitefish
55Source: Company information. Note: All financial numbers relate to the Q2 2019 Condensed Consolidated Interim Financial Statements. Other segment account for around 1% of the revenues.1 Operating income adjusted for purchase price allocation (PPA) costs related
to acquisitions.
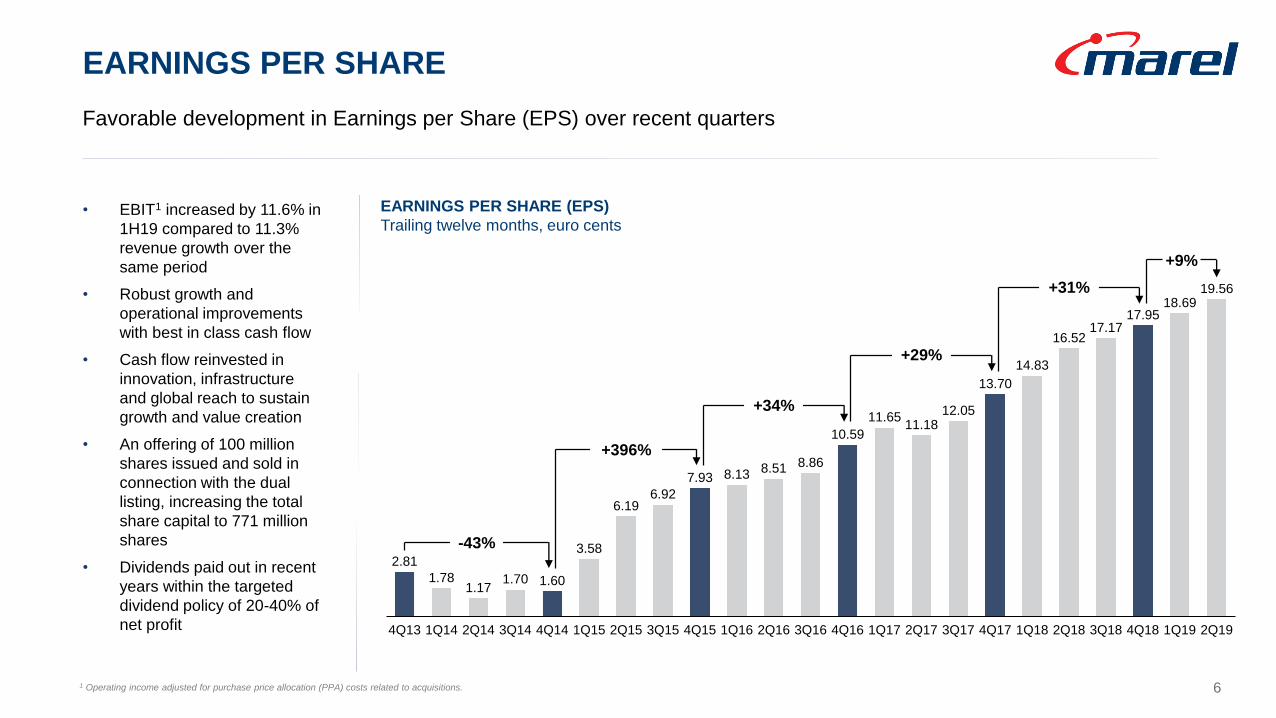
• EBIT1 increased by 11.6% in
1H19 compared to 11.3%
revenue growth over the
same period
• Robust growth and
operational improvements
with best in class cash flow
• Cash flow reinvested in
innovation, infrastructure
and global reach to sustain
growth and value creation
• An offering of 100 million
shares issued and sold in
connection with the dual
listing, increasing the total
share capital to 771 million
shares
• Dividends paid out in recent
years within the targeted
dividend policy of 20-40% of
net profit
EARNINGS PER SHARE
Favorable development in Earnings per Share (EPS) over recent quarters
6
EARNINGS PER SHARE (EPS)
Trailing twelve months, euro cents
2.81
1.781.17
1.70 1.60
3.58
6.196.92
7.93 8.13 8.51 8.86
10.59
11.6511.18
12.05
13.70
14.83
16.5217.17
17.9518.69
19.56
4Q184Q13 2Q163Q154Q14 1Q15 2Q15 1Q193Q184Q174Q16 2Q171Q17 3Q173Q16 1Q18 2Q181Q164Q15 2Q191Q14 3Q142Q14
-43%
+396%
+34%
+29%
+31%
+9%
1 Operating income adjusted for purchase price allocation (PPA) costs related to acquisitions.

LINDA JÓNSDÓTTIR
FINANCIAL
PERFORMANCEChief Financial Officer

• Orders received were EUR
311m, up 6.9% YoY
• Revenues in 2Q19 were
EUR 327m, up 10.0% YoY
• Book-to-bill ratio was 0.95 in
the quarter compared to 0.99 in
1Q19
• Order book was 36% of trailing
12 months revenues and
primarily constitutes greenfield
projects and large projects with
long lead times
• Significant proportion of Marel's
revenues derived from the
service and spare parts
business, in total around 35%
of 2Q19 revenues
• A dynamic shift in greenfield
orders with growth in Asia, in
particular in China, while
Europe and North America
were softer
STRONG TOP-LINE GROWTH AND SOLID ORDERS RECEIVED
Healthy mix of revenues deriving from greenfields, modernisation, and standard equipment,
around 35% of revenues derive from service and spare parts sales on the installed base world-wide
0
50
100
150
200
250
300
350
400
0
50
100
150
200
250
300
350
400
Q1 Q2 Q3 Q4 Q1 Q2 Q3 Q4 Q1 Q2 Q3 Q4 Q1 Q2
Revenues Orders received
2016
Source: Company information.
2017 2018
8
REVENUE AND ORDER EVOLUTION
EUR m
2019

• Revenues increased by 10.0%
YoY in 2Q19
• Gross profit margin at 39.9%
(2Q18: 38.8%)
• Operational expenses
- R&D at 6.2% (2Q18: 5.6%)
- S&M at 12.2% (2Q18: 11.3%)
- G&A at 6.3% (2Q18: 7.3%)
• EBIT1 increasing by 14.8% YoY.
EBIT1 margin of 15.2% in 2Q19
(2Q18: 14.6%)
• Fluctuation in adjusted EBIT
margins quarter on quarter can
be expected as timing of big
projects and product mix can
have an effect
ROBUST OPERATIONAL PERFORMANCE
Strong revenue growth in the quarter of 10.0% YoY with a
healthy profit margin of 15.2% EBIT1
Source: Company information.
Note: 1 Operating income adjusted for purchase price allocation (PPA) costs related to acquisitions. 2 Adjusted for PPA costs related to acquisitions. from 2016 – 2019 and refocusing
costs in 2014 and 2015 relating to “Simpler, Smarter, Faster” programme. PPA refers to amortisation of acquisition-related. (in)tangible assets. 3 Adjusted EBIT in Q4 2015 is not
adjusted for 3.3m cost related to the MPS acquisition, which was described in the Company’s Q4 2015 report and recorded in general and administrative expenses.
0.0%
3.0%
6.0%
9.0%
12.0%
15.0%
18.0%
21.0%
24.0%
0
5
10
15
20
25
30
35
40
45
50
Q1 Q2 Q3 Q4 Q1 Q2 Q3 Q4 Q1 Q2 Q3 Q4 Q1 Q2 Q3 Q4 Q1 Q2 Q3 Q4 Q1 Q2
Adjusted EBIT % margin
2014 2015 2016 2017 2018
9
ADJUSTED EBIT EVOLUTION2
EUR m
3
2019

350
1,144 1,038
472
1,184 1,198
476
323 325
475
311 327
459
16
2016 2017 2018 Q1 2019 Q2 2019
IFRS adjustment3• Order book consists of orders
that have been signed and
financially secured with down
payments and / or letters of
credit for the outstanding
amount
• Meat projects have in general
longer lead times than poultry,
while fish projects have shorter
cycles
• Vast majority of the order book
are greenfield projects while
spare parts and standard
equipment run faster through
the system
• Low customer concentration
with no customer accounting
for >5% of the total revenues
• Well diversified order book by
size with widely spread delivery
times
SOLID ORDERS RECEIVED AND REVENUES CLOSE TO RECORD
Order book at 36% of trailing 12 months revenues
Source: Company information. Note: 1 The order book reflects Marel’s estimates, as of the relevant order book date, of potential future revenues to be derived from contracts for equipment,
software, service and spare parts which have been financially secured through down payments and/or letters of credit in line with the relevant contract terms. These estimates reflect the
estimated total nominal values of amounts due under the relevant contracts less any amounts recognised as revenues in Marel’s financial statements as of the relevant order book date. 2
Orders received represents the total nominal amount, during the relevant period, of customer orders for equipment, software, service and spare parts registered by Marel. 3 One-time effect
related to the adoption of IFRS 15. 4 Including acquired order book of Sulmaq of EUR 17m. 5 Including acquired order book of MAJA of EUR 2m.
Order book1 Orders received2 Revenues
4 5
10
Order book % trailing 12
month revenues36% 45% 40% 39% 36%
Book-to-bill ratio 1.04x 1.10x 0.99x 0.99x 0.95x
ORDER BOOK
EUR m

INCOME STATEMENT: Q2 2019
Gross profit was EUR 130.2 million or 39.9% of revenues
and net result was EUR 34.3 million
11
In EUR million Q2 2019 Of revenues Q2 2018 Of revenues Change
Revenues 326.5 296.7 +10.0%
Cost of sales (196.3) (181.7) +8.0%
Gross profit 130.2 39.9% 115.0 38.8% +13.2%
Selling and marketing expenses (39.7) 12.2% (33.5) 11.3% +18.5%
Research and development expenses (20.4) 6.2% (16.7) 5.6% +22.2%
General and administrative expenses (20.5) 6.3% (21.6) 7.3% -5.1%
Adjusted result from operations1 49.6 15.2% 43.2 14.6% +14.8%
PPA related costs (2.7) (2.3) +17.4%
Result from operations 46.9 14.4% 40.9 13.8% +14.7%
Net finance costs (2.5) (3.1) -19.4%
Result before income tax 44.4 37.8 +17.5%
Income tax (10.1) (8.3) +21.7%
Net result 34.3 10.5% 29.5 9.9% +16.3%
Note: The income statement as presented above provides an overview of the quarterly Adjusted result from operations, which management believes to be a relevant Non-IFRS measurement.
The income statement as presented in the Condensed Consolidated Financial Statements is shown in the appendix.1Operating income adjusted for purchase price allocation (PPA) costs related to acquisitions

• Total operating working
capital in 2019 changed
close to EUR 34m over the
quarter mostly due to
increase in contract assets
and inventories
• Inventories rising partly
because of volume and
partly because of increase in
fast moving parts to secure
shorter delivery times
• The work-in-progress
(contract assets) build up in
the quarter is a timing matter
while the inventory build up
is a special initiative to
shorten lead times in spares
and standard equipment
• Cash balance increasing
because of the equity
issuance around the listing,
part of the funds used to
repay revolving facilities
In EUR million 30/06 2019 31/12 2018 Change
Property, plant and equipment 178.5 175.6 +1.7%
Right of use assets 35.7 33.3 +7.2%
Goodwill 644.1 641.3 +0.4%
Intangible assets (excluding goodwill) 259.3 267.0 -2.9%
Investments in associates 1.8 000 - +100.0%
Trade and other receivables 3.2 3.2 -
Derivative financial instruments 1.4 1.3 +7.7%
Deferred income tax assets 15.7 10.2 +53.9%
Non-current assets 1,139.7 1,131.9 +0.7%
Inventories 165.3 149.9 +10.3%
Contract assets 59.4 44.0 +35.0%
Trade receivables 142.2 138.8 +2.5%
Other receivables and prepayments 61.8 45.0 +37.3%
Cash and cash equivalents 276.7 56.3 +391.5%
Current assets 705.4 434.0 +62.5%
TOTAL ASSETS 1,845.1 1,565.9 +17.8%
BALANCE SHEET: ASSETS
Q2 2019 Condensed Consolidated Interim Financial Statements
HIGHLIGHTS ASSETS
12

• Leverage ratio 0.6x net debt
/ EBITDA at end of 2Q19
following the share capital
increase
• Financial strength to support
strategic growth in line with
the company‘s growth
targets
• Contract liabilities
(production contracts) reflect
down payments from
customers on projects that
will be produced
BALANCE SHEET: EQUITY AND LIABILITIES
HIGHLIGHTS EQUITY AND LIABILITIES
In EUR million 30/06 2019 31/12 2018 Change
Group equity 911.7 560.9 +62.5%
Borrowings 342.6 429.3 -20.2%
Lease liability 27.5 27.1 +1.5%
Deferred income tax liabilities 56.9 57.3 -0.7%
Provisions 10.4 9.2 +13.0%
Other liabilities 3.1 3.0 +3.3%
Derivative financial instruments 0.4 1.4 -71.4%
Non-current liabilities 440.9 527.3 -16.4%
Contract liabilities 210.1 212.1 -0.9%
Trade and other payables 222.7 217.0 +2.6%
Current income tax liabilities 18.3 9.3 +96.8%
Borrowings 24.8 24.8 0.0%
Lease liability 8.5 6.7 +26.9%
Provisions 8.1 7.8 +3.8%
Current liabilities 492.5 477.7 +3.1%
Total liabilities 933.4 1,005.0 -7.1%
TOTAL EQUITY AND LIABILITIES 1,845.1 1,565.9 +17.8%13
Q2 2019 Condensed Consolidated Interim Financial Statements

• Cash flow, both operational and
free cash flow unusually low in
the quarter
• Investments were at a lower
level than previous quarters
with EUR 9.8m (2Q18: EUR
12.6m) as facility investments
are scaling down after a period
of significant investments
• Book-to-bill ratio of 0.95 and
timing of work in progress
negatively impact cash flow
• Net debt decreased by EUR
345.8m between quarters and
part of the cash from the equity
issue was used to repay
revolving loan facilities
• In June 2019, Marel signed an
agreement to acquire a minority
stake in Canadian software
company Worximity Technology
Inc.
CASH FLOW
In the quarter, main impact on cash flow was due to timing of work in progress and taxes paid
14
CASH FLOW
EUR m
Note: 1 Free cash flow defined as cash generated from operating activities less tax and net investments. 2 Excluding transaction costs of EUR 8.6m. 3 Currency effect, change in capitalized finance charges and cost of lease liabilities.
Cash
generated
from
operating
activities
22.3
EBIT
46.9
Non cash
items
14.2
Changes in
working
capital
38.8
Tax
16.0Investing
activities
8.0
Free cash
flow1
-1.7
Net finance
costs
4.1
Investment in
associates
(Worximity)
1.8
New shares
issued2
361.4
Other
items3
8.0
Decrease in
net debts
345.8

EARNINGS PER SHARE1
EUR cents per share
KEY PERFORMANCE METRICS
Proven track record of earnings results and value creation
FREE CASH FLOW2
EUR m
Source: Company information.
Note: 1 Basic earnings per share, trailing twelve months. 2 Free cash flow defined as cash
generated from operating activities less tax and net investments.
NET DEBT / EBITDA
Leverage (x)
Consistent and high EPS growth trajectory
• Earnings per share expected to increase
faster than revenue growth subject to
continuing operational improvement and
value creation
15
Q2 Q2 Q2
Stable leverage in recent years
• Net debt / EBITDA at 0.6x at the end of
2Q19 following the share capital increase in
connection with the dual listing
• Financial strength to support strategic
growth in line with the company‘s growth
targets
Free cash flow was EUR -1.7m (2Q18: EUR
34.8m)
• Operational cash flow before taxes and
investment is at low level mainly due to
increase in work-in-progress and the
increase in inventories
• Taxes paid was EUR 16m in 2Q19,
compared to EUR 9m in 2Q18
• Marel continues to invest in the business to
prepare for future growth with the objective
to achieve its full potential
131.2
152.5
120.6
34.8
2016 2017 2018 2018 2019
10.6
13.7
18.016.5
19.6
2016 20192017 2018 2018
2.3x
1.9x2.0x
1.8x
0.6x
2017 20192016 20182018
-1.7
ÁRNI ODDUR THÓRDARSON
BUSINESS
& OUTLOOKChief Executive Officer

Listed since 1992
Listed since June 2019
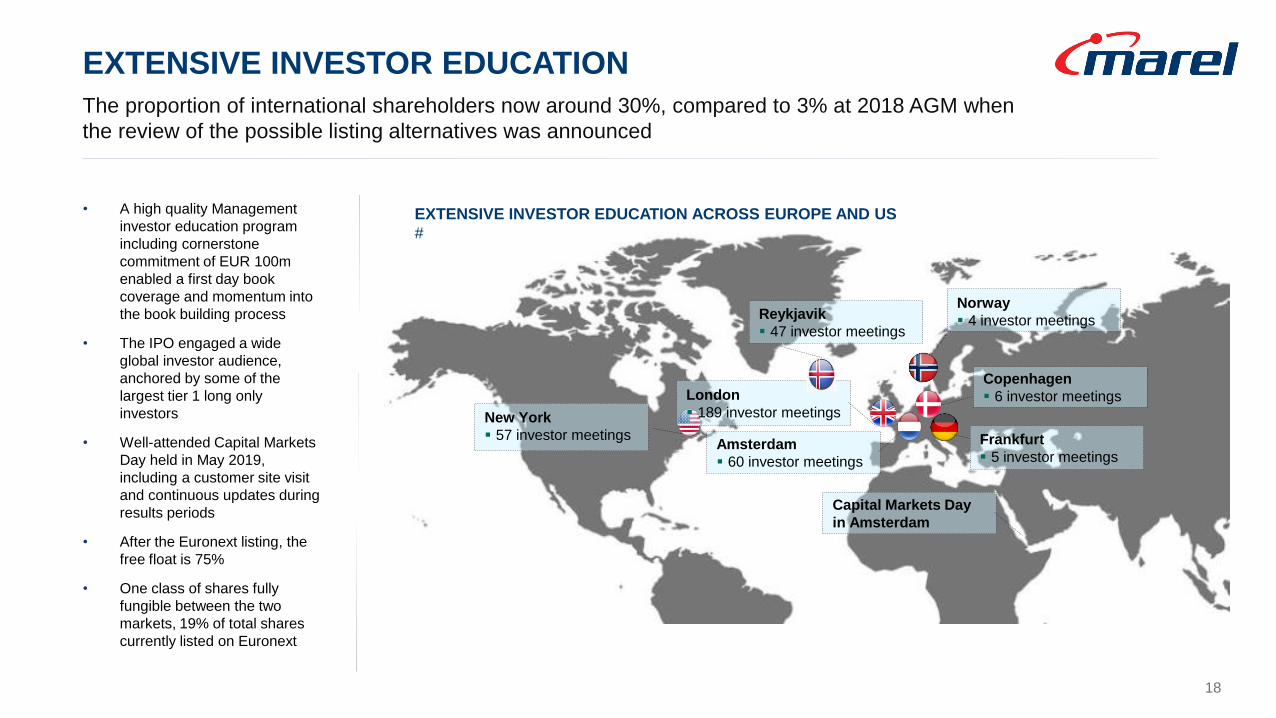
• A high quality Management
investor education program
including cornerstone
commitment of EUR 100m
enabled a first day book
coverage and momentum into
the book building process
• The IPO engaged a wide
global investor audience,
anchored by some of the
largest tier 1 long only
investors
• Well-attended Capital Markets
Day held in May 2019,
including a customer site visit
and continuous updates during
results periods
• After the Euronext listing, the
free float is 75%
• One class of shares fully
fungible between the two
markets, 19% of total shares
currently listed on Euronext
EXTENSIVE INVESTOR EDUCATION
The proportion of international shareholders now around 30%, compared to 3% at 2018 AGM when
the review of the possible listing alternatives was announced
18
New York
57 investor meetings
Norway
4 investor meetingsReykjavik
47 investor meetings
London
189 investor meetings
EXTENSIVE INVESTOR EDUCATION ACROSS EUROPE AND US
#
Amsterdam
60 investor meetings
Frankfurt
5 investor meetings
Copenhagen
6 investor meetings
Capital Markets Day
in Amsterdam

ALL KEY OBJECTIVES MET
Goal was to expand the international investor base, increase brand awareness, realize a more
liquid aftermarket and provide an acquisition currency to support long term growth ambition
19
• High quality order book with long only institutional investors, including cornerstone investors were allocated around
79% of shares, hedge funds around 16% and 5% retail investors from Iceland and the Netherlands
• More than 4,700 investors participated in the offering, compared to the approximate 2,500 shareholders in Marel
prior to the dual-listing and international shareholdings of Marel rose from 3% at 2018 AGM to 30% after listing
Access to
international investor
base
• The Euronext Amsterdam listing will support the next phase of our growth, as liquid and tradable shares are an
important acquisition currency
• Share price was set at EUR 3.70 and opened at EUR 3.85 with a close on the first day of trading at EUR 3.90
• Shares are trading well in the aftermarket, shares on NASDAQ Iceland moved in line with the Euronext Amsterdam
shares.
• Many of our potential acquisition targets are well-run family-owned companies and by offering them Marel shares
listed in EUR on an international stock exchange, they can become a part of the Marel growth story going forward
• Six international equity analysts are actively following Marel, in addition to Icelandic analysts
• Marel stock is not yet included in any global indices
• Share fungibility is working with one class of shares across Euronext Amsterdam and NASDAQ Iceland
• Free market arbitration stabilizing price levels between markets
• Net 30 million of shares have transferred from Nasdaq Iceland to Euronext Amsterdam post dual listing
Improved liquidity
and fair trading
Fungibility of shares
Acquisition currency
Analyst coverage

INVESTING IN GROWTH
Target of 12% average annual revenue growth in 2017-2026, capitalizing on R&D investments and
strengthening the value chain organically and via strategic investments
INNOVATION ORGANIC STRATEGIC
Growth is not expected to be linear but based on
opportunities and economic fluctuations
Annual revenue growth
expected at
5-7% …acquisition growth
to accelerate full line offering
and market penetration
Annual market growth
expected at
4-6%
…driven by innovation and
market penetration, Marel
aims to grow faster than
market
R&D
commitment of
~6% of revenues
20

INNOVATION IN MAREL MEAT
At IFFA Marel Meat introduced 20 new solutions covering the meat processing value chain, setting
standards for flexibility, efficiency, food safety, traceability and product diversity.
COATING LINE
Marel´s coating
portfolio unlocks
profitable
opportunities for
producing
convenience products
SENSORX MAGNA
Marel’s newest
high-capacity, inline
trim inspection
system designed to
keep trim bone free
and CL1 ratio on
target
M-LINE LEAF LARD
REMOVER ROBOT
Robots are now able
to handle leaf lard
removal precisely,
efficiently and
without damage of
carcass surface
M-LINE BUNG
REMOVER ROBOT
Making it easier to
avoid clean meat
contamination
PREMIUM FORMER
Latest generation
burger solution to
create standard
burger, tender fresh,
hom style or butcher
burgers to the highest
quality
ROBOT BATCHER
For gripping meat
products and placing
them into a variety of
trays. Ensures
minimum giveaway
and enables a multi-
output process
DEBOFLEX
Automated hanging
pork deboning system.
It is now also possible
to integrate an intra-
logistics system for
product and crate
distribution
INNOVA FOOD PROCESSING SOFTWARE
Innova enables production control of the machines, processes and procedures in the plant
while ensuring reliable data collection and traceability throughout the production process
21Source: Company information. Note: 1 Chemical lean ratio.
V-CUT 160 & 200
Designed to cut
boneless, non-frozen,
meat into fixed-weight
portions of uniform
shape. Marel now has
the widest selection of
volumetric portioning
machines
Secondary processingFurther processing
Further processing
I
N
N
O
V
A
I
N
N
O
V
A
Primary processing
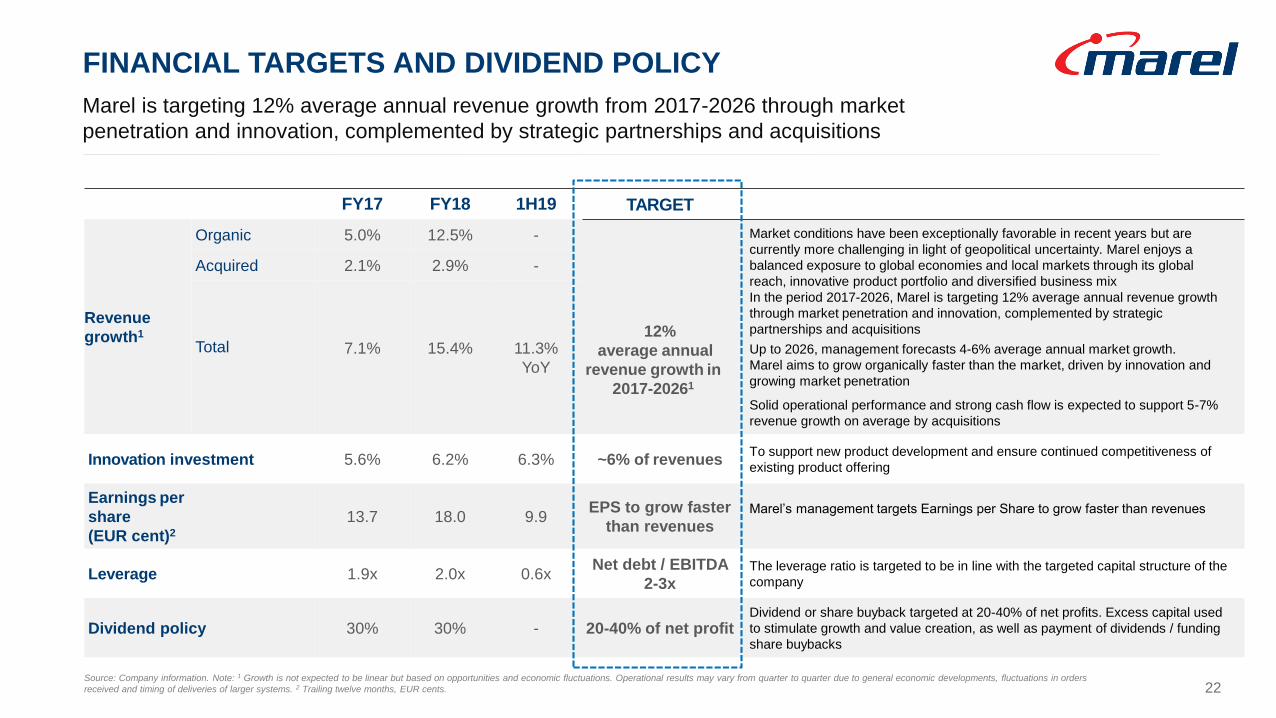
FINANCIAL TARGETS AND DIVIDEND POLICY
Marel is targeting 12% average annual revenue growth from 2017-2026 through market
penetration and innovation, complemented by strategic partnerships and acquisitions
FY17 FY18 1H19 TARGET
Revenue
growth1
Organic 5.0% 12.5% -
12%
average annual
revenue growth in
2017-20261
Market conditions have been exceptionally favorable in recent years but are
currently more challenging in light of geopolitical uncertainty. Marel enjoys a
balanced exposure to global economies and local markets through its global
reach, innovative product portfolio and diversified business mix
In the period 2017-2026, Marel is targeting 12% average annual revenue growth
through market penetration and innovation, complemented by strategic
partnerships and acquisitions
Up to 2026, management forecasts 4-6% average annual market growth.
Marel aims to grow organically faster than the market, driven by innovation and
growing market penetration
Solid operational performance and strong cash flow is expected to support 5-7%
revenue growth on average by acquisitions
Acquired 2.1% 2.9% -
Total 7.1% 15.4% 11.3%
YoY
Innovation investment 5.6% 6.2% 6.3% ~6% of revenuesTo support new product development and ensure continued competitiveness of
existing product offering
Earnings per
share
(EUR cent)2
13.7 18.0 9.9EPS to grow faster
than revenuesMarel’s management targets Earnings per Share to grow faster than revenues
Leverage 1.9x 2.0x 0.6xNet debt / EBITDA
2-3xThe leverage ratio is targeted to be in line with the targeted capital structure of the
company
Dividend policy 30% 30% - 20-40% of net profitDividend or share buyback targeted at 20-40% of net profits. Excess capital used
to stimulate growth and value creation, as well as payment of dividends / funding
share buybacks
22Source: Company information. Note: 1 Growth is not expected to be linear but based on opportunities and economic fluctuations. Operational results may vary from quarter to quarter due to general economic developments, fluctuations in orders
received and timing of deliveries of larger systems. 2 Trailing twelve months, EUR cents.

23
In partnership with our customers we are
transforming the way food is processed
Marel‘s vision is of a world where quality food is
produced sustainably and affordably

Q&A
LINDA JÓNSDÓTTIR
CFO
ÁRNI ODDUR THÓRDARSON
CEO

THANK YOU

FORWARD-LOOKING STATEMENTS
26
DISCLAIMER
Statements in this press release that are not based on historical facts are
forward-looking statements. Although such statements are based on
management’s current estimates and expectations, forward-looking statements
are inherently uncertain.
We therefore caution the reader that there are a variety of factors that could
cause business conditions and results to differ materially from what is
contained in our forward-looking statements, and that we do not undertake to
update any forward-looking statements.
All forward-looking statements are qualified in their entirety by this cautionary
statement.
Statements regarding market share, including those regarding Marel’s
competitive position, are based on outside sources such as research institutes,
industry and dealer panels in combination with management estimates.
Where information is not yet available to Marel, those statements may also be
based on estimates and projections prepared by outside sources or
management. Rankings are based on sales unless otherwise stated.
MARKET SHARE DATA