powerpoint presentation: coupling carbonless electricity ... · pdf filecoupling carbonless...
TRANSCRIPT
1
Coupling Coupling Carbonless Carbonless ElectricityElectricityand Hydrogen Transportationand Hydrogen Transportation
9 July 2003
Gene Berry & Alan Lamont([email protected])
Energy and Environment DirectorateLawrence Livermore National Laboratory
Livermore, CA

2
QuickTime™ and a TIFF (PackBits) decompressor are needed to see this picture.
Present Challenges and Future History:Present Challenges and Future History:global energy use may quadruple over 50 yearsglobal energy use may quadruple over 50 yearsaccording to Shell’s sustained growth scenarioaccording to Shell’s sustained growth scenario
Today:Near-term concerns merit
moving toward hydrogen• zero tail-pipe emissions• national security:universal availability• economic security:vehicles, fuel, and utilitiesare critical industries• economic integration ofrenewable intensive &decentralized transportationand utility sectors
Tomorrow:Energy carriers will be hydrogen and electricity
• food,land, and water will limit biomass• atmosphere will limit carbon emissions• security will limit economic oil and gas
20 TW

3
2000 U.S. Energy Flow is 104 EJ/2000 U.S. Energy Flow is 104 EJ/yryr (3.3 TW) but (3.3 TW) butElectricity is only 3.6 Trillion kWh (0.4 TW) (30% Electricity is only 3.6 Trillion kWh (0.4 TW) (30% effeff.).)
4
$0
$10
$20
$30
$40
$50
$60O
il Pr
ice
(199
2 $/
Bar
rel)
1970 1975 1980 1985 1990 1995
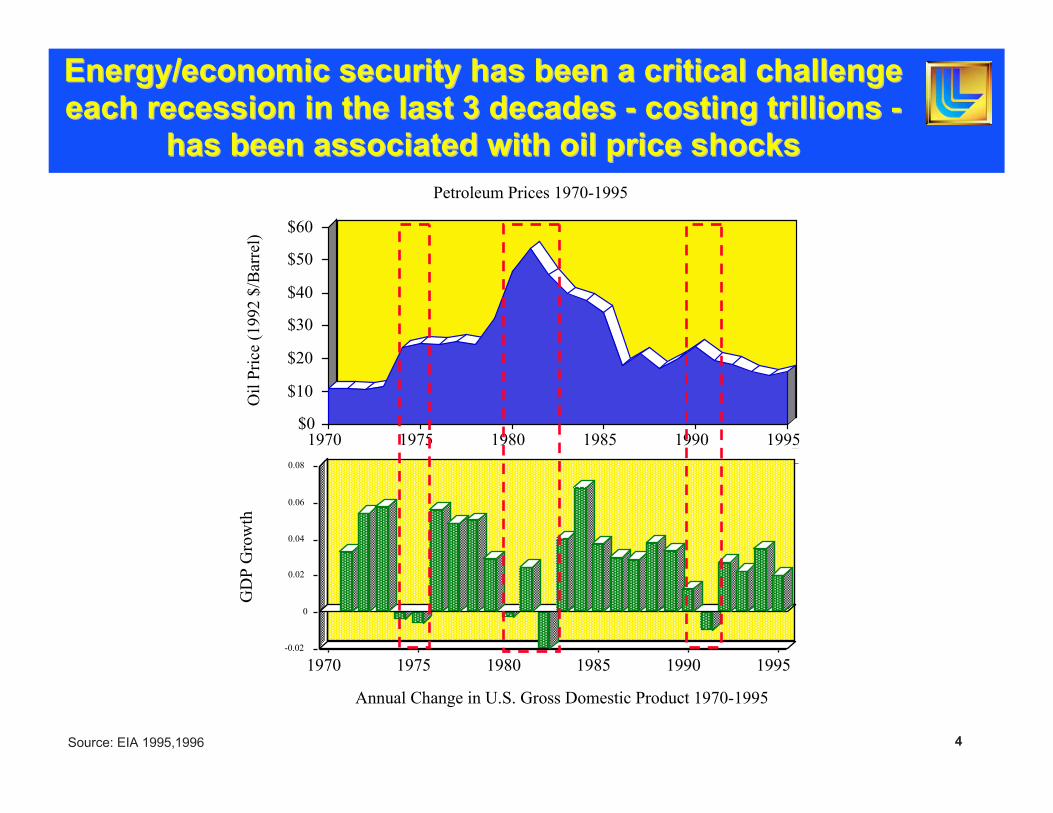
Petroleum Prices 1970-1995
-0.02
0
0.02
0.04
0.06
0.08
GD
P G
row
th
1970 1975 1980 1985 1990 1995
Annual Change in U.S. Gross Domestic Product 1970-1995
Source: EIA 1995,1996
Energy/economic security has been a critical challengeEnergy/economic security has been a critical challengeeach recession in the last 3 decades - costing trillions -each recession in the last 3 decades - costing trillions -
has been associated with oil price shockshas been associated with oil price shocks

5Source: EIA 1995,1996
QuickTime™ and a TIFF (PackBits) decompressor are needed to see this picture.
U.S. highway oil consumption is projected to grow fromU.S. highway oil consumption is projected to grow fromtwice to three times domestic oil production by 2020twice to three times domestic oil production by 2020

6
Primary EnergyRenewable
Nuclear
Fusion
Fossil
Processed EnergyElectricity
Heat
MaterialAir
Water
Natural Gas
Biomass
Waste
FuelsHydrogen
Oxygen
Ammonia
Methane
Water
GasCompressed
Cryo Compressed
LiquidLH2
LO2
LNG
Ammonia
Water
SolidWarm: FeTiH2, LaN5H6
Hot:MgH2 , TiH2
Fullerene
Recover GasElectrolyze
Heat
Fuel CellPlastic
Ceramic
Alkaline
Molten
MotorElectric
AuxiliaryFlywheel
Supercap
TransportationAutomibile
Bus
Truck
Train
Ship
Airplane
CombustionEngine
Turbine
PEM FC
SO FC
Gas Turbine
Myriad (future) replacements for oil can be envisionedMyriad (future) replacements for oil can be envisioned

7
HH22 is just one of many potential synthetic fuels is just one of many potential synthetic fuelsbut also the but also the majority majority componentcomponent
and production precursor for them alland production precursor for them all
QuickTime™ and a TIFF (PackBits) decompressor are needed to see this picture.
8
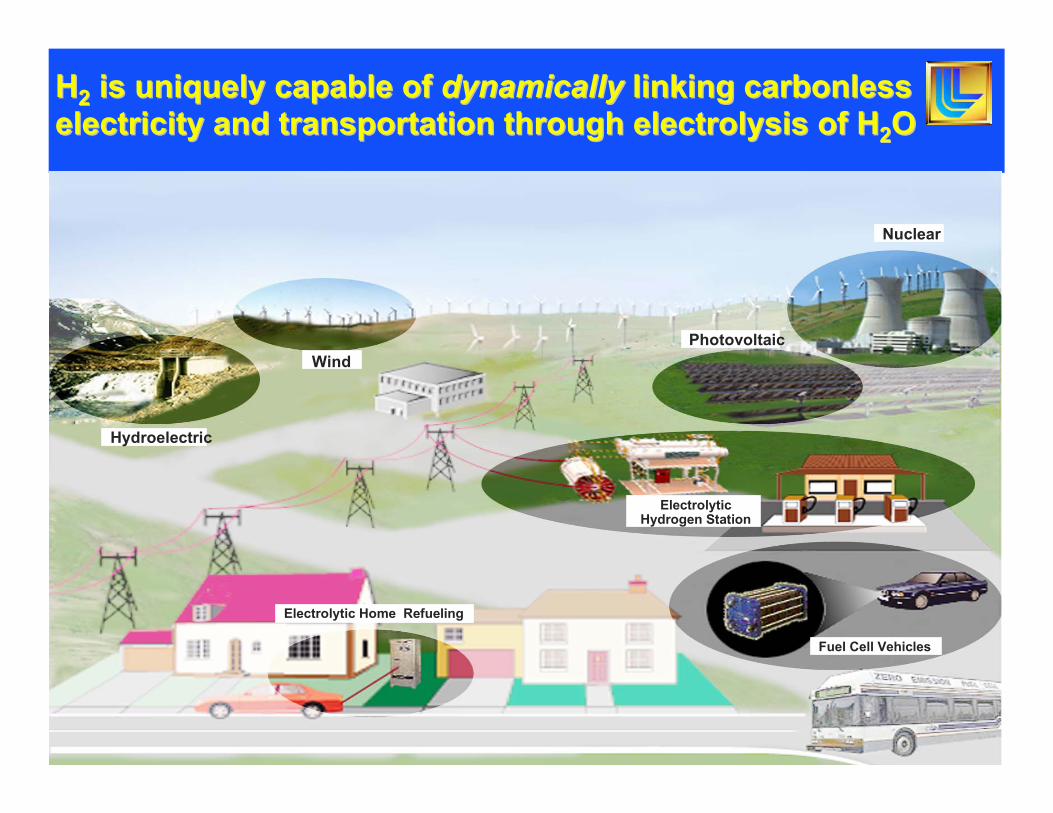
HH22 is uniquely capable of is uniquely capable of dynamicallydynamically linking linking carbonlesscarbonlesselectricity and transportation through electrolysis of Helectricity and transportation through electrolysis of H22OO
PhotovoltaicWind
Nuclear
ElectrolyticHydrogen Station
Fuel Cell Vehicles
Electrolytic Home Refueling
Hydroelectric

9
Natural gas
Electric demand Cars and trucks demand
Long term storage (liquid H2)
Short term storage (compressed H2)
Elect- rolyzer 1
Fuel cell
PhotovoltaicWind
Fossil generator
Electrolyzer 2
Aircraft demand
CompressorLiquefier
Fly- wheel
Nuclear
H2 flowsElectricity flows
Distribution (market) nodes
H2 Utilization(transportation fuel)
H2 Storage(gaseous & cryogenic liquid)
H2 Production(electrolysis)
Electricity Generation(regeneration by fuel cell)
Primary Energy(fossil or non-fossil)
Distinct from fossil fuels,Distinct from fossil fuels,HH22 is not an energy source, is not an energy source,
HH22 instead carries energy from primary sources instead carries energy from primary sources

10
Strategic advantages of HStrategic advantages of H22 as an energy carrier as an energy carrier
• Clean non-toxic, made from (and returns to) H2O
• Carbonless Zero emissions (e.g. greenhouse gases)
• Universal Feasible for all transportation modes (air, land,sea)
• Versatile H2 can carry energy from any source (electricity)
• Synergistic Dynamic integration of electricity & transportation
• Transitional Smooth, scalable, flexible infrastructure evolution
• Ultimate H2 is simple, pure, light, efficient, final

11
SecondaryEnergy
PrimaryEnergy
Production ofH2 (& O2)
Wind
Biomass
Nuclear
Solar
Fossil
Thermal
Photovoltaic
HydropowerElectric
ThermochemicalSteam Decomposition
Cycles
Steam Electrolysis
Water Electrolysis
Steam ReformingChemical
FissionFusion
Photoelectrolysis
HH22 production fundamentally requires decomposing H production fundamentally requires decomposing H22OOinto Hinto H2 2 and Oand O22 by myriad methods by myriad methods
but all use thermal, electric, or chemical energybut all use thermal, electric, or chemical energy

12
DirectDirect thermal decomposition of H thermal decomposition of H22O is hampered by theO is hampered by thethermodynamic thermodynamic equilibriaequilibria of steam. T > 2500 K is needed of steam. T > 2500 K is neededbut Hbut H2 2 and Oand O2 2 also decompose at these high temperaturesalso decompose at these high temperatures

13
Multi-stepMulti-step thermochemical thermochemical HH22O decomposition reducesO decomposition reducespeak temperatures, but also lowers peak temperatures, but also lowers Carnot Carnot efficiencyefficiency
GA claims HTGR S-I cycles can achieve ~42% (50% HHV) GA claims HTGR S-I cycles can achieve ~42% (50% HHV)

14
+ – + + –H2O (g) + H2O2
H2O (g)
H2O + O2
H2O (l)
–H2
H2O2
e- e- e-
Alkaline
CathodeCathodeCathodeAnode Anode Anode
OH- H+ O2-
Solid OxidePolymer
ElectrolyteMembrane
Electrolytic HElectrolytic H22 production technologies are production technologies arefundamentally distinguished by choice of ionfundamentally distinguished by choice of ion
(OH (OH--, H, H++, O, O2-2-) to be conducted across the electrolyte) to be conducted across the electrolyte

15
Conventional alkaline (KOH) electrolysis theoreticallyConventional alkaline (KOH) electrolysis theoreticallyrequires 1.23 Volts but 1.48 V (83%)to be requires 1.23 Volts but 1.48 V (83%)to be thermoneutralthermoneutral
and ~1.9 V (65% or 50 kWh/kg Hand ~1.9 V (65% or 50 kWh/kg H22) at high current density) at high current density

16
Electrolysis thermodynamics mean high water (steam)temperatures and pressures reduces theoretical voltage - if both heat and electricity are available
QuickTime™ and a TIFF (Uncompressed) decompressor are needed to see this picture.

17
On an equal energy basis HOn an equal energy basis H22 is the is the lightestlightest - - but also the but also the leastleast compactcompact fuel fuel
magnifying storage vessel mass, volume and cost magnifying storage vessel mass, volume and cost

18
Vessel walls, insulation, and LHVessel walls, insulation, and LH22 thermal expansion limit thermal expansion limit volumetric efficiency of high density Hvolumetric efficiency of high density H22 storage storage (all volumes shown store 5 kg H(all volumes shown store 5 kg H22 or energy equivalent) or energy equivalent)
5 gallons Gasoline 20 L
5 kg LH2 (20 K)
LH2 Volume = 75 L
15% Ullage
35 L
2.5 cm cryogenic insulation
11 L
3600 psi H2 (80 K)
H2 gas Volume = 93 L 39 L8 L
H2 gas Volume = 290 L 20 L
H2 gas Volume = 220 L 5000 psi H2 (300 K)
25 L
H2 gas Volume =130 L 32 L
CH4 Volume = 65 L 3600 psi CH4 (300 K)
60.3 m
2.5 cm cryogenic insulation
3600 psi H2 (300 K)
Vessel WallVolume
10,000 psi H2 (300 K)

19
HH22 will cost more than fossil fuels will cost more than fossil fuelsas long as the as long as the energyenergy to produce & store H to produce & store H22
costs more than fossil fuelscosts more than fossil fuels
0 1 2 3 4 5 6 7 8 9 10 11 12Delivered Hydrogen Cost ($/kg Hydrogen)
Liquid Hydrogen (Truck)Steam Reforming
Methanol ReformingAmmonia ReformingAlkaline ElectrolysisPolymer Electrolysis
Steam Electrolysis
Liquid Hydrogen (Truck)Methanol ReformingAmmonia ReformingAlkaline ElectrolysisPolymer Electrolysis
Steam Electrolysis
Liquid Hydrogen (Truck)Alkaline ElectrolysisPolymer Electrolysis
Alkaline ElectrolysisPolymer Electrolysis
Figure 8. Cost Breakdown of 7 Hydrogen Pathways for Stations, Fleets, and Homes (broken down by cost element )
Capital Investment(Prod. Equip. - 20 yr. life)
(Storage Equip. - 10 yr. life)
Operation and Maintenance
Interest (20% except forindividual vehicle case)
Fuel/Feedstock (Natural Gas,Methanol, Ammonia, Water)
Electricity($0.05/kwh)
Station Overhead ($2.40/car)
Full Station(300 cars/day)
Small Station(60 cars/day)
Individual Car (30 miles/day)
Fleet (10 cars/day)
$1.50/gallon of gasoline(energy equivalent)

20
0-0-60 mph i0-
Electric drive motor: 80 kW maximum powerBody and frame - Cd = 0.2; 1100 kg (empty wt)Cross-sectional area: 2.0 m2
Regenerative braking35km/L energy equivalent(0- 60 mph < 10 sec.)
30 kW fuel cell
PEAK POWER (2 kWh)
Advanced Batteries
Advanced Flywheel
HYDROGEN STORAGE: 5 kg/400 mile range Cryogenic (Insulated)
Pressure Vessel (20- 80K)
Ultracapacitors
or
or
PRIMARY ENERGY CONVERSION:
Metal hydride “sponge”<100 psi, < 100C
The expense and volume of The expense and volume of HH22 can (only) be overcome can (only) be overcomeby high efficiency (60-100 mpg or 25-40 km/L) vehiclesby high efficiency (60-100 mpg or 25-40 km/L) vehicles
using using onlyonly ~ 5 kg of ~ 5 kg of HH22 for 300-500 mile (480-800 km) range for 300-500 mile (480-800 km) range
Liquid hydrogen tank(50 psi, 20- 28K)
Compressed H2(5,000-10,000 psi)

21
BMW has prototyped 5 generations of LHBMW has prototyped 5 generations of LH2 2 carscarsA fleet of 15 dual-fuel vehicles have beenA fleet of 15 dual-fuel vehicles have been
road tested > 100,000 km road tested > 100,000 km
300 km LH2 range+
650 km gasoline range

22
A robotic LHA robotic LH2 2 refueling station has been demonstratedrefueling station has been demonstrated

23
LHLH22 storage is lightweight and routine for spacecraft but storage is lightweight and routine for spacecraft butLiquefaction is energy intensive (10 kWh/kg LHLiquefaction is energy intensive (10 kWh/kg LH22 or 30%) or 30%)LHLH22 requires heat transfer below 1 W to remain cold (~1 week) requires heat transfer below 1 W to remain cold (~1 week)

24
CovalentCovalent H H22 compounds are more compact than LH compounds are more compact than LH22 but butare hazardous (NHare hazardous (NH33) or use carbon (CH) or use carbon (CH44). ). IonicIonic & & metallicmetallichydrides are either heavy or release Hhydrides are either heavy or release H2 2 only when very hotonly when very hot
10,000 psi H2 gas on prototype automobiles

25
U.S. U.S. automakersautomakers have developed concept/prototype cars have developed concept/prototype carsin the past 2-3 years. Each stores 5-10 in the past 2-3 years. Each stores 5-10 ksiksi compressed H compressed H22
4 kg H2 @ 5000 psi
Fuel-cell Battery Hybrid
60-70 mpg
240-280 mile range

26
GM’s prototype chassis height is 6-12 GM’s prototype chassis height is 6-12 inchesinches to capture to captureplatform independent manufacturing economics but onlyplatform independent manufacturing economics but onlystores 2.0-3.5 kg Hstores 2.0-3.5 kg H22 in 5 -10 in 5 -10 ksiksi tanks (120-210 tanks (120-210 mimi @ 60 mpg) @ 60 mpg)
QuickTime™ and a TIFF (PackBits) decompressor are needed to see this picture.

27
NonlinearNonlinear H H22 gas density gas density vsvs. pressure. pressureis the fundamental property characteristic of gaseous His the fundamental property characteristic of gaseous H22limiting storage capacity to ~10 kg Hlimiting storage capacity to ~10 kg H22 in 250 L (66 gal) vessels in 250 L (66 gal) vessels

28Temperature, K
H2 d
ensi
ty (k
g/m
3)
Volu
me
(lite
rs) o
ccup
ied
by 5
kg
of H
2
0
10
20
30
40
50
60
70
80
90
100
20 60 100 140 180 220 260 300
500 atm
1.75
1.50 kWh/kg1.25
1.00
3.2550
100
500
2.75 kWh/kg3.00
2.00
350 atm250 atm
2000 atm
2.25
2.50 kWh/kg
1000 atm700 atm
200
Cooling from 300 K to 80 K or to LHCooling from 300 K to 80 K or to LH22 (20 K) (20 K)reduces Hreduces H22 volume dramatically volume dramatically
but energy intensity rises at cryogenic temperaturesbut energy intensity rises at cryogenic temperatures

29
Cryogenic compatible Cryogenic compatible pressure vessels compromisepressure vessels compromisebetween LHbetween LH22 (20 K) and high pressure H (20 K) and high pressure H22 (300 K) storage (300 K) storage
High pressure eliminates the H2 boiloff
of LH2 (low-pressure) tanks
More compact and/or lower pressurethan conventional (300 K) vessels
Can be refueled flexibly
300 K H2 (urban)or
Cryogenic (80 K) H2 & LH2 (highway)

30
Hydrogen storage pressure (atmospheres)
Max
imum
ene
rgy
rele
ase
from
adi
abat
ic e
xpan
sion
(kW
h pe
r kg
H2)
0
0.1
0.2
0.3
0.4
0.5
0.6
0.7
0 200 400 600 800 1000
300 K
150 K
80 K
The theoretical instantaneous maximum energy releasefrom an H2 vessel rupture is dramatically lower forcryogenic H2 and independent of pressure above 20-100 atm

31
2000 U.S. carbon (dioxide) emissions2000 U.S. carbon (dioxide) emissionsfrom energy consumption—1547* from energy consumption—1547* MtCMtC

32
Future deep greenhouse gas cuts must come fromFuture deep greenhouse gas cuts must come fromelectricity and transportationelectricity and transportation
Pie Chart#2
Autos Freight TrucksAircraft
Marine
Electricity
All Other Energy
Pipelines, Others
Transportation (23%) and electricity (44%) willaccount for 2/3 of all US energy-related carbon
emissions
EIA 2020 projection, adjusted forfull PNGV passenger vehicle
implementation

33
Complete integration of non-fossil electricityComplete integration of non-fossil electricity with transportation will require with transportation will require
HH22 use beyond automobiles use beyond automobiles
Carbonless Electric Grid Transportation
Electrolysis Hydrogen Storage
H2
(L)H2e-e-
e-
H2O

34
LLNL has constructed an equilibrium network modelLLNL has constructed an equilibrium network modelintegrating hourly demand patterns with generation ofintegrating hourly demand patterns with generation of
hydrogen transportation fuel and electricityhydrogen transportation fuel and electricity
• This system has_ 120,000 inequality
constraints_ 25,000 equality
constraints• Nine capacities must be
determined• Each hour allocations
must be made for_ Five generators_ Two electrolyzers_ Withdrawals from
long and short-termstorage
_ Purchases of H2 bythe storage devices
Natural gas
Electric demand Cars and trucks demand
Long term storage (liquid H2)
Short term storage (compressed H2)
Elect- rolyzer 1
Fuel cell
PhotovoltaicWind
Fossil generator
Electrolyzer 2
Aircraft demand
CompressorLiquefier
Fly- wheel
Nuclear
H2 flowsElectricity flows
Distribution (market) nodes

35
CarbonlessCarbonless electricity and H electricity and H22 transportation markets transportation marketsmodeled using modeled using simultaneoussimultaneous equilibrium optimization equilibrium optimization
Hourly Electricity and Transportation Demands
Hourly Variations in Electrolytic Hydrogen Production
Electricity for both Grid use and Hydrogen Production
Hourly Electric Generation from a mix of Technologies
Fuel Cell Vehicle Refueling Patterns
Short and Long Term Hydrogen Storage
Solar, Wind, Hydro Resource Patterns and Availability

36
Hypothesis: Hypothesis: CouplingCoupling carbonless carbonless electricity sources electricity sourceswith hydrogen fuel productionwith hydrogen fuel productioncan reduce the cost of deep carbon reductionscan reduce the cost of deep carbon reductions
Electricity Supply Variations Large carbon reductions in the electric sector will require significant amounts of intermittent electricity sources (solar and wind)
Hydrogen Fuel: Flexible Load and Energy StorageElectrolytic hydrogen production would be a very large and flexible loadUtility hydrogen storage could also serve as transportation fuel storage
Shared Functions Reduce Overall CostHydrogen and electric infrastructure would serve both electricity and transportation sectorsDecentralized production of electricity and hydrogen can ease transmission and distribution requirements
Carbonless Electricity and Transportation Would Eliminate 2/3 of US CO2 Emissions

37
Power
Nov Feb May NovAugust
Typical electric demand variations exhibitTypical electric demand variations exhibitclear hourly, daily, weekly, and seasonal patternsclear hourly, daily, weekly, and seasonal patterns

38
Power
Nov Feb May NovAugust
Wind energy supply patterns show great variabilityWind energy supply patterns show great variabilityover daily, weekly and seasonal periodsover daily, weekly and seasonal periods

39
Typical solar supply patterns show markedTypical solar supply patterns show markedseasonal variability, but predictable daily patternsseasonal variability, but predictable daily patterns
Power
Nov Feb May NovAugust

40
ModellingModelling Electricity Production Patterns: Electricity Production Patterns:BaseloadBaseload Nuclear Balanced by Fossil Generation Nuclear Balanced by Fossil Generation
emissions and total system
0.0
0.1
0.2
0.3
0.4
0.5
0.6
0.7
0.8
0.9
1.0
1 25 49 73 97 121 145 169 193 217
Hours from st art ofsegment
PowerGenerati on
(T W)
0.0
0.1
0.2
0.3
0.4
0.5
0.6
0.7
0.8
0.9
1.0
Load(T W)
Nuclear Fossil PV Wind Fuel Cell Elect ric Load S2h:1/0;0;0/f0.9n0. 1w0st20

41
ModellingModelling electricity production patterns: electricity production patterns:BaseloadBaseload nuclear, wind/fossil hybrid nuclear, wind/fossil hybrid
0.0
0.1
0.2
0.3
0.4
0.5
0.6
0.7
0.8
0.9
1.0
1 25 49 73 97 121 145 169 193 217Hours from start of segment
Power
Generation (TW)
0.0
0.1
0.2
0.3
0.4
0.5
0.6
0.7
0.8
0.9
1.0
Load (TW)
Nuclear PV Fossil Wind Fuel Cell Electric Load S2h:1:0;0;0/f0.5n0.1w1st10

42
ModellingModelling Electricity Production Patterns: Electricity Production Patterns:Wind/Fossil/SolarWind/Fossil/Solar
0.0
0.2
0.4
0.6
0.8
1.0
1.2
1.4
1.6
1.8
2.0
1 25 49 73 97 121 145 169 193 217
Hours from start of segment
Power
Generation (TW)
0.0
0.2
0.4
0.6
0.8
1.0
1.2
1.4
1.6
1.8
2.0
Load (TW)
Nuclear PV Fossil Wind Fuel Cell Electric Load S2h:1/0;0;0/f0.1n0.1w1st10

43
ModellingModelling Electricity Production Patterns: Electricity Production Patterns:Nuclear/Solar/Wind and H2 Fuel for carsNuclear/Solar/Wind and H2 Fuel for cars
0.00.20.4
0.60.81.01.21.4
1.61.82.0
1 25 49 73 97 121 145 169 193 217
Hours from start ofsegment
PowerGeneration
(TW)
0.00.20.4
0.60.81.01.21.4
1.61.82.0
Load(TW)
Nuclear PV Fossil Wind Fuel Cell Elect ric Load S2h:1:0;0;0/f0n0.1w1st10

44
Projected patterns (10 days) of electricity demandProjected patterns (10 days) of electricity demandsupplied by fossil & non-fossil sourcessupplied by fossil & non-fossil sources
(with H(with H2 2 fuel produced from excess electricity)fuel produced from excess electricity)
0.00.20.40.60.81.01.21.41.61.82.0
1 25 49 73 97 121 145 169 193 217
Hours from start of segment
PowerGeneration
(TW)
0.00.20.40.60.81.01.21.41.61.82.0
Load (TW)
Nuclear PV Fossil Wind Fuel Cell Electric Load S2h:1:0;0;0/f0n0.1w1st10
0.00.10.20.30.40.50.60.70.80.91.0
1 25 49 73 97 121 145 169 193 217
Hours from start of segment
PowerGeneration
(TW)
0.00.10.20.30.40.50.60.70.80.91.0
Load (TW)
Nuclear Fossil PV Wind Fuel Cell Electric Load S2h:1/0;0;0/f0.9n0.1w0st20
Natural Gas (CH4)&
Nuclear/Hydro
SolarWind
Nuclear/HydroH2 electrolysis
Night-time fuel cell

45
CarbonlessCarbonless electricity combined with H electricity combined with H22 transportation transportationcan replace CHcan replace CH44 but could need 1/3 more energy for but could need 1/3 more energy forLHLH22, electrolysis, and utility fuel cell operations, electrolysis, and utility fuel cell operations
Electrolysis LossesCompression Losses
Natural gas fueled transportation
Natural gas fueled electric generation Wind
Photovoltaic
Photovoltaic not used
Wind not used
-4000
-2000
0
2000
4000
6000
8000
10000
12000
14000
16000
0100200300400500600
Carbon Emissions (mmTC/yr)
Delivered Energy
(TWh/yr)
Fuel Cell LossesLiquefaction Losses
Nuclear Electricity
0.00.10.20.30.40.50.60.70.80.91.0
1 25 49 73 97 121 145 169 193 217
Hours from start of segment
PowerGeneration
(TW)
0.00.10.20.30.40.50.60.70.80.91.0
Load (TW)
Nuclear Fossil PV Wind Fuel Cell Electric Load S2h:1/0;0;0/f0.9n0.1w0st20
0.00.20.40.60.81.01.21.41.61.82.0
1 25 49 73 97 121 145 169 193 217
Hours from start of segment
PowerGeneration
(TW)
0.00.20.40.60.81.01.21.41.61.82.0
Load (TW)
Nuclear PV Fossil Wind Fuel Cell Electric Load S2h:1:0;0;0/f0n0.1w1st10
Efficiency of fossil to non-fossil transition

46
EfficiencyEfficiency will determine the economics of H will determine the economics of H22 because becausethe Hthe H22 infrastructure (e.g. fuel cells) will cost less infrastructure (e.g. fuel cells) will cost less
than the energy it carriesthan the energy it carries
0
100
200
300
400
500
600
700
0100200300400500600
Carbon Emissions (mmTC/yr)
Annual Fuel and
Electricity Cost
(B$)Solar Photovoltaic
Wind
Natural Gas Transportation Fuel
Gas Capacity
Nuclear
LH2 Storage
Compressed H2 Storage
Fuel Cell CapacityNatural Gas Generation
Compression Capacity
Peak Electrolyzer
Baseload Electrolyzer
H2 Related Opr Costs
H2 Liquefaction Capacity

47
Cost and emissions for a variety of carbon reductionCost and emissions for a variety of carbon reductionpaths: timing of H2 vehicle intro appears flexiblepaths: timing of H2 vehicle intro appears flexible
300
350
400
450
500
550
600
650
700
0 100 200 300 400 500 600 700
Carbon emissions (mmTonnes/yr)
System cost
(B$/yr)
900 GW gas 500 GW gas350 GW gas 250 GW gas100 GW gas 0 GW gasSlope of $500/tonne C emissions reduction
c
c
c
c c
t
t
t
t
a
a
The transportation served by H2 is indicated as: None: normal symbol, no letter 50% cars: half sized symbol, no letter 100% cars: letter "c" 100% cars and trucks: letter "t" 100% cars, trucks, aircraft: letter "a"

48
Capital Cost Fuel/Power Cost EfficiencyGas Combined Cycle $600/kW 1.9 c/kwh 56%Nuclear $2000/kW small -Hydroelectric $2000/kW small -Wind $655/kW small -Solar Thermal (12hr) $2500/kW small -Photovoltaic $1100/kW small -
Electrolysis(Steam) $500/kW small 92%Utility fuel cells $200/kW small 50%CH2 storage $6/kWh H2 $100/kW 91%LH2 storage $.30/kWh LH2 $500/kW 75%
~80 mpg hydrogen passenger vehicles ($500 extra) with 400-mile rangeEIA efficiencies for trucks. LH2 aircraft were EIA x 1.1
Aggressive efficiency and economic assumptionsAggressive efficiency and economic assumptionswere used (both for fossil and non-fossil)were used (both for fossil and non-fossil)
Electricity Sources
Hydrogen Infrastructure
Note: 4% Real Discount Rate, 20 -30 yr life for capital equipment. Conventional electricity costs drawn from EPRI, GRI, EIAI. Hydrogenand renewable electricity costs from DOE rnewable energy characterizations(1998)..
Hydrogen Vehicles

49
Technological prerequisites for widespreadTechnological prerequisites for widespreadimplementation of Himplementation of H22 as an energy carrier as an energy carrier
• Energy efficient design, integration, and operationof H2 and electricity infrastructure
(“just in time” liquefaction, flexibly fueled hydrogen onboard storage)
• 25-40 km/L or 60-100 mpg H2 (fuel-cell) light-duty vehicles
• Efficient (80-90%) electrochemistry for both forward &reverse reactions (H2 fuel cells and H2O electrolysis)
• Non-fossil electricity @ $0.05-0.07/kWh

50
Potential improvements to be examinedPotential improvements to be examined
• Electrolysis and fuel cells close-coupled for heat and O2integration where needed.
• “Peak” and “Baseload” electrolyzers and Fuel Cells
• Potential synergies with hydrogen for chemical industry (NH3)
• Biomass and Natural gas for seasonal leveling, with minimalcarbon sequestration burden

51
Capacity (TW) Capacity Factor Trillion kWh/yrNuclear 0.1 0.9 0.8Hydroelectric 0.1 0.9 0.8Wind 1.0 .44 4.4Photovoltaic 3 .3 7.0
13 total
Miles/year kg H2/yr400 million autos (100 mpg) 15k 60 billion 2.0 (3.2)2 million trucks (15 mpg) 150k 20 billion 0.66 (1.1)400 million flights (60 seat mpg) 6k 40 billion (LH2) 1.33 (2.7)
120 billion 4 (7) total
400 million people @ 15000 kWh/yr per person 6
6 trillion kWh of displaced coal generation (66% efficient) is 1 GtCor 6 trillion kWh of displaced natural gas generation (66% Efficient) is 0.5 GtC7 trillion kWh of electricity creates 4 trillion kWh of H2 offsetting only 0.25 GtC of oil
Electricity Sources
H2 Transportation
Direct Electricity use
CO2 Displaced
1.5 TW (13 Trillion kWh/1.5 TW (13 Trillion kWh/yryr) U.S. ) U.S. circacirca 2050 2050CarbonlessCarbonless Electricity and Transportation Scenario Electricity and Transportation Scenario
shows shows decarbonize decarbonize the grid firstthe grid first

52
H2 pipelines (large) were cheaperthan power lines
Electric growth was thought to be8x by 2000 (2x actual)
H2 mostly for stationary usesAutomotive viewed as possible
not mentioned -energy security
greenhouse gasesphotovoltaics
windcompressed H2 on cars
Electricity was $0.02/kWhGas was $0.50/GJ
Only 30 years of economic/technological change haveOnly 30 years of economic/technological change havealtered the Haltered the H22 “economy” concept dramatically “economy” concept dramatically
How robust are our conceptions for the next 100 years?How robust are our conceptions for the next 100 years?

53
The HThe H22 transition will take 30-50 years, transition will take 30-50 years, but is the essential element pivotal to but is the essential element pivotal to
universaluniversal and and enduringenduring solution of global challenges solution of global challenges
• Clean Air, Water, Transportation
• Energy and Economic Security
• Stabilizing Greenhouse Gases
• Sustainable Development