powerpoint presentation · present situation of geological survey and exploration ongoing geology...
TRANSCRIPT

TIANJIN
2017.09.23
CHAIRMAN Dr. BAATARTSOGT Baldorj

CONTENT:
1. PRESENT SITUATION OF GEOLOGICAL SURVEY AND EXPLORATION
2. ISSUENCE OF NEW LICENSES
3. INVESTMENT ENVIRONMENT AND OPPORTUNITIES

PRESENT SITUATION OF GEOLOGICAL SURVEY AND EXPLORATION
MONGOLIA-CHINA EXPO 2017
99%
33.25%
84%
38%
1:200 000 scalegeological map
1:50 000 scalegeological map
Hydro geologysurvey
Complex geophysicssurvey
系列1 99% 33.25% 84% 38%

PRESENT SITUATION OF GEOLOGICAL SURVEY AND EXPLORATION
ONGOING GEOLOGY PROJECTS FUNDED BY GOVERNMENT BUDGET
MONGOLIA-CHINA EXPO 2017

PRESENT SITUATION OF GEOLOGICAL SURVEY AND EXPLORATION
FINANCING OF THE GEOLOGICAL EXPLORATION SURVEYS CONDUCTED WITH STATE BUDGET
MONGOLIA-CHINA EXPO 2017

DISTRIBUTION MAP OF MINERAL OCCURANCES
PRESENT SITUATION OF GEOLOGICAL SURVEY AND EXPLORATION
MONGOLIA-CHINA EXPO 2017

MONGOLIA-CHINA EXPO 2017
Drilling, 46.8%
Geophysical activities, 10.1%
Laboratory, 6.3%
On site processing, 10.4%
Other, 26.4%
TYPES OF EXPLORATION WORK COST BY LICENSE HOLDERS IN PERCENTAGE
PRESENT SITUATION OF GEOLOGICAL SURVEY AND EXPLORATION

MONGOLIA-CHINA EXPO 2017
Product Unit 2011 2012 2013 2014 2015 2016 2017.VI
Gold tons 4.4 4.3 7.2 7.5 12.6 15.4 6.66
Copper concentrate th.tons 516.1 1252.1 1334.2 1365.4 1346.2 1399.7 723.6
Coal m.tons 24.5 24.1 35.1 26.0
Molybdenum
concentrate th.tons 3.15 3.93 3.67 4.05 5.53 5.05 2.96
Zinc concentrate th.tons 105.8 118.0 103.5 93.1 89.6 117.4 56.5
Iron ore th.tons 4663.3 6382.1 6793.3 7557.8 6061.2 5083.0 2464
Acidspar th.tons 50.8 98.8 57.2 61.0 51.6 80.0
Metspar th.tons 200.2 278.1 82.0 117.6 55.8 100.0 67.32
Tungsten concentrate th.tons 0.20 0.13 0.53 1.08 0.68 1.42 0.143
Tin concentrate tons 54.8 98.6 16.5 99.8 82.3 50.2 NA
MINING PRODUCTION
PRESENT SITUATION OF GEOLOGICAL SURVEY AND EXPLORATION

OIL EXPLORATION AND POTENTIAL RESERVES

PRODUCTION AND EXPORT OF CRUDE OIL
0
50
100
150
200
250
300
-
1.00
2.00
3.00
4.00
5.00
6.00
7.00
8.00
9.00
10.00
Tri
llio
n M
NT
Mil
lion
barr
els
Production Export Revenue
Production and Export data covering from 1996 to 2017.09.13
Production: 49.6 million barrels
Export: 46.9 million barrels
Revenue: ₮1.21 trillion (Mongolian National currency, MNT )

92.3% 89.5% 90.7% 89.2%
87.3%
67.1% 68.2% 68.7% 67.2% 71.1%
16.4% 14.9% 16.5% 16.7% 17.2%
2012 2013 2014 2015 2016
Contribution of mining in Total export product Contribution of mining in Industrial product Contribution of mining in GDP
MINING SECTOR CONTRIBUTION INTO NATIONAL GDP, INDUSTRIAL PRODUCTION, EXPORT INCOME
PRESENT SITUATION OF GEOLOGICAL SURVEY AND EXPLORATION
MONGOLIA-CHINA EXPO 2017

18.2 19.5
14.5
25.8
33.3
24.4 24.1
35.1
-
5.0
10.0
15.0
20.0
25.0
30.0
35.0
40.0
2013 2014 2015 2016
Coal export Mt Coal extraction Mt
COAL PRODUCTION AND EXPORT
518 520 517 546 657
734 814
905
-
200
400
600
800
1,000
1,200
1,400
1,600
1,800
2012 2013 2014 2015 2016
Copper-gold concentrate - Oyu Tolgoi 000tn
Copper concentrate - Erdenet 000tn
COPPER PRODUCTION
PRESENT SITUATION OF GEOLOGICAL SURVEY AND EXPLORATION
MONGOLIA-CHINA EXPO 2017

PRESENT SITUATION OF GEOLOGICAL SURVEY AND EXPLORATION
MONGOLIA-CHINA EXPO 2017
1598 Active mining licenses 1849 Active exploration licenses

MONGOLIA-CHINA EXPO 2017

Gold 34.5%
Coal 18.7%
fluorspar 10.7%
Iron 4.7%
Tungsten 2.1% Construction
material 19.8% Other
9.4%
MINING LICENSE STRUCTURE, BY MINERAL TYPE
MONGOLIA-CHINA EXPO 2017

PETROLEUM EXPLORATION BLOCKS
MONGOLIA-CHINA EXPO 2017

HYDROCARBON PROSPECTING BLOCKS
MONGOLIA-CHINA EXPO 2017

MONGOLIA-CHINA EXPO 2017
PETROLEUM EXPLORATION BLOCKS

MONGOLIA-CHINA EXPO 2017
PETROLEUM EXPLORATION BLOCKS

PRESENT SITUATION OF GEOLOGICAL SURVEY AND EXPLORATION
CURRENT ISSUENCE OF MINING AND EXPLORATION LICENSES
MINING EXPLORATION ALL
1091 1085 1,158 1,198 1,237 1,301 1,391 1396 1,558 1598
4111
3659
2,979 2,572
2,303
1,717
1,345 1295
2,022 1849
5202 4744
4,137
3770 3,540
3,018 2,736 2691
3,580 3447
0
1000
2000
3000
4000
5000
6000
2008 2009 2010 2011 2012 2013 2014 2015 2016 2017.VII
Mining Exploration Total
MONGOLIA-CHINA EXPO 2017

PRESENT SITUATION OF GEOLOGICAL SURVEY AND EXPLORATION
COVERAGE OF CURRENTLY ISSUED LICENSES (by percent)
0.3 0.3 0.3 0.4 0.6 0.6 0.7 0.7 0.9 1
31.3
24.9
16.3
14.2 12.3
8.8 6.4
8 7.7 6.4
0.0
10.0
20.0
30.0
40.0
2008 2009 2010 2011 2012 2013 2014 2015 2016 2017.VII
Mining Exploration
MONGOLIA-CHINA EXPO 2017

PRESENT SITUATION OF GEOLOGICAL SURVEY AND EXPLORATION
LICENSE HOLDERS
JOINT LOCAL FOREIGN
MONGOLIA-CHINA EXPO 2017

WHO IS RESPONSIBLE FOR EXPLORATION LICENSING
MINERAL RESOURCES AND PETROLEUM AUTHORITY
PROVINCE GOVERNOR (21 province)
LICENSE: Common minerals (gold, silver, copper, iron, tin,
zinc etc, and petroleum)
LICENSE: Conventional minerals
( minerals for construction materials)
ISSUENCE OF NEW LICENSES
MONGOLIA-CHINA EXPO 2017

STEPS TO ISSUE NEW EXPLORATION LICENSE USING ONLINE APPLICATION
STEPS TO ISSUE NEW EXPLORATION LICENSE USING COMPETITIVE BID
MONGOLIA-CHINA EXPO 2017
ISSUENCE OF NEW LICENSES

Government Decree 2014.07.28. #239, 2015.12.21. #511, 2017.01.25. #37 Available area for competitive bid: 10.2 million hectares 6.5% of country area
Areas of Government Decree #239, #511 Areas of Government Decree #37
AVAILABLE AREAS FOR COMPETITIVE BID
ISSUENCE OF NEW LICENSES
MONGOLIA-CHINA EXPO 2017

Government Decree 2014.07.28. #239, 2015.12.21. #511 Available area for application: 36.2 million hectares 23.1% of country area Total available area for license: 29.7% of country area
AVAILABLE AREAS FOR APPLICATION
Areas of Government Decree #511 Areas of Government Decree #239 New areas of application
ISSUENCE OF NEW LICENSES
MONGOLIA-CHINA EXPO 2017

INVESTMENT ENVIRONMENT AND OPPORTUNITIES
MONGOLIA-CHINA EXPO 2017
Asian
countries
Score Rank
2016 2015 2014 2013 2012 2016 2015 2014 2013 2012
China 65.13 58.49 48.89 58.69 54.50 54/104 64/109 94/122 62/112 63/96
Kazakhstan 54.08 74.66 50.84 63.45 62.50 73/104 20/109 88/122 53/112 42/96
Mongolia 49.42 50.03 49.22 53.25 67.04 81/104 85/109 93/122 80/112 31/96
Myanmar 44.47 48.92 61.70 53.32 ** 91/104 87/109 60/122 79/112 *
India 39.11 55.47 58.26 52.13 58.69 97/104 73/109 68/122 84/112 53/96
Afghanistan 33.11 ** ** ** ** 100/104 ** ** ** **
67.18 67.04
53.25 49.22
50.03
49.42
45.21 41.60 44.02
28.55 36.85
28.08
81.83 84.29
59.46 62.50 58.82
63.64
-
20
40
60
80
100
2011 2012 2013 2014 2015 2016Investment attractiveness indexPolicy Perception Index, (40%)
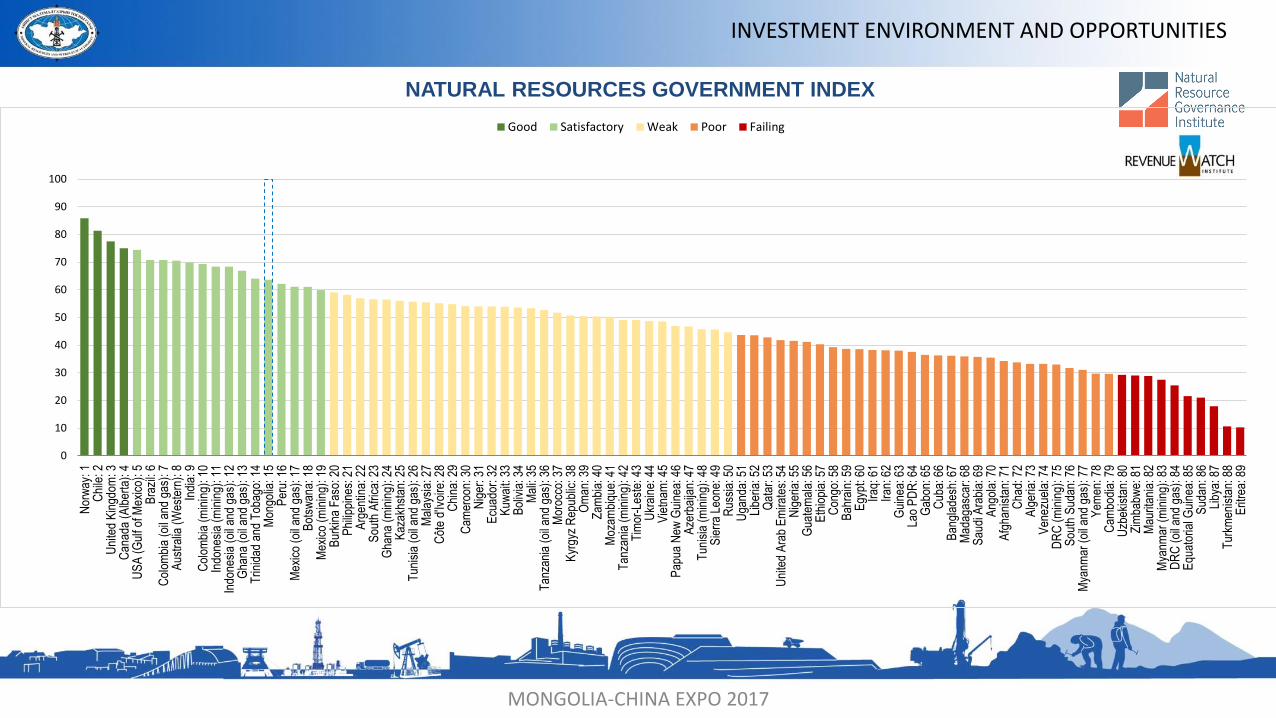
NATURAL RESOURCES GOVERNMENT INDEX
INVESTMENT ENVIRONMENT AND OPPORTUNITIES
MONGOLIA-CHINA EXPO 2017
0
10
20
30
40
50
60
70
80
90
100
Nor
way
: 1C
hile
: 2U
nite
d K
ingd
om: 3
Can
ada
(Alb
erta
): 4
US
A (
Gul
f of M
exic
o): 5
Bra
zil:
6C
olom
bia
(oil
and
gas)
: 7A
ustr
alia
(W
este
rn):
8In
dia:
9C
olom
bia
(min
ing)
: 10
Indo
nesi
a (m
inin
g): 1
1In
done
sia
(oil
and
gas)
: 12
Gha
na (
oil a
nd g
as):
13
Trin
idad
and
Tob
ago:
14
Mon
golia
: 15
Per
u: 1
6M
exic
o (o
il an
d ga
s): 1
7B
otsw
ana:
18
Mex
ico
(min
ing)
: 19
Bur
kina
Fas
o: 2
0P
hilip
pine
s: 2
1A
rgen
tina:
22
Sou
th A
fric
a: 2
3G
hana
(m
inin
g): 2
4K
azak
hsta
n: 2
5T
unis
ia (
oil a
nd g
as):
26
Mal
aysi
a: 2
7C
ôte
d'Iv
oire
: 28
Chi
na: 2
9C
amer
oon:
30
Nig
er: 3
1E
cuad
or: 3
2K
uwai
t: 33
Bol
ivia
: 34
Mal
i: 35
Tan
zani
a (o
il an
d ga
s): 3
6M
oroc
co: 3
7K
yrgy
z R
epub
lic: 3
8O
man
: 39
Zam
bia:
40
Moz
ambi
que:
41
Tan
zani
a (m
inin
g): 4
2T
imor
-Les
te: 4
3U
krai
ne: 4
4V
ietn
am: 4
5P
apua
New
Gui
nea:
46
Aze
rbai
jan:
47
Tun
isia
(m
inin
g): 4
8S
ierr
a Le
one:
49
Rus
sia:
50
Uga
nda:
51
Libe
ria: 5
2Q
atar
: 53
Uni
ted
Ara
b E
mira
tes:
54
Nig
eria
: 55
Gua
tem
ala:
56
Eth
iopi
a: 5
7C
ongo
: 58
Bah
rain
: 59
Egy
pt: 6
0Ir
aq: 6
1Ir
an: 6
2G
uine
a: 6
3La
o P
DR
: 64
Gab
on: 6
5C
uba:
66
Ban
glad
esh:
67
Mad
agas
car:
68
Sau
di A
rabi
a: 6
9A
ngol
a: 7
0A
fgha
nist
an: 7
1C
had:
72
Alg
eria
: 73
Ven
ezue
la: 7
4D
RC
(m
inin
g): 7
5S
outh
Sud
an: 7
6M
yanm
ar (
oil a
nd g
as):
77
Yem
en: 7
8C
ambo
dia:
79
Uzb
ekis
tan:
80
Zim
babw
e: 8
1M
aurit
ania
: 82
Mya
nmar
(m
inin
g): 8
3D
RC
(oi
l and
gas
): 8
4E
quat
oria
l Gui
nea:
85
Sud
an: 8
6Li
bya:
87
Tur
kmen
ista
n: 8
8E
ritre
a: 8
9
Good Satisfactory Weak Poor Failing

To establish Geo-information database in electronic and physical form, to regularly update and enhance this database, process data with the IT system and software aligned with the latest international benchmark, deliver accurate and up-to-date data to customers in timely manner, collaborate with national and international organizations in area Geo-information database
INVESTMENT ENVIRONMENT AND OPPORTUNITIES
MONGOLIA-CHINA EXPO 2017

Reports held in MRITC
Received and archived final
reports Annual reports and plans
Registration type No. of records Registration type No. of records
Privately funded 2341 Exploration 33286
Others (e.g. state funded, FS) 5803 Mining 3026
Total 8144 Total 36312
Inclusions No. of records
Primary materials 4400
Rock samples 92
Classification No. of records
Geological mapping 659
Geological exploration 3275
Geochemical 24
Geophysical 185
Feasibility study (FS) 1004
Language No. of records
Mongolian 4138
Russian 3751
Others 255
MRPAM’s Geological Archive
Inventory
INVESTMENT ENVIRONMENT AND OPPORTUNITIES
MONGOLIA-CHINA EXPO 2017

Geo-Information Database:
Map
dat
aset
• Specialized ~8300
• Satellite ~8200
• Geophysics~600
Dat
a (r
eco
rds)
• Mineral deposit ~1200
• Mineral occurrence ~8400
• Geochemical ~310000
• Stratigraphy ~1100
• Intrusive ~3900
• Paleontology ~4100
Oth
ers • Scanned reports,
media files and publications ~11000
INVESTMENT ENVIRONMENT AND OPPORTUNITIES
MONGOLIA-CHINA EXPO 2017

WebGIS Metadata Catalog
MONGOLIA-CHINA EXPO 2017
What is MonGeoCat?
INVESTMENT ENVIRONMENT AND OPPORTUNITIES

MONGOLIA-CHINA EXPO 2017

Ulaanbaatar, Chingeltei district,
Builder’s square-3, 12th Government house Email: [email protected]
Phone: 976-51-263952
MONGOLIA-CHINA EXPO 2017