powerpoint lecture notes presentation chapter 4 research methods in the study of psychopathology...
TRANSCRIPT

PowerPoint Lecture Notes Presentation Chapter 4
Research Methods in the Study of Psychopathology
Abnormal Psychology, Eleventh Editionby
Ann M. Kring, Gerald C. Davison, John M. Neale, & Sheri L. Johnson

Copyright 2009 by John Wiley & Sons, NY 2
Science and Scientific Methods
Science» The systematic pursuit of knowledge through
observation» Scientists gather data to test theories
Theory» Set of propositions developed to explain what is
observed– A good theory is falsifiable
Allows for disconfirmation
Hypotheses» Specific predictions about what will occur if a
theory is correct.

Copyright 2009 by John Wiley & Sons, NY 3
Table 4.1 Research Methods in Psychopathology

Copyright 2009 by John Wiley & Sons, NY 4
Case Study
Detailed biographical description of an individual» Family history » Medical status» Educational background» Information about peer
and romantic relationships
» Personality and adjustment issues
» Current difficulties and prior experiences in therapy.
Usefulness » Rich description,
especially helpful for rare disorders
» Disprove hypothesis» Generate hypotheses
Limitations» Paradigm may influence
observations» Cannot rule out
alternative explanations

Copyright 2009 by John Wiley & Sons, NY 5
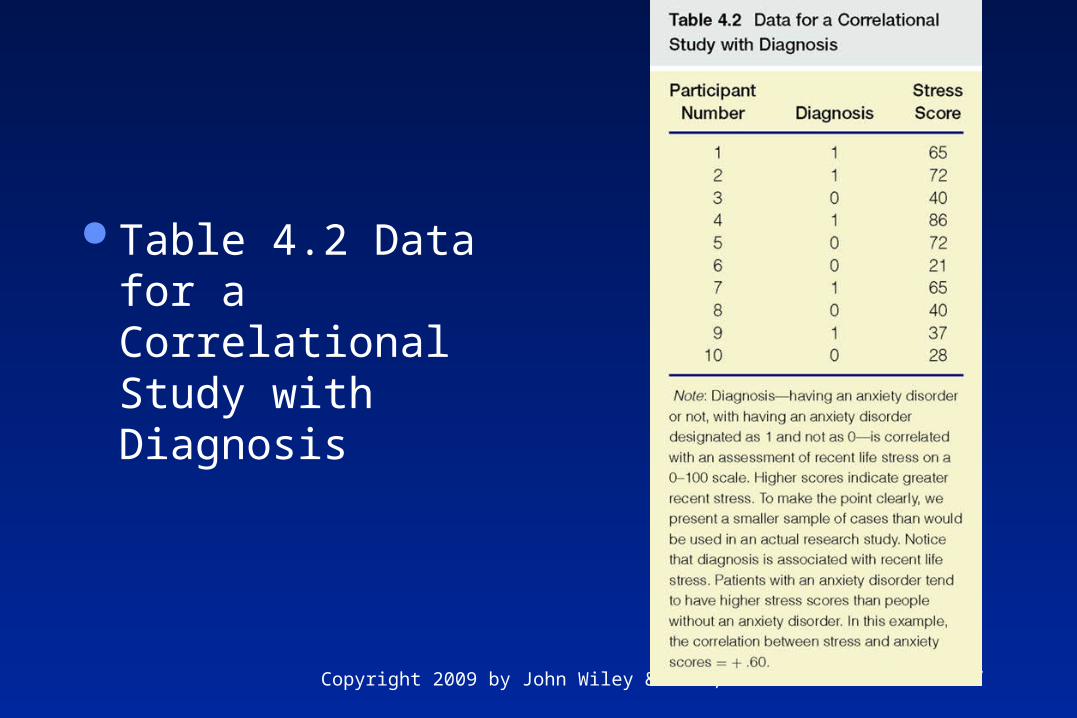
Correlational Method
Do variable X and variable Y vary together? » Are they related in a systematic way?
– Do people who experience more stress have more headaches?
Variables measured but not manipulated Cannot determine cause or effect

Copyright 2009 by John Wiley & Sons, NY 6
Figure 4.2 Correlational vs. Experimental Studies
Copyright 2009 by John Wiley & Sons, NY 7
Table 4.2 Data for a Correlational Study with Diagnosis

Copyright 2009 by John Wiley & Sons, NY 8
Table 4.3 Data for Determining a Correlation

Copyright 2009 by John Wiley & Sons, NY 9
Measuring Correlation
Correlation Coefficient» Varies from -1.0 to +1.0
– e.g., +.9, -.65, +.32, -.70
Strength» The higher the absolute value, the stronger the relationship
– (-.9 > +.6; +.9 > -.8)
Direction» Positive
– Higher scores on Var X associated with higher scores on Var Y
» Negative– Higher scores on Var X associated with lower scores on Var Y

Copyright 2009 by John Wiley & Sons, NY 10Fig 4.2
Figure 4.3 Scatter Diagrams

Copyright 2009 by John Wiley & Sons, NY 11
Statistical and Clinical Significance
Statistical significance» Probability ≤ .05» Can be influenced by number of participants
– Larger samples increase likelihood of significance
Clinical significance» Is the association meaningful as well as statistically
significant?

Copyright 2009 by John Wiley & Sons, NY 12
Problems of Causality
Correlation does not imply causality Directionality problem
» Var X may cause Var Y » Var Y may cause Var X
Third-variable problem» Var Z causes both Var X and Var Y

Copyright 2009 by John Wiley & Sons, NY 13
Longitudinal vs Cross-sectional designs
Longitudinal» Studies participants over time» Examines whether causes are present before
disorder develops » High Risk Method
– Include only those who are at greatest likelihood of developing a disorder
– Reduces the cost of longitudinal research
Cross-sectional» Causes and effects measured at the same time
Copyright 2009 by John Wiley & Sons, NY 14
Epidemiological Research
Epidemiology» Study of the distribution of disorders in a population and
possible correlates Three features of a disorder
» Prevalence» Incidence» Risk Factors
The National Comorbidity Survey–Replication» Large-scale national survey» Used structured interviews to collect information on the
prevalence of several diagnoses (Kessler et al., 2005).

Copyright 2009 by John Wiley & Sons, NY 15
Table 4.4 Lifetime Prevalence Rates of Selected
Disorders

Copyright 2009 by John Wiley & Sons, NY 16
Correlational Research: Behavioral Genetics
Index cases/Probands» Sample of individuals with
psychopathology Concordance
» Co-occurrence or similarity of diagnosis
Family studies» First degree relatives
(parents, children, siblings)– 50% shared genes
» Second degree relatives (aunts, uncles, grandparents)
– 25% shared genes
Twin studies» Monozygotic (MZ) twins
– 100% shared genes» Dizygotic (DZ) twins
– 50% shared genes» Equal environment assumption
Adoption studies» Study of adoptees who have
biological parents with psychopathology
Cross-fostering» Study of adoptees who have
adoptive parents with psychopathology

Correlational Research: Molecular Genetics
Linkage analysis method» Study individual with disorder and family
members who also have the disorder» Relies on the study of genetic markers.
– Genetic markers are diseases or characteristics with a known chromosomal location of the genes involved.
Association studies» Examine the relationship between a specific
allele and a trait or behavior in the population
Copyright 2009 by John Wiley & Sons, NY 17

Copyright 2009 by John Wiley & Sons, NY 18
The Experiment
Provides information about causal relationships
Involves:» Independent variable» Random assignment» Dependent variable
Can evaluate treatment effectiveness
Experimental Effect» Differences between groups
Figure 4.3 Pennebaker et al., 1988

Copyright 2009 by John Wiley & Sons, NY 19
Table 4.5 Results of a Hypothetical Study Comparing CBT to
No Treatment for Depression

Basic Features of Experimental Design
The investigator manipulates an independent variable
Participants are assigned to the conditions by random assignment.
Researcher measures a dependent variable that is expected to vary with conditions of the independent variable.
Experimental effect» Differences between conditions on the
dependent variable
Copyright 2009 by John Wiley & Sons, NY 20

Copyright 2009 by John Wiley & Sons, NY 21
The Experiment
Internal validity» Extent to which experimental effect is due to
independent variable Control Group
» Participants who do not receive treatment» Standard against which treatment effectiveness is
judged. Placebo
» Change or improvement due to participants’ expectations

Copyright 2009 by John Wiley & Sons, NY 22
The Experiment
External validity» Extent to which results generalize beyond
the study– Would results apply to others besides the study
participants?

Copyright 2009 by John Wiley & Sons, NY 23
Analogue Experiment
Experiments not always possible in psychopathology» Ethical or practical constraints
Examine related or similar behavior in the lab» Elicit stress or sadness» College students who tend to be anxious» Animal research
Copyright 2009 by John Wiley & Sons, NY 24
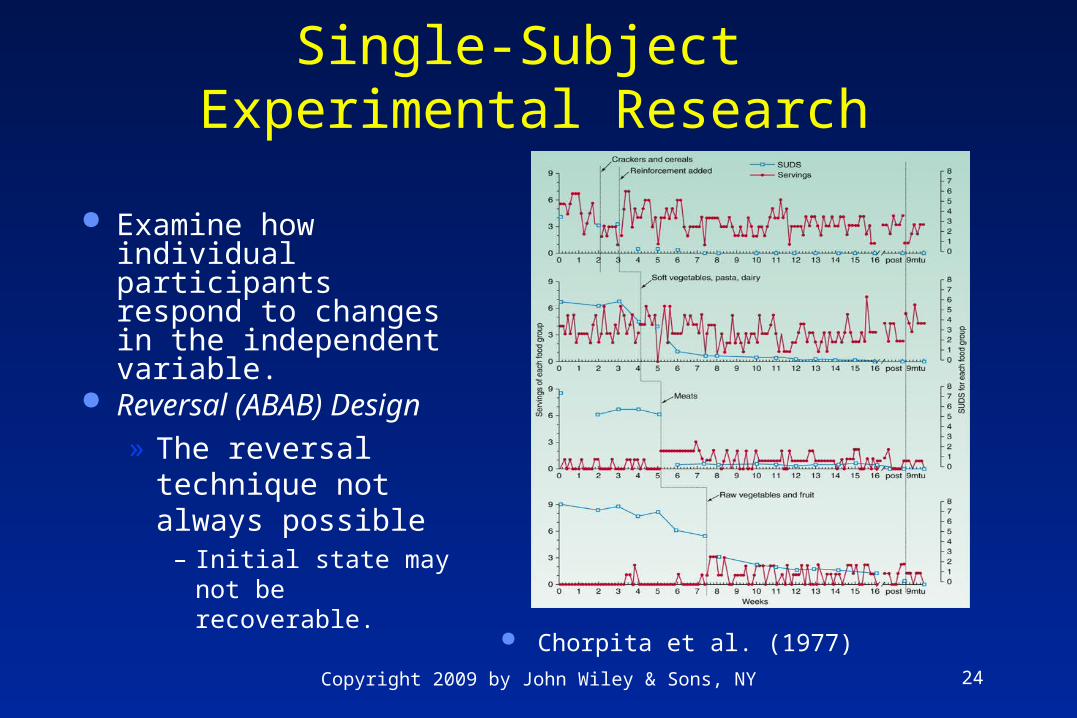
Single-Subject Experimental Research
Examine how individual participants respond to changes in the independent variable.
Reversal (ABAB) Design» The reversal
technique not always possible
– Initial state may not be recoverable.
Chorpita et al. (1977)

Copyright 2009 by John Wiley & Sons, NY 25
Integrating Findings from Multiple Studies
Meta-analysis» Identify relevant studies» Compute effect size
– Transforms results to a common scale
Smith et al. (1980)» Meta-analyzed 475
outcome studies» Results: Psychotherapy
is effective
Figure 4.5 Steps in Conducting a Meta-Analysis

Table 4.6 Meta-analysis: One-year prevalence rates for mental illness across
21 European studies
Copyright 2009 by John Wiley & Sons, NY 26

Copyright 2009 by John Wiley & Sons, NY 27
COPYRIGHT
Copyright 2009 by John Wiley & Sons, New York, NY. All rights reserved. No part of the material protected by this copyright may be reproduced or utilized in any form or by any means, electronic or mechanical, including photocopying, recording or by any information storage and retrieval system, without written permission of the copyright owner.