powerpoint presentationgenomics.unl.edu/rbc_2014/course_files/tue5.pdfanalyze by hpcl em: 420 ....
TRANSCRIPT


Sample 1
ICAT light
ICAT heavy
TCEP Red
Avidin Selec
Trypsin Dig
GIST light
Sample 2
ICAT light
ICAT heavy
TCEP Red
Avidin Selec
Trypsin Dig
GIST heavy Mix
LC-MS(/MS)
Output: four co-eluting peeks representing redox status and two samples Peak 1: Ox C in S1 Peak 2 (+3Da): Ox C in S2 Peak 3 (+9Da): Red C in S1 Peak 4 (+12Da) Red C in S2
Double Labeling in Global Thiol Redox Proteome


1 4
2
3
5
Carbonyl Content Using Cy3 and Cy5 - hydrazide Chemistry for
2D ELFO
Sample 1
Cy3 hyrdazide
Sample 2
Cy5 hydrazide
Mix
2D ELFO and analysis


Sample, extracted in phosphate buffer, then MeOH precipitated
+
+
+
TCEP (Heavy GSH)
Add diluted 2-VPd7, heavy label reduced GSH
Add excess light 2-VP, then TCEP, light label GSSG (reduced by TCEP) Can add isotopic labeled GSH at this step for absolute Quantification
Analysis of GSH/GSSG content
Method 6 - this method was currently developed at Adamec’s lab and utilizes light/heavy 4-VP for GSH derivatization. Tagged
Red/Ox GSH is quantified using HPLC (C18) coupled with FTICR.

GSH/GSSG content - Result
0 2 4 6 8 10 Time [min]0
1
2
3
4
5
7x10
Intens.
2_7-24_1-b,2_01_576.d: EIC 413.1±0.1 +All MS, Smoothed (0.88,1,GA) 2_7-24_1-b,2_01_576.d: EIC 416.1±0.1 +All MS, Smoothed (0.88,1,GA)
2_7-24_1-b,2_01_576.d: EIC 420.1±0.1 +All MS, Smoothed (0.88,1,GA)
0 2 4 6 8 10 Time [min]0
2
4
6
9x10
Intens.
14a.d: TIC +All MS
m/z 413.15 GSSG 416.15 Internal Standard GSH 420.15 GSH

Adenine Containing Molecules: Derivitize with
Chloroacetaldehyde
Production of etheno adducts
EX: 300 EM: 420 Analyze by HPCL

Standard Compounds
0.0 2.5 5.0 7.5 10.0 12.5 15.0 17.5 20.0 22.5 25.0 27.5 30.0 32.5 35.0 min0
25000
50000
75000
100000
125000
150000
175000
200000
225000
250000
275000
300000
325000
350000
375000
400000
425000
450000uV
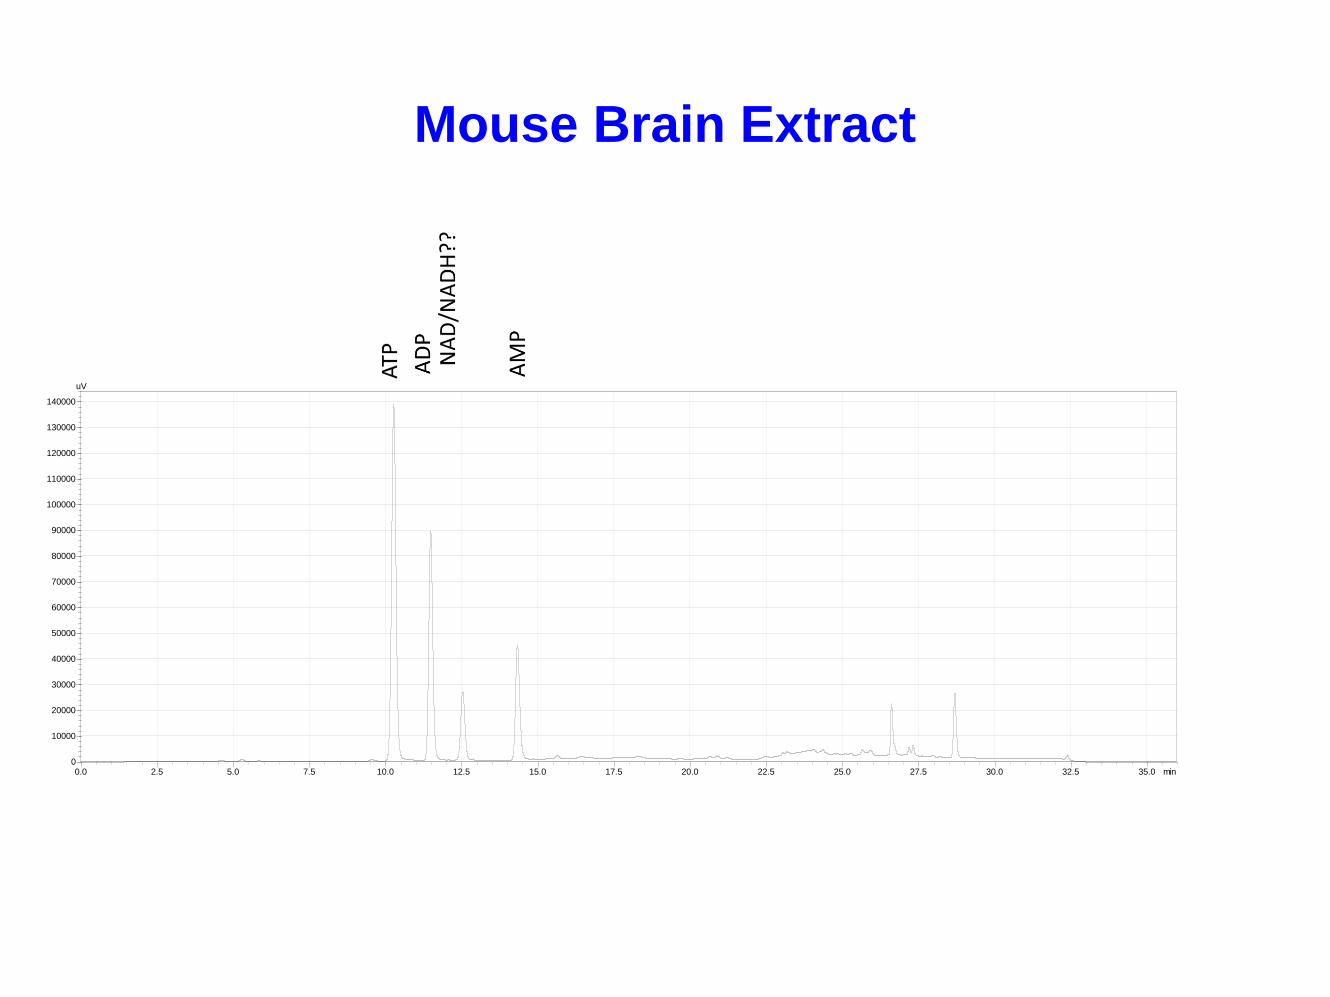
Mouse Brain Extract
0.0 2.5 5.0 7.5 10.0 12.5 15.0 17.5 20.0 22.5 25.0 27.5 30.0 32.5 35.0 min0
10000
20000
30000
40000
50000
60000
70000
80000
90000
100000
110000
120000
130000
140000
uV