powerpoint presentation · 2018-02-20 · interest paid on sub. debentures (58) (117) preference...
TRANSCRIPT


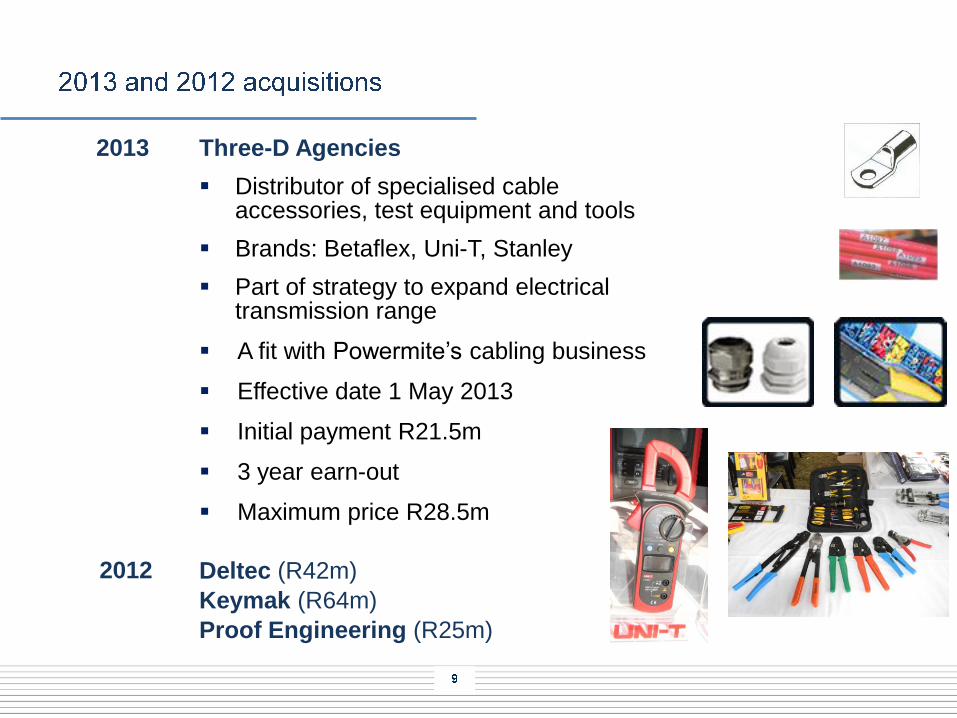
Three-D Agencies
Distributor of specialised cable accessories, test equipment and tools
Brands: Betaflex, Uni-T, Stanley
Part of strategy to expand electrical transmission range
A fit with Powermite’s cabling business
Effective date 1 May 2013
Initial payment R21.5m
3 year earn-out
Maximum price R28.5m
Deltec (R42m)
Keymak (R64m)
Proof Engineering (R25m)
2013
2012
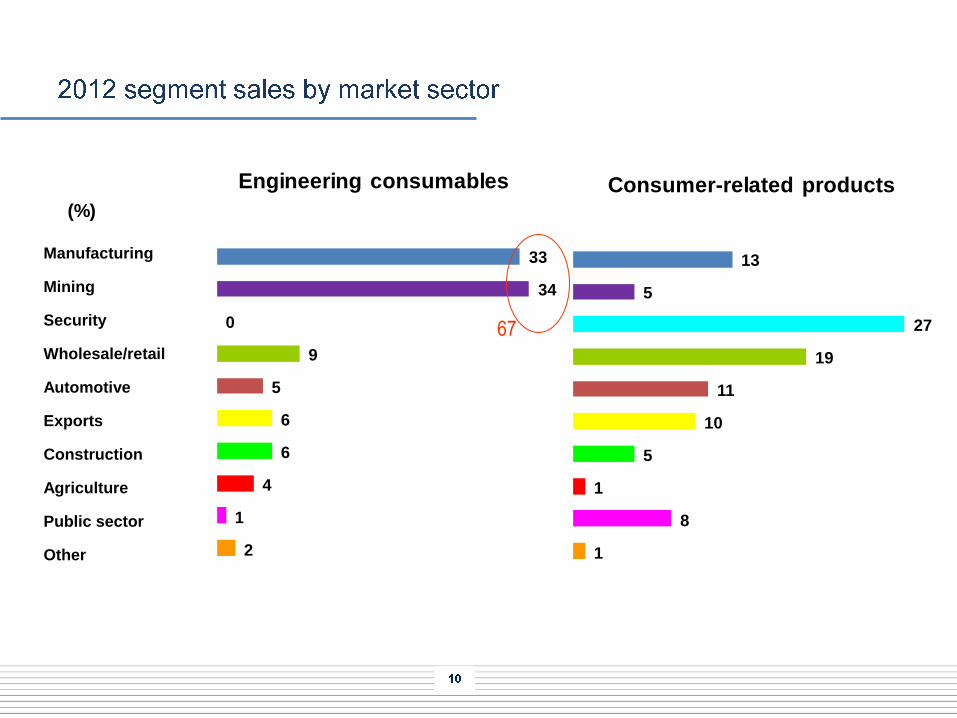
2
1
4
6
6
5
9
0
34
33
Engineering consumables
Manufacturing
Mining
Security
Wholesale/retail
Automotive
Exports
Construction
Agriculture
Public sector
Other 1
8
1
5
10
11
19
27
5
13
Consumer-related products(%)
67
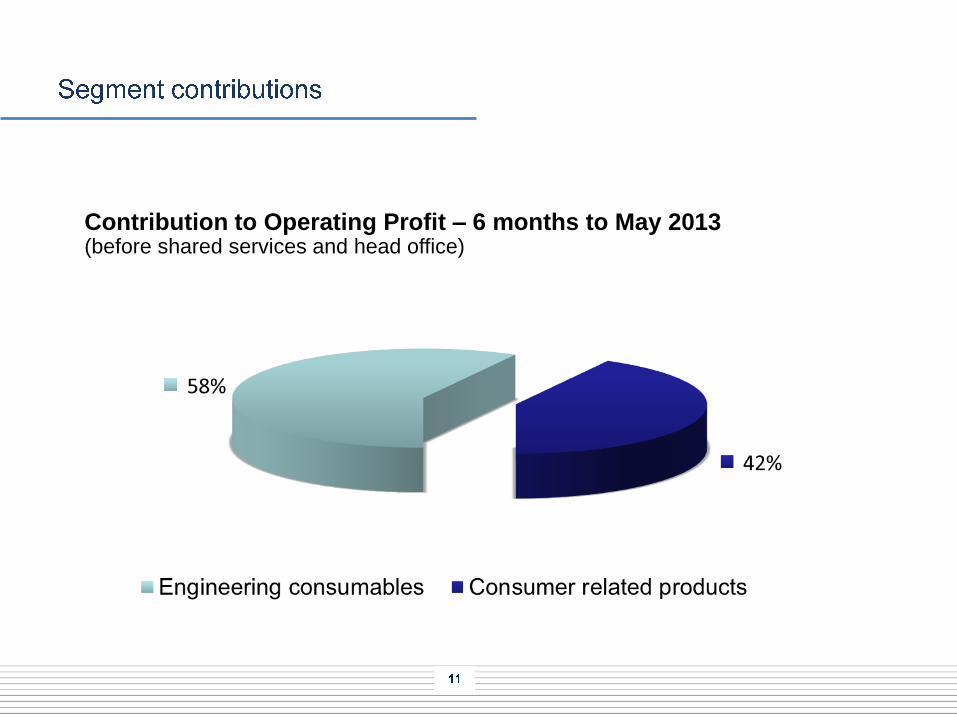
Contribution to Operating Profit – 6 months to May 2013 (before shared services and head office)
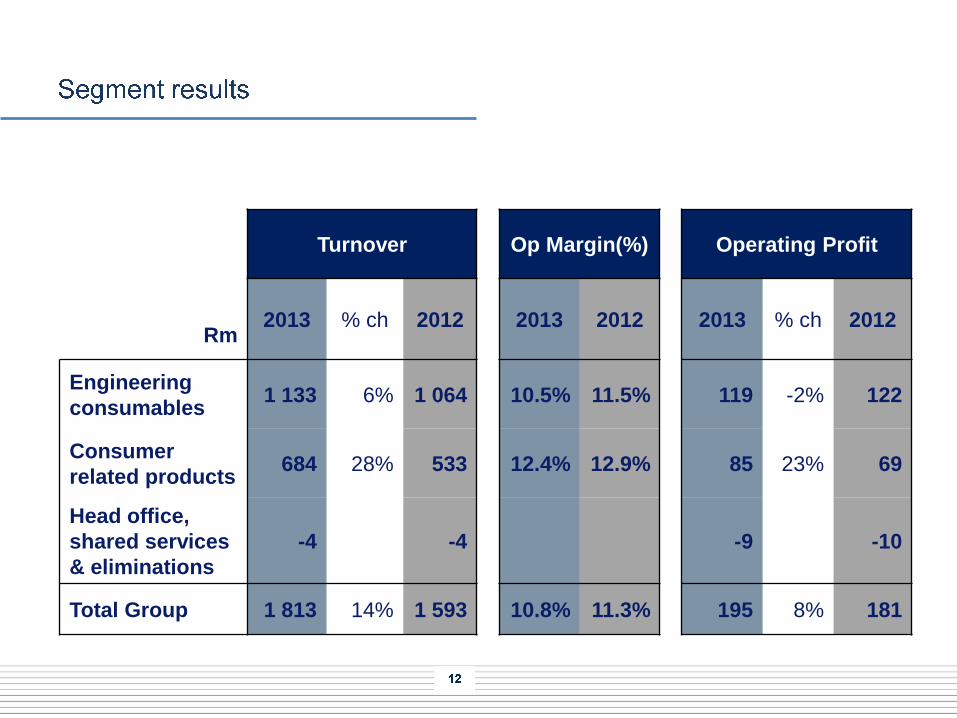
Turnover Op Margin(%) Operating Profit
Rm 2013 % ch 2012 2013 2012 2013 % ch 2012
Engineering
consumables 1 133 6% 1 064 10.5% 11.5% 119 -2% 122
Consumer
related products 684 28% 533 12.4% 12.9% 85 23% 69
Head office,
shared services
& eliminations
-4 -4 -9 -10
Total Group 1 813 14% 1 593 10.8% 11.3% 195 8% 181

Rm 2013 % Ch 2012
Turnover 1 813 14 1 593
- Ongoing businesses 1 664 5 1 586
- Acquisitions in 2012 and 2013 149 7
Gross profit 665 8 613
Operating expenses (470) 9 (432)
Operating profit 195 8 181
- Ongoing businesses 180 - 179
- Acquisitions in 2012 and 2013 15 2
Margin (%)
Turnover 100.0 100.0
Gross profit 36.7 38.5
Operating expenses 25.9 27.1
Operating profit 10.8 11.3

In response to the BEE imperative, Hudaco restructured in 2007
Tax law changes meant preference dividend would become fully
taxable but had a solution
Notice from SARS in Nov 2012 outlined a structure behind our BEE
transaction – complete surprise to Hudaco
In light of the new information we decided not to implement solution
Exercised right to ask Cadiz to gross up dividend
Cadiz redeemed preference shares instead
Morgan Stanley put the Hudaco Trading debenture to Hudaco
BEE structure financed internally since 28 February 2013
Net effect on profit after tax is R33m pa
BEE shareholders and credentials remain in place
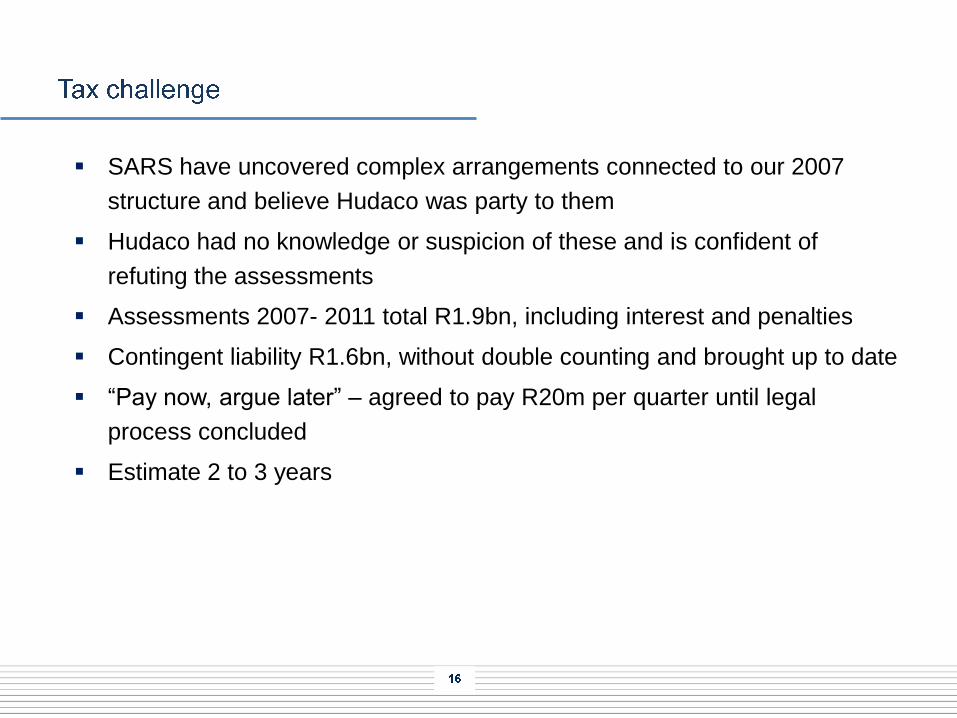
SARS have uncovered complex arrangements connected to our 2007
structure and believe Hudaco was party to them
Hudaco had no knowledge or suspicion of these and is confident of
refuting the assessments
Assessments 2007- 2011 total R1.9bn, including interest and penalties
Contingent liability R1.6bn, without double counting and brought up to date
“Pay now, argue later” – agreed to pay R20m per quarter until legal
process concluded
Estimate 2 to 3 years

Rm 2013 % Ch 2012
Operating profit 195 8% 181
Net interest on working capital (3) (2)
Interest paid to vendors (imputed) (3) (5)
Interest paid on sub. debentures (58) (117)
Preference dividend received 50 101
Profit before taxation 181 15% 158
Taxation (Rate 2013:21% 2012:10%) (38) (16)
Profit after taxation 143 - 142
Non-controlling interest (1) (2)
Attributable and headline earnings 142 - 140
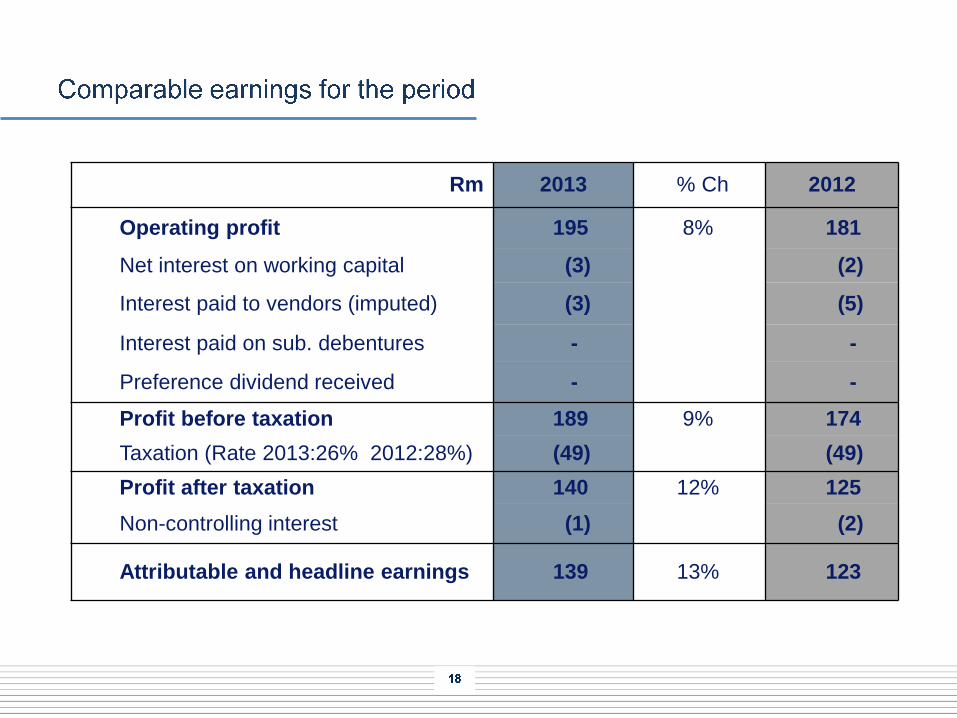
Rm 2013 % Ch 2012
Operating profit 195 8% 181
Net interest on working capital (3) (2)
Interest paid to vendors (imputed) (3) (5)
Interest paid on sub. debentures - -
Preference dividend received - -
Profit before taxation 189 9% 174
Taxation (Rate 2013:26% 2012:28%) (49) (49)
Profit after taxation 140 12% 125
Non-controlling interest (1) (2)
Attributable and headline earnings 139 13% 123

2013 % Ch 2012
Earnings per share
Basic EPS 448c 1.5% 441c
Headline earnings per share 448c 1.5% 441c
Comparable earnings per share 440c 13% 390c
Dividends per share
Interim 155c - 155c
Final 310c
Total 465c
Dividend policy: annual dividends = approximately 40% of heps
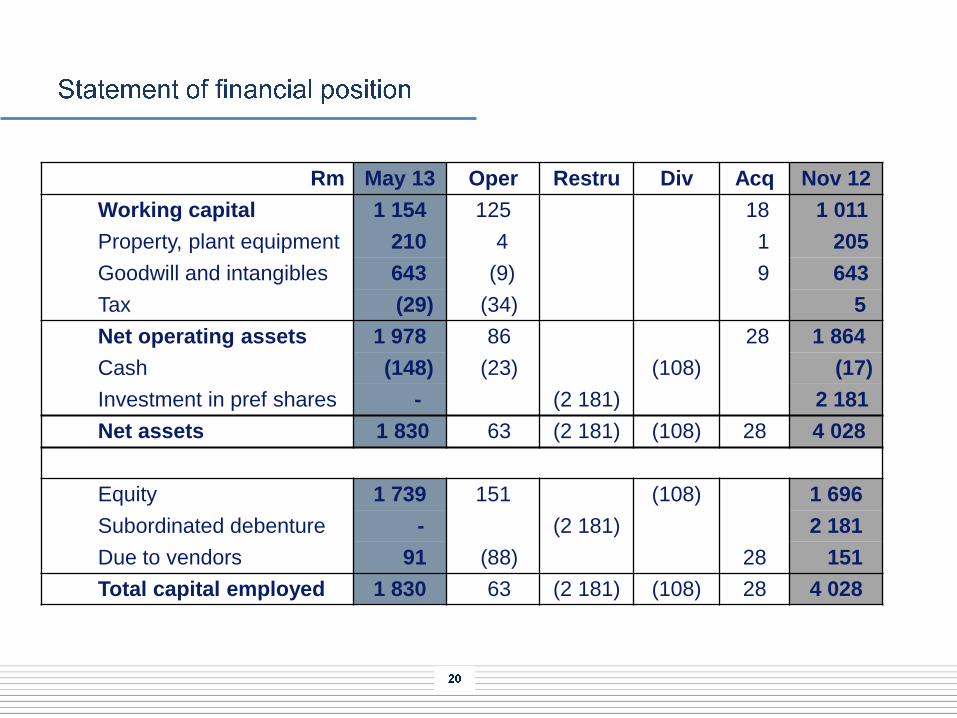
Rm May 13 Oper Restru Div Acq Nov 12
Working capital 1 154 125 18 1 011
Property, plant equipment 210 4 1 205
Goodwill and intangibles 643 (9) 9 643
Tax (29) (34) 5
Net operating assets 1 978 86 28 1 864
Cash (148) (23) (108) (17)
Investment in pref shares - (2 181) 2 181
Net assets 1 830 63 (2 181) (108) 28 4 028
Equity 1 739 151 (108) 1 696
Subordinated debenture - (2 181) 2 181
Due to vendors 91 (88) 28 151
Total capital employed 1 830 63 (2 181) (108) 28 4 028
0.0
0.5
1.0
1.5
2.0
2.5
3.0
3.5
4.0
4.5
H1 09 H2 09 H1 10 H2 10 H1 11 H2 11 H1 12 H2 12 H1 13
In m
on
ths
of
sal
es
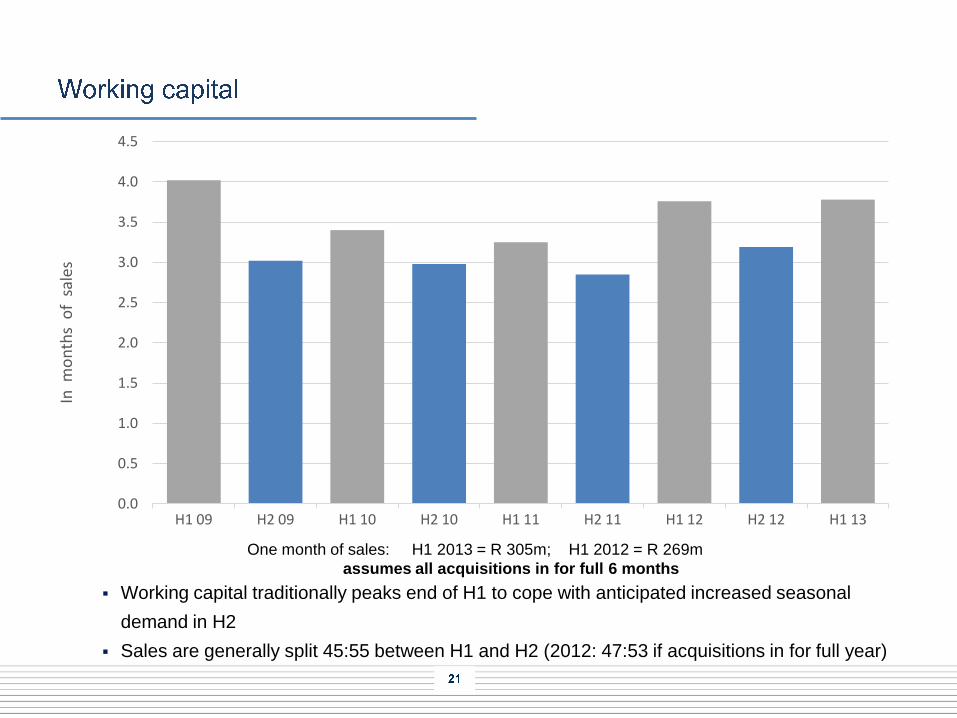
One month of sales: H1 2013 = R 305m; H1 2012 = R 269m
assumes all acquisitions in for full 6 months
Working capital traditionally peaks end of H1 to cope with anticipated increased seasonal
demand in H2
Sales are generally split 45:55 between H1 and H2 (2012: 47:53 if acquisitions in for full year)
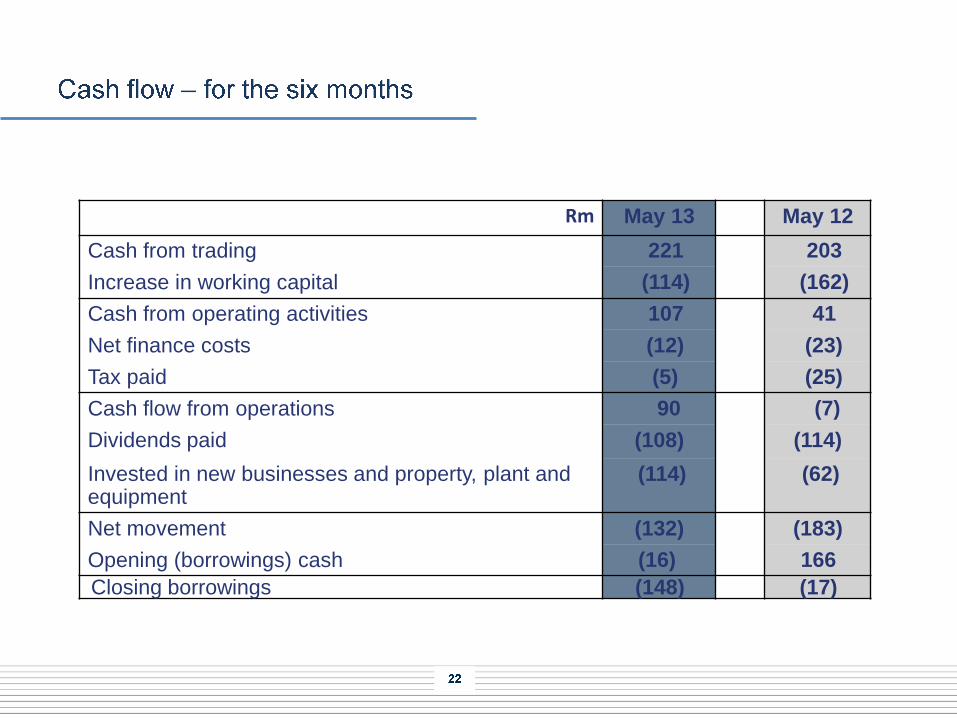
Rm May 13 May 12
Cash from trading 221 203
Increase in working capital (114) (162)
Cash from operating activities 107 41
Net finance costs (12) (23)
Tax paid (5) (25)
Cash flow from operations 90 (7)
Dividends paid (108) (114)
Invested in new businesses and property, plant and equipment
(114) (62)
Net movement (132) (183)
Opening (borrowings) cash (16) 166
Closing borrowings (148) (17)

Hudaco sales are predominantly driven by GDP activity
GDFI adds cream (and adds capacity for future GDP activity)
Rand exchange rate has a big impact on pricing

Engineering consumables
Low commodity prices have led to contraction of gold and platinum
mining in South Africa
Shortage of electricity and rail capacity constrains expansion of coal and
iron ore mining
Lack of common objectives for the mining industry by government,
capital and labour also constrains investment
Prospects for mining investment in neighbouring countries still good

Consumer-related products
Growth in consumer spending slowing as employment stagnates and
social grants reach saturation
Industrial power tool sales remains strong but rapid growth is
probably behind us
Analogue to digital migration gathering pace
Security equipment sales up as competitors struggle and spending on
new housing and light industrial buildings grows

Tax challenge will take time to resolve but operational management
are firmly focused on growing the business
Rand weakness is typically good for Hudaco and our customers
A pickup in mining and manufacturing activity in response is unlikely
in current climate
A sustained pickup in commodity prices depends on a turn-around in
the world economy
Acquisitions and the Africa initiative are strengthening and diversifying
the earnings base
Hudaco earnings performance in the medium term from existing
businesses to be steady to moderately up, complemented by
acquisitions

28
The preceding presentation contains forward looking statements about the
Hudaco Group’s operations and financial position. They are prepared in
good faith and are based on Hudaco’s best estimates and information at
the time of preparing the presentation. They are nonetheless subject to
significant uncertainties and contingencies many of which are
understandably beyond Hudaco’s control. Unanticipated events will occur
and actual future events may differ materially from current expectations for
many reasons including new business opportunities, as well as many other
internal and external factors. Any of these factors may materially affect
Hudaco's future business activities and financial results. None of the
forward looking statements has been reported on by Hudaco’s auditors.

Clifford Amoils
Financial director
Tel +27 (11) 657 5002
Fax +27 (86) 681 7862
Stephen Connelly
Chief executive
Tel +27 (11) 657 5001
Fax +27 (86) 532 9524
