powerpoint 2014
TRANSCRIPT

1
2014 Shell Creek Watershed Research Group
Advisors: Mark Seier, Kylie Sweeter, and Danielle Amen
Researchers: Mariely Estrada, Parker Wallin, Sadie Wallin, Marcela Estrada, Esmeralda Arreguin, Celine Dunlap,
Destiny Johnson, Joe O’Brien, Nolan Wondercheck, Steven Arreguin, Will Dyer, Andy King, Mya Donelson, Hannah Haase, Jacob Potmesil, Kyle Stone, Jacob Haase, and
Brooke Pieke.

2
(with Township-Range Labels)
Shell Creek and Loseke-Taylor Creek Watersheds
Lower Platte North Natural Resources District
6South Branch
North Branch

3
6Above Newman Grove
Below Newman Grove

4
6
Below Lindsay
West Platte Center

5
W.Q.I.
• The Water Quality Index was developed by the National Sanitation Foundation as a standard system to compare different bodies of water.
• To determine the WQI, a series of nine tests were performed. These tests were: dissolved oxygen, fecal coliform, pH, Biological Oxygen Demand (BOD), temperature, total phosphate, nitrates, turbidity, and total solids. We also did a water discharge test which we use to measure the flow of the creek in cubic feet per second.

6
• After the tests are completed, the WQI for each section of the creek can be computed.
• To formulate the WQI, we first computed Q-values.
• We multiply this number by a weighting factor, which provides a measure of the relative importance of each test to overall water quality.
• The water quality index ranges from zero to 100.
- 0 - 25 is very bad - 25 - 50 is bad - 50 - 70 is medium - 70 - 90 is good- 90 - 100 is excellent
• The bio-indicator tests are not part of the W.Q.I., but do give us a water quality rating.

7
Sample W.Q.I. Curve Chart

8
Sample W.Q.I. Form
Test Results Q-valueWeighting
FactorT o t a l
DO % sat. 0.17 Fecal Coliform col/100 mL 0.16
pH units 0.11 BOD mg/L 0.11
Temperature change in C 0.1 Total Phosphate mg/L 0.1
Nitrates mg/L 0.1 Turbidity JTU 0.08
Total Solids mg/L 0.07
Overall Water Quality Index ___

9
May June July August0
2
4
6
8
10
12
2014 PrecipitationIn
ch
es
Date

10
May 30 June 10 July 18 August 76.3
6.6
6.9
7.2
7.5
7.8
8.1
8.4
pH
Site 1
Site 2
Site 3
Date
pH
Level
11
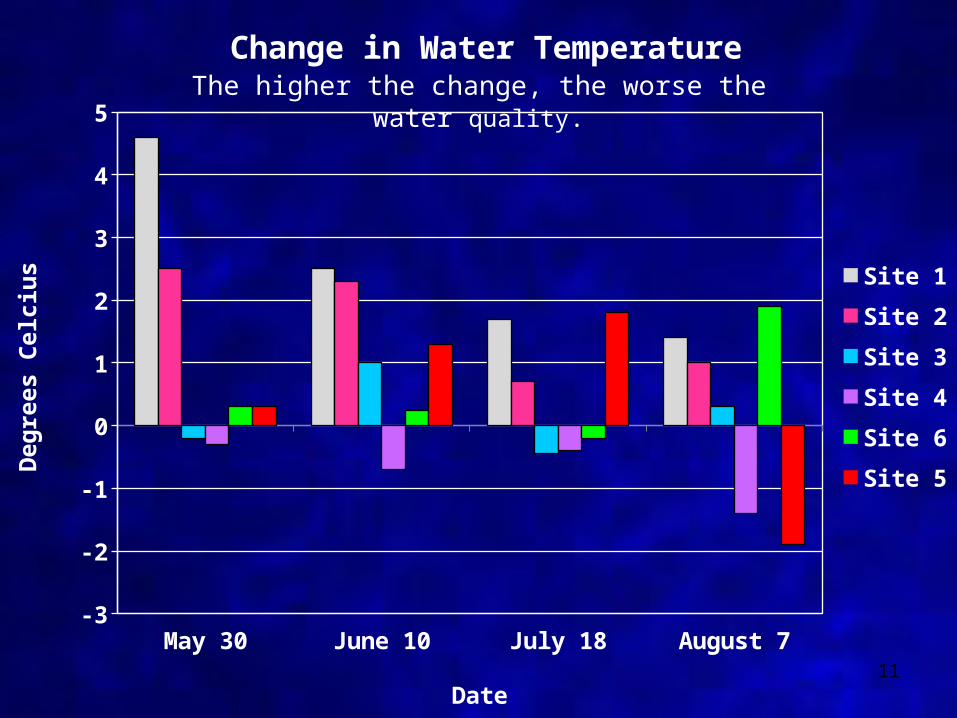
May 30 June 10 July 18 August 7-3
-2
-1
0
1
2
3
4
5
Change in Water Temperature
Site 1
Site 2
Site 3
Site 4
Site 6
Site 5
Date
Deg
rees C
elc
ius
The higher the change, the worse the water quality.

12May 30 June 10 July 18 August 7
0
100
200
300
400
500
600
700
800
900
1000
Total Solids
Site 1
Site 2
Site 3
Site 4
Site 6
Site 5
Date
mg
/LThe higher the concentration, the worse the water
quality.

13
Fecal Coliform

14
May 30 June 10 July 18 August 7100
1000
Fecal Coliform
Site 1
Site 2
Site 3
Date
Colo
nie
s/1
00
mL

1520
0320
0420
0520
0620
0720
0820
0920
1020
1120
1220
1320
1410
100
1000
10000
100000
Site 1Site 2Site 3Site 4Site 6Site 5
Fecal Coliform

16May 30 June 10 July 18 August 7
0
5
10
15
20
25Flow
Site 1
Site 2
Site 3
Site 4
Site 6
Site 5
Date
Cu
bic
Feet
Per
Secon
d
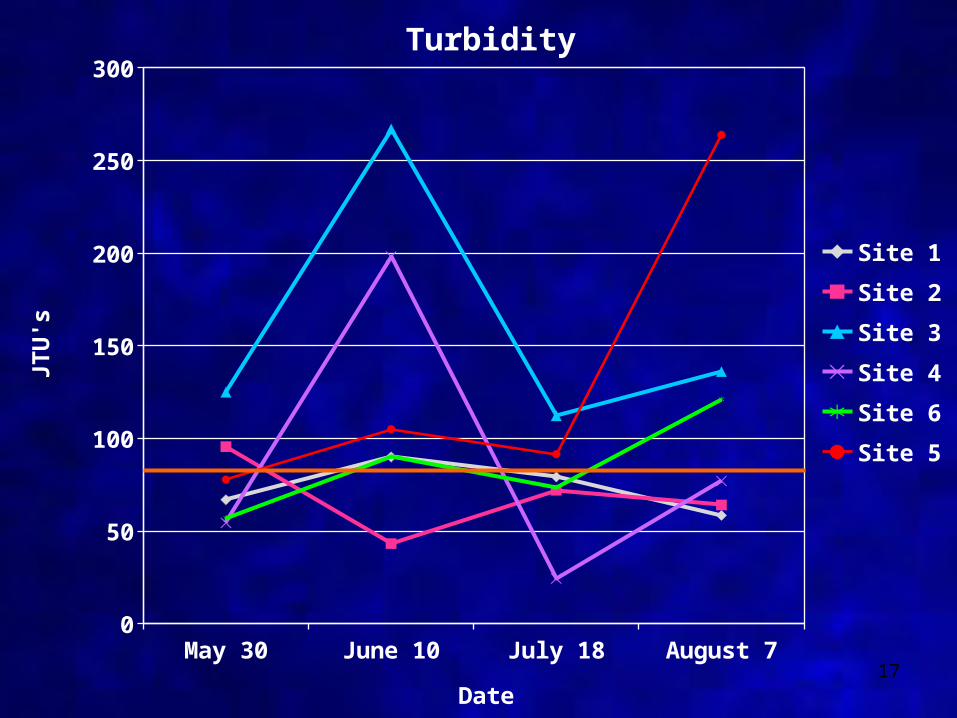
17May 30 June 10 July 18 August 7
0
50
100
150
200
250
300Turbidity
Site 1
Site 2
Site 3
Site 4
Site 6
Site 5
Date
JTU
's

18
May 30 June 10 July 18 August 740
50
60
70
80
90
100
110
Dissolved Oxygen
Site 1
Site 2
Site 3
Date
% S
atu
rati
on

19May 30 June 10 July 18 August 7
0
1
2
3
4
5
6
7
8
5 Day Biological Oxygen Demand
Site 1
Site 2
Site 3
Site 4
Site 6
Site 5
Date
PP
M
The higher the change, the worse the water quality.

20
May 30 June 10 July 18 August 70
5
10
15
20
25
30
35
40
45
50
Nitrates
Site 1
Site 2
Site 3
Site 4
Site 6
Site 5
Date
PP
M

21
2002 2003 2004 2005 2006 2007 2008 2009 2010 2011 2012 2013 20140
10
20
30
40
50
60
Nitrates
Site 1
Site 2
Site 3
Site 4
Site 6
Site 5
Date
PPM

22
May 30 June 10 July 18 August 70
0.2
0.4
0.6
0.8
1
1.2
1.4
1.6
1.8
2Phosphates
Site 1
Site 2
Site 3
Site 4
Site 6
Site 5
Date
PP
M

23
Medium
Bad
Good
Site 1 Site 2 Site 3 Site 4 Site 6 Site 530
35
40
45
50
55
60
65
70
2003 Averages 2004 Averages 2005 Averages
2006 Averages 2007 Averages 2008 Averages
2009 Averages 2010 Averages 2011 Averages
2012 Averages 2013 Averages 2014 Averages
WQI Averages by Site

24
Good
Bad
Medium
2003
2004
2005
2006
2007
2008
2009
2010
2011
2012
2013
2014
35
40
45
50
55
60
65
70WQI Averages by Year
WQI

25
Total Rain-fall Inches
Discharge CFS
Nitrates PPM
pH 0
5
10
15
20
25
302003-2014 Chemical Test Average
Comparison 2003 Averages
2004 Averages
2005 Averages
2006 Averages
2007 Averages
2008 Averages
2009 Averages
2010 Averages
2011 Averages
2012 Averages
2013 Averages
2014 Average

26
Phosphates ppm B.O.D. ppm Change in Temp. Celcius
0
0.5
1
1.5
2
2.5
3
3.5
2003-2014 Chemical Test Average Comparison 2003 Av-
erages2004 Av-erages2005 Av-erages2006 Av-erages2007 Av-erages2008 Av-erages2009 Av-erages2010 Av-erages

27
D.O. % Sat. Turbidity JTU Fecal Coliform Colonies/100 mL
Total Solids mg/L
10
100
1000
10000 2003 Av-erages2004 Av-erages2005 Av-erages2006 Av-erages2007 Av-erages2008 Av-erages2009 Av-erages2010 Av-erages
2003-2014 Chemical Test Average Comparisons

Chemical Test Conclusions
• The Dissolved Oxygen numbers look considerably better. (possibly due to new equipment)
• The fecal coliform count is still very erratic.
• The overall WQI is at its best since 2003.
• Nitrates, Phosphates, and Fecal Coliform all correlate with the amount of rainfall.
• Sites 1, 5, and 6 are the most erratic sites while sites 2, 3, and 4 are the most consistent.
28

29
Macro Invertebrates
Tolerant
Somewhat SensitiveSensit
ive

30
Beaver-Shell Creek Comparison2014
pH Nitrates Phos-phates
B.O.D0
1
2
3
4
5
6
7
8
Beaver CreekShell Creek

31
Beaver-Shell Creek Comparison2014
Turbidity Fecal Col-iform
Total Solids
D.O. % Sat.
0
100
200
300
400
500
600
700
Beaver Creek
Shell Creek Fecal Coliform- 2,481.25

32
Beaver-Shell Creek WQI Comparison
Good
Medium
Bad
/08
/09
/10
/11
/12
/13
/14
May
June Ju
ly
Augu
st0
10
20
30
40
50
60
70
80
Beaver Creek Av-erage WQI
Shell Creek Average WQI

33
34
35

36
Superhero's Saving the Planet One stream at a time!

37
Website
• Go to http://www.newman.esu8.org/ • Click the “Shell Creek Watershed”
icon on the right hand column• You can access our data and further
information concerning this project, including pictures

38
Thank You To:• Lower Platte North Natural
Resource District
• PrairieLand RC&D
• Natural Resource Conservation Service
• Nebraska Department of Environmental Quality
• Shell Creek Watershed
Improvement Group
• Chris Poole
• Area Land Owners
• United States Geographical Survey
• University of Nebraska Extension Service
• Newman Grove Public Schools
The End