powerful and free: open-source software that water resources professionals can use for data analysis...
TRANSCRIPT

Powerful and Free: Open-source Software that Water Resources
Professionals can use for Data Analysis and Visualization
Kenneth R. Odom, PhD, PEHydro Services - Reservoir Management Section
Southern Company
2012 Alabama Water Resources Conference

What we’ll cover …
• Gnuplot – data visualization, smoothing, curve-fitting
• R – data visualization, probability, statistics, modeling, simulation, optimization, etc.
• Text editing• Other open-source software

Gnuplot command window

Gnuplot example 1
#year count 1700 5 1701 11 1702 16 1703 23 1704 36 1705 58 1706 29 1707 20 1708 10 … …
gnuplot> plot sunspot_data.txtgnuplot> plot sunspot_data.txt with lines
FILE: sunspot_data.txt

Gnuplot example 2
#DATE PPT TEMP1931 01 15 751931 02 67 741931 03 193 731931 04 173 861931 05 110 901931 06 210 971931 07 421 971931 08 84 951931 09 80 97… …
FILE: fairhope_data.txt
gnuplot> load ‘fairhope_data.gp’
resetset xdata timeset timefmt ‘%Y %m’set format x ‘%Y-%m’set gridplot fairhope_data.txt using 1:3 with lines
FILE: fairhope_data.gp

Gnuplot example 2
#DATE PPT TEMP1931 01 15 751931 02 67 741931 03 193 731931 04 173 861931 05 110 901931 06 210 971931 07 421 971931 08 84 951931 09 80 97… …
FILE: fairhope_data.txt
gnuplot> load ‘fairhope_data.gp’
resetset xdata timeset timefmt ‘%Y %m’set format x ‘%Y-%m’set gridset style line 2 lt 1 lw 2 pt 4 lc rgb ‘blue’set title ‘Maximum Monthly Event Precipitation’set xlabel ‘Year-Month’set ylabel ‘Precipitation (in)’plot [‘1970 01’: ‘1975 12’][]fairhope_data.txt \ using 1:($3/100) w lp ls 2 t ‘Fairhope’
FILE: fairhope_data.gp
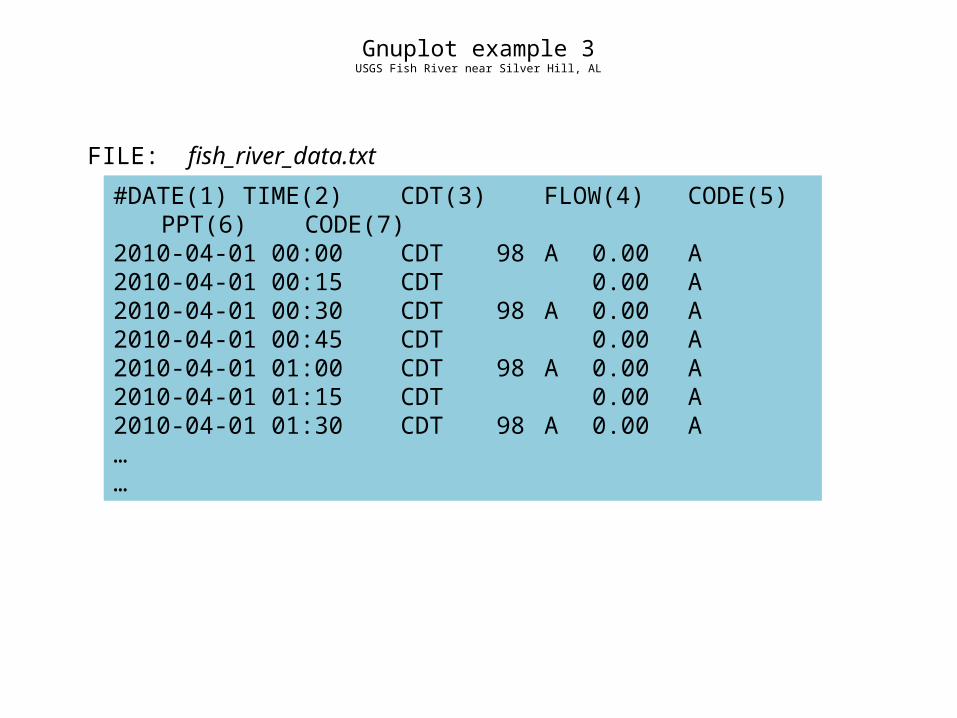
Gnuplot example 3USGS Fish River near Silver Hill, AL
#DATE(1) TIME(2) CDT(3) FLOW(4) CODE(5) PPT(6) CODE(7) 2010-04-01 00:00 CDT 98 A 0.00 A2010-04-01 00:15 CDT 0.00 A2010-04-01 00:30 CDT 98 A 0.00 A2010-04-01 00:45 CDT 0.00 A2010-04-01 01:00 CDT 98 A 0.00 A2010-04-01 01:15 CDT 0.00 A2010-04-01 01:30 CDT 98 A 0.00 A……
FILE: fish_river_data.txt

Gnuplot example 3USGS Fish River near Silver Hill, AL

Gnuplot example 3USGS Fish River near Silver Hill, AL
FILE: fish_river.gp
gnuplot> load ‘fish_river.gp’

Gnuplot example 3USGS Fish River near Silver Hill, AL

Gnuplot example 4USGS Village Creek at Ensley, AL
#DATE(1)TIME(2)CDT(3)FLOW(4)CODE(5)TEMP(6)CODE(7)SC(8)CODE(9)DO(10)CODE(11)2012-08-08 00:00 CDT 44 P 26.1 P 435 P 5.6 P2012-08-08 00:15 CDT 46 P 2012-08-08 00:30 CDT 46 P 2012-08-08 00:45 CDT 46 P 2012-08-08 01:00 CDT 46 P 25.9 P 422 P 5.4 P2012-08-08 01:15 CDT 47 P 2012-08-08 01:30 CDT 53 P 2012-08-08 01:45 CDT 57 P 2012-08-08 02:00 CDT 58 P 25.8 P 417 P 5.4 P2012-08-08 02:15 CDT 60 P 2012-08-08 02:30 CDT 58 P 2012-08-08 02:45 CDT 57 P 2012-08-08 03:00 CDT 55 P 25.6 P 426 P 5.4 P……
FILE: village_creek.txt

Gnuplot example 4USGS Village Creek at Ensley, AL
FILE: village_creek.gp
gnuplot> load ‘village_creek.gp’

Gnuplot example 4USGS Village Creek at Ensley, AL


Gnuplot resources
Website: www.gnuplot.info-Software-Examples-Documentation-Tutorials
Google ‘gnuplot’

R – statistical computingwww.r-project.org

R – ‘the old way’

USGS field streamflow measurements
num date time ht q rating qChan width area vel 485 1987-04-29 16:20 0.71 30.0 FAIR 30.0 29.0 23.0 1.30 486 1987-05-27 12:30 1.07 69.4 FAIR 69.4 31.0 33.1 2.10 487 1987-07-10 11:15 1.06 61.4 FAIR 61.4 31.0 33.0 1.86 488 1987-08-04 14:05 0.81 36.5 FAIR 36.5 28.0 25.4 1.44 489 1987-09-03 11:40 0.54 15.5 FAIR 15.5 26.3 18.0 0.86 490 1987-10-08 12:15 0.57 16.1 FAIR 16.1 27.0 18.3 0.88
……
FILE: granby_colorado_gage.txt

Using R – ‘the new way’R-studio

Cahaha River data
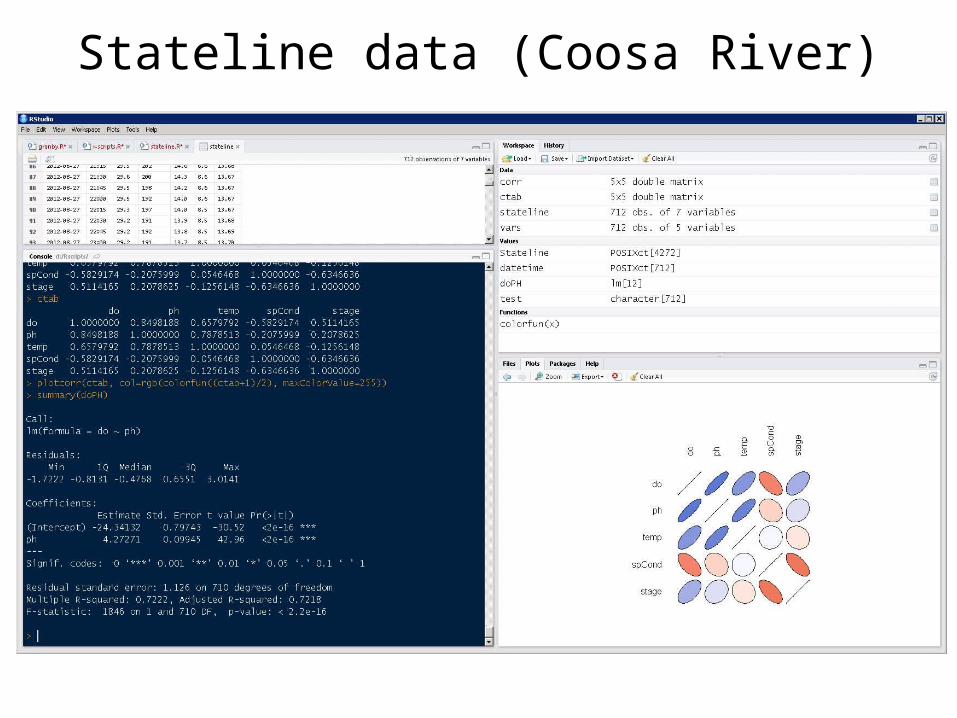
Stateline data (Coosa River)

www.rstudio.org

R Commander

R Commander

R Commander

R-stats books

rwww.r-bloggers.com

emacs
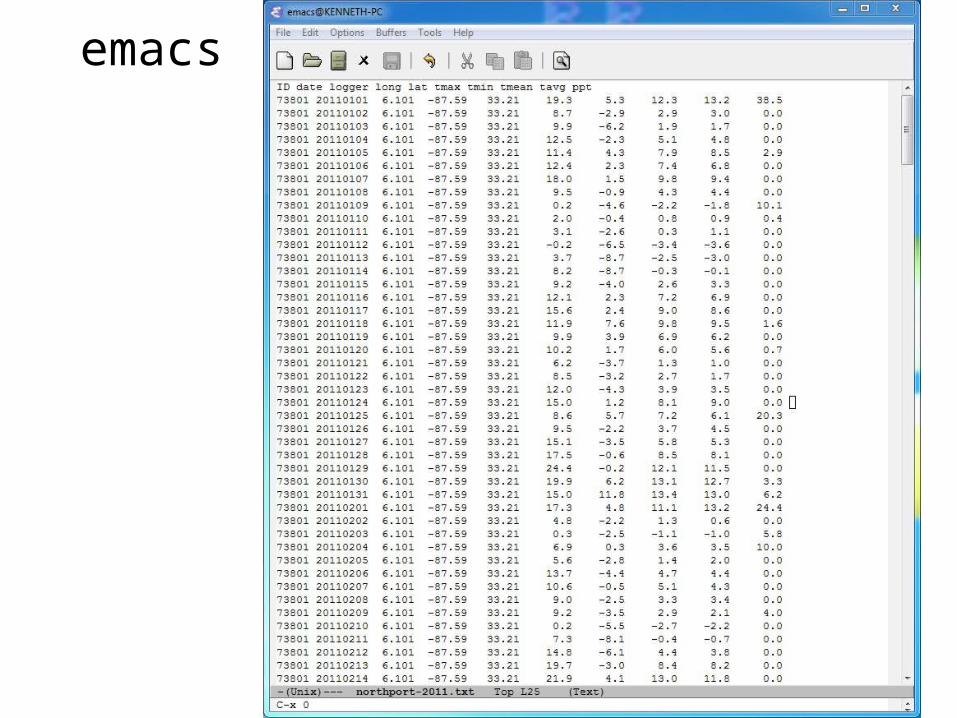
emacs

emacs

emacs

Notepad ++

Other software• Image processing:
– Image J, Inkscape (similar to Illustrator), Gimp (similar to Photoshop)• Matlab “like” software
– Octave, Sage, SciLab• Text editors
– Emacs, XEmacs, Notepad2, Notepad++, PSPad, Gedit, Geany• Programming/Scripting
– Python 2.7.3 (Python 3.0 is working but under active development)– ERIC is a good python IDE– IPython and IPython notebook– http://vislab-ccom.unh.edu/~schwehr/rt/ (IPython, Emacs, R)– gawk (subset large data files, pattern searching)
• Office productivity– LibreOffice (similar to MS Office)– Gnumeric (good standalone spreadsheet but lacks full documentation)– Abiword (standalone word processor)
