powerandperformance
TRANSCRIPT

Power and Performance considerations in the
Data center
Partha Kundu Sr. Dis0nguished Engineer Corporate CTO Office
Keynote

Intl. Green Compu0ng Conf. 2013 6/27/2013 2 Partha Kundu
Data center compu0ng is a new paradigm!

Intl. Green Compu0ng Conf. 2013 6/27/2013
Outline of talk
q Power & Energy in Data Centers
q Performance at Scale
q Network variability & Performance
q Conclusions
3 Partha Kundu

Intl. Green Compu0ng Conf. 2013 6/27/2013 4 Partha Kundu
Intl. Green Compu0ng Conf. 2013 6/27/2013 5 Partha Kundu
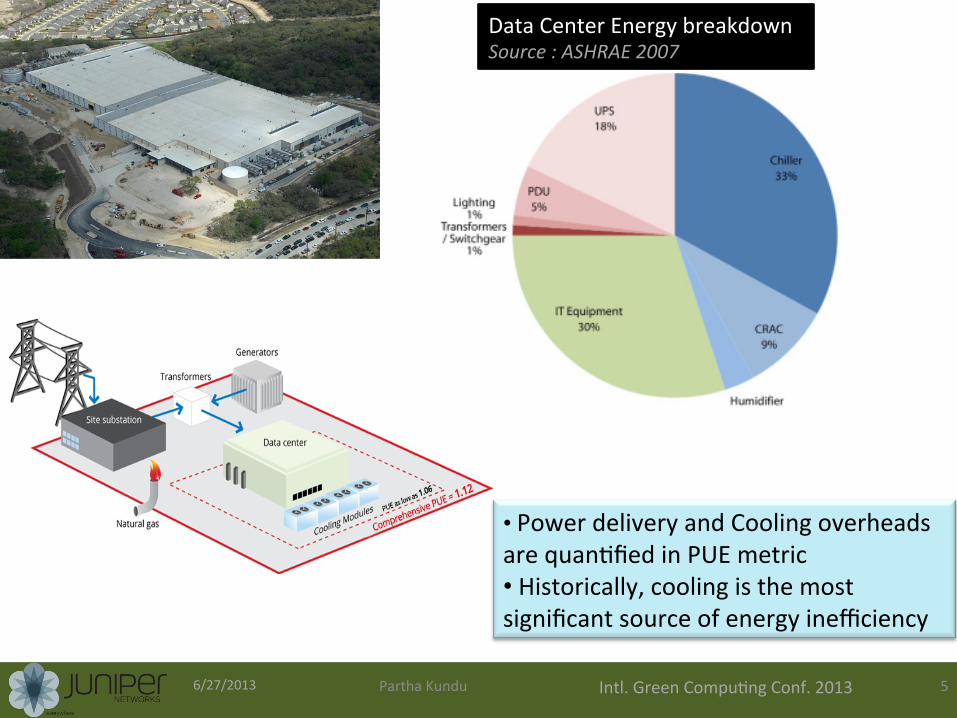
• Power delivery and Cooling overheads are quan0fied in PUE metric • Historically, cooling is the most significant source of energy inefficiency
Data Center Energy breakdown Source : ASHRAE 2007

Intl. Green Compu0ng Conf. 2013 6/27/2013 6 Partha Kundu
• PUE reducing over the years • But, PUE also reported incorrectly
Source: Google

Intl. Green Compu0ng Conf. 2013 6/27/2013
Energy Efficiency
Most of the 0me server load is around 30%
But, server is least energy efficient in it’s most common opera0ng region!
Source : Barroso, Holzle: Data Center as a Computer, Morgan Claypool (publishers), 2009
Servers are never completely idle
7 Partha Kundu

Intl. Green Compu0ng Conf. 2013 6/27/2013
Dynamic Power Range CPU power component (peak & idle) in servers has reduced over the years
Dynamic Power range: • CPU power range is 3x for servers • DRAM range is 2X • Disk and Networking is < 1.2X
Disk and Network switches need to learn from the CPU’s power
propor9onality gains Source : Barroso, Holzle: Data Center as a Computer, Morgan Claypool (publishers), 2009
8 Partha Kundu

Intl. Green Compu0ng Conf. 2013 6/27/2013
Energy Propor0onality
Goal: Achieve best energy efficiency (~80%) in the common opera0ng regions (20 – 30% load)
Challenges to propor9onality: • Most propor0onality tricks in embedded/mobile devices are not useable in DC due to huge ac0va0on penal0es • Distributed structure of data and applica0on doesn’t allow powering down during low use • Disk drives spin >50% of 0me even when there is no ac0vity
• SSD help but beware of wear leveling and garbage collec0on overheads 9 Partha Kundu

Intl. Green Compu0ng Conf. 2013 6/27/2013
Dynamic Resource requirements in the Data-‐center
Intra-‐server varia0on (TPC-‐H, log scale) Inter-‐server varia0on (rendering farm)
Time
Server M
emory Alloca0o
n
Query
Huge varia0ons even within a single Applica0on running in a large cluster
10 Partha Kundu
Q 1 Q 2 Q 3 Q 4 Q 5 Q 6 Q 7 Q 8 Q 9 Q 10 Q 11 Q 120 .1MB
1MB
10MB
100MB
1G B
10G B
100G B

Intl. Green Compu0ng Conf. 2013 6/27/2013
11 Partha Kundu
CPUs DIMM DIMM
CPUs DIMM DIMM
CPUs DIMM DIMM
CPUs DIMM DIMM
DIMM
DIMM
DIMM Backplane
DIMM
DIMM
DIMM
DIMM
DIMM
Conven0onal blade systems
Mo0va0ng Disaggregated memory* *Lim et al: Disaggregated Memory for expansion and sharing in Blade Servers, ISCA 2009

Intl. Green Compu0ng Conf. 2013 6/27/2013 12 Partha Kundu
Disaggregated Memory
ð Break CPU-‐memory co-‐loca0on
Leverage fast, shared communica0on fabrics
Blade systems with disaggregated memory
CPUs DIMM DIMM
CPUs DIMM DIMM
CPUs DIMM DIMM
CPUs DIMM DIMM
Backplane DIMM
Memory blade
DIMM DIMM
DIMM DIMM DIMM
DIMM DIMM

Intl. Green Compu0ng Conf. 2013 6/27/2013 13 Partha Kundu
Blade systems with disaggregated memory
CPUs DIMM DIMM
CPUs DIMM DIMM
CPUs DIMM DIMM
CPUs DIMM DIMM
Backplane DIMM
Memory blade
DIMM DIMM
DIMM DIMM DIMM
DIMM DIMM
Authors claim: Ø 8X improvement on memory constrained environments Ø 80+% improvement in performance per $ Ø 3x consolida0on
Disaggregated Memory

Intl. Green Compu0ng Conf. 2013 6/27/2013
Performance at Scale
14 Partha Kundu
Intl. Green Compu0ng Conf. 2013 6/27/2013 15 Partha Kundu
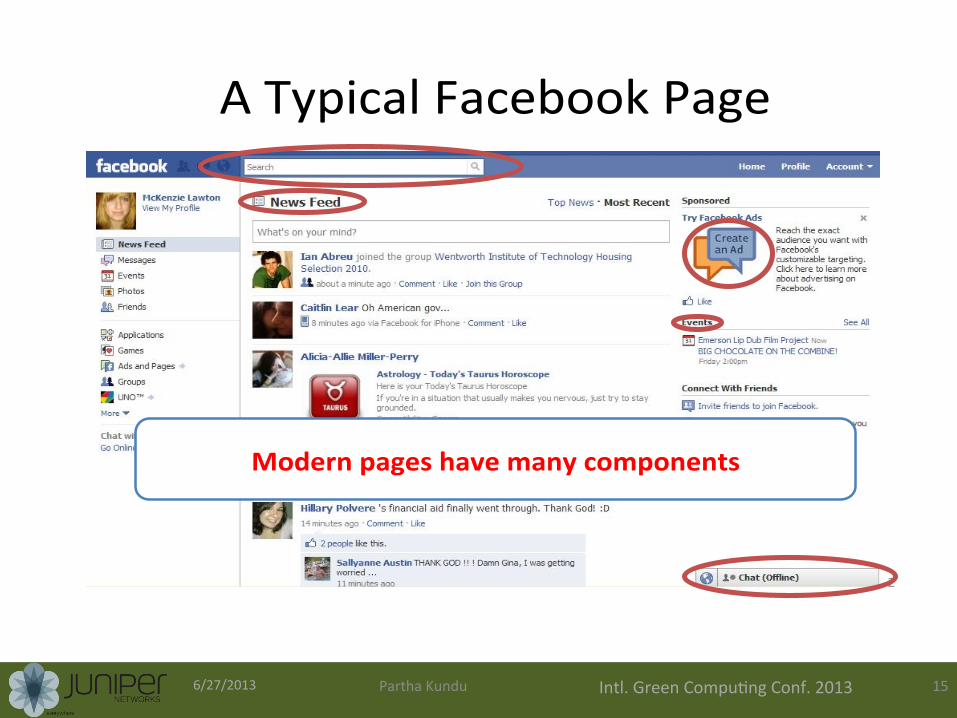
A)Typical)Facebook)Page)
2)
Modern'pages'have'many'components'

Intl. Green Compu0ng Conf. 2013 6/27/2013 16 Partha Kundu
Crea6ng)a)Page)
Datacenter)Network)
Internet)
…'
Front)End)
…'
News)Feed)
…'
Search)
…'
Ads)
…'
Chat)3)
1. Soft real-time nature
• Online services have SLAs baked into their operation
• Example: 300ms response time
for 99.9% requests
User-facing online services
Agg.
Aggregator
Agg. Agg.
Worker
Request Response
Worker Worker Worker
Impact of breached SLAs: • Amazon: extra 100ms costs 1%
in sales
Two common underlying themes
2. Partition-aggregate workflow
Parallelism when handling a query Parallelism when serving a page
It’s all very embarrassingly parallel!

Intl. Green Compu0ng Conf. 2013 6/27/2013 17 Partha Kundu
contributed articles
FEBRUARY 2013 | VOL. 56 | NO. 2 | COMMUNICATIONS OF THE ACM 77
systems with shared computational resources exhibit performance fluctua-tions beyond the control of application developers. Google has therefore found it advantageous to develop tail-tolerant techniques that mask or work around temporary latency pathologies, instead of trying to eliminate them altogether. We separate these techniques into two main classes: The first corresponds to within-request immediate-response techniques that operate at a time scale of tens of milliseconds, before longer-term techniques have a chance to react. The second consists of cross-request long-term adaptations that perform on a time scale of tens of seconds to min-utes and are meant to mask the effect of longer-term phenomena.
Within Request Short-Term Adaptations A broad class of Web services deploy multiple replicas of data items to pro-vide additional throughput capacity and maintain availability in the presence of failures. This approach is particularly effective when most requests operate on largely read-only, loosely consistent da-tasets; an example is a spelling-correc-tion service that has its model updated once a day while handling thousands of correction requests per second. Simi-larly, distributed file systems may have multiple replicas of a given data chunk that can all be used to service read re-quests. The techniques here show how replication can also be used to reduce latency variability within a single high-er-level request:
Hedged requests. A simple way to curb latency variability is to issue the same request to multiple replicas and use the results from whichever replica responds first. We term such requests “hedged requests” because a client first sends one request to the replica be-lieved to be the most appropriate, but then falls back on sending a secondary request after some brief delay. The cli-ent cancels remaining outstanding re-quests once the first result is received. Although naive implementations of this technique typically add unaccept-able additional load, many variations exist that give most of the latency-re-duction effects while increasing load only modestly.
One such approach is to defer send-ing a secondary request until the first
request has been outstanding for more than the 95th-percentile expected la-tency for this class of requests. This approach limits the additional load to approximately 5% while substantially shortening the latency tail. The tech-nique works because the source of la-tency is often not inherent in the par-ticular request but rather due to other forms of interference. For example, in a Google benchmark that reads the val-ues for 1,000 keys stored in a BigTable table distributed across 100 different servers, sending a hedging request after a 10ms delay reduces the 99.9th-percen-tile latency for retrieving all 1,000 values from 1,800ms to 74ms while sending just 2% more requests. The overhead of hedged requests can be further reduced by tagging them as lower priority than the primary requests.
Tied requests. The hedged-requests technique also has a window of vulner-
ability in which multiple servers can execute the same request unnecessar-ily. That extra work can be capped by waiting for the 95th-percentile expect-ed latency before issuing the hedged request, but this approach limits the benefits to only a small fraction of re-quests. Permitting more aggressive use of hedged requests with moderate resource consumption requires faster cancellation of requests.
A common source of variability is queueing delays on the server before a request begins execution. For many services, once a request is actually scheduled and begins execution, the variability of its completion time goes down substantially. Mitzenmacher10 said allowing a client to choose between two servers based on queue lengths at enqueue time exponentially improves load-balancing performance over a uni-form random scheme. We advocate not
1
0.9
0.8
0.7
0.6
0.5
0.4
0.3
0.2
0.1
0
1 500 1,000 1,500 2,000
Probability of one-second service-level response time as the system scales and frequency of server-level high-latency outliers varies.
0.18
0.63
1 in 10,0001 in 1,0001 in 100
Numbers of Servers
P (serv
ice lat
ency >
1s)
Table 1. Individual-leaf-request finishing times for a large fan-out service tree (measured from root node of the tree).
50%ile latency 95%ile latency 99%ile latency
One random leaf finishes 1ms 5ms 10ms
95% of all leaf requests finish
12ms 32ms 70ms
100% of all leaf requests finish
40ms 87ms 140ms
contributed articles
FEBRUARY 2013 | VOL. 56 | NO. 2 | COMMUNICATIONS OF THE ACM 77
systems with shared computational resources exhibit performance fluctua-tions beyond the control of application developers. Google has therefore found it advantageous to develop tail-tolerant techniques that mask or work around temporary latency pathologies, instead of trying to eliminate them altogether. We separate these techniques into two main classes: The first corresponds to within-request immediate-response techniques that operate at a time scale of tens of milliseconds, before longer-term techniques have a chance to react. The second consists of cross-request long-term adaptations that perform on a time scale of tens of seconds to min-utes and are meant to mask the effect of longer-term phenomena.
Within Request Short-Term Adaptations A broad class of Web services deploy multiple replicas of data items to pro-vide additional throughput capacity and maintain availability in the presence of failures. This approach is particularly effective when most requests operate on largely read-only, loosely consistent da-tasets; an example is a spelling-correc-tion service that has its model updated once a day while handling thousands of correction requests per second. Simi-larly, distributed file systems may have multiple replicas of a given data chunk that can all be used to service read re-quests. The techniques here show how replication can also be used to reduce latency variability within a single high-er-level request:
Hedged requests. A simple way to curb latency variability is to issue the same request to multiple replicas and use the results from whichever replica responds first. We term such requests “hedged requests” because a client first sends one request to the replica be-lieved to be the most appropriate, but then falls back on sending a secondary request after some brief delay. The cli-ent cancels remaining outstanding re-quests once the first result is received. Although naive implementations of this technique typically add unaccept-able additional load, many variations exist that give most of the latency-re-duction effects while increasing load only modestly.
One such approach is to defer send-ing a secondary request until the first
request has been outstanding for more than the 95th-percentile expected la-tency for this class of requests. This approach limits the additional load to approximately 5% while substantially shortening the latency tail. The tech-nique works because the source of la-tency is often not inherent in the par-ticular request but rather due to other forms of interference. For example, in a Google benchmark that reads the val-ues for 1,000 keys stored in a BigTable table distributed across 100 different servers, sending a hedging request after a 10ms delay reduces the 99.9th-percen-tile latency for retrieving all 1,000 values from 1,800ms to 74ms while sending just 2% more requests. The overhead of hedged requests can be further reduced by tagging them as lower priority than the primary requests.
Tied requests. The hedged-requests technique also has a window of vulner-
ability in which multiple servers can execute the same request unnecessar-ily. That extra work can be capped by waiting for the 95th-percentile expect-ed latency before issuing the hedged request, but this approach limits the benefits to only a small fraction of re-quests. Permitting more aggressive use of hedged requests with moderate resource consumption requires faster cancellation of requests.
A common source of variability is queueing delays on the server before a request begins execution. For many services, once a request is actually scheduled and begins execution, the variability of its completion time goes down substantially. Mitzenmacher10 said allowing a client to choose between two servers based on queue lengths at enqueue time exponentially improves load-balancing performance over a uni-form random scheme. We advocate not
1
0.9
0.8
0.7
0.6
0.5
0.4
0.3
0.2
0.1
0
1 500 1,000 1,500 2,000
Probability of one-second service-level response time as the system scales and frequency of server-level high-latency outliers varies.
0.18
0.63
1 in 10,0001 in 1,0001 in 100
Numbers of Servers
P (s
ervic
e lat
ency
> 1s
)
Table 1. Individual-leaf-request finishing times for a large fan-out service tree (measured from root node of the tree).
50%ile latency 95%ile latency 99%ile latency
One random leaf finishes 1ms 5ms 10ms
95% of all leaf requests finish
12ms 32ms 70ms
100% of all leaf requests finish
40ms 87ms 140ms
Last 5% of requests double the
total response 9me
Un0l it’s not!
Source : The Tail at Scale, Dean, February 2013 Communica0on of the ACM
Consider system with: • Median latency 10ms

Intl. Green Compu0ng Conf. 2013 6/27/2013 18 Partha Kundu

Intl. Green Compu0ng Conf. 2013 6/27/2013 19 Partha Kundu
• Local Shared resources • Global shared resources
Shared Resources:
• Logging • Data reconstruc0on • Garbage collec0on
Maintenance ac0vi0es
• Network • Server Queuing
• Ac0va0on delay Power & energy management
Causes of Performance Variability
Intl. Green Compu0ng Conf. 2013 6/27/2013 20 Partha Kundu
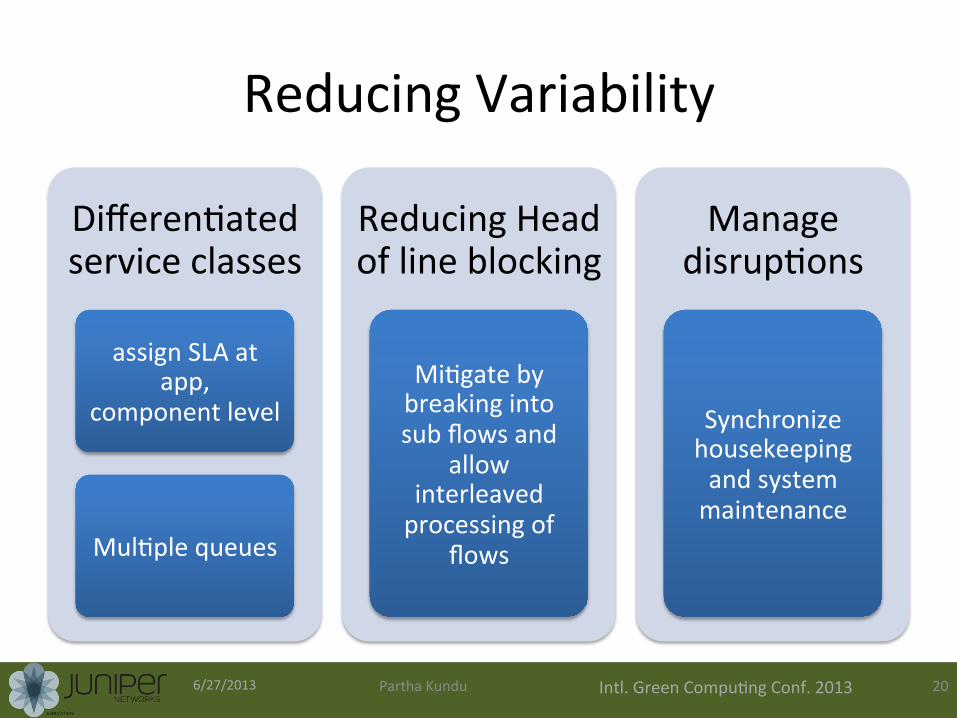
Reducing Variability
Differen0ated service classes
assign SLA at app,
component level
Mul0ple queues
Reducing Head of line blocking
Mi0gate by breaking into sub flows and
allow interleaved processing of
flows
Manage disrup0ons
Synchronize housekeeping and system maintenance

Intl. Green Compu0ng Conf. 2013 6/27/2013 21 Partha Kundu
Tolera0ng Variability
Within-‐request short-‐term adap0ons
Hedged Requests
Wait “95th percen0le 0me” before launching (redundant) requests to
replica processing agents
Tied Requests:
Enqueue requests in replicas but cancel at start of job
Cross request long term adap0ons caused by load imbalance
Micro-‐par00oning :
unit of compute further par00oned into small grains for bewer load balance and recovery
from faults
Selec0ve replica0on
Replicate dynamically to handle burst traffic
Latency induced proba0on:
Record slow machines and temporarily disbar them from
ac0ve pool

Intl. Green Compu0ng Conf. 2013 6/27/2013
Network variability & performance
22 Partha Kundu

Intl. Green Compu0ng Conf. 2013 6/27/2013 23 Partha Kundu
Causes of Latency variability
• Buffer occupancy leads to increase in median and tail latencies Switch buffer
• Serving all can be harmful Fairness
• TCP 0me out Incast collapse
• Poor network u0liza0on, path conges0on
Single path transport

Intl. Green Compu0ng Conf. 2013 6/27/2013 24 Partha Kundu
Data center traffic characteriza0on age tra!c into and out of the data center. All links use Ethernet asa physical-layer protocol, with a mix of copper and "ber cabling.All switches below each pair of access routers form a single layer- domain, typically connecting several thousand servers. To limitoverheads (e.g., packet $ooding and ARP broadcasts) and to iso-late di%erent services or logical server groups (e.g., email, search,web front ends, web back ends), servers are partitioned into vir-tual LANs (VLANs). Unfortunately, this conventional design su%ersfrom three fundamental limitations:
Limited server-to-server capacity: As we go up the hierar-chy, we are confronted with steep technical and "nancial barriersin sustaining high bandwidth. &us, as tra!c moves up through thelayers of switches and routers, the over-subscription ratio increasesrapidly. For example, servers typically have : over-subscription toother servers in the same rack — that is, they can communicate atthe full rate of their interfaces (e.g., Gbps). We found that up-linksfrom ToRs are typically : to : oversubscribed (i.e., to Gbpsof up-link for servers), and paths through the highest layer ofthe tree can be : oversubscribed. &is large over-subscriptionfactor fragments the server pool by preventing idle servers from be-ing assigned to overloaded services, and it severely limits the entiredata-center’s performance.
Fragmentation of resources: As the cost and performance ofcommunication depends on distance in the hierarchy, the conven-tional design encourages service planners to cluster servers nearbyin the hierarchy. Moreover, spreading a service outside a singlelayer- domain frequently requires recon"guring IP addresses andVLAN trunks, since the IP addresses used by servers are topolog-ically determined by the access routers above them. &e result isa high turnaround time for such recon"guration. Today’s designsavoid this recon"guration lag by wasting resources; the plentifulspare capacity throughout the data center is o+en e%ectively re-served by individual services (and not shared), so that each servicecan scale out to nearby servers to respond rapidly to demand spikesor to failures. Despite this, we have observed instances when thegrowing resource needs of one service have forced data center oper-ations to evict other services from nearby servers, incurring signif-icant cost and disruption.
Poor reliability and utilization: Above the ToR, the basic re-silience model is :, i.e., the network is provisioned such that if anaggregation switch or access router fails, there must be su!cient re-maining idle capacity on a counterpart device to carry the load.&isforces each device and link to be run up to at most of its maxi-mumutilization. Further, multiple paths either do not exist or aren’te%ectively utilized. Within a layer-domain, the Spanning Tree Pro-tocol causes only a single path to be used even when multiple pathsbetween switches exist. In the layer- portion, Equal CostMultipath(ECMP) when turned on, can use multiple paths to a destinationif paths of the same cost are available. However, the conventionaltopology o%ers at most two paths.
3. MEASUREMENTS & IMPLICATIONSTo design VL, we "rst needed to understand the data cen-
ter environment in which it would operate. Interviews with archi-tects, developers, and operators led to the objectives described inSection , but developing the mechanisms on which to build thenetwork requires a quantitative understanding of the tra!c matrix(who sends how much data to whom and when?) and churn (howo+en does the state of the network change due to changes in demandor switch/link failures and recoveries, etc.?). We analyze these as-pects by studying production data centers of a large cloud serviceprovider and use the results to justify our design choices as well asthe workloads used to stress the VL testbed.
0 0.05 0.1
0.15 0.2
0.25 0.3
0.35 0.4
0.45
1 100 10000 1e+06 1e+08 1e+10 1e+12
PD
F
Flow Size (Bytes)
Flow Size PDFTotal Bytes PDF
0 0.2 0.4 0.6 0.8
1
1 100 10000 1e+06 1e+08 1e+10 1e+12
CD
F
Flow Size (Bytes)
Flow Size CDFTotal Bytes CDF
Figure : Mice are numerous; of $ows are smaller than MB. However, more than of bytes are in $ows betweenMB and GB.
Our measurement studies found two key results with implica-tions for the network design. First, the tra!c patterns inside a datacenter are highly divergent (as even over representative tra!cmatrices only loosely cover the actual tra!cmatrices seen),and theychange rapidly andunpredictably. Second, the hierarchical topologyis intrinsically unreliable—even with huge e%ort and expense to in-crease the reliability of the network devices close to the top of thehierarchy, we still see failures on those devices resulting in signi"-cant downtimes.
3.1 Data-Center Traffic AnalysisAnalysis of Net$ow and SNMP data from our data centers re-
veals several macroscopic trends. First, the ratio of tra!c volumebetween servers in our data centers to tra!c entering/leaving ourdata centers is currently around : (excluding CDN applications).Second, data-center computation is focused where high speed ac-cess to data on memory or disk is fast and cheap. Although datais distributed across multiple data centers, intense computation andcommunication on data does not straddle data centers due to thecost of long-haul links. &ird, the demand for bandwidth betweenservers inside a data center is growing faster than the demand forbandwidth to external hosts. Fourth, the network is a bottleneckto computation. We frequently see ToR switches whose uplinks areabove utilization.
To uncover the exact nature of tra!c inside a data center, weinstrumented a highly utilized , node cluster in a data centerthat supports data mining on petabytes of data. &e servers aredistributed roughly evenly across ToR switches, which are con-nected hierarchically as shown in Figure .We collected socket-levelevent logs from all machines over two months.
3.2 Flow Distribution AnalysisDistribution of $ow sizes: Figure illustrates the nature of
$ows within the monitored data center. &e $ow size statistics(marked as ‘+’s) show that the majority of $ows are small (a fewKB); most of these small $ows are hellos and meta-data requests tothe distributed "le system. To examine longer $ows, we compute astatistic termed total bytes (marked as ‘o’s) by weighting each $owsize by its number of bytes. Total bytes tells us, for a random byte,the distribution of the $ow size it belongs to. Almost all the bytesin the data center are transported in $ows whose lengths vary fromabout MB to about GB.&e mode at around MB springsfrom the fact that the distributed "le system breaks long "les into-MB size chunks. Importantly, $ows over a few GB are rare.
Source: VL2: A Scalable and Flexible data center network, Greenberg et al, SIGCOMM 20009
99% are mouse flows
But Elephants consume most network bandwidth!
Intl. Green Compu0ng Conf. 2013 6/27/2013 25 Partha Kundu
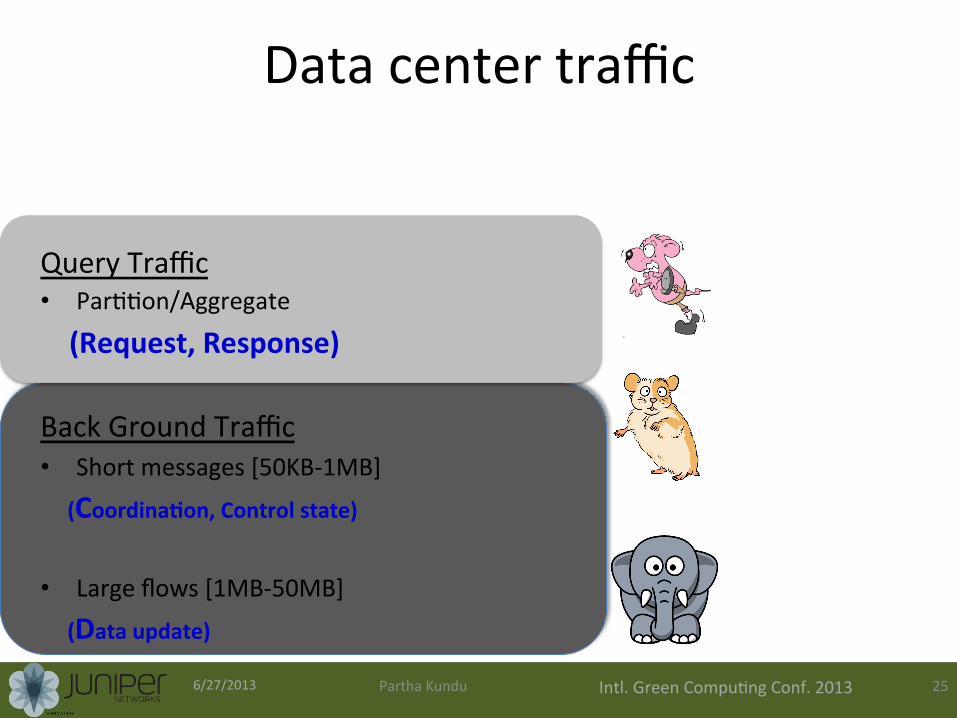
Query Traffic • Par00on/Aggregate
(Request, Response)
Back Ground Traffic • Short messages [50KB-‐1MB]
(Coordina9on, Control state)
• Large flows [1MB-‐50MB]
(Data update)
Data center traffic

Intl. Green Compu0ng Conf. 2013 6/27/2013 26 Partha Kundu
Data center traffic Balancing conflic0ng goals
High Bandwidth
Low Latency
• Par00on/Aggregate
(Query)
• Short messages [50KB-‐1MB]
(Coordina9on, Control state)
• Large flows [1MB-‐50MB]
(Data update)

Intl. Green Compu0ng Conf. 2013 6/27/2013 27 Partha Kundu
TCP Buffer Requirement at switch • Bandwidth-‐delay product rule of thumb: – A single flow needs C×RTT buffers for 100% Throughput.
B Bu
ffer S
ize B = C×RTT
B
B < C×RTT
Buffe
r Size
Throughput loss!
B
Buffe
r Size
B > C×RTT
More latency!

Intl. Green Compu0ng Conf. 2013 6/27/2013 28 Partha Kundu
TCP Buffer Requirement • Bandwidth-‐delay product rule of thumb: – A single flow needs C×RTT buffers for 100% Throughput.
B
Buffe
r Size B = C×RTT
B
B < C×RTT
Buffe
r Size
Throughput loss!
B Bu
ffer S
ize
B > C×RTT
More latency!
To lower the buffering requirements, we must reduce sending rate varia0ons.

Intl. Green Compu0ng Conf. 2013 6/27/2013 29 Partha Kundu
DCTCP*: Algorithm
Switch side: – Mark packets when Queue Length > K.
Sender side: – Maintain running average of frac.on of packets marked (α).
Ø Adap9ve window decreases:
– Note: decrease factor between 1 and 2.
B K Mark Don’t Mark
€
each RTT : F =# of marked ACKsTotal # of ACKs
⇒ α← (1− g)α + gF
€
W ← (1− α2)W
*Data Center TCP (DCTCP), SIGCOMM 2010, New Delhi, India, August 31, 2010.

Intl. Green Compu0ng Conf. 2013 6/27/2013 30 Partha Kundu
DCTCP vs TCP
Setup: Win 7, Broadcom 1Gbps Switch Scenario: 2 long-‐lived flows, K = 30KB
0
100
200
300
400
500
600
700
0
Queue L
ength
(P
ackets
)
Time (seconds)
DCTCP, K=20, 2 flowsTCP, 2 flows
(Kbytes)

Intl. Green Compu0ng Conf. 2013 6/27/2013
TCP InCast Collapse
Source : Nagle et al, The Panasas AcHveScale Storage Cluster – Delivering Scalable High Bandwidth Storage, SC2004
31 Partha Kundu
1. Low latency, shallow buffer network switches 2. “Barrier synch” opera0ons 3. Servers returning small data items
Pre-‐condi0ons

Intl. Green Compu0ng Conf. 2013 6/27/2013 32 Partha Kundu

Intl. Green Compu0ng Conf. 2013 6/27/2013 33 Partha Kundu
New Cluster Based Storage System

Intl. Green Compu0ng Conf. 2013 6/27/2013
Incast Applica0on overfills Buffers
34 Partha Kundu

Intl. Green Compu0ng Conf. 2013 6/27/2013
Solu0on: TCP with µs-‐RTO* *Safe and Effec0ve Fine-‐grained TCP Retransmissions for Datacenter Communica0on, Vasudevan et al, SIGCOMM 2009
• Liwle adverse effect on WAN traffic
35 Partha Kundu

Intl. Green Compu0ng Conf. 2013 6/27/2013
Incast Collapse : an unsolved problem at scale*
*Understanding TCP Incast Throughput Collapse in Datacenter Networks, Griffith et al WREN 2009
Solu0on space is complex: • Network condi0ons can impact RTT • Switch buffer management strategies • Goodput can be unstable with load/num. senders
36 Partha Kundu

Intl. Green Compu0ng Conf. 2013 6/27/2013 37 Partha Kundu
Today’s transport protocols: Deadline agnostic and strive for fairness
Application SLAs
Cascading SLAs SLAs for components at each
level of the hierarchy
Network SLAs Deadlines on communications
between components
User-facing online services
Agg.
Aggregator
Agg. Agg.
Worker
Request Response
Worker Worker Worker
200 ms
100 ms
45 ms
5ms 5ms
4ms 4ms 4ms 4ms
5ms 25ms 35ms 25ms
15ms
30ms 22ms 25ms
Flow Deadlines A flow is useful if and only if it satisfies its deadline
Intl. Green Compu0ng Conf. 2013 6/27/2013 38 Partha Kundu
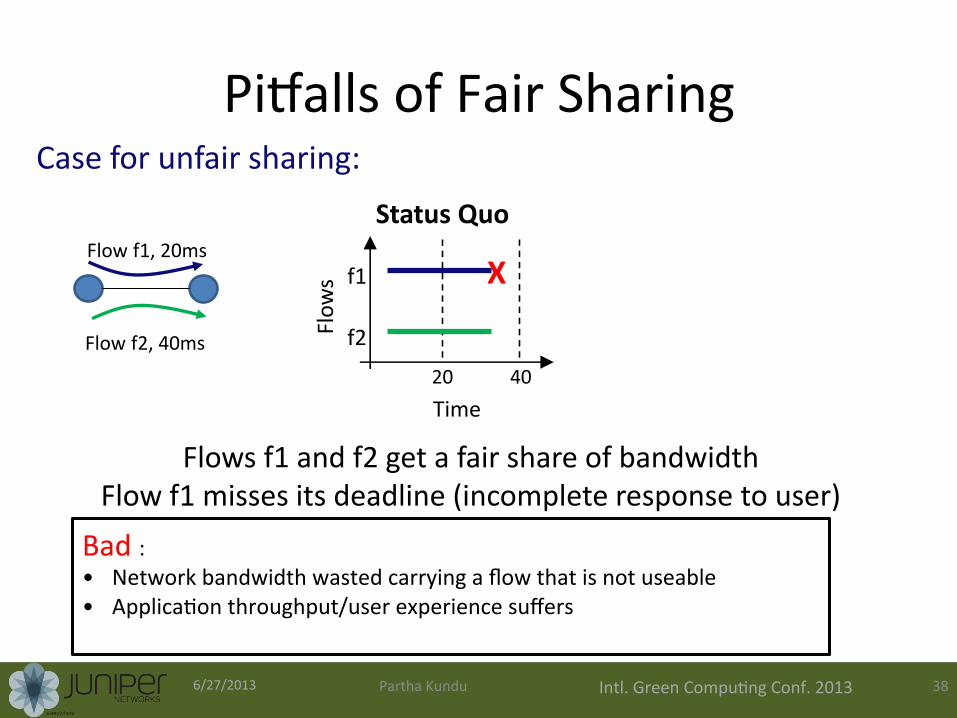
Pizalls of Fair Sharing
Flows get bandwidth in accordance to their deadlines Deadline awareness ensures both flows satisfy deadlines
Limitations of Fair Sharing
Flow f1, 20ms
Flow f2, 40ms
Time
Flow
s f1
f2
20 40
X
Flows f1 and f2 get a fair share of bandwidth Flow f1 misses its deadline (incomplete response to user)
Status Quo
Case for unfair sharing:
Bad : • Network bandwidth wasted carrying a flow that is not useable • Applica0on throughput/user experience suffers

Intl. Green Compu0ng Conf. 2013 6/27/2013 39 Partha Kundu
Flows get bandwidth in accordance to their deadlines Deadline awareness ensures both flows satisfy deadlines
Limitations of Fair Sharing
Flow f1, 20ms
Flow f2, 40ms
Time
Flow
s f1
f2
20 40
X
Status Quo
Case for unfair sharing:
Flow
s f1
f2
20 40 Time
Deadline aware

Intl. Green Compu0ng Conf. 2013 6/27/2013 40 Partha Kundu
Limitations of Fair Sharing
Flow f1, 20ms
Flow f2, 40ms
Time Fl
ows f1
f2
20 40
X
Flow
s f1
f2
20 40 Time
Status Quo Deadline aware
6 flows with 30ms deadline
Flow
s
X
Time 30
X X X X X
Insufficient bandwidth to satisfy all deadlines With fair share, all flows miss the deadline (empty response)
Case for unfair sharing:
Case for flow quenching:

Intl. Green Compu0ng Conf. 2013 6/27/2013 41 Partha Kundu
D3* Overview
s : flow size d : deadline RRQ : Rate Request α : allocated rate
D3 overview
2. 𝐷𝑒𝑠𝑖𝑟𝑒𝑑 𝑟𝑎𝑡𝑒 ∶ 𝑟 =𝑠𝑑
Sender Receiver
1. 𝐴𝑝𝑝𝑙𝑖𝑐𝑎𝑡𝑖𝑜𝑛 𝑒𝑥𝑝𝑜𝑠𝑒𝑠 𝑠, 𝑑
5. Send data at rate 𝑠𝑟
6. One of the packets contains and updated RRQ based on the remaining flow size and deadline
RRQ
RRQ | α1 RRQ | (α1, α2)
4. 𝑆𝑒𝑛𝑑𝑖𝑛𝑔 𝑟𝑎𝑡𝑒 𝑓𝑜𝑟 𝑛𝑒𝑥𝑡 𝑅𝑇𝑇 ∶ sr = min (α1, α2)
3. Routers allocate rates (α) based on traffic load
* Bewer Never than Late, Wilson et al, SIGCOMM 2011

Intl. Green Compu0ng Conf. 2013 6/27/2013 42 Partha Kundu
D3 Router Rate Control Router needs to track:
1. Sum of desired rates (demand) 2. Available Capacity 3. Fair-share (fs)
Three aggregate values (no per-flow state)
Allocations : A = ∑𝑎 Demand : D = ∑𝑟 Number of flows : N =>
Rate allocation
fs = available capacity = C-A
r : desired rate α : allocated rate C : link capacity RRQ : Rate Request
A = A – αt-1
D = D – rt-1 + rt
If available capacity > D: αt = r + fs
A = A + αt
RRQ (r) | αt-1 | rt-1 | (αt)

Intl. Green Compu0ng Conf. 2013 6/27/2013 43 Partha Kundu
D3 with Quenching/Results 3. Flow quenching
Terminate “useless flows” when: — Desired rate exceeds link capacity — Deadline has expired Allows for graceful
degradation of performance

Intl. Green Compu0ng Conf. 2013 6/27/2013 44 Partha Kundu
Network)Layer)Load)Balancers)
• Expected)to)support)singleSpath)assump6on)• Common)approach:)hash)flows)to)paths)– Does)not)consider)flow)size)or)sending)rate))
• Results)in)uneven)load)spreading)– Leads)hotspots)and)increased)queuing)delays)
The'singleEpath'assump:on'restricts'the'ability'to'agilely'balance'load'
12)
Recent)Proposals)
• Reduce)packet)drops)– By)crossSflow)learning)[DCTCP])or)explicit)flow)scheduling)[D3])
– Maintain)the)singleSpath)assump6on)
• Adap6vely)move)traffic)– By)crea6ng)subflows)[MPTCP])or)periodically)remapping)flows)[Hedera])
– Not)sufficiently)agile)to)support)short)flows)
13)

Intl. Green Compu0ng Conf. 2013 6/27/2013
Conclusions
• Data center infrastructure efficiencies are improving
• Energy efficiency among non-‐CPU components is poor
• Parallelism at scale is great – un0l the point where long tail latencies reverse the gains
• Network latencies subject to legacy protocol and transport mechanisms

Intl. Green Compu0ng Conf. 2013 6/27/2013 46 Partha Kundu
Thank you!