power system harmonic mitigation solution for...
TRANSCRIPT
23rd International Conference on Electricity Distribution Lyon, 15-18 June 2015
Paper 0944
CIRED 2015 1/4
POWER SYSTEM HARMONIC MITIGATION SOLUTION FOR 115 KV CUSTOMER OF PEA
Thunpisit POTHINUN Chakphed MADTHARAD Narong SRIYABHAYA Provincial Electricity Authority (PEA) – Thailand [email protected] [email protected] [email protected]
ABSTRACT This paper illustrates a harmonic filter design for 115 kV customer of PEA. This is essential for eliminating and reducing the effects of harmonics in a power system to comply with the regulation of the Kingdom of Thailand. According the regulation, both Total Harmonic Distortion in voltage (THDv) and harmonic current at any individual frequencies shall comply with the limit. Software simulation program, DIgSILENT PowerFactory, is used to model loads, to study variation of the harmonics, to study the impedance versus frequency, and to evaluate the effect of harmonic filter in the system using actual recorded data. The load is induction furnace, 32.24 MW (5.59-32.24 MW) and 0.82 PF (0.68-0.90 PF), connected at 22 kV. The Point of Common Coupling (PCC) to assess the harmonic level is at 115 kV. After the designed harmonic filters are placed, the voltage distortion and harmonic current are dramatically reduced to comply with the regulation.
1. INTRODUCTION The increase of harmonics in the power system threatens the quality of the electricity supplied to the customers. Fundamentally, one needs to control harmonics only when they become a problem or over the regulation. When a problem occurs, the basic options for controlling harmonics are in [1]. This paper illustrates a procedure to design harmonic filters for 32 MW induction furnace. Section 2 presents basic characteristic of harmonic filter. The induction furnace load and single line diagram is presented in section 3. Section 4 shows simulation results of induction furnace load and mitigation solution, section 5 shows the implementation results and conclusion is presented in section 6.
2. HARMONIC FILTER The harmonic shunt filter works by short-circuiting harmonic currents as close to the source of distortion as practical. This keeps the currents out of the supply system and is the most common type of filtering applied because of economics and because it also tends to correct the load power factor as well as remove the harmonic current. The first step to design filter is computer simulation, then hypothetical harmonic filters are placed in the model and the response of the power system to the filter is examined. If unacceptable results are obtained, the
location and values of the filter parameters are changed until the results are satisfactory.
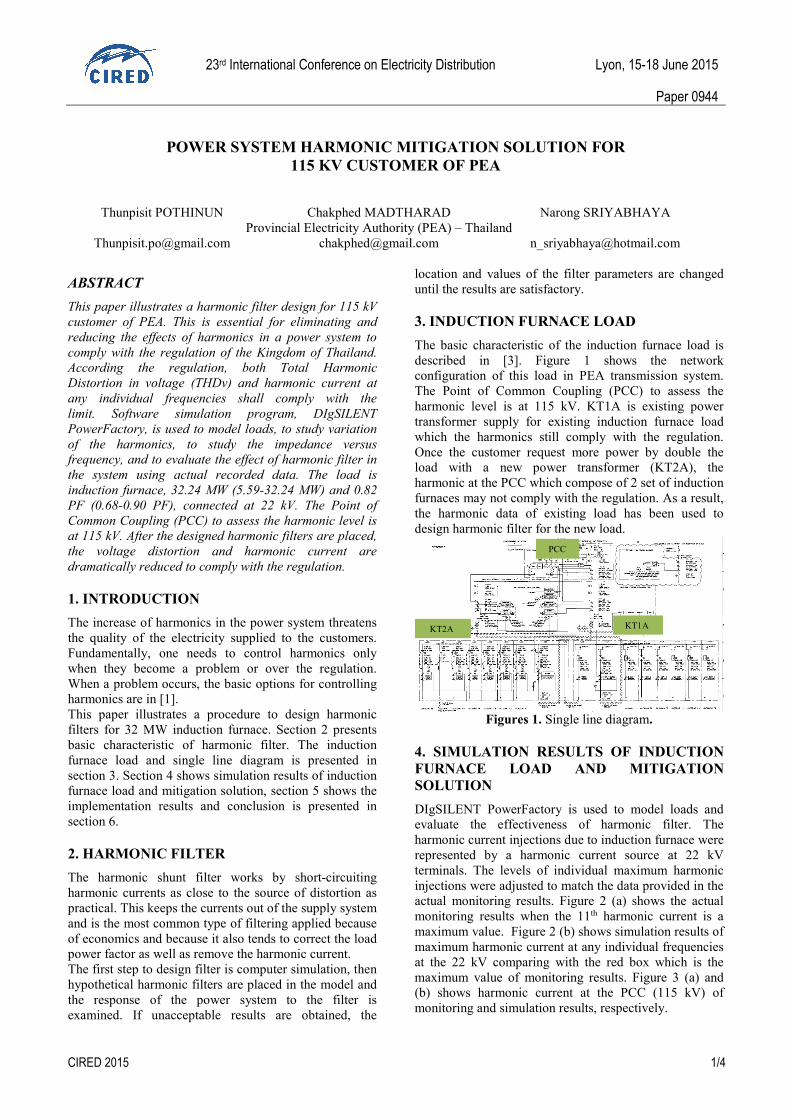
3. INDUCTION FURNACE LOAD The basic characteristic of the induction furnace load is described in [3]. Figure 1 shows the network configuration of this load in PEA transmission system. The Point of Common Coupling (PCC) to assess the harmonic level is at 115 kV. KT1A is existing power transformer supply for existing induction furnace load which the harmonics still comply with the regulation. Once the customer request more power by double the load with a new power transformer (KT2A), the harmonic at the PCC which compose of 2 set of induction furnaces may not comply with the regulation. As a result, the harmonic data of existing load has been used to design harmonic filter for the new load.
Figures 1. Single line diagram.
4. SIMULATION RESULTS OF INDUCTION FURNACE LOAD AND MITIGATION SOLUTION DIgSILENT PowerFactory is used to model loads and evaluate the effectiveness of harmonic filter. The harmonic current injections due to induction furnace were represented by a harmonic current source at 22 kV terminals. The levels of individual maximum harmonic injections were adjusted to match the data provided in the actual monitoring results. Figure 2 (a) shows the actual monitoring results when the 11th harmonic current is a maximum value. Figure 2 (b) shows simulation results of maximum harmonic current at any individual frequencies at the 22 kV comparing with the red box which is the maximum value of monitoring results. Figure 3 (a) and (b) shows harmonic current at the PCC (115 kV) of monitoring and simulation results, respectively.
KT2A
PCC
KT1A

23rd International Conference on Electricity Distribution Lyon, 15-18 June 2015
Paper 0944
CIRED 2015 2/4
(a) Monitoring results at 22 kV.
(b) Simulation results at 22 kV. Figures 2. Monitoring and simulation results of harmonic
current spectrum.
1) Load Parameter Load: 32.24 MW (max), 0.82 PF at 22 kV, 1.17% THDv at PCC (THDv was complied with the regulation) Constrained: 11th and 13th harmonic current shall be less than 3 A at the PCC and PF higher than 0.92 without any overvoltage problem.
(a) Monitoring results at 115 kV.
(b) Simulation results at 115 kV. Figures 3. Monitoring and simulation results of harmonic
current spectrum.
2) Fundamental Frequency Reactive Power Compensation The major criteria to design harmonic filter is to select a suitable capacitor size that results in a reasonable PF at fundamental frequency [4]. The reactive power, 푄푐표푚, to improve the PF of 32.24 MW load from 0.82 to be 0.92 can be given by (1) while the other parameters can be calculated by [5]. 푄푐표푚 = 32.24 × [tan cos 0.82 − tancos 0.92] = 8.8푀푉퐴푟 (1) The number of filter branches can be selected based on the percentage of the harmonic components of voltage and current. It may also, be necessary to place filters elsewhere in the system to reduce resonance problems (series or parallel), if any.
Figures 4. Frequency scans at 22 kV bus. Figure 4 shows frequency scans at 22 kV bus, the black line shows frequency scan in case of without harmonic filter. While the blue dotted line represents frequency scan in case of using harmonic high pass filter, 7th and 11th. The blue line shows parallel resonance at harmonic order 5th, harmonic would be magnified about 4 times of normal value. As a result, harmonic high pass filter order 5th should be added to shift the resonance frequency and lower the impedance at resonance frequency (red line). The design of the filter bank may result in an iterative process to optimize the capacitor bank size and filter the unwanted harmonics [6]. DIgSILENT PowerFactory modelling of harmonic filter has been shown in Figure 5.
Figure 5. Modelling of harmonic filters 5th, 7th, and 11th.
5th Filter 7th Filter 11th Filter
0
5
10
15
20
25
30
0 2 4 6 8 10 12 14 16 18 20
HFand LOAD NAWALOHA - 3/5/2014 23:49:59.81001-Cycle FFT Ic From 0.06626 to 0.08619 s
PEA PQ PQView (R)
RMS 691.9Fund 690.9DC 0.4504Max 982Min -986.7CF 1.426FF 1.107THD Fund 5.42%THD RMS 5.41%HRMS 37.46Phase Jump -0.3262°
Cur
rent
(A)
Frequency (50 Hz Harmonic)
20.0016.0012.008.004.000.00 [-]
30.000
24.100
18.200
12.300
6.4000
0.5000
Nawa 22 kV: Zh without harmonic filterNawa 22 kV: Zh with 7th and 11th harmonic filterNawa 22 kV: Zh with 5th, 7th and 11th harmonic filter
5.080 26.925 Ohm
5.048 6.282 Ohm
6.928 3.839 Ohm
Freq Scan
Date: 3/6/2014
Annex: /5
DIg
SILE
NT
0
1
2
3
4
5
6
7
0 2 4 6 8 10 12 14 16 18 20
NAWALOHA - 3/5/2014 23:49:59.81021-Cycle FFT Ic From 0.04323 to 0.06313 s
PEA PQ PQView (R)
RMS 165Fund 164.7DC 0.2259Max 241.9Min -240.9CF 1.466FF 1.114THD Fund 5.80%THD RMS 5.80%HRMS 9.561Phase Jump 0.8072°
Curren
t (A
)
Frequency (50 Hz Harmonic)
23rd International Conference on Electricity Distribution Lyon, 15-18 June 2015
Paper 0944
CIRED 2015 3/4
-250
-200
-150
-100
-50
0
50
100
150
200
250
0.02 0.03 0.04 0.05 0.06
NAWALOHA - 3/5/2014 10:49:59.8099
PEA PQ PQView (R)
Curr
ent (
A)
Time (s)
Ia Ib Ic
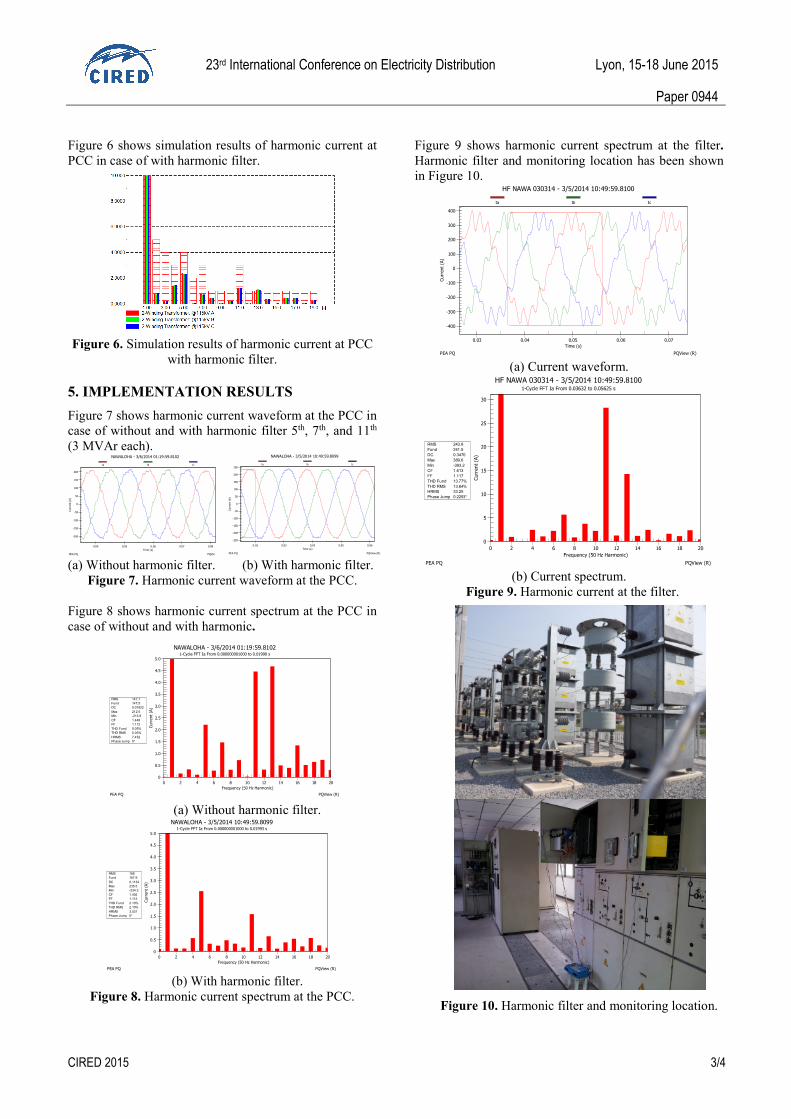
Figure 6 shows simulation results of harmonic current at PCC in case of with harmonic filter.
Figure 6. Simulation results of harmonic current at PCC with harmonic filter.
5. IMPLEMENTATION RESULTS Figure 7 shows harmonic current waveform at the PCC in case of without and with harmonic filter 5th, 7th, and 11th (3 MVAr each).
(a) Without harmonic filter. (b) With harmonic filter.
Figure 7. Harmonic current waveform at the PCC. Figure 8 shows harmonic current spectrum at the PCC in case of without and with harmonic.
(a) Without harmonic filter.
(b) With harmonic filter.
Figure 8. Harmonic current spectrum at the PCC.
Figure 9 shows harmonic current spectrum at the filter. Harmonic filter and monitoring location has been shown in Figure 10.
(a) Current waveform.
(b) Current spectrum.
Figure 9. Harmonic current at the filter.
Figure 10. Harmonic filter and monitoring location.
-200
-150
-100
-50
0
50
100
150
200
0.04 0.05 0.06 0.07 0.08
NAWALOHA - 3/6/2014 01:19:59.8102
PEA PQ PQView (R)
Curr
ent
(A)
Time (s)
Ia Ib Ic
0
0.5
1.0
1.5
2.0
2.5
3.0
3.5
4.0
4.5
5.0
0 2 4 6 8 10 12 14 16 18 20
NAWALOHA - 3/5/2014 10:49:59.80991-Cycle FFT Ia From 0.000000001000 to 0.01993 s
PEA PQ PQView (R)
RMS 168Fund 167.9DC 0.1134Max 235.5Min -234.3CF 1.402FF 1.112THD Fund 2.10%THD RMS 2.10%HRMS 3.531Phase Jump 0°
Curr
ent
(A)
Frequency (50 Hz Harmonic)
-400
-300
-200
-100
0
100
200
300
400
0.03 0.04 0.05 0.06 0.07
HF NAWA 030314 - 3/5/2014 10:49:59.8100
PEA PQ PQView (R)
Curr
ent
(A)
Time (s)
Ia Ib Ic
0
5
10
15
20
25
30
0 2 4 6 8 10 12 14 16 18 20
HF NAWA 030314 - 3/5/2014 10:49:59.81001-Cycle FFT Ia From 0.03632 to 0.05625 s
PEA PQ PQView (R)
RMS 243.8Fund 241.5DC 0.3470Max 389.6Min -393.2CF 1.613FF 1.117THD Fund 13.77%THD RMS 13.64%HRMS 33.25Phase Jump 0.2293°
Curr
ent
(A)
Frequency (50 Hz Harmonic)
0
0.5
1.0
1.5
2.0
2.5
3.0
3.5
4.0
4.5
5.0
0 2 4 6 8 10 12 14 16 18 20
NAWALOHA - 3/6/2014 01:19:59.81021-Cycle FFT Ia From 0.000000001000 to 0.01990 s
PEA PQ PQView (R)
RMS 147.7Fund 147.5DC 0.01822Max 212.5Min -213.9CF 1.448FF 1.112THD Fund 5.05%THD RMS 5.05%HRMS 7.452Phase Jump 0°
Curr
ent
(A)
Frequency (50 Hz Harmonic)

23rd International Conference on Electricity Distribution Lyon, 15-18 June 2015
Paper 0944
CIRED 2015 4/4
6. CONCLUSIONS The harmonic filter design for induction furnace load using actual recorded data has been presented. After the designed harmonic filters are placed, the voltage distortion and harmonic current are dramatically reduced to comply with the regulation.
REFERENCES
[1] R.C. Dugan, M. McGranaghan, S. Santoso, and H.W. Beaty, 2003, Electrical Power System Quality, Second Edition, McGraw-Hill, 251-267. [2] J. C. Das, Jan/Feb 2004, "Passive Filters—Potentialities and Limitations", IEEE Trans. Industry Applications, vol. 40, 232-241. [3] R.C. Dugan, Sr. Conrad, and L.E., Sr., Apr. 1999, "Impact of Induction Furnace Interharmonics on Distribution Systems", The IEEE Transmission and Distribution Conference, New Orleans, LA, USA [4] E.B. Makram, E.V. Subramaniam,, A.A. Girgis, and R. Catoe, Nov. 1993, "Harmonic Filter Design Using Actual Recorded Data", IEEE Trans. Industrial Application, vol. 29, 1176-1183. [5] C. Matharad and M. McGranaghan., October 2008, "Harmonics Filter Design for Induction Furnance Load in 22 kV Distribution System", Conference of Electricity Power Supply Industry (CEPSI2008), Macua [6] D. Andrews, M.T. Bishop, and J.F. Witte, May/June 1996, "Harmonic Measurements, Analysis, and Power Factor Correction in a Modern Steel Manufacturing Facility", IEEE Trans. Industrial Application, vol. 32, 617-624.