power quality ppt.ppt
DESCRIPTION
OBJECTIVES:Distribution Reform ,Upgrades and Management. To acquire the details of Quality of Power Supplied.TO study proactive network planning. To study the Energy Accounting and Data logging process. To know the status of the substation equipment such as Power transformer, On load tap changer (OLTC), Capacitor banks etc. To know the substation losses . Means adopted for the loss reduction.TRANSCRIPT

PROJECT SEMINAR ONPROJECT SEMINAR ON”POWER QUALITY BASED PERFORMANCE
EVALUATION OF DISTRIBUTION NETWORK”
Under the Guidance of: Presented By: Prof. A. N. Kadu G. B. DABRE Department of Electrical Engg. M.TECH. – 3rd sem Y.C.C.E., Nagpur. ROLL NO. 17
1
Presentation Outline
• Introduction• Objective• Solution Methodologies• Collection of data from Substations.• Analysis of comparative study of distribution• Conclusion• References

Introduction
• The Distribution System were designed to perform one function- distribute electrical energy to end users.
• The Distribution Network absolutely demands high quality and high reliability for power supply.
• The Distribution system performance by minimizing both technical and non technical energy losses to improve the efficiency of supply.

• Distribution Reform ,Upgrades and Management. •To acquire the details of Quality of Power Supplied.
•TO study proactive network planning.
• To study the Energy Accounting and Data logging process. • To know the status of the substation equipment such as Power transformer, On load tap changer (OLTC), Capacitor banks etc. To know the substation losses .
• Means adopted for the loss reduction.
OBJECTIVE OF THE STUDY

1. EHV
2.CAPTIVE
3. IMPORT FROM
NEIGHBOURINGCIRCLE/
DIVISION
DISTRIBUTION SYSTEM
ENERGYHANDLINGLOSS (8%)
METERED CONSUMERS
EXPORT TO
NEIGHBOURINGCIRCLE/
DIVISION
ENERGY FLOW – DISTRIBUTION SYSTEM

METHODOLOGY
PHASE I 1) Analysis Literature Survey 2) Study of the power supply is feed 132KV & 33KV
Substation to the consumers by 11KV feeders.3) Identification of Distribution line parameters.4) 33KV Substations are feed by the Radial ring main feeders
from 132KV Receiving station.5) Study of the power supply is feed 132KV Substation to the
consumers by 11KV feeders.6) The information on reliability indices is consolidated.7) To work out losses at Substation level.

METHODOLOGY (continued..)
PHASE II8)Performance of the Capacitor Banks on the 11KV
feeders are combination of switched capacitors and automatic voltage regulators.
9)Analysis of HVDS & Distribution line fault . 10) Analysis of comparative study of Distribution by
using 33KV/11KV and 132KV/11KV feeders.

NEED FOR QUALITY POWER SUPPLY
•Maintaining Quality of supply depends upon power utilities as well as consumers.
•The voltage sensitive and frequency sensitive loads need quality power supply.

RELIABILITY INDICES MONITORING SYSTEM
• SYSTEM AVERAGE INTERRUPTION FREQUENCY INDEX (SAIFI)
SAIFI=SUM(Ni/Nt)where, i= interruption event
Ri=restoration timeNi=No. of consumers.Nt= Total no. of consumers.
• SYSTEM AVERAGE INTERRUPTION DURATION INDEX (SAIDI)SAIDI=SUM(RiNi/Nt)
• CUSTOMER AVEARGE INTERUPTION DURATION INDEXCAIDI=SAIDI/SAIFI

GENERAL VIEW OF A 33 KV SUBSTATION

HVDS HARDWARE BLOCK DIAGRAM

DESIGN SIMULINK MODEL

SIMULINK MODEL

INFORMATION COLLECTED FROM132KV & 33 KV SUBSTATION LOG
SHEET FOR 24 HOURS.
• KWH READING• THE LOAD ON FEEDER IN AMPERES• BUS VOLTAGE AND FEEDER VOLTAGE• DETAILS OF THE CAPACITOR BANK IN SERVICE• TRANSFORMER TAP POSITION• STATION BATTERY PARAMETERS • INTERRUPTION ON THE FEEDERS.
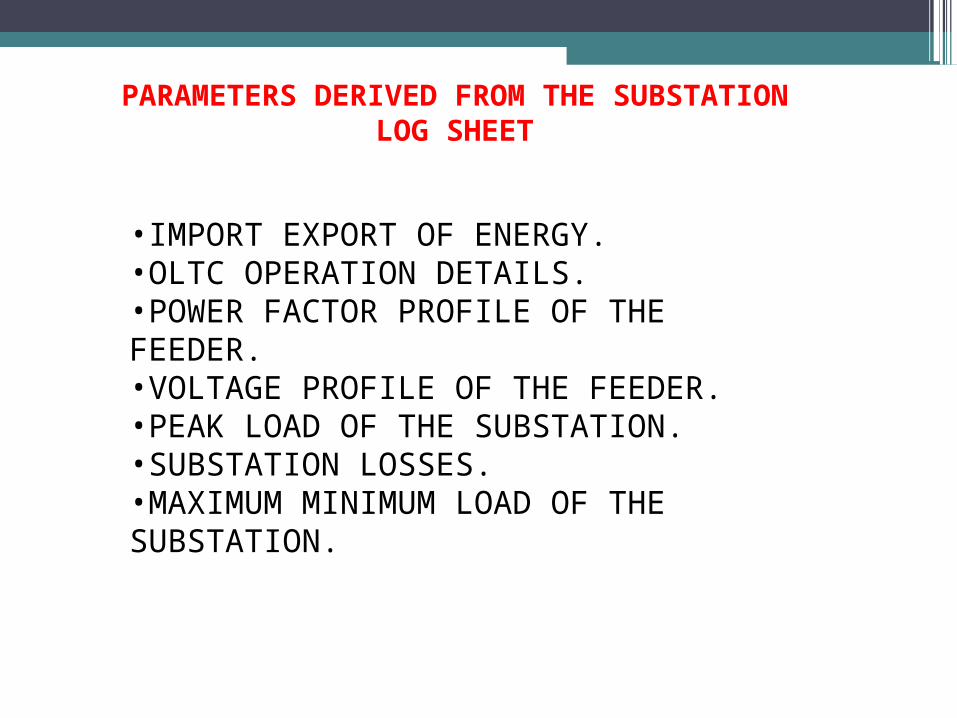
PARAMETERS DERIVED FROM THE SUBSTATION LOG SHEET
•IMPORT EXPORT OF ENERGY.•OLTC OPERATION DETAILS.•POWER FACTOR PROFILE OF THE FEEDER.•VOLTAGE PROFILE OF THE FEEDER.•PEAK LOAD OF THE SUBSTATION.•SUBSTATION LOSSES.•MAXIMUM MINIMUM LOAD OF THE SUBSTATION.
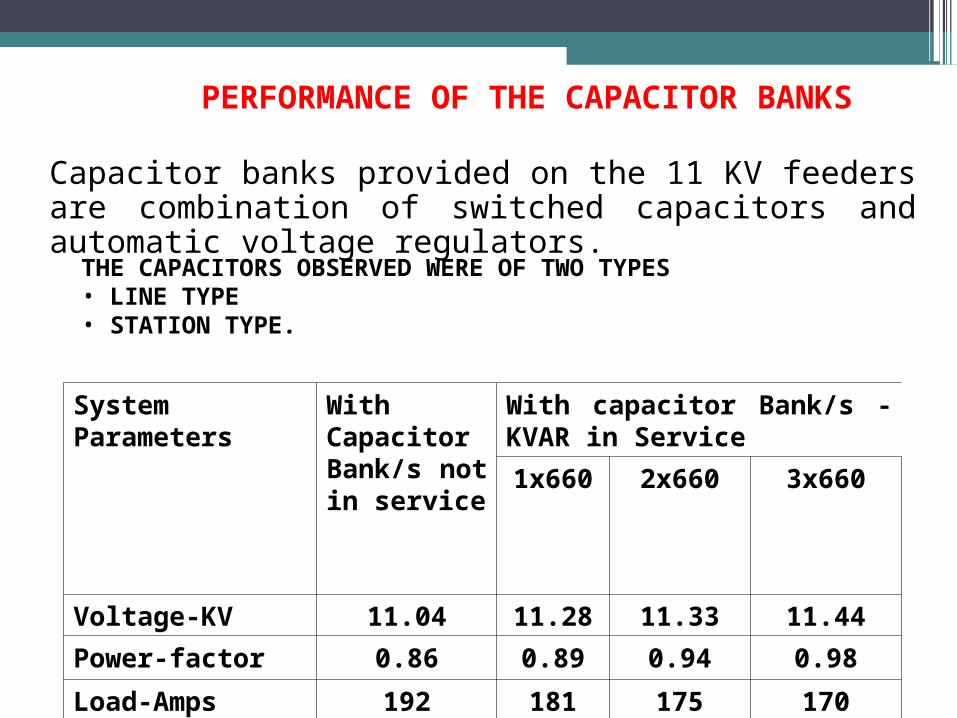
System Parameters
With Capacitor Bank/s not in service
With capacitor Bank/s -KVAR in Service
1x660 2x660 3x660
Voltage-KV 11.04 11.28 11.33 11.44
Power-factor 0.86 0.89 0.94 0.98
Load-Amps 192 181 175 170
PERFORMANCE OF THE CAPACITOR BANKS
THE CAPACITORS OBSERVED WERE OF TWO TYPES• LINE TYPE• STATION TYPE.
Capacitor banks provided on the 11 KV feeders are combination of switched capacitors and automatic voltage regulators.

FACTORS CONTRIBUTING LOSSES AND INFERIOR POWER QUALITY
• Lengthy Distribution • Inadequate Size of Conductors • Over-rated Distribution Transformers and hence their Under-
Utilisation • Bad Workmanship Resulting in Poor Contacts at Joints and
Connections • Pilferage of Energy
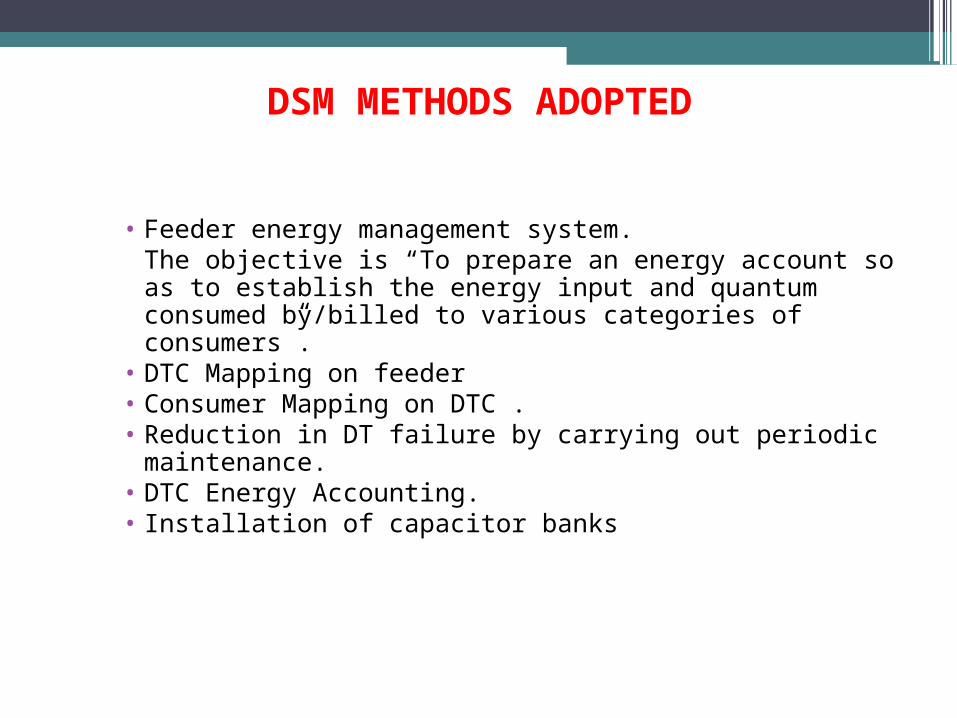
DSM METHODS ADOPTED
• Feeder energy management system.The objective is “To prepare an energy account so as to establish the energy input and quantum consumed by/billed to various categories of consumers”.
• DTC Mapping on feeder• Consumer Mapping on DTC .• Reduction in DT failure by carrying out periodic maintenance. • DTC Energy Accounting.• Installation of capacitor banks
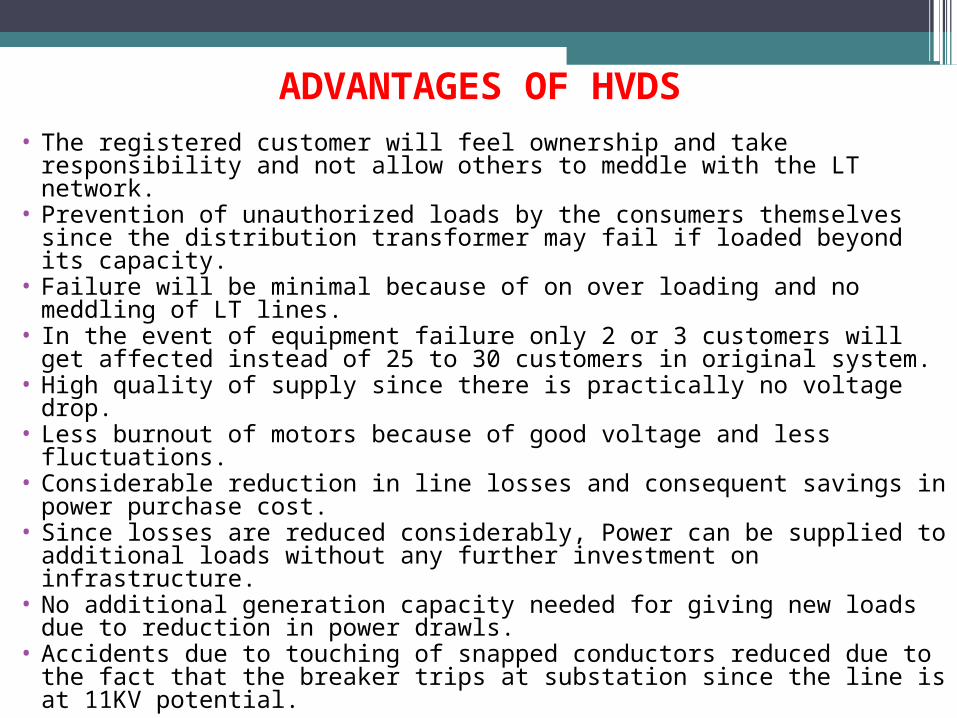
ADVANTAGES OF HVDS
• The registered customer will feel ownership and take responsibility and not allow others to meddle with the LT network.
• Prevention of unauthorized loads by the consumers themselves since the distribution transformer may fail if loaded beyond its capacity.
• Failure will be minimal because of on over loading and no meddling of LT lines.
• In the event of equipment failure only 2 or 3 customers will get affected instead of 25 to 30 customers in original system.
• High quality of supply since there is practically no voltage drop.• Less burnout of motors because of good voltage and less fluctuations.• Considerable reduction in line losses and consequent savings in power
purchase cost.• Since losses are reduced considerably, Power can be supplied to additional
loads without any further investment on infrastructure.• No additional generation capacity needed for giving new loads due to
reduction in power drawls. • Accidents due to touching of snapped conductors reduced due to the fact
that the breaker trips at substation since the line is at 11KV potential.

Other Distribution Loss reduction techniques
• ABC• STATIC ENERGY METERS • PREPAID METERS• SCADA• INSPECTION OF FEEDER BY IR TECHNOLOGY.• HARMONIC STUDY OF THE NETWORK• INTRODUCTION OF AVR• INTRODUCTION OF AMR

CAUSES FOR ENERGY LOSSES DETECTED BY IR METHOD
• ELECTRICALLY INDUCED HEATING.• LOOSE CONNECTION• CORRODED CONTACTS.• LOSS OF INSULATING PROPERTY BY THE
MATERIALS ELECTRICAL AND OR THERMAL.• OXIDATION OF CONTACTS.• INCIEPIENT FAULT IN THE EQUIPMENT
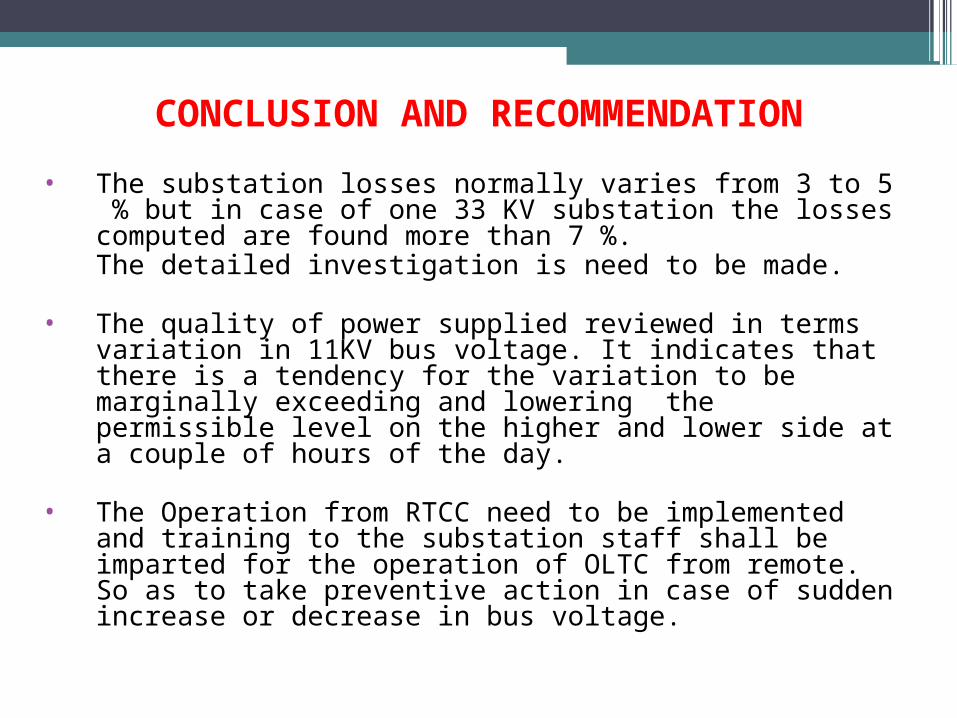
CONCLUSION AND RECOMMENDATION
• The substation losses normally varies from 3 to 5 % but in case of one 33 KV substation the losses computed are found more than 7 %. The detailed investigation is need to be made.
• The quality of power supplied reviewed in terms variation in 11KV bus voltage. It indicates that there is a tendency for the variation to be marginally exceeding and lowering the permissible level on the higher and lower side at a couple of hours of the day.
• The Operation from RTCC need to be implemented and training to the substation staff shall be imparted for the operation of OLTC from remote. So as to take preventive action in case of sudden increase or decrease in bus voltage.
References
• [1] P.E Sutherland ,Sr .Member IEEE ,F. R . Goodman and ,T .A .Short "Feeder and Network Evolution for the Distribution System of the Future", International journal of Engg science and Technology,0-7803-9193-4/06/$20.00 (c) 2006 IEEE.
• [2] J. H.Choi Associate Member, IEEE, C.H .Park, W.K Chae ,S.I. Jang, K .H. Kim.,J.K.Park "An improved investent priority decision method for the electrical facilities considering reliability of distribution network". IEEE 0-7803-9156-X/05/$20.00(C) 2005.
• [3] E.Vidya Sagar,P.V.N.Prasad"Reliability Evalution of Automated Radial Distribution System", 978-1-4244-5721-2/10/$26.00(C)2010 .IEEE.
• [4] Kyle Anderson and Amit Narayan"Simulating Integrated Volt/Var Control and Distributed Demand Response Using GridSpice"2011, IEEE, First international workshop on Smart Grid Modeling and Simulation.978-1-4673-0195-4/11(C)2011 IEEE.

References (continued..)
• [5] P Ravi Babu ,Sushma B. Ashwin Kumar B ‘‘HVDS approach for reducing the Technical and Non-technical losses to enhance the Electrical Distribution System Performence”. 978-1-4673-0934-9/12/$20.00(C)2012 IEEE Conference.
• [6] "Operation and control of Electrical Distribution System with Extra Voltage to minimize the Losses”,2013 International Conferrence on Power,Energy and Control(ICPEC) 978-1-4673-6030-2/13/$31.00 (c)2013 IEEE .
• [7] A.S.PABLA, "Electric Power Distribution", TMH pvt. Ltd., Sixth Edition , Distribution of Power. page no 4 to 23.
• [8] Nagpur Urban Circle Data of 132KV Substations & 33KV Substation OF MSETCL & MSEDCL datasheets.

THANK YOU.