power measurements and basic electrical diagnostic tests basi… · diagnostic testing - overall...
TRANSCRIPT

Power Measurements and
Basic Electrical Diagnostic Tests

Instrument Basics
• Burden
• VA
• Sources – V and I
• Meters – V and I
• KVL and KCL
• Kelvin Connection

KVL and KCL

Kelvin Connection
• 4-Wire Technique
• Exclude the resistance from the measurement circuit
leads and any contact resistance at the connection
points of these leads
• Voltage sense leads (P3 and P4) "inside" the current
leads (P1 and P2)

Test Properties
1. Overall PF/CAP
2. Bushing PF/CAP (C1, C2, EC)
3. Exciting Current (Phase A, B, C)
4. Surge Arresters
5. Insulating Fluids (Main Tank, LTC)
6. Turns Ratio (H-X, H-Y, H-T, X-Y, X-T)
7. Leakage Reactance (3 Equiv, Per )
8. Insulation Resistance
9. DC Winding Resistance (H, X, Y)

Topics of Discussion
1. Diagnostic Test Methods
2. Transformer Test Protocol
3. Transformer Test Plan
4. Analyzing the Results

Diagnostic Testing - OVERALL
• DGA
• Oil Screen
• Power Factor / Capacitance
• Exciting Current
• Transformer Turns Ratio
• Leakage Reactance
• DC Winding Resistance
• SFRA (Sweep Frequency Response Analysis) FRAnalyzer
• DFR (Dielectric Frequency Response) DIRANA
• Thermal Imaging FLIR
• Insulation Resistance MEGGER
• Partial Discharge MPD PDL DAYCORE

Transformer Tests
Dielectric Thermal Mechanical
DGA DGA SFRA
Oil Screen Oil Screen Leakage Reactance
PF/TD CAP IR PF/TD CAP
Exciting Ima DC Winding RES Exciting Ima
Turns Ratio Tests DC Winding RES
DFR
Insulation Resistance
Partial Discharge
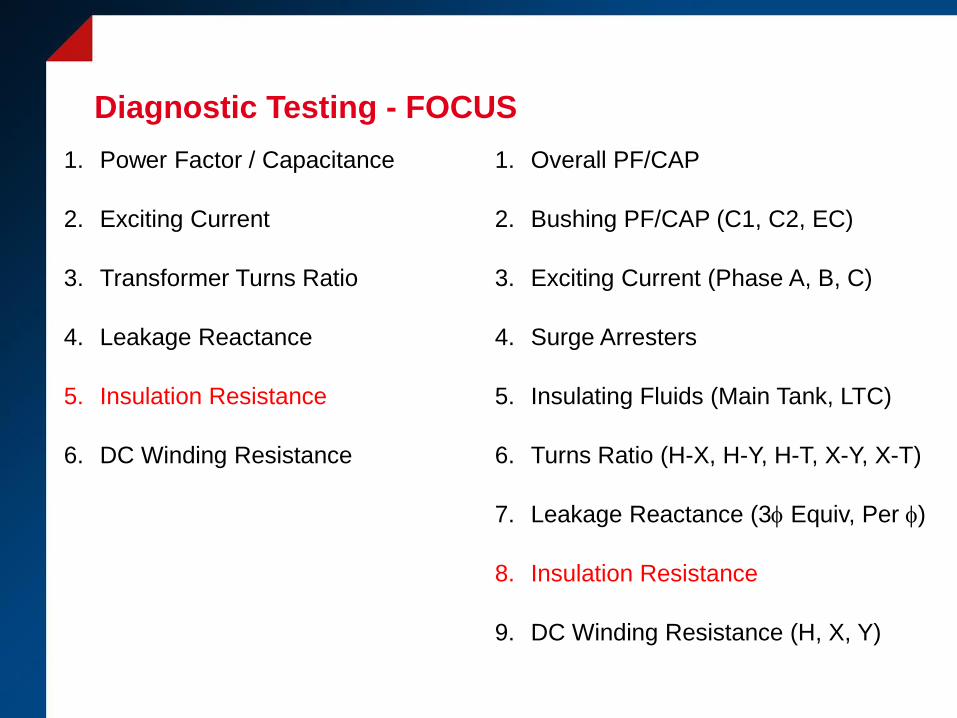
Diagnostic Testing - FOCUS
1. Power Factor / Capacitance
2. Exciting Current
3. Transformer Turns Ratio
4. Leakage Reactance
5. Insulation Resistance
6. DC Winding Resistance
1. Overall PF/CAP
2. Bushing PF/CAP (C1, C2, EC)
3. Exciting Current (Phase A, B, C)
4. Surge Arresters
5. Insulating Fluids (Main Tank, LTC)
6. Turns Ratio (H-X, H-Y, H-T, X-Y, X-T)
7. Leakage Reactance (3 Equiv, Per )
8. Insulation Resistance
9. DC Winding Resistance (H, X, Y)

Power Factor Tests
1. Overall PF/CAP
2. Bushing PF/CAP (C1, C2, EC)
3. Surge Arresters
4. Insulating Fluids (Main Tank, LTC)
Dependent on Transformer Type
• 2-Winding XFMR
• 3-Winding XFMR
• Autotransformers
• Will cause variances in test plans from protocol.

Overall PF/CAP
Type Main Insulation Bushings Surge
Arresters
Insulation
Fluids
2-Winding CH, CL, CHL Up to 8
C1, C2, EC
Up to 6 Stacks Main Tank
Tap Changer
3-Winding CH, CL, CT
CHL, CHT, CLT
Up to 12
C1, C2, EC
Up to 9 Stacks Main Tank
Tap Changer
Auto w/Tert CAuto, CT, CAutoT Up to 10
C1, C2, EC
Up to 9 Stacks Main Tank
Tap Changer
Auto wo/Tert CAuto Up to 7
C1, C2, EC
Up to 6 Stacks Main Tank
Tap Changer

Power Factor / Capacitance Measurement
R CV
IR IC
ITOT
V
ITOT
IC
IR
Insulation can be modeled through:
• Capacitance (Physical Geometry)
• Resistance (Losses)
Losses can be categorized as:
• Conductive
• Polarization (60 Hz Range)
Power Factor measures bulk degradation:
• Moisture
• Aging
• Contamination
Power Factor
• 0.00% - 100%
• cos φ = IR/ITOT x 100%

Insulation Losses
Loss Types:
• Conductive Losses: Electrons and Ions
• Polarization Losses: Electrons, Molecular, Interfacial Polarization
• Partial Discharge PD: Locally Discharge
Loss Dependences:
• Aging
• Moisture
• Contamination
• Temperature
• Insulation Geometry
• Electrical Field Strength (PD)

Power Factor / Capacitance
• “Applied Test” at Rated Frequency (60 Hz)
• Measurements Normalized to 20°C.
• Test voltages for a typical field test set range from below 100 V to as high as 12 kV. (IEEE Std. 62)
• 10 kV is Normally Applied
a) 2000 VA
b) 80,000 pF
• Data should be analyzed by:
a) Limits
b) Trending
c) Nameplate

Power Factor vs. Capacitance
Power Factor
• Aging
• Moisture
• Contamination
Capacitance
• Change in Dielectric Constant (Aging and Contamination)
Air(Vacuum) : 1.0Oil: 2.2Porcelain: 5.0 – 7.0
• Physical and Mechanical Changes (Movement).

2-Winding XFMR

3-Winding XFMR

Autotransformers WITH & WITHOUT Tertiary
WITH WITHOUT

Two-Winding Transformer Model
• Windings are short-circuited to remove unwanted inductance
• CH, CL and CHL insulation systems
• CH includes H-C1
• CL includes X-C1

GST Measurement
• Both CH and CHL are measured together

GST GUARD Measurement - CH
• CH is isolated by use of the GSTg measurement circuit

UST Measurement - CHL
• CHL is isolated by use of the UST measurement circuit

Overall Test Data
2-WINDING TRANSFORMER – OVERALL
Measurement Type Ref@10 kV
Test # Energize Ground Guard UST Test kV I mA Cap pF
Watt
Loss
PF [%]
Measured
PF [%]
Corrected
Correction
Factor Mode
Insulation
Condition
ICH+ICHL H (prim) L (sec) 10.013 33.241 8814.88 0.746 1.00 GST
ICH H (prim) L (sec) 10.010 7.889 2089.50 0.217 0.28 0.28 1.00 GST gA PASS
ICHL H (prim) L (sec) 10.013 25.355 6725.82 0.526 0.21 0.21 1.00 UST A PASS
Calculated ICHL 25.353 6725.38 0.529 0.21 0.21 1.00 PASS
ICH-C1 = ICH minus H (prim) bushings; HV C1 ONLY 5.206 1377.91 0.156 0.30 0.30 1.00 PASS
ICL+ICHL L (sec) H (prim) 7.500 94.449 25051.64 2.375 1.00 GST
ICL L (sec) H (prim) 7.501 69.096 18325.39 1.864 0.27 0.27 1.00 GST gA PASS
ICHL L (sec) H (prim) 7.500 25.356 6725.70 0.519 0.20 0.20 1.00 UST A PASS
Calculated ICHL 25.353 6726.25 0.511 0.27 0.27 1.00 PASS
ICL-C1 = ICL minus L (sec) bushings; LV C1 ONLY 58.678 15562.15 1.619 0.37 0.37 1.00 PASS

Transformer Test Results

Transformer Test Results
Notice severe
exponential
increase!

Bushing Taps
©
OMI

Field Tests
Condenser Bushing with
Potential Tap
Condensers Bushing with
Test TapNon Condenser
Visual Inspection Visual Inspection Visual Inspection
C1 Power Factor (60 Hz) C1 Power Factor (60 Hz) Energize Collar Test
C1 Capacitance (60 Hz) C1 Capacitance (60 Hz) Infrared Test
C2 Power Factor (2.5 kV) C2 Power Factor (0.5 kV)
C2 Capacitance (2.5 kV) C2 Capacitance (0.5kV)
Advance Power Factor
Measurements
Advance Power Factor
Measurements
Power Factor Tip Up Test Power Factor Tip Up Test
Infrared Test Infrared Test
The following test are electrical field tests performed with portable
test equipment to determine bushing suitability for service.

• Bushing H1-C1 UST
• All Terminals Remain Shorted
Power Factor / Capacitance - BUSHING C1

Bushing C1 Test Data
Bushings - NAMEPLATE
Bushing Manufact.Model/
TypeYear
Serial
Number
Catalog
Number
Drawing
Number
BIL
kV
kV
Rating
A
Rating
C1
PF[%]
C1
Cap (pF)
C2
PF[%]
C2
Cap (pF)H1 ABB O+C 1993 350 44.00 400 0.35 238
H2 ABB O+C 1993 350 44.00 400 0.26 240
H3 ABB O+C 1993 350 44.00 400 0.32 239
H0
X1 ABB O+C 1993 150 25.00 2000 0.33 695
X2 ABB O+C 1993 150 25.00 2000 0.30 692
X3 ABB O+C 1993 150 25.00 2000 0.31 699
X0 ABB O+C 1993 150 25.00 2000 0.29 693
Bushings - C1
Measurement Type Ref@10 kV
Bushing Energize Ground Guard UST Test kV I mA Cap pFWatt
Loss
PF [%]
Measured
PF [%]
Corrected
Correction
FactorMode
Insulation
ConditionH1 Conductor - - Tap 10.022 0.891 236.25 0.020 0.22 0.22 1.00 UST A PASS
H2 Conductor - - Tap 10.014 0.896 237.67 0.021 0.23 0.23 1.00 UST A PASS
H3 Conductor - - Tap 10.022 0.896 237.68 0.021 0.24 0.24 1.00 UST A PASS
H0 Conductor - - Tap n/a 0.000 0.00 0.000 n/a n/a 1.00 UST A
X1 Conductor - - Tap 7.505 2.617 694.15 0.062 0.24 0.24 1.00 UST A PASS
X2 Conductor - - Tap 7.506 2.560 679.08 0.058 0.23 0.23 1.00 UST A PASS
X3 Conductor - - Tap 7.506 2.631 697.78 0.061 0.23 0.23 1.00 UST A PASS
X0 Conductor - - Tap 7.505 2.610 692.23 0.063 0.24 0.24 1.00 UST A PASS

Bushing Standard Limits
©
OMI
Insulation%PF IEEE
(C57.19.01)
%DF
(IEC 60137)
Typical %PF New
values
Oil Impregnated
Paper<0.5% <0.7% 0.2%-0.4%
Resin Impregnated
Paper<0.85% <0.7% 0.3% - 0.4%
Resin Bonded Paper <2.0% <1.5% 0.5%-0.6%
Power Factory limits at power frequency and corrected to 20°C

Power Factor / Capacitance - BUSHING C2
• H1-C2 GST gA

Bushing C2 Test Data
Bushings - C2
Measurement Type Ref@10 kV
Bushing Energize Ground Guard UST Test kV I mA Cap pF
Watt
Loss
PF [%]
Measured
PF [%]
Corrected
Correction
Factor Mode
Insulation
Condition
H1 Tap - Conductor - 0.507 2.099 553.67 0.058 0.28 0.28 1.00 GST gA PASS
H2 Tap - Conductor - 0.505 2.301 607.14 0.074 0.32 0.32 1.00 GST gA PASS
H3 Tap - Conductor - 0.502 2.165 571.03 0.063 0.29 0.29 1.00 GST gA PASS
H0 Tap - Conductor - n/a 0.000 0.00 0.000 n/a n/a 1.00 GST gA
X1 Tap - Conductor - 0.508 0.887 232.41 0.063 0.71 0.71 1.00 GST gA PASS
X2 Tap - Conductor - 0.507 0.879 230.15 0.029 0.33 0.33 1.00 GST gA PASS
X3 Tap - Conductor - 0.507 0.873 228.82 0.023 0.27 0.27 1.00 GST gA PASS
X0 Tap - Conductor - 0.507 0.844 221.01 0.014 0.16 0.16 1.00 GST gA PASS

Power Factor / Capacitance - BUSHING EC
• H1-EC GST or UST
• UST and GUARD circuits can be used for external
contamination investigation and/or isolation

Energized “Hot” Collar Test Data
Bushings - Energized Collar
Measurement Type Ref@10 kV
Bushing Energize Ground Guard UST Test kV I mA
Watt
Loss Mode
Insulation
Condition
H1 Collar - - - 10.022 0.891 0.020 GST PASS
H2 Collar - - - 10.014 0.896 0.021 GST PASS
H3 Collar - - - 10.022 0.896 0.021 GST PASS
H0 Collar - - - n/a 0.000 0.000 GST
X1 Collar - - - 10.006 1.973 0.061 GST PASS
X2 Collar - - - 10.016 1.974 0.060 GST PASS
X3 Collar - - - 10.008 1.973 0.062 GST PASS
X0 Collar - - - 10.020 1.975 0.061 GST PASS

Transformer Exciting Current Test
Vs
1. Apply Voltage Vs on on primary phase, secondary winding left
floating
2. Measure currurent Iex
3. The current required to force ``transformer action´´ (the use of one
winding to induce a voltage in the second winding).

Exciting Current Test Considerations:
The exciting current test is an open-circuit test; the secondary side
bushings should not be shorted together.
If the secondary winding is a Wye-configuration, the Neutral must be
grounded.
Apply AC Voltage across each winding phase, measuring the current
and watts.
On a HV Delta-Configured winding, the third terminal must be grounded,
or the results can no longer be characterized as a single phase
measurement.
Voltage sensitive test, must apply the same voltage to each phase and
as that used for previous results in order to compare.

Analyzing Results
Unexpected results can be observed from the following:
1. Full or partially short circuited turns
2. Open Turns
3. Core Construction Problems
4. Saturated Core

Exciting Current Test Procedure
Routine Test
•Perform test on each phase with the DETC on its “as
found” position.
•DETC should not be moved unless specified by company
or manufacturer
•Ideally test should be performed on all phases at each LTC
positions

Analyzing Results
Confirm Expected Phase Pattern
Confirm Expected LTC Pattern
(For load tap changing transformers)
Compare to Previous Results
Make sure same voltage is applied
Magnitudes do not have to matchAny change should be uniform across
phases (similar percent change).

Analyzing ResultsConfirming the Expected Phase Pattern:
1. High – Low – High (HLH) Pattern Expected for a 3-legged core type transformer.
Expected for a 5-legged core (or shell) type transformer with a
Delta connected secondary winding.
2. Low – High – Low (LHL) Pattern Will be obtained on a 3-legged core type transformer if the
traditional test protocals are not followed.
Neutral on high side Wye-configured transformer is
inaccessible
Forget to ground 3rd terminal on a Delta-connected
transformer
Expected for a 4-legged core type transformer.
3. All 3 Similar Pattern Expected for a 5-legged core (or shell) type transformer with a
non-delta secondary winding.

Exciting Current Test
Transformer: HV – Delta LV - Wye
X1
X2
X3
X0
H1 H3
H2
Test HV Lead LV Lead Ground Float Mode Measure Result
1 H1 H3 H2, X0 X1,X2,X3 UST H1-H3 63.8 mA
2 H2 H1 H3, X0 X1,X2,X3 UST H2-H1 48.6 mA
3 H3 H2 H1, X0 X1,X2,X3 UST H3-H2 64.2 mA

Exciting Current Test
Transformer: HV – Wye LV - Delta
H1
H2
H3
H0
X1 X3
X2
Test HV Lead LV Lead Ground Float Mode Measure Result
1 H1 H0 NONE X1,X2,X3 UST H1-H0 78.8 mA
2 H2 H0 NONE X1,X2,X3 UST H2-H0 62.4 mA
3 H3 H0 NONE X1,X2,X3 UST H3-H0 80.2 mA

Exciting Current Test
Inaccessible Neutral Bushing (H0)
H1
H2
H3X1 X3
X2
Test HV Lead LV Lead Ground Float Mode Measure Result
1 H1 H2 NONE H0,X1,X2,X3 UST H1-H3 75.1 mA
2 H2 H3 NONE H0,X1,X2,X3 UST H2-H0 89.4 mA
3 H3 H1 NONE H0,X1,X2,X3 UST H3-H0 73.2 mA
Transformer: HV – Wye LV - Delta

Exciting Current LTC Pattern – Reactor Type
0.00
100.00
200.00
300.00
400.00
500.00
600.00
16L 15L 14L 13L 12L 11L 10L 9L 8L 7L 6L 5L 4L 3L 2L 1L N 1R 2R 3R 4R 5R 6R 7R 8R 9R 10R 11R 12R 13R 14R 15R 16R
Exci
tin
g C
urr
en
t
LTC Position
Exciting Current
A
B
C
© OMICRON

Demag. Routine Before and After
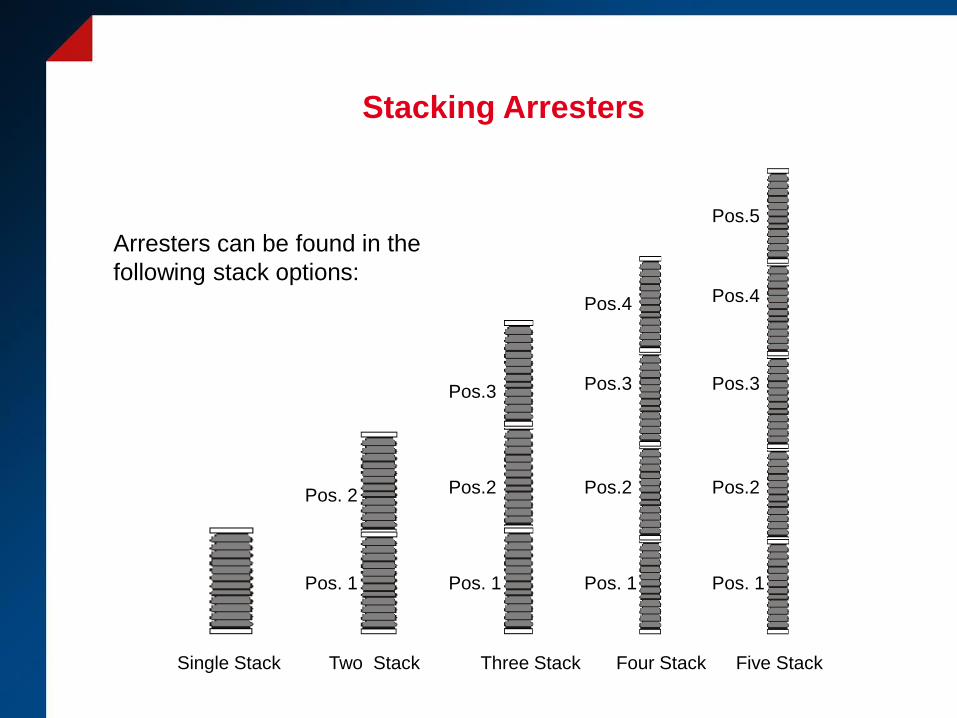
Stacking Arresters
Single Stack Two Stack Three Stack Four Stack Five Stack
Pos. 1
Pos. 2
Pos. 1 Pos. 1 Pos. 1
Pos.2 Pos.2 Pos.2
Pos.3 Pos.3 Pos.3
Pos.4 Pos.4
Pos.5
Arresters can be found in the
following stack options:

Dielectric Loss Measurement
The “Loss” measurement can provide valuable information to help
identify physical changes, deterioration, moisture ingress, and
most importantly help determine suitability for service.
Each arrester in the stack should be measured independently
Only Watts and Current are measured; Power Factor is not
calculated due to the small magnitude of the current
UST
10 kV 0.258
0.052
Test Arrester Pos 2
Test Equipment

Dielectric Loss Measurement
The “Loss” measurement can provide valuable information to help
identify physical changes, deterioration, moisture ingress, and
most importantly help determine suitability for service.
Each arrester in the stack should be measured independently
Only Watts and Current are measured, Power Factor is not
calculated due to the small magnitude of the current
GST-gA
10 kV 0.158
0.033
Test Arrester Pos 1
Test Equipment

Routine Test
The following test should be performed on a routine basis and compared to previous results
Routine Tests
Visual Inspection
Dielectric Loss Measurement
Infrared Analysis

Analyzing Results
The results should be analyzed by the following methods:
1. Previous Test Result
2. Similar Specimens
The result should compare to similar arresters. Make sure
you are comparing A phase position 1 to B Phase position 1
to C phase position 1, and so on.
Typically watts loss measurement are very low under 0.1
watts.
Current measurement should compare very close to similar
units due to same design and construction
Analyzing Dielectric Loss Results

Analyzing Results
Abnormal Dielectric Loss Measurement
(Watts)Silicon Carbide Arrester Metal Oxide Arrester
Higher than Normal Losses
Contamination located inside or
externally
Corroded Gaps
Crack porcelain housing
Lower than Normal Losses
Broken Shunt Resistor
Poor Contact among elements
Higher than Normal Losses
Contamination located inside or
externally
Crack porcelain housing
Lower than Normal Losses
Discontinuities in internal
configuration

Example Arrester Test Results

IR – Surge Arrester
• Heating Due to Internal Leakage Path
• 15C Rise Differential

Surge Arrester - ZOOM

Leakage Reactance
• Leakage flux is flux that does not link all the turns of the winding
• Leakage flux creates reactive magnetic energy that behaves
like an inductor in series in the primary and secondary circuits
• Winding movement changes the reluctance of the leakage flux
path, resulting in a change in the expected leakage reactance
measurement.

Leakage Reactance

Leakage Reactance
• Short circuit LV winding or “winding pairs”
• Inject 0.5 - 1.0% of rated current 60 Hz (Line-to-Line)
• A variable 280 VAC source is recommended
• Measure Series Current and Terminal Voltage
• RESULT - Z, R, and X
• There are two ways to perform the measurement
1. 3 Phase Equivalent
2. Per Phase

Leakage Reactance – 3 Phase Equivalent
• Short LV terminals; do not include neutral
• Compare to nameplate +/- 3%
Inject Short Measure
H1-H3 X1, X2, X3 ZA, RA, XA, LA
H2-H1 X1, X2, X3 ZB, RB, XB, LB
H3-H2 X1, X2, X3 ZC, RC, XC, LC
1 UNIT
3 UNIT

Leakage Reactance – Per Phase
• Short corresponding LV terminals
• Compare deviation from average
Inject Short Measure
H1-H3 X1-X0, X1-X3 ZA, RA, XA, LA
H2-H1 X2-X0, X2-X1 ZB, RB, XB, LB
H3-H2 X3-X0, X3-X2 ZC, RC, XC, LC

Leakage Reactance – NAMEPLATE

Leakage Reactance – Example
Phase V I Z R X L
H1-H3 55.22 1.05 51.59 4.38 51.41 136.4
H2-H1 54.68 1.05 51.15 4.37 50.96 135.2
H3-H2 54.46 1.05 50.96 4.46 50.76 134.2
Nameplate: 6.85% 69 kV 12.5 MVA
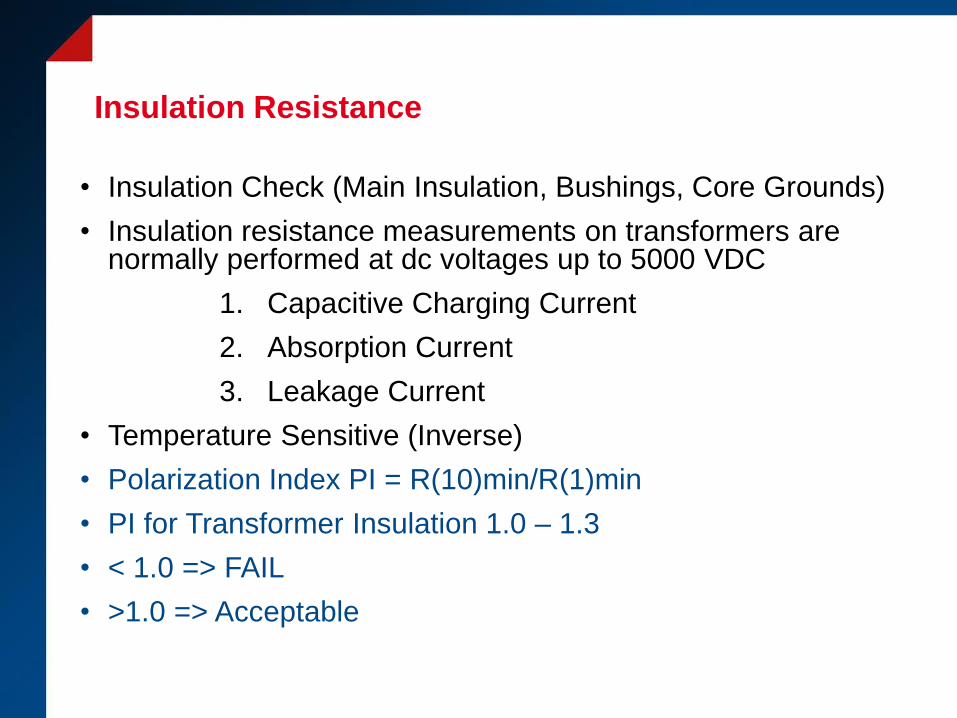
Insulation Resistance
• Insulation Check (Main Insulation, Bushings, Core Grounds)
• Insulation resistance measurements on transformers are normally performed at dc voltages up to 5000 VDC
1. Capacitive Charging Current
2. Absorption Current
3. Leakage Current
• Temperature Sensitive (Inverse)
• Polarization Index PI = R(10)min/R(1)min
• PI for Transformer Insulation 1.0 – 1.3
• < 1.0 => FAIL
• >1.0 => Acceptable
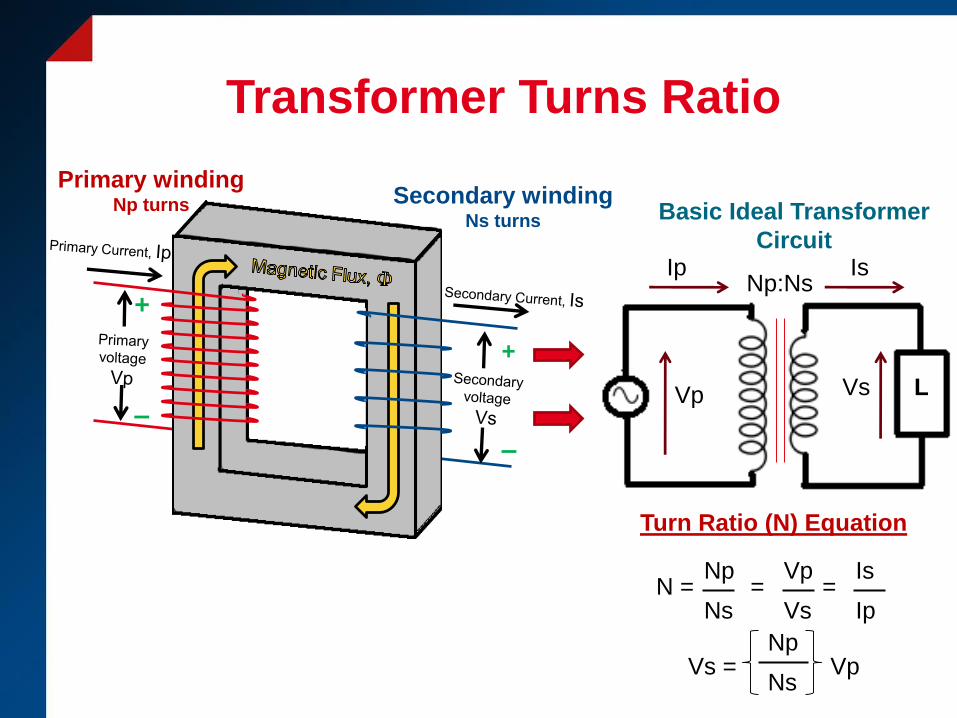
Transformer Turns Ratio
+
Primary windingNp turns Secondary winding
Ns turns
+
–
–
Ip
Vp Vs
Is
L
Np:Ns
Basic Ideal Transformer
Circuit
Turn Ratio (N) Equation
Np
NsN =
Vp
Vs=
Is
Ip=
Np
NsVs = Vp

Turns Ratio Test
Field Turns Ratio Test obejective
Measure transformer turn ratio of each
phase and tap position (Matching
Nameplate)
Measure Phase Angle of the voltage from
the high voltage winding and low voltage
winding
Polarity check is performed as well
Example: Transformer Nameplate
Tap Voltage
HV Winding
LV Winding

Turns Ratio Test
How is it performed?
Three Phase Transformer
A Phase
HV 34500GRDY/19920 Volts
LV 13200 Volts
19920
Calculated Ratio
13200= 1.51
Measurement
Ratio % Dev Angle
1.509 0.050.06%
X1
X2
X3
X0
H1 H3
H2
Test Input Measure Phase Ratio
1 H1-H3 X1-X0 A
2 H2-H1 X2-X0 B
3 H3-H2 X3-X0 C

Turns Ratio Test Procedure
Routine Test
•Should perform turns ratio test on “as found” DETC
positions
•Unless specified by company or manufacturer
•Ideally turns ratio test on all LTC positions
•Place DETC in “as found” position

Analyzing Results
The turn ratio measurement results should be within 0.5%
of nameplate markings according to IEEE C57.12.00-2006
Results should also compare very closely among
phases
Any winding open circuits, short circuits and turn to
turn shorts will show up change this measurement
The phase angle measured between the high voltage and
low voltage winding is generally very low.
Damage or deterioration in the core will increase the
phase angle

Turn Ratio
© OMICRON

Turn Ratio
© OMICRON

Turn Ratio
© OMICRON

Turn Ratio
© OMICRON
0.0
5.0
10.0
15.0
20.0
25.0
16
R
15
R
14
R
13
R
12
R
11
R
10
R
9R
8R
7R
6R
5R
4R
3R
2R
1R N 1L
2L
3L
4L
5L
6L
7L
8L
9L
10
L
11
L
12
L
13
L
14
L
15
L
16
L
Excit
ing
Cu
rren
t [m
A]
Tap Changer Position
Low-Voltage Exciting Current
A
B
C

Turns Ratio Test

Turns-Ratio – H-X

Transformer Winding Resistance
One Phase Transformer Equivalent Circuit
R1 = Power Loss in HV
winding
L1= Leakage Inductance
of HV Winding
R2 = Power Loss in LV
winding
L2= Leakage
Inductance of LV
Winding
Rn = Iron Loss in Core
Lm = Core Inductance

Failure Modes
A change greater than the criteria mentioned can be
indicative of the following:
1. Shorted Circuited Turns
2. Open Turns
3. Defective DETC or LTC (contacts)
4. A Poor Connection Between Terminals Measured

Winding Resistance
Principle of Winding Resistance Test
1. Inject DC Current from one terminal to the other
terminal of a phase
2. Measure the voltage drop across the two
terminals’ under test once core magnetic circuit
has stabilized
3. As long as stable voltage DC source is used,
winding inductance Xp is negligible.
Vp = Ip * Rp Rp = Ip / Vp

Winding Resistance
Very Important when Performing this test
1. Transformer high voltage and low voltage terminals need to
be disconnected and isolated
2. Be aware and use saftey at all time. Make sure the winding
is discharged after a test by grounding the terminal.
3. Never inject a DC current higher than 15% of the winding
rated current
4. Temperature affects the test results and should be
corrected to a common temperature of 75C or 85C
5. The temperature of insulated liquid has to be stabilized (top
and bottom temperature should not deviate more than 5C

Winding Resistance Test
Example of how is it performed?Three Phase Transformer
H1
H2
H3
H0
X1 X3
X2
B Phase
HV 230 Amps
LV 350 Amps
Factory Result (75 C)
0.165
Measurement
Result Corr. %Dev
0.148 3.030.170
DC V
+ +
––
Core is neglected
Ω
Winding Temperature 35 C
H0
X2
X1
H2

Winding Resistance Temperature Correction
Resistance changes with temperature
Results have to be corrected to either 75 C or 85 C to be compare
Factory or Previous Field Test
CfRcor = Rm *
Cf Tc
Tw
*
*
Formula
Rcor = Resistance Corrected
Rm = Resistance measured
Cf = Correction for material [Copper =
234.5, Aluminum 225]
Tc = Corrected Temperature
Tw = Winding Temperature at Test
Previous Example
234.5Rcor = 0.148 *
234.5 75
35
*
*
Rcor = 0.170

Winding ResistanceTest Procedure
1. By performing DC Winding Resistance test, this will magnetize
your core. A magnetized core will affect your Exciting Current
and SFRA Test Results.
2. Recommended to perform DC Winding Resistance last.
3. Imporant to let the measurement stabilize. Depending on the
size of the transformer could take up to several minutes

Winding ResistanceTest Procedure
Routine Test
Should perform test for phases on “as found” DETC
positions
DETC should not be moved unless specified by
company or manufacturer
Ideally test for phases on all LTC positions
Place DETC in “as found” position

DC Winding Resistance
© OMICRON

DC Winding Resistance – Normal Pattern; but Unique
© OMICRON

DC Winding Resistance
© OMICRON

DC Winding Resistance
© OMICRON

POS Volts LTC
X1-X2-X3 A B 9
16R 15180 8 8
M
15R 15095 7 8
14R 15010 7 7
13R 14920 6 7
12R 14835 6 6
11R 14750 5 6
10R 14660 5 5
9R 14575 4 5
8R 14490 4 4
7R 14405 3 4
6R 14320 3 3
5R 14230 2 3
4R 14145 2 2
3R 14060 1 2
2R 13970 1 1
1R 13885 0 1
N 13800 0 0
N 13800 0 0
1L 13715 8 0
K
2L 13360 8 8
3L 13540 7 8
4L 13455 7 7
5L 13370 6 7
6L 13280 6 6
7L 13195 5 6
8L 13110 5 5
9L 13025 4 5
10L 12940 4 4
11L 12850 3 4
12L 12765 3 3
13L 12680 2 3
14L 12590 2 2
15L 12505 1 2
16L 12420 1 1
Transformer Nameplate
Connection 7 Common to 14R and 4L


DC Winding Resistance
© OMICRON

DC Winding Resistance
© OMICRON

Analyzing Results
The winding resistance measurement can be evaluated by
the following three methods: (+/-5%)
1. Compare to Factory Results
2. Compare to Previous Results
3. Compare Among Phases

Thank You for Your Attention