power management in data centers: theory & practice
DESCRIPTION
Power Management in Data Centers: Theory & Practice. Mor Harchol -Balter Computer Science Dept Carnegie Mellon University. Anshul Gandhi, Sherwin Doroudi , Alan Scheller -Wolf, Mike Kozuch. Annual U.S. data center energy consumption. - PowerPoint PPT PresentationTRANSCRIPT

Power Management in Data Centers:Theory & Practice
Mor Harchol-BalterComputer Science Dept
Carnegie Mellon University
1
Anshul Gandhi, Sherwin Doroudi, Alan Scheller-Wolf, Mike Kozuch
Power is Expensive
2
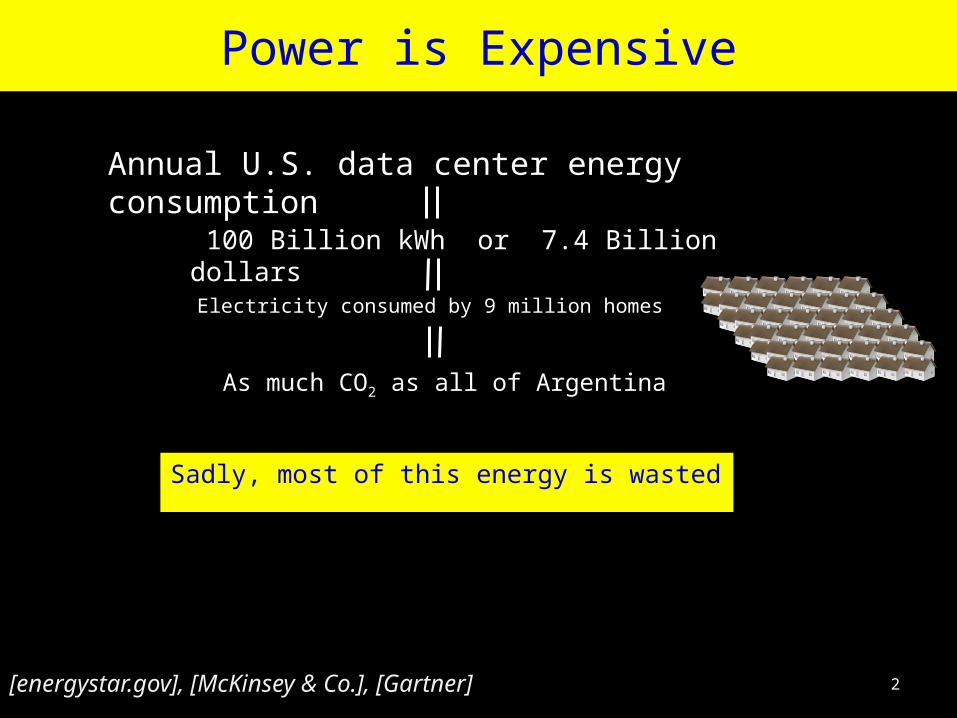
Annual U.S. data center energy consumption
Sadly, most of this energy is wasted
[energystar.gov], [McKinsey & Co.], [Gartner]
100 Billion kWh or 7.4 Billion dollars
Electricity consumed by 9 million homes
As much CO2 as all of Argentina

Servers only busy 5-30% time on average,but they’re left ON, wasting power. [Gartner Report] [NYTimes]
BUSY server: 200 Watts IDLE server: 140 Watts OFF server: 0 Watts
Intel Xeon E55202 quad-core 2.27 GHz16 GB memory
Setuptime260s200W
Don’t know future load
Most Power is Wasted
?ALWAYS ON: Provision for Peak
Time
Load
3
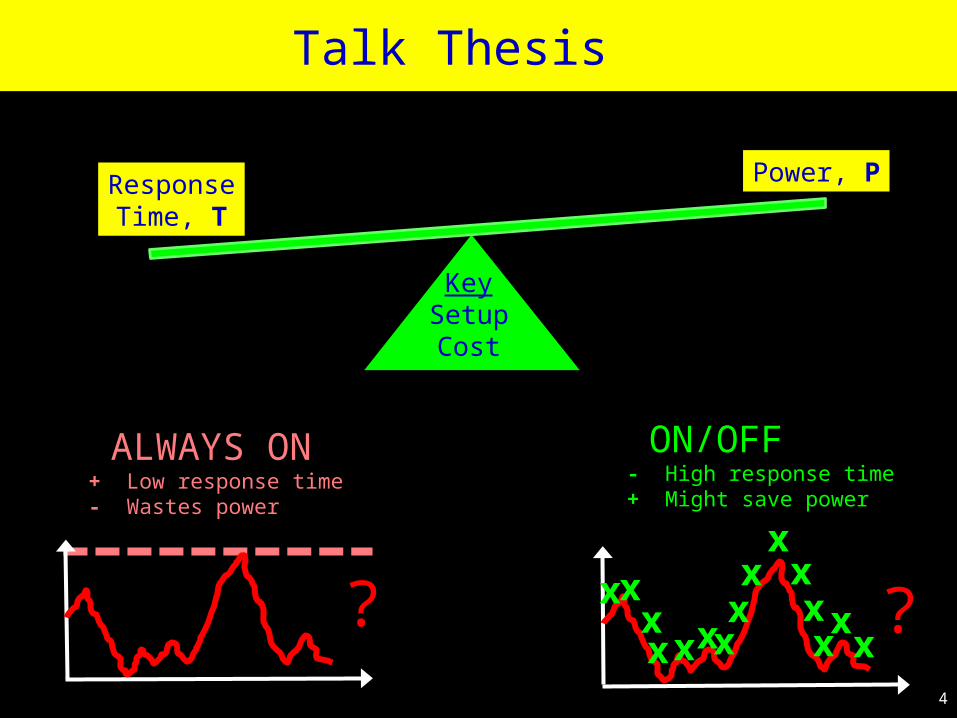
Talk Thesis
ResponseTime, T
Power, P
KeySetupCost
ON/OFF- High response time+ Might save power
?x xx
xx
xx
xx
xxx
xx
x4
?
ALWAYS ON+ Low response time- Wastes power

Outline
Part I: Theory – M/M/k Understanding the challenges: -- What is the effect of setup time?
Part II: Systems Implementation Dynamic power management in practice
5

M/M/1/Setup
# b
usy
serv
ers
# jobs in system
0,0 0,1 0,2 0,3
1,1 1,2 1,3
a
l
a al
l
l
l
mm
m
Serverturns off
when idle.
Setup ~ Exp(a)
1/ 1[ ] [ ] [ ]M /M / Setup M / M /E T E T E Setup
l jobs/sec
m jobs/sec
6
[Welch ’64]

M/M/k/Setup (k=4)
7
0,0 0,1 0,2 0,3
1,1 1,2 1,3
a
l
2a 3al
l
l
l
mmm
l
l
m
2,2 2,3l
2m 2m
a 2a
2ml
3,33m
a l3m
4,4 4,54m
0,4 0,5
1,4 1,5m
2,4 2,52m
3,4 3,53m
4m
4a 4a
3a 3a
2a 2a
a a
l
l
l
l
l
# jobs in system
# b
usy
serv
ers
Setup ~ Exp(a)
l
m
m
m m

M/M/k/Setup (k=4)
8
0,0 0,1 0,2 0,3
1,1 1,2 1,3
a
l
2a 3al
l
l
l
mmm
l
l
m
2,2 2,3l
2m 2m
a 2a
2ml
3,33m
a l3m
4,4 4,54m
0,4 0,5
1,4 1,5m
2,4 2,52m
3,4 3,53m
4m
4a 4a
3a 3a
2a 2a
a a
l
l
l
l
l
# jobs in system
# b
usy
serv
ers
Setup ~ Exp(a)
l
m
m
m m
Open for 50 years

M/M/k/Setup (k=4)
0,0 0,1 0,2 0,3
1,1 1,2 1,3
a
l
2a 3al
l
l
l
mmm
l
l
m
2,2 2,3l
2m 2m
a 2a
2ml
3,33m
a l3m
4,4 4,54m
0,4 0,5
1,4 1,5m
2,4 2,52m
3,4 3,53m
4m
4a 4a
3a 3a
2a 2a
a a
l
l
l
l
l
# jobs in system
# b
usy
serv
ers
Setup ~ Exp(a)
l
m
m
m m
Solvable only NumericallyMatrix-Analytic (MA)

M/M/k/Setup (k=4)
0,0 0,1 0,2 0,3
1,1 1,2 1,3
a
l
2a 3al
l
l
l
mmm
l
l
m
2,2 2,3l
2m 2m
a 2a
2ml
3,33m
a l3m
4,4 4,54m
0,4 0,5
1,4 1,5m
2,4 2,52m
3,4 3,53m
4m
4a 4a
3a 3a
2a 2a
a a
l
l
l
l
l
# jobs in system
# b
usy
serv
ers
Setup ~ Exp(a)
l
m
m
m m
Wide Open

New Technique: RRR [Sigmetrics 13]
11
Recursive Renewal Reward (RRR) Exact. No iteration. No infinite sums. Yields transforms of response time & power.
Closed-form for all chains that are skip-free in horizontaldirection and DAG in vertical direction.
Infinite repeating portion
Finiteportion

New Technique: RRR [Sigmetrics 13]
12
Infinite repeating portion
Finiteportion
Reward earned ( )during cycle
Cycle length1
cycle
cycle
E N t dtEE N
EE dt
N = # jobs

Results of Analysis
13
fix utilization 30%k
l
m
m m k
E[Job size] 10s
E[Setup] 100s
OPT (ON/OFF with 0 setup)
ON/OFF
E[T
] (s
)
k
E[P
] (k
W)
k
ON/OFF
OPT

14
Outline
Part I: Theory – M/M/k What is the effect of setup time?
-- Setup hurts a lot when k: small -- But setup much less painful when k: large -- ON/OFF allows us to achieve near optimal power
Part II: Systems Implementation Dynamic power management in practice
Time
Dem
and
?
-- Arrivals: NOT Poisson Very unpredictable! -- Servers are time-sharing -- Job sizes highly variable -- Metric: T95 < 500 ms
-- Setup time = 260 s

15
LoadBalancer
28 Applicationservers
500 GBDB
7 Memcached
Unknown
key-value workload mix of CPU & I/O 1 Request = 120ms, 3000 KV pairs Provision capacity to meet SLA SLA: T95 < 500 ms Setup time: 260 s
PowerAwareLoad
Balancer
Our Data Center

16
Provisioning
0
200
400
600
800
1000
arrival rate T
95
At Single Server
60 req/s
450 ms
ON/OFF
( )( )
60
r tk t
?x xxxx
xx
xxxxx
xxx
r(t)
tmax
60
rk
AlwaysOn
?r(t)
t
0
200
400
600
800
1000
arrival rate T
95
At Single Server
60 req/s
450 ms

AlwaysOnN
um
. se
rvers
Time (min)
______ loado kbusy+idle
x kbusy+idle+setup
Time (min)
Num
. se
rvers
______ loado kbusy+idle
x kbusy+idle+setup
ON/OFF
T95=291ms, Pavg=2,323W
I’m late,I’m
late!
T95=11,003ms, Pavg=1,281W
17

18
ReactiveControl-Theoretic
[Leite, Kusic, Mosse ‘10][Nathuji, Kansal, Ghaffarkhah ‘10][Fan, Weber, Barroso ‘07] [Wang, Chen ‘08] [Wood, Shenoy, … ‘07]
[Horvath, Skadron ’08][Urgaonkar, Chandra ‘05][Bennani, Menasce ‘05][Gmach et al. ‘08]
Predictive[Krioukov, …, Culler, Katz ‘10][Castellanos et al. ‘05]
[Chen, He, …, Zhao ’08] [Chen, Das, …, Gautam ’05][Bobroff, Kuchut, Beaty ‘07]
-- All suffer from setup lag.-- All too quick to shut servers off.-- All provision based on arrival rate.
ON/OFF Variants

19
x = 100
Time (min)
Num
. se
rvers
______ loado nbusy+idle
x nbusy+idle+setup
ON/OFF
T95=11,003ms, Pavg=1,281W
Num
. se
rvers
Time (min)
T95=487ms, Pavg=2,218W
( )( )
60
r tk t
ON/OFF+padding
( )( ) (1 %)
60
r tk t x
20
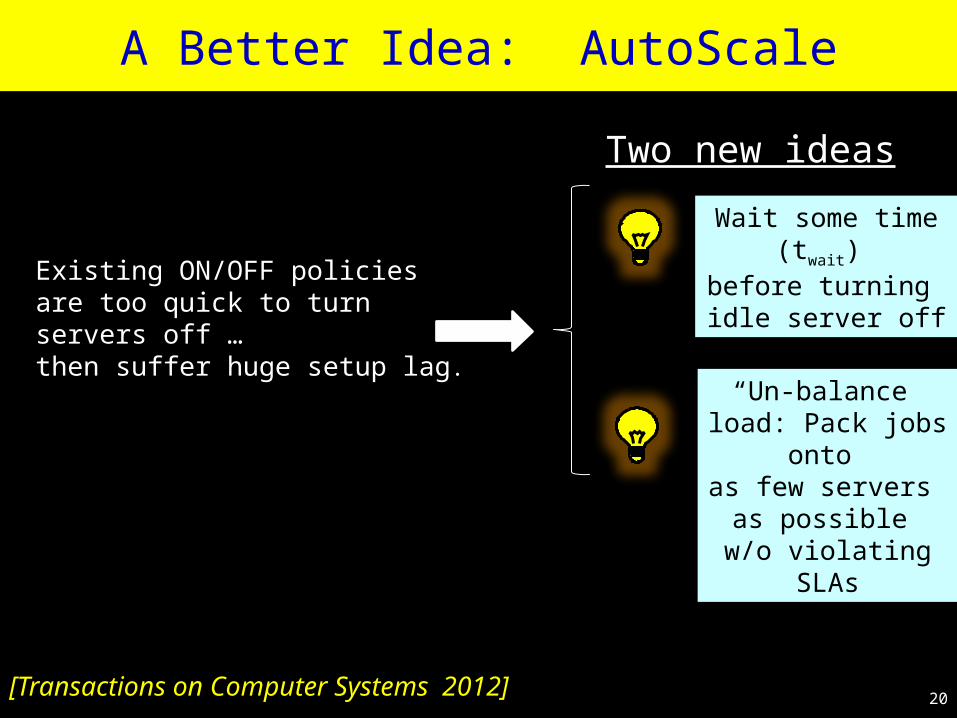
Existing ON/OFF policies are too quick to turn servers off … then suffer huge setup lag.
A Better Idea: AutoScale
Wait some time (twait)
before turning idle server off
“Un-balance” load: Pack jobs
onto as few servers
as possible w/o violating
SLAs
Two new ideas
[Transactions on Computer Systems 2012]
21
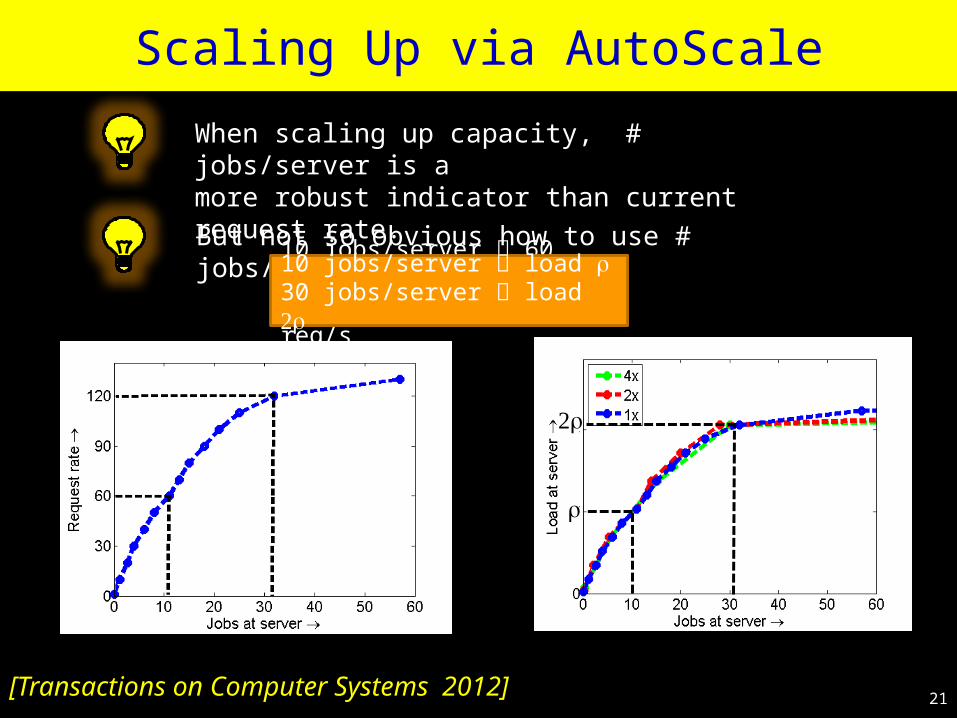
Scaling Up via AutoScale
When scaling up capacity, # jobs/server is amore robust indicator than current request rate.
[Transactions on Computer Systems 2012]
But not so obvious how to use # jobs/server …
10 jobs/server 60 req/s30 jobs/server 120 req/s10 jobs/server load r30 jobs/server load 2r
2r
r

22
Why AutoScale works
Theorem (loosely): As k → ∞, AutoScale’s capacity approaches square-root staffing.
logAutoScale OPT OPT OPT
avg avg avg avgk k k k
[ Performance Evaluation, 2010 (b)]
Theorem : As k → ∞, M/M/k with DelayedOff + Packing

I’m late,I’m
late!
Time (min)
Num
. se
rvers
______ loado kbusy+idle
x kbusy+idle+setup
ON/OFF
T95=11,003ms, Pavg=1,281W
AutoScale
T95=491ms, Pavg=1,297W
______ loado nbusy+idle
x nbusy+idle+setup
Num
. se
rvers
Time (min)
Within 30% of OPT power on all our traces!
23
Facebook cluster-testing AS
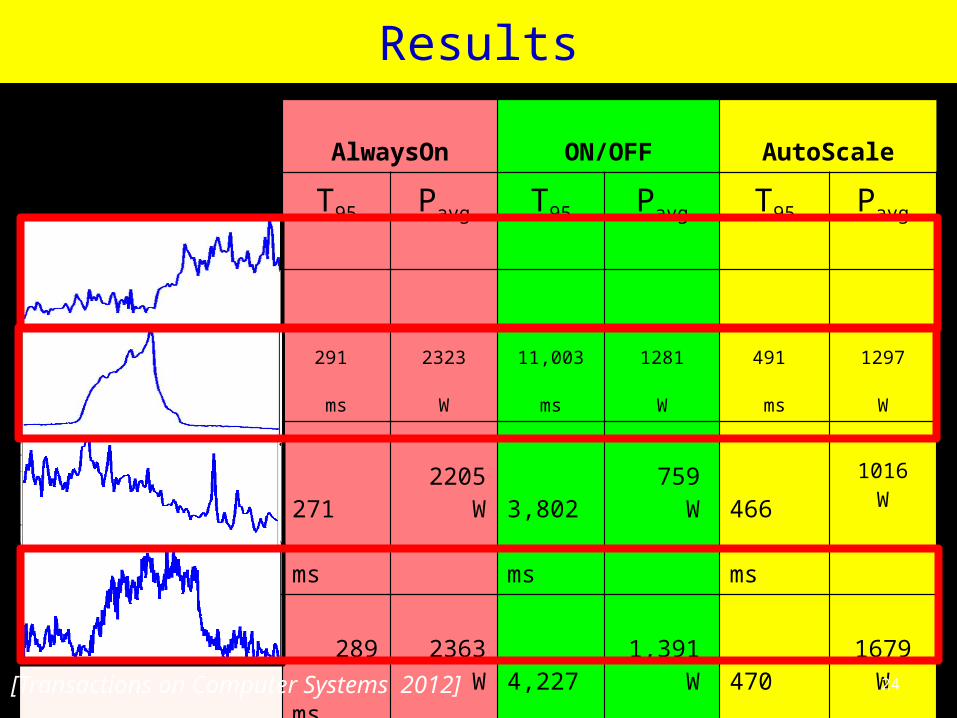
AlwaysOn ON/OFF AutoScale
T95 Pavg T95 Pavg T95 Pavg
291
ms
2323
W
11,003
ms
1281
W
491
ms
1297
W
271 ms
2205 W
3,802 ms
759 W
466 ms
1016W
289 ms
2363 W
4,227 ms
1,391 W
470 ms
1679W
377ms
2263W
> 1 min
849 W
556 ms
1412W
Results
[Transactions on Computer Systems 2012] 24

25
Conclusion
Dynamic power management Managing the setup cost
Part I: Effect of setup in M/M/k First analysis of M/M/k/setup and M/M/∞/setup Introduced RRR technique for analyzing repeating Markov chains Effect of setup cost is very high for small k, but diminishes as k increases
Part II: Managing the setup cost in data centers Non-Poisson arrival process; load unknown; unpredictable spikes Leaving servers AlwaysOn wastes power, but setup can be deadly. Lesson: Don’t want to rush to turn servers off. Proposed AutoScale with Delayedoff, Packing routing & Non-linear Scaling. Demonstrated effectiveness of AutoScale in practice. Proved AutoScale has very good asymptotic behavior.

26Thank You!
References
Anshul Gandhi, Sherwin Doroudi, Mor Harchol-Balter, Alan Scheller-Wolf. "Exact Analysis of the M/M/k/setup Class of Markov Chains via Recursive Renewal Reward." Proceedings of ACM SIGMETRICS 2013 Conference, June 2013.
Anshul Gandhi, Mor Harchol-Balter, Ram Raghunathan, and Mike Kozuch. "AutoScale: Dynamic, Robust Capacity Management for Multi-Tier Data Centers." ACM Transactions on Computer Systems, vol. 30, No. 4, Article 14, 2012, pp. 1-26.
Anshul Gandhi, Mor Harchol-Balter, and Ivo Adan. "Server farms with setup costs." Performance Evaluation, vol. 67, no. 11, 2010, pp. 1123-1138.
Anshul Gandhi, Varun Gupta, Mor Harchol-Balter, and Michael Kozuch. "Optimality Analysis of Energy-Performance Trade-off for Server Farm Management." Performance Evaluation vol. 67, no. 11, 2010, pp. 1155-1171.