power electronics week 10 - university of pittsburghakwasins/power electronics applications...
TRANSCRIPT

ECE1750, Spring 2018
Power Electronics Applications in Photovoltaic Power GenerationPhotovoltaic Power Generation
1

Photovoltaic modules
• Photovoltaic (PV) modules are made by connecting several PV cells. PV arrays are made by connecting several PV modules.
• Although the sun will eventually die as a white dwarf star in about 4.5 Billion years, solar power can be considered a renewable source of energy because we can expect that for the next couple of billion years the sun will still radiate
ith t ki th E th i h bit blpower without making the Earth inhabitable.
• Solar power is radiated through space.
• Solar power is generated by nuclear fusion.
• Photons are created at the center or the Sun It takes an average of 10 millionPhotons are created at the center or the Sun. It takes an average of 10 million years for the photons to emerge (they collide many times in the Sun interior). Then it takes 8 minutes for a photon to reach the Earth.
• Once they reach earth some photons are scattered and absorbed in the atmosphere.

Photons’ Journey into Electricity
• Finally, the photons reach ground on Earth
US Solar Insolation Map: NREL© A. Kwasinski, 2017

Photons’ Journey into Electricity
• The incident power has 3 components depending on the final photons path.
Diffuse radiation
Direct-beam radiation
Reflected radiation
© A. Kwasinski, 2017

Photons’ Journey into Electricity
• Sun’s location terms
© A. Kwasinski, 2017

Photons’ Journey into Electricity
• Magnetic vs. celestial poles:• Magnetic poles:
• Caused by Earth’s magnetic field• Can be located with a compass• They move along Earth’s surface!
Celestial poles: • Caused by Earth’s rotation.• They are two imaginary stationary• They are two imaginary stationary
points in the sky.• Important for PV system applications.
Geological Survey of Canada
© A. Kwasinski, 2017

Sun Moves Throughout the YearSu o es oug out t e ea
June 21
7December 21

Photons’ Journey into Electricity
Edge of
• Impact of the sun’s position for the calculation of the direct-beam radiation with respect to the incidence angle and the air mass ratio
June 21Austin’s Latitude: 30o 30o
Edge of PV module
(for incidence angle
calculation)
March 21September 21
Tropic of CancerLatitude 23.45o 23.45o
calculation)
September 21
Equator23.45o
December 21Tropic of CapricornLatitude -23.45o
Earth’s surface(for air mass ratio(for air mass ratio
calculation)© A. Kwasinski, 2017
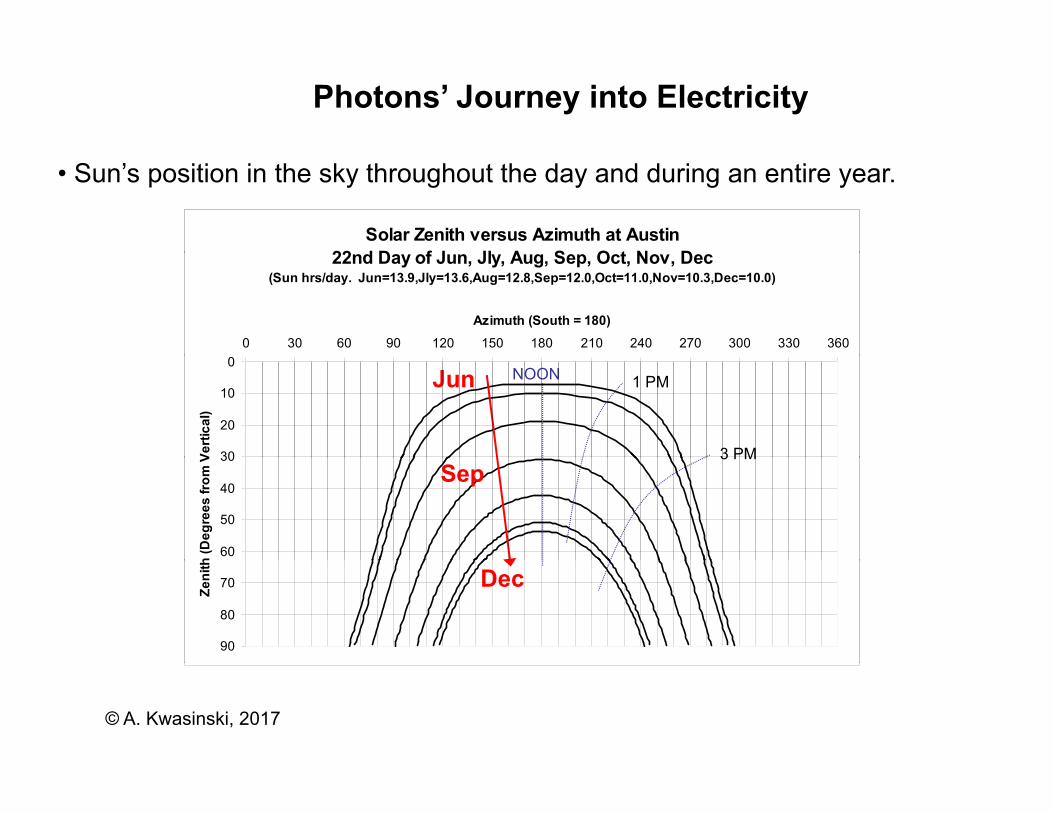
Photons’ Journey into Electricity
Solar Zenith versus Azimuth at Austin
22 d D f J Jl A S O t N D
• Sun’s position in the sky throughout the day and during an entire year.
22nd Day of Jun, Jly, Aug, Sep, Oct, Nov, Dec(Sun hrs/day. Jun=13.9,Jly=13.6,Aug=12.8,Sep=12.0,Oct=11.0,Nov=10.3,Dec=10.0)
0 30 60 90 120 150 180 210 240 270 300 330 360
Azimuth (South = 180)
0
10
20
30Verti
cal)
NOON 1 PM
3 PM
Jun
30
40
50
60
h (D
egre
es fr
om V 3 PM
Sep
70
80
90
Zeni
th
Dec
© A. Kwasinski, 2017

Photons’ Journey into Electricity
• The direct-beam insolation IBC depends on the PV module orientation with respect to the sun. If the PV module is fixed, this insolation will change in a deterministic way throughout the day and the year:
if the incident angle θ is given bycos cos cos( )sin sin cos
S C
• Then, the direct-beam insolation is
I I cosBC BI I
© A. Kwasinski, 2017

Panel Orientation is Importanta e O e tat o s po ta t
tiltpanel
Line perpendicular to horizontal plane
Line perpendicular to panel surface
tiltpanel Horizontal plane
Edge of panel
Figure 6. Panel Tilt Angle
• Best all-year tilt = Latitude
• Best winter tilt = Latitude + 15°
• Best summer tilt = Latitude – 15°
11

Photons’ Journey into Electricity
At ’ d l• Atom’s energy model:Conduction band(partially filled)
Conduction band(Empty at T = 0K)
Eg Forbidden band
Filled band
n E
nerg
y Eg Forbidden band
n E
nerg
y
Gap
Filled bandEle
ctro
n
Gap
Filled bandEle
ctro
n
M l i d
• Photons energy is quantized. The energy of a photon with a wavelength of λ(or a frequency of υ) is
Metals semiconductors
hcE h
where h is Planck’s constant© A. Kwasinski, 2017

Photons’ Journey into Electricity
• After a long journey, photons are converted into electricity in semiconductors:
• Whenever a photon with enough energy hits an atom, an electron may jump the energy gap into the conduction band Once in the conduction band thethe energy gap into the conduction band. Once in the conduction band, the electron is free to move in an electric circuit.• If the circuit is open or if the load requires less current (charge per time) than the one being produced, the free electrons will eventually decay again.g p , y y g• Since it is assumed a continuous slow varying incident solar energy, electrons are freed at a constant rate (direct current). Hence, a constant voltage is produced.
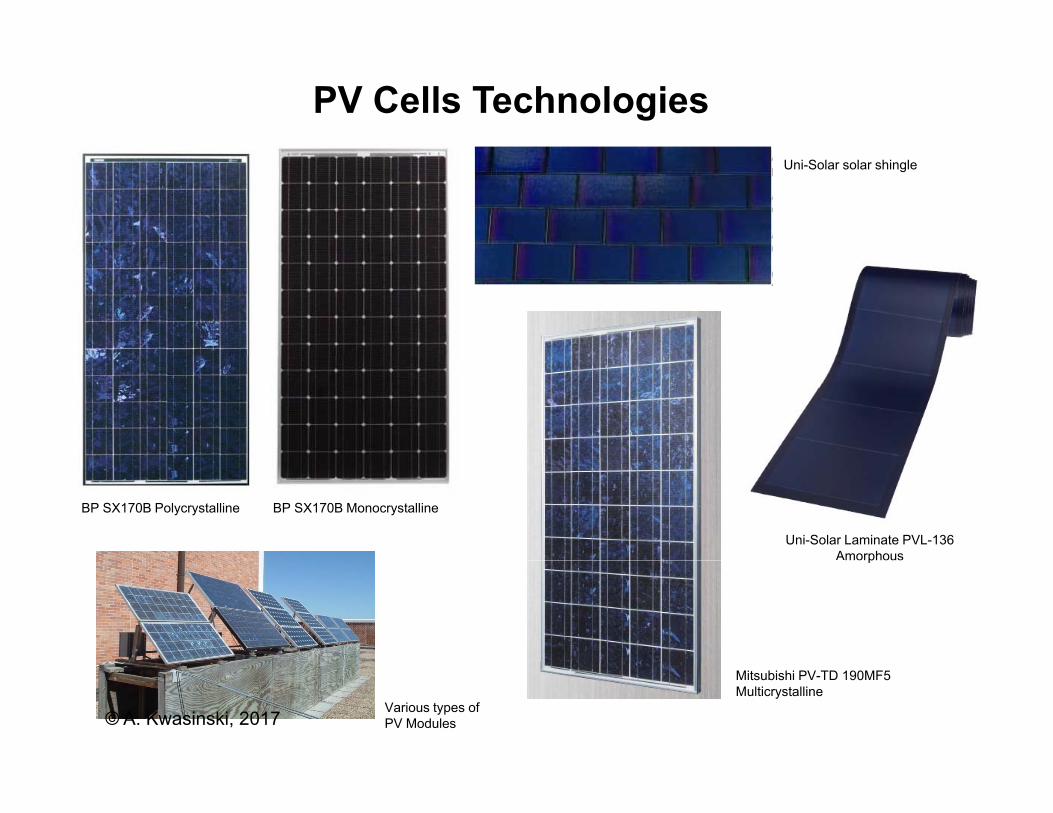
PV Cells TechnologiesUni-Solar solar shingle
BP SX170B Polycrystalline BP SX170B Monocrystalline
Uni-Solar Laminate PVL-136 Amorphousp
Mitsubishi PV-TD 190MF5 Multicrystalline
Various types of PV Modules© A. Kwasinski, 2017

PV Applications
• More conventional applications (not all necessarily for microgrids)
© A. Kwasinski, 2017
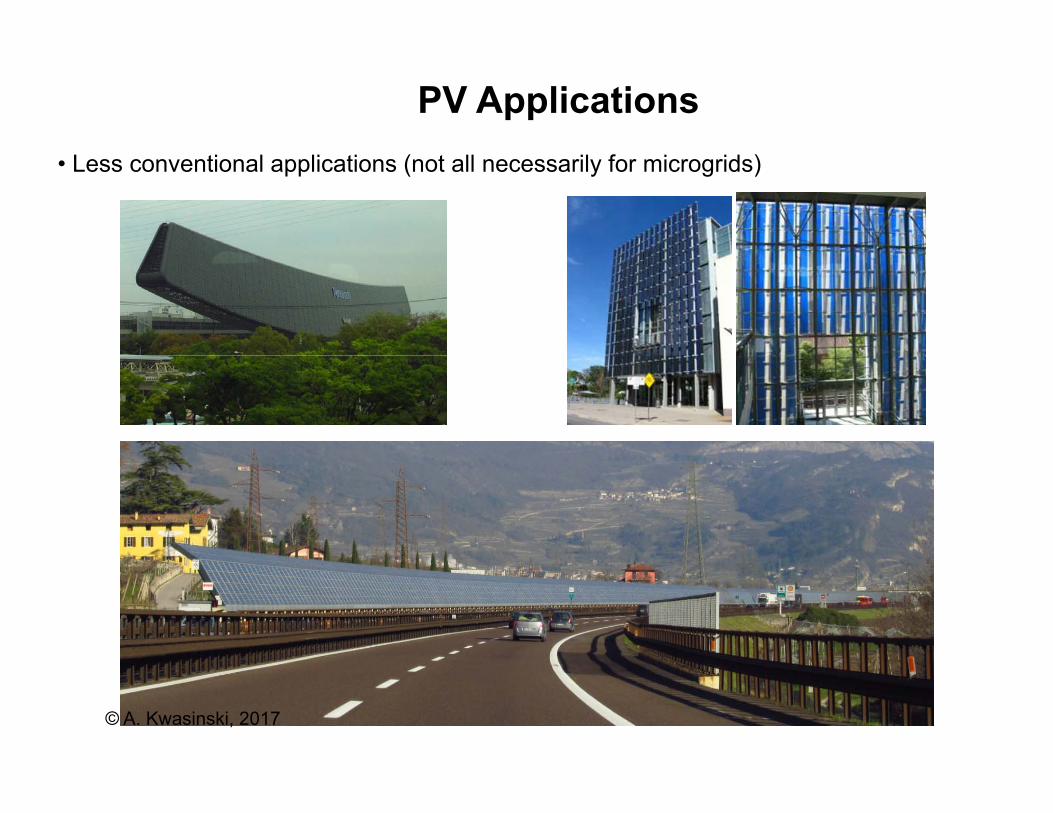
PV Applications• Less conventional applications (not all necessarily for microgrids)
© A. Kwasinski, 2017

The p-n junction diode
n-type substrate dqV
p-type substrate
yp
Bias voltage 0 1dq
kTdI I e
I
Ideal diode
Id
• Vd is the diode voltage• I0 is the reverse saturation current caused by Ideal diode
Real diode0 y
thermally generated carriers• At 25 C:
dV 0.026
0 1dV
dI I e
I0
© A. Kwasinski, 2017

PV Cells physics
I
The current source shifts the reversed diode curve upwardsISC
VOC
diode curve upwards
Same curve
The bias source
Reverse v-i f th
ISC
p-n junction is equivalent to a diode
The bias source (voltage source) is replaced by a current source
d b th curve for the diode
powered by the photons
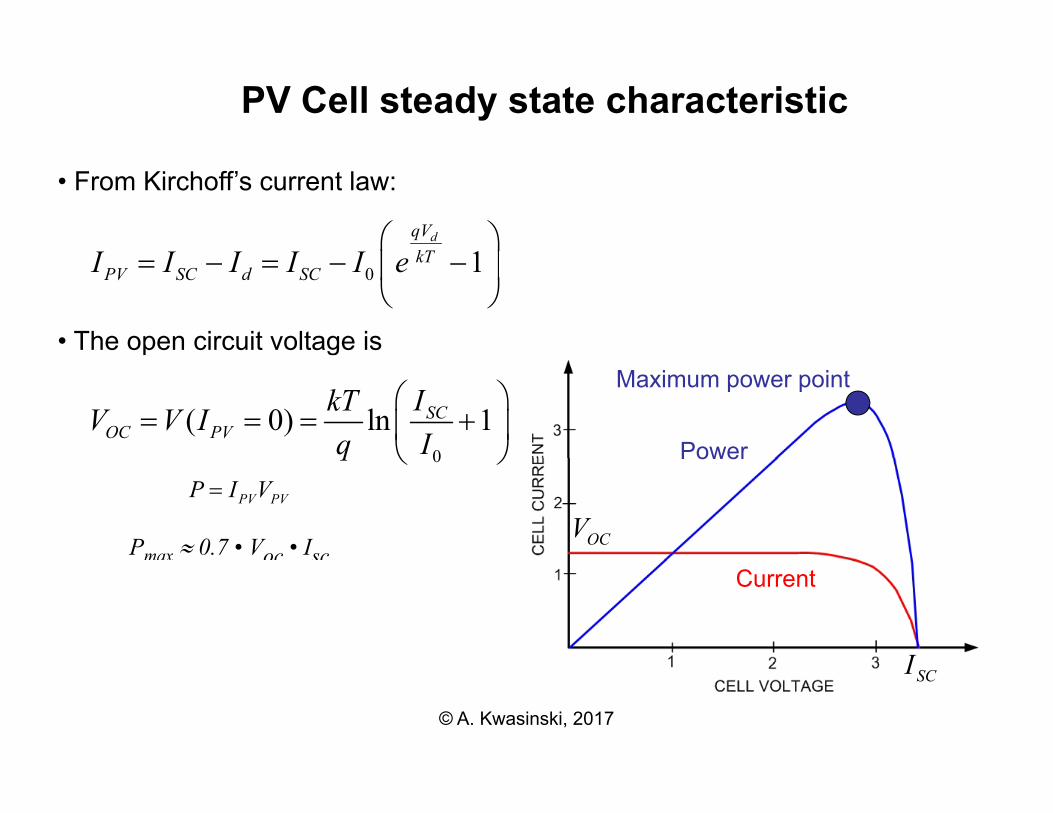
PV Cell steady state characteristic
• From Kirchoff’s current law:
1dqV
kTI I I I I
• The open circuit voltage is
0 1kTPV SC d SCI I I I I e
0
( 0) ln 1SCOC PV
IkTV V Iq I
Power
Maximum power point
0q Power
Pmax 0.7 • Voc • Isc
PV PVP I V
OCV
Current
I
© A. Kwasinski, 2017
SCI

PV Cell steady state characteristic
• Dependence on temperature and insolation:
© A. Kwasinski, 2017
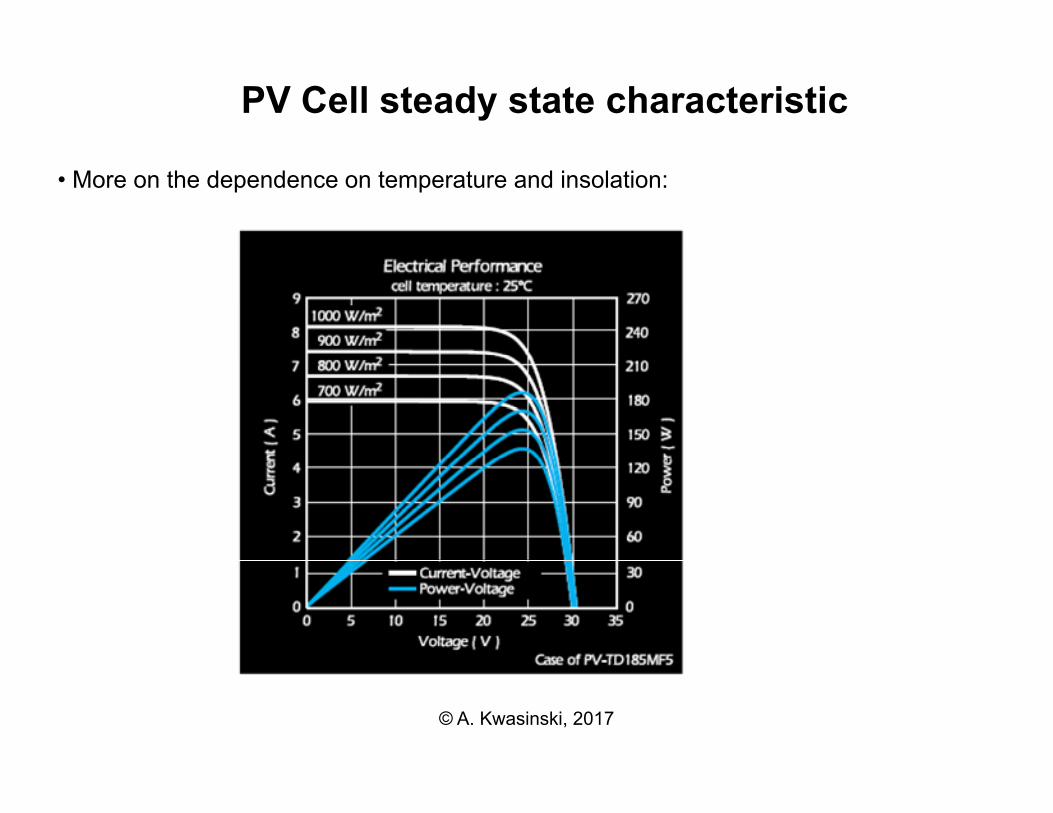
PV Cell steady state characteristic
• More on the dependence on temperature and insolation:
© A. Kwasinski, 2017

• 36 Cells in Series Make a 12V-Class Panel (Voc 19V)
9 cells x 4 cells is acommon configuration
• Two 12V-Class Panels in Series Make a 24V-Class Array (Voc 38V)
22

I-V Curve
17770 VIsc
100524.034.5)( 1777.0 VeVI
PV Station 13, Bright Sun, Dec. 6, 2002
6 P t 30V
4
5
6
s
IscPmax at approx. 30V
Pmax 0.7 • Voc • Isc
1
2
3
I - a
mps
0
1
0 5 10 15 20 25 30 35 40 45
V(panel) - volts Voc
23
Voc
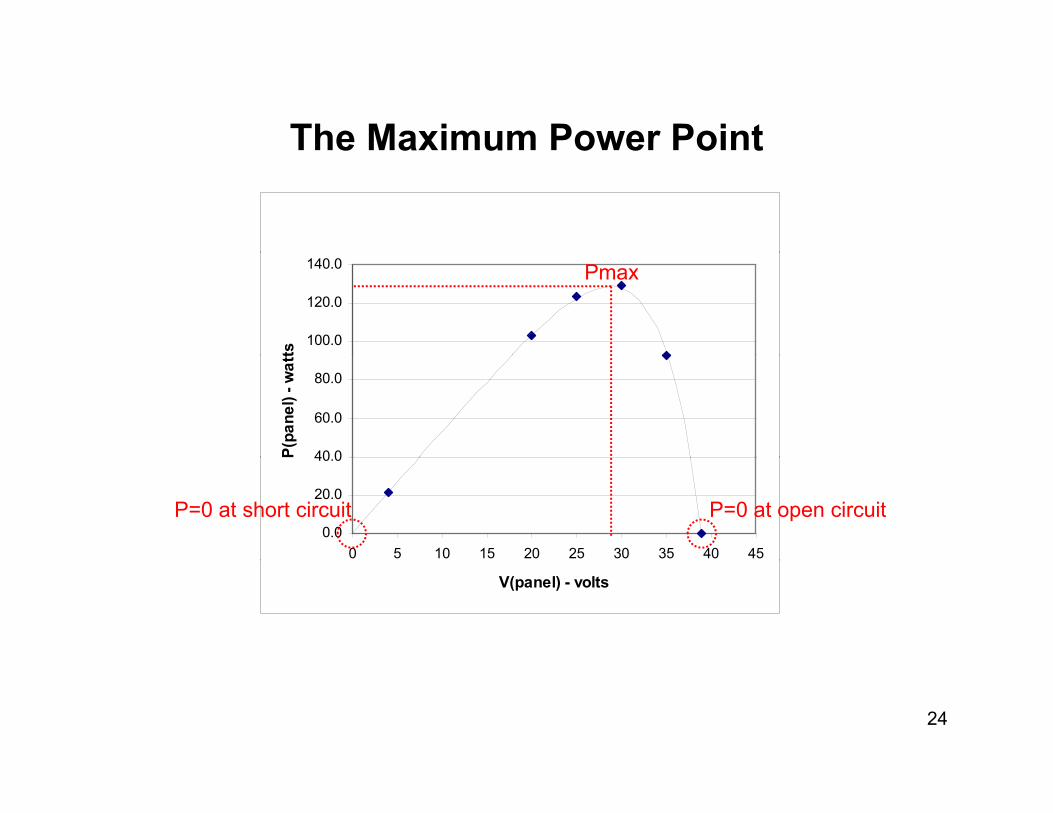
The Maximum Power Pointe a u o e o t
PV Station 13, Bright Sun, Dec. 6, 2002
100.0
120.0
140.0
tsPmax
40 0
60.0
80.0
P(pa
nel)
- wat
t
0.0
20.0
40.0
0 5 10 15 20 25 30 35 40 45
P=0 at short circuit P=0 at open circuit
V(panel) - volts
24

(S S
Grid tied inverters• Traditional architecture (SMA Sunny Boy, PV Powered,
Fronius, Xantrex, and others):
“CONNECTION BOX” (NO
• Two main issues need to be addressed:– Operate PV modules at their maximum power.
ELECTRONICS)
Operate PV modules at their maximum power.– Control inverter’s power output.
25

Maximum Power Point Tracking
Power
Maximum power pointmaxP
Current
Power
ILP
Current
maxVLload
VR
LImaxI
When we connect a resistance R directly to a PV panel the power output is
maxmax
max
VRI
loadLI
LV maxV
• When we connect a resistance RL directly to a PV panel the power output is PL. In general
maxLP P
• Ideally, we would like to have the PV panel always operating at Pmaxregardless of the load. Also, take into account that Pmax changes due to various factors.

Impedance matching
Iout = Iin / DIin
outout
load IVR DC−DC Buck
Converter
+
Vin−
+
Vout = DVin−
Source
Iin
equivR+
VinEquivalent from source perspective
−
RVDV
V l dout
iSo, the buck converter makes the load
2722 D
RDI
VDI
DIVR load
out
outoutin
inequiv
makes the load
resistance look larger to the source

Example of drawing maximum power from l lsolar panel
PV Station 13, Bright Sun, Dec. 6, 2002g
5
6
IscPmax is approx. 130W (occurs at 29V, 4.5A)
2
3
4
I - a
mps
For max power from panels at this solar intensity level, attach
0
1
2
0 5 10 15 20 25 30 35 40 45
44.65.4
29A
VRload
y
But as the sun conditions0 5 10 15 20 25 30 35 40 45
V(panel) - volts Voc
I-V characteristic of 6.44Ω resistor
But as the sun conditions change, the “max power resistance” must also change.
Also, the load changes based on the user needs.
Example of a directed connected load different to that yielding maximum power
PV Station 13, Bright Sun, Dec. 6, 2002
6 130W55W
3
4
5
amps
1
2
I - a
00 5 10 15 20 25 30 35 40 45
V(panel) - volts
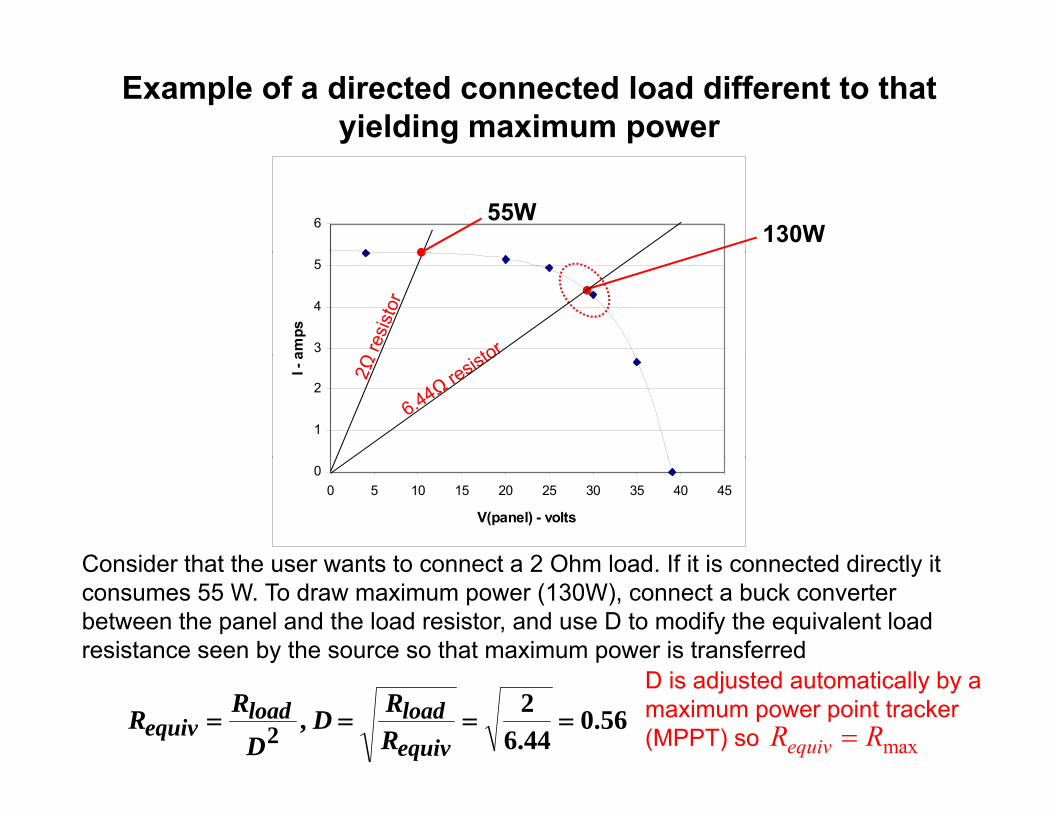
Consider that the user wants to connect a 2 Ohm load If it is connected directly itConsider that the user wants to connect a 2 Ohm load. If it is connected directly it consumes 55 W. To draw maximum power (130W), connect a buck converter between the panel and the load resistor, and use D to modify the equivalent load resistance seen by the source so that maximum power is transferred
56.044.62 ,2
equivloadload
equiv RRD
DRR
D is adjusted automatically by a maximum power point tracker (MPPT) so maxequivR R
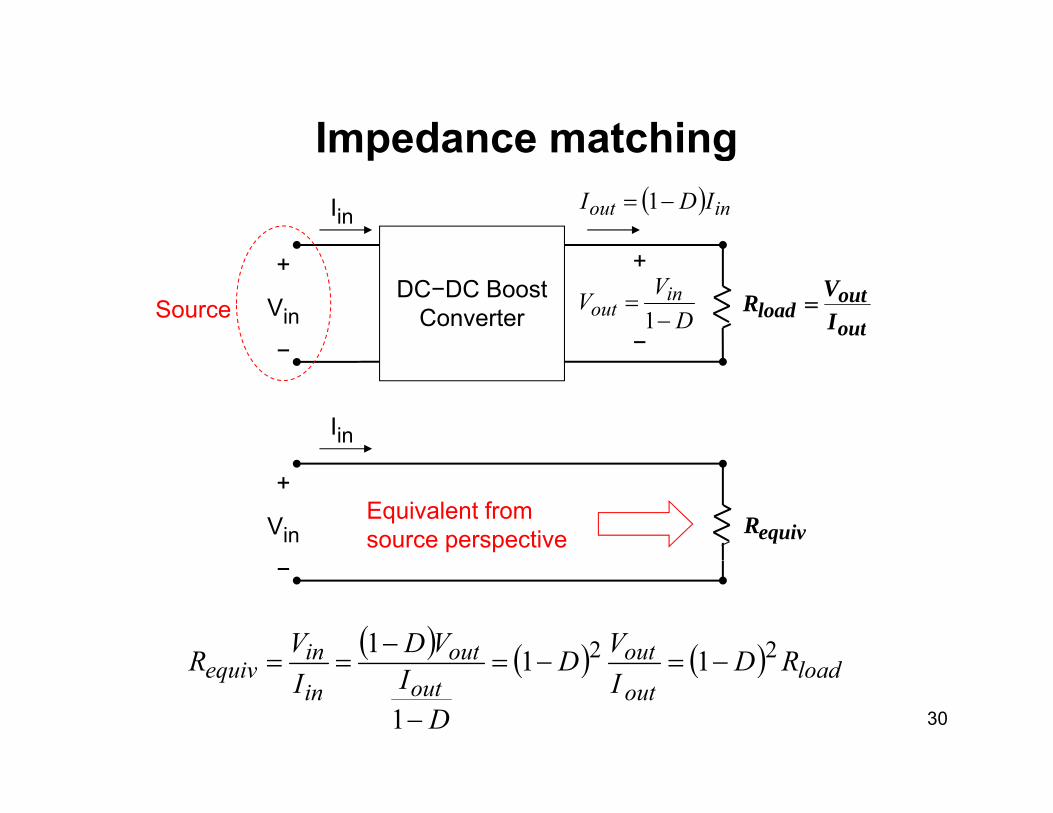
Impedance matchingImpedance matchingIin inout IDI 1
outout
load IVR DC−DC Boost
Converter
+
Vin−
+
−Source D
VV inout
1
Iin
equivR
+
VinEquivalent from source perspective
l doutoutin
i RDVDVDVR 22 111
−
30
loadoutoutin
equiv RDI
D
DII
R 11
1

Example of drawing maximum power from l lsolar panel
PV Station 13, Bright Sun, Dec. 6, 2002g
5
6
IscPmax is approx. 130W (occurs at 29V, 4.5A)
2
3
4
I - a
mps
29V
For max power from panels, attach
0
1
2
0 5 10 15 20 25 30 35 40 45
44.65.4
29A
VRload
But as the sun conditions0 5 10 15 20 25 30 35 40 45
V(panel) - volts Voc
I-V characteristic of 6.44Ω resistor
But as the sun conditions change, the “max power resistance” must also change.
31Also, the load changes based on the user needs.

Example of a directed connected load different to that yielding maximum power
PV Station 13, Bright Sun, Dec. 6, 2002
6 130W
3
4
5
ampsSo, the boost converter
reflects a high load
1
2I -
a
14W
gresistance to a low resistance on the source side
00 5 10 15 20 25 30 35 40 45
V(panel) - volts
C id th t th t t t 100 Oh l d If it i t d di tl itConsider that the user wants to connect a 100 Ohm load. If it is connected directly it consumes 14 W. To draw maximum power (130W), connect a boost converter between the panel and the load resistor, and use D to modify the equivalent load resistance seen by the source so that maximum power is transferred
75.0100
44.611 ,1 2 load
equivloadequiv R
RDRDR
y pD is adjusted automatically by a MPPT controller so maxequivR R

Impedance matchingImpedance matchingIin
D
DII inout
1
outout
load IVR DC−DC SEPIC
+
Vin−
+
−Source D
DVV inout
1
Iin
equivR
+
VinEquivalent from source perspective
out
outin RDVDD
VDVR
22 111
−
33 load
out
outoutin
inequiv R
DIDD
DID
IR
1
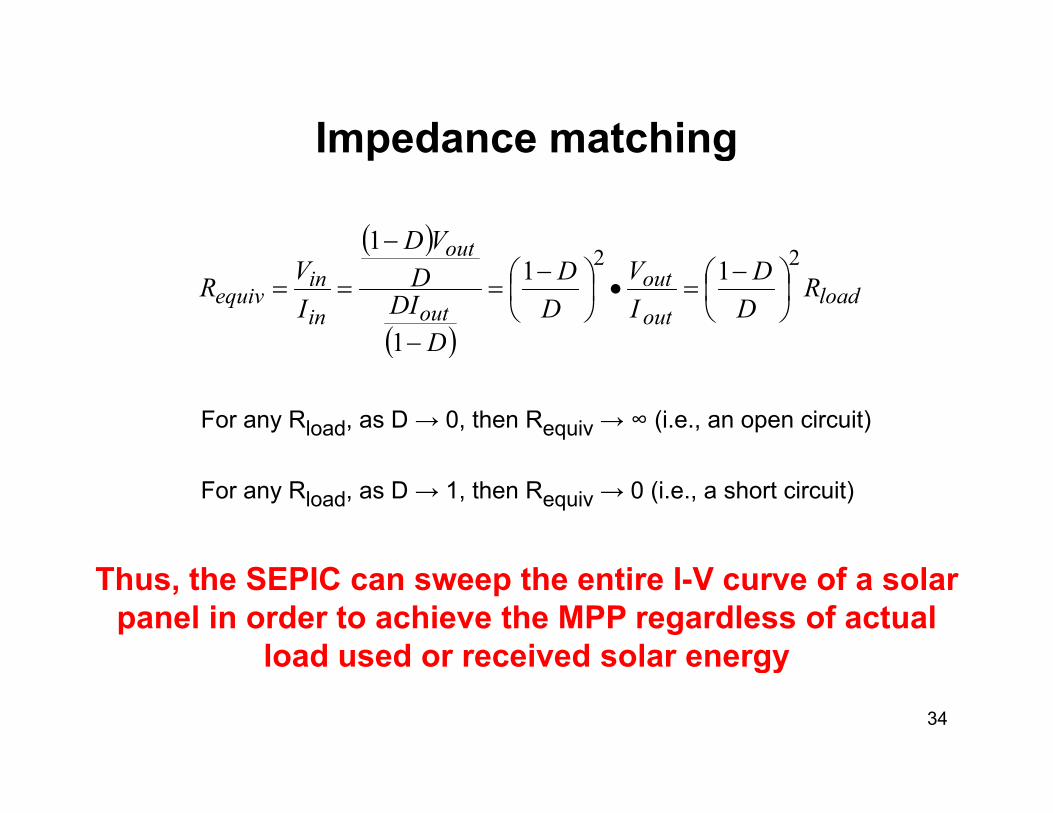
Impedance matchingImpedance matching
outVD22
1
load
out
outout
out
in
inequiv R
DD
IV
DD
DDI
DIVR
22 11
1
For any Rload, as D → 0, then Requiv → ∞ (i.e., an open circuit)
For any Rload, as D → 1, then Requiv → 0 (i.e., a short circuit)
Thus, the SEPIC can sweep the entire I-V curve of a solar panel in order to achieve the MPP regardless of actual
load used or received solar energy
34
load used or received solar energy

Grid-tied inverter control• As it has been explained, we can place a dc-dc converter between the PV array and the inverter so the PV array output is controlled so that it provides itsarray and the inverter so the PV array output is controlled so that it provides its maximum power output regardless of the actual load or other condition.• The output of the dc-dc converter is the power input of the inverter. Output voltage of the inverter can then be controlled to synchronize with the grid.
Vdc
g y g• But what if we want to control the power output of the inverter even without a dc-dc converter at the output of the PV array? The, consider the following….
A+ B+ invZ
Equivalent Circuit
Mot Mot
inv
+ )cos( tVinv −
A– B–
dVa
dcinv m
VV
2invZ
invZ is mostly resistive unless a large inductor is addedAt 60 Hz, inverter impedance

The Electrical Circuit Model
invZ
+
gridZ
+
QPSI , , ,
+ )cos( tVinv −
)cos( tVgrid −
Inverter Grid
• I is the phasor current
• S (complex power) = P + jQ
• P is the active power
• Q is the reactive power
36
• Impedances Z can be expressed as R + jX
• Zinv depends on circuit parameters and on the inverter controller action

The Electrical Circuit Model, cont.
For typical 60Hz systems, the circuit resistance R’s are much higher than the inductive reactance X’s (otherwise the inverter can be controlled so it is a mostly resistive impedance). y p )
Also, voltage angle δ is zero because the inverter control signal is assumed to be a replica of the grid voltage (also, current standards require that the power factor of grid tiedcurrent standards require that the power factor of grid tied inverters is 1).Then, it can be found that
gridinvgrid VV
RV
P 0Q
Active power Reactive power
gtotR
Thus, we control the direction
37
and amount of P by adjusting this difference

Effect of real and reactive power from PV invertersinverters
38

Effect of real and reactive power from PV inverters
• With grid tied inverters, when PV power increases, the real power provided by the grid is reduced by the reactive power provided by the grid is not significantly changed. Hence, power factor from the grid is reduced.
39

Grid Tied InvertersGrid Tied Inverters• Traditional architecture (SMA Sunny Boy, PV Powered, Fronius, Xantrex,
and others):
Grid Tied InvertersGrid Tied Invertersand others):
Fronius
PV Powered
40
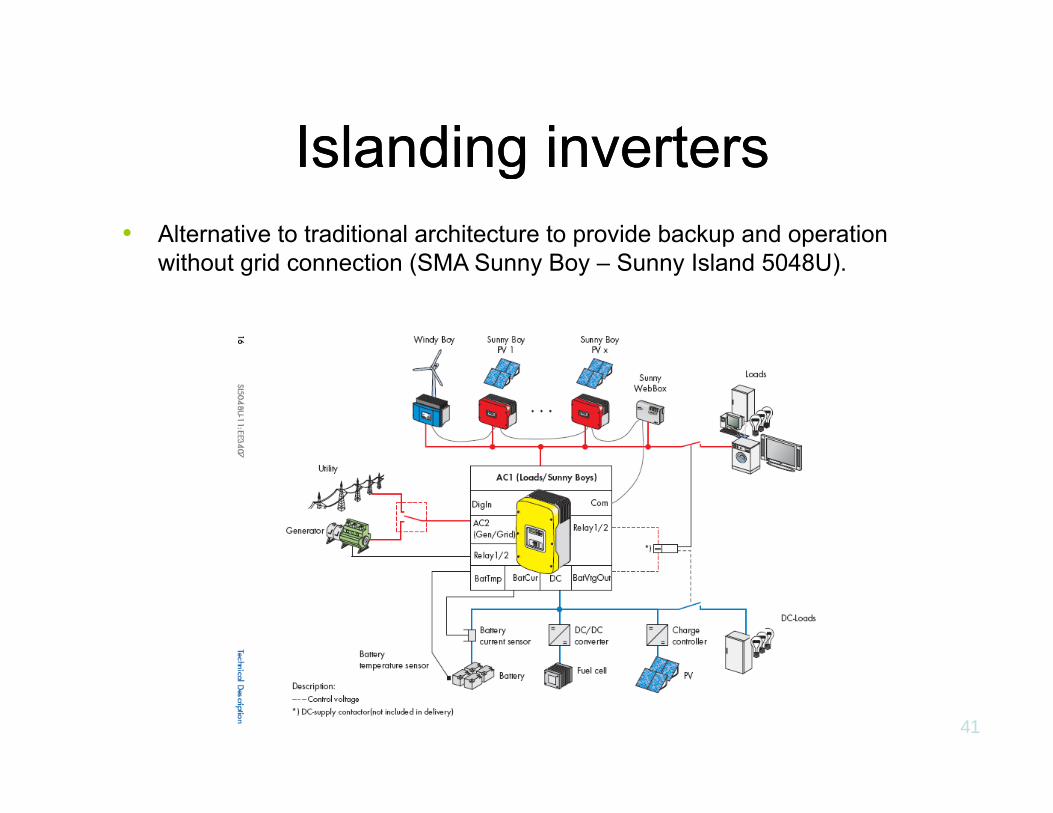
Islanding invertersIslanding invertersIslanding invertersIslanding inverters• Alternative to traditional architecture to provide backup and operation
without grid connection (SMA Sunny Boy – Sunny Island 5048U).
41