power control and energy efficiency strategies for d2d ... · em outras palavras, a tecnologia d2d...
TRANSCRIPT

FEDERAL UNIVERSITY OF CEARÁ
DEPARTMENT OF TELEINFORMATICS ENGINEERING
POSTGRADUATE PROGRAM IN TELEINFORMATICS ENGINEERING
Power Control and Energy Efficiency Strategies for
D2D Communications Underlying Cellular Networks
Master of Science Thesis
Author
Yuri Victor Lima de Melo
Advisor
Prof. Dr. Tarcisio Ferreira Maciel
Co-Advisor
Prof. Dr. Emanuel Bezerra Rodrigues
FORTALEZA – CEARÁ
JULY 2015
UNIVERSIDADE FEDERAL DO CEARÁ
DEPARTAMENTO DE ENGENHARIA DE TELEINFORMÁTICA
PROGRAMA DE PÓS-GRADUAÇÃO EM ENGENHARIA DE TELEINFORMÁTICA
Controle de potência e estratégias de eficiência
energética para comunicações D2D subjacentes redes
celulares
Autor
Yuri Victor Lima de Melo
Orientador
Prof. Dr. Tarcisio Ferreira Maciel
Co-orientador
Prof. Dr. Emanuel Bezerra Rodrigues
Dissertação apresentada à Coordenação do
Programa de Pós-graduação em Engenharia
de Teleinformática da Universidade Federal
do Ceará como parte dos requisitos para
obtenção do grau de Mestre em Engenharia
de Teleinformática. Área de concentração:
Sinais e sistemas.
FORTALEZA – CEARÁ
JULHO 2015

Dados Internacionais de Catalogação na Publicação Universidade Federal do Ceará
Biblioteca de Pós-Graduação em Engenharia - BPGE
M78p Melo, Yuri Victor Lima de.
Power control and energy efficiency strategies for D2D communications underlying cellular networks / Yuri Victor Lima de Melo. – 2015.
72 f. : il. color. , enc. ; 30 cm. Dissertação (mestrado) – Universidade Federal do Ceará, Centro de Tecnologia, Departamento de
Engenharia de Teleinformática, Programa de Pós-Graduação em Engenharia de Teleinformática, Fortaleza, 2015.
Área de concentração: Sinais e Sistemas. Orientação: Prof. Dr. Tarcísio Ferreira Maciel. Orientação: Prof. Dr. Emanuel Bezerra Rodrigues. 1. Teleinformática. 2. Controle de potência. 3. Interferência - Gestão. I. Título.
CDD 621.38


This page was intentionally left blank

Contents
Acknowledgements iv
Abstract v
Resumo vi
List of Figures vii
List of Tables ix
Notation x
1 Introduction 1
1.1 Motivation . . . . . . . . . . . . . . . . . . . . . . . . . . . . . . . . . . . . . . . . . . 1
1.2 Device-to-Device Communication . . . . . . . . . . . . . . . . . . . . . . . . . . . . 2
1.3 Radio Resource Management (RRM) for Device-to-Device (D2D) Communication . 3
1.3.1 Peer Discovery and Pairing . . . . . . . . . . . . . . . . . . . . . . . . . . . . 3
1.3.2 Mode Selection . . . . . . . . . . . . . . . . . . . . . . . . . . . . . . . . . . . 4
1.3.3 Resource Allocation . . . . . . . . . . . . . . . . . . . . . . . . . . . . . . . . 4
1.3.4 Grouping . . . . . . . . . . . . . . . . . . . . . . . . . . . . . . . . . . . . . . 4
1.3.5 Power Control . . . . . . . . . . . . . . . . . . . . . . . . . . . . . . . . . . . . 5
1.4 State of the Art . . . . . . . . . . . . . . . . . . . . . . . . . . . . . . . . . . . . . . . 5
1.5 Thesis Organization and Contributions . . . . . . . . . . . . . . . . . . . . . . . . . 8
1.6 Scientific Production . . . . . . . . . . . . . . . . . . . . . . . . . . . . . . . . . . . 9
2 Methodology and System Modeling 11
2.1 Wireless System . . . . . . . . . . . . . . . . . . . . . . . . . . . . . . . . . . . . . . 11
2.2 Radio Resource Management . . . . . . . . . . . . . . . . . . . . . . . . . . . . . . . 12
2.3 Physical Resource . . . . . . . . . . . . . . . . . . . . . . . . . . . . . . . . . . . . . 12
2.4 Multi-cell Scenario . . . . . . . . . . . . . . . . . . . . . . . . . . . . . . . . . . . . . 13
2.5 Wireless Channel Model . . . . . . . . . . . . . . . . . . . . . . . . . . . . . . . . . . 15
2.6 Transmission Model . . . . . . . . . . . . . . . . . . . . . . . . . . . . . . . . . . . . 15
2.7 Link-to-System Interface . . . . . . . . . . . . . . . . . . . . . . . . . . . . . . . . . 16
2.8 Imperfect Channel State Information . . . . . . . . . . . . . . . . . . . . . . . . . . 17
2.9 System Level Simulation . . . . . . . . . . . . . . . . . . . . . . . . . . . . . . . . . 18
2.10Classification of Metrics Used in Energy Efficiency . . . . . . . . . . . . . . . . . . 18
i

2.10.1Energy Efficiency at the Network Level . . . . . . . . . . . . . . . . . . . . . 18
2.10.2Energy Efficiency at the System Level . . . . . . . . . . . . . . . . . . . . . . 19
2.10.3Energy Efficiency at the Component Level . . . . . . . . . . . . . . . . . . . 19
3 Energy Efficiency RRM Methods 20
3.1 Power Control (PC) . . . . . . . . . . . . . . . . . . . . . . . . . . . . . . . . . . . . . 20
3.1.1 Equal Power Allocation (EPA) and Fixed Power . . . . . . . . . . . . . . . . 20
3.1.2 LTE Power Control . . . . . . . . . . . . . . . . . . . . . . . . . . . . . . . . . 20
3.1.3 Soft Dropping Power Control (SDPC) . . . . . . . . . . . . . . . . . . . . . . 21
3.1.4 Closed Loop Soft Dropping (CLSD) . . . . . . . . . . . . . . . . . . . . . . . . 22
3.2 Downtilt . . . . . . . . . . . . . . . . . . . . . . . . . . . . . . . . . . . . . . . . . . . 23
3.2.1 Antenna Fundamentals . . . . . . . . . . . . . . . . . . . . . . . . . . . . . . 23
3.2.2 Electrical Antenna Downtilt . . . . . . . . . . . . . . . . . . . . . . . . . . . 24
4 Results and Analysis 26
4.1 Power Control . . . . . . . . . . . . . . . . . . . . . . . . . . . . . . . . . . . . . . . 26
4.1.1 Power Control Evaluation in a Micro-cell Scenario (Downlink) . . . . . . . 26
4.1.2 Power Control Evaluation in a Micro-cell Scenario (Uplink) . . . . . . . . . 30
4.1.2.1 LTE PC schemes and SDPC . . . . . . . . . . . . . . . . . . . . . . . 30
4.1.2.2 CLSD a hybrid PC scheme . . . . . . . . . . . . . . . . . . . . . . . 35
4.1.2.3 Impact of loads in PC schemes . . . . . . . . . . . . . . . . . . . . . 37
4.1.2.4 Imperfect Channel State Information (CSI) . . . . . . . . . . . . . . 38
4.1.2.5 Convergence of Soft Dropping (SD) . . . . . . . . . . . . . . . . . . 40
4.2 Antenna Downtilt . . . . . . . . . . . . . . . . . . . . . . . . . . . . . . . . . . . . . 41
4.2.1 Impact of Downtilt in a cellular network with D2D . . . . . . . . . . . . . . 41
4.2.2 SDPC in a Downtilt scenario . . . . . . . . . . . . . . . . . . . . . . . . . . . 44
5 Conclusions 47
Appendix A Proof of convergence SDPC 49
Bibliography 53
ii

Acknowledgements
Initially, I thank God for having given me the strength to consolidate this dream. To
my parents, Wilson Nunes de Melo and Simone Cristina Lima de Melo, for their teachings
and moral values, my immense gratitude, my respect and my admiration, insurmountable in
words. My brother, Yago Willy Lima de Melo by support.
The professor Dr. Tarcisio Ferreira Maciel, my advisor, I thank for the support, incentive,
professional advice, and also of life. Thanks for shared knowledge, for all the help, the advice
that allowed me to complete my master’s thesis. Again, thank you for all of the help.
I also thank the members who accepted the invitation to participate M.Sc. defense boards:
Prof. Dr. Vicente Angelo de Souza Júnior, Prof. Dr. Emanuel Bezerra Rodrigues and Prof. Dr.
Francisco Rodrigo Porto Cavalcanti.
I would like to thank my colleagues from UFC 33, Rodrigo Batista, Carlos Filipe and José
Mairton for the discussions which greatly contributed for my growth as a researcher.
The postgraduate friends Daniel Araújo, Darlan Cavalcante, Diego Aguiar, Hugo Costa,
Igor Guerreiro, Igor Osterno, Juan Medeiros, Lázslon Costa, Marciel Barros, Marcio Caldas,
Paulo Garcia, Rafael Guimarães, Samuel Valduga, Victor Farias and Wilker Lima, with whom
I shared moments of tension, but mainly of much joy and laughter.
The GTEL, the research group in which I had the honorable opportunity to participate. It
was essential to make this work, contributing with computational resources, physical space
and, above all, rich intellectual environment. My thanks in particular to Ana Lívia, Isabel
Rabelo, Ogeniz Façanha and Vera.
The UFC by the infrastructure and the high standard of teachers who train professionals
capable of produce new knowledge and apply them to social reality. I would like also to
acknowledge CNPq for the scholarship support.
To all of you, my sincere appreciation and gratitude.
Yuri Victor Lima de Melo

”I have learned that a man only has the right to look down on another man
when it is to help him to stand up.”
Gabriel José García Márquez

Abstract
In a world where people count on their smartphone, smartwatch, tablet and other devices
to keep them connected wherever they go, they expect its application to run without problems,
such as dropped calls, slow download and choppy videos.
In this context, Device-to-Device (D2D) communication represents a promising technology,
because it is a direct and low-power communication between devices close, allowing to offload
the data transport network, increase spectral and power efficiency. From the subscriber point
of view, D2D means to use applications without problem and increase battery life. However, in
order to realize the potential gains of D2D communications, some key issues must be tackled,
because D2D communications may increase the co-channel interference and compromise the
link quality of cellular communications.
This master’s thesis focuses on Radio Resource Management (RRM) techniques, especially
Power Control (PC) schemes, to mitigate the co-channel interference for D2D communications
underlaying a Long Term Evolution (LTE) network, aiming at the reduction of the intra- and
inter- cell interference and at the improvement of energy efficiency. The main PC schemes
(e.g. OLPC, CLPC and SDPC) and a hybrid scheme (CLSD) are calibrated and used in macro- or
micro- multicell scenario, using different loads and imperfect Channel State Information (CSI).
In addition, the impact of downtilt is analyzed, which is used to adjust the coverage radius of
an Evolved Node B (eNB) and reduce co-channel interference by increasing cell isolation.
The numerical results indicate that PC schemes and downtilt, duly calibrated, can provide
gains to cellular and D2D communications. In other words, D2D technology can be used to
further increase the spectral and energy efficiency if RRM algorithms are used suitably.
Keywords: Device-to-Device (D2D) communication, Long Term Evolution (LTE)
network, Power Control (PC), Downtilt, Interference management, Energy efficiency
v

Resumo
Em um mundo onde as pessoas contam com smartphone, smartwatch, tablet e outros
dispositivos para mantê-las conectadas onde quer que vão, todos esperam que seus
aplicativos sejam executados sem problemas, tais como chamadas abandonadas, download
lento e vídeos com saltos.
Neste contexto, comunicação dispositivo-a-dispositivo (do inglês, Device-to-Device (D2D))
constitui uma tecnologia promissora, pois é um tipo de comunicação direta e utiliza baixa
potência entre dispositivos próximos, permitindo-se desviar o tráfego da rede móvel, aumentar
a eficiência espectral e de potência. Do ponto de vista do assinante, D2D significa usar
aplicação sem problemas e aumentar o tempo de vida da bateria do celular.
No entanto, a fim de realizar os ganhos potenciais das comunicações D2D, algumas
questões-chave devem ser abordadas, pois as comunicações D2D podem aumentar a
interferência co-canal e comprometer a qualidade do enlace das comunicações celulares.
Esta dissertação foca em técnicas de Gerenciamento de Recursos de Rádio (do inglês, Radio
Resource Management (RRM)) para mitigar a interferência co-canal para comunicações D2D
que se baseiam na Evolução de Longo Prazo (do inglês, Long Term Evolution (LTE)), visando
a redução da interferência intra- e inter-celular e na melhoria da eficiência energética. Os
principais esquemas de Controle de Potência (do inglês, Power Control (PC)) (e.g. OLPC,CLPC
e SDPC) e um esquema híbrido (CLSD) são calibrados e utilizados no cenário macro ou micro
multicelular, usando diferentes cargas e Informação do Estado do Canal (do inglês, Channel
State Information (CSI)) perfeita ou imperfeita. Além disso, o impacto da inclinação da antena
(downtilt) é analisado, que é usada para ajustar o raio de cobertura de uma Evolved Node
B (eNB) e reduzir a interferência co-canal, aumentando o isolamento de células.
Os resultados numéricos indicam que os regimes de controle de potência e inclinação
da antena, devidamente calibrados, podem fornecer ganhos para a comunicação celular e
D2D. Em outras palavras, a tecnologia D2D pode ser utilizada para aumentar ainda mais
a eficiência de espectro e a eficiência energética se algoritmos de RRM forem utilizados
adequadamente.
Palavras-chave: dispositivo-a-dispositivo (D2D), Redes LTE, Controle de potência
(PC), Inclinação da antena (Downtilt), Gerenciamento de interferência, Eficiência
energética
vi

List of Figures
1.1 RRM techniques for D2D communications . . . . . . . . . . . . . . . . . . . . . . . 3
1.2 RRM procedures in D2D generic scenario. . . . . . . . . . . . . . . . . . . . . . . . 6
2.1 Classification of wireless communication networks according to the coverage. . . 11
2.2 OFDMA frame structure. . . . . . . . . . . . . . . . . . . . . . . . . . . . . . . . . . 13
2.3 Coverage area of the multi-cell scenario. . . . . . . . . . . . . . . . . . . . . . . . . 14
2.4 Communication within a cell for both directions(Downlink (DL) and Uplink (UL)),
where the solid lines describe the interesting links and the dashed lines represent
the interfering links. . . . . . . . . . . . . . . . . . . . . . . . . . . . . . . . . . . . . 14
2.5 Curves of link-level used for link adaptation. . . . . . . . . . . . . . . . . . . . . . 16
2.6 Imperfect CSI using feedback delay. . . . . . . . . . . . . . . . . . . . . . . . . . . 17
3.1 Target SINR as function of a variable transmit power. . . . . . . . . . . . . . . . . 21
3.2 Azimuth orientation and downtilt in a macrocell scenario. . . . . . . . . . . . . . 24
4.1 Calibration of SD algorithm regarding the total system spectral efficiency and
transmit power. . . . . . . . . . . . . . . . . . . . . . . . . . . . . . . . . . . . . . . 27
4.2 SINR and interference power of cellular and D2D communications by applying
SD and EPA schemes. . . . . . . . . . . . . . . . . . . . . . . . . . . . . . . . . . . . 28
4.3 System spectral efficiency by applying SD and/or EPA to cellular algorithms
and/or D2D transmitters. . . . . . . . . . . . . . . . . . . . . . . . . . . . . . . . . 29
4.4 Calibration of the SDPC scheme by applying it to cellular or D2D links. The
PC range ∆P = 0dB gives the performance of fixed power approach. Minimum
target Signal to Interference-plus-Noise Ratio (SINR) values are simulated until
Γmin = −5 dB because the SINR threshold of the lowest MCS is −6.2 dB. . . . . . . 30
4.5 Calibration of the OLPC scheme by applying it to cellular or D2D links. The
pathloss compensation factor α = 0 gives the No-PC performance. . . . . . . . . . 31
4.6 SINR and interference power levels by applying SDPC and OLPC schemes to
cellular or D2D links. No-PC and fixed power approaches are considered as
baselines. No-PC (cellular) represents the conventional scenario without D2D
communications underlaying the cellular network. . . . . . . . . . . . . . . . . . . 32
4.7 Total system spectral efficiency by applying OLPC to D2D links without PC for
cellular links (No-PC approach). The pathloss compensation factor α of the
OLPC scheme is varied for target Signal to Noise Ratio (SNR) Γk = 10 dB. The
conventional scenario considers the No-PC approach in its cellular links. . . . . 33
vii

4.8 SINR by applying power control schemes to cellular and D2D links. . . . . . . . . 34
4.9 Performance of PC schemes for cellular and D2D communications. . . . . . . . . 35
4.10Spectral efficiency of PC schemes for cellular and D2D communications. . . . . . 36
4.11Power efficiency of PC schemes for cellular and D2D communications. . . . . . . 36
4.12Total spectral efficiency comparison for different loads. . . . . . . . . . . . . . . . 37
4.13Power efficiency comparison for different loads in cellular and D2D
communications. . . . . . . . . . . . . . . . . . . . . . . . . . . . . . . . . . . . . . . 38
4.14Total spectral efficiency for different delays. . . . . . . . . . . . . . . . . . . . . . . 39
4.15Power efficiency for different delays in cellular and D2D communications. . . . . 40
4.16Detailed description of calculation of convergence. . . . . . . . . . . . . . . . . . . 40
4.17Convergence of Soft Dropping (SD). . . . . . . . . . . . . . . . . . . . . . . . . . . . 41
4.18Behavior of spectral and power efficiency for different levels of tilt. . . . . . . . . 42
4.19SINR and interference levels by applying downtilt. . . . . . . . . . . . . . . . . . . 43
4.20System spectral efficiency of cellular and D2D communications in scenario with
and without downtilt. . . . . . . . . . . . . . . . . . . . . . . . . . . . . . . . . . . . 43
4.21Outage reduction for different levels of tilt. . . . . . . . . . . . . . . . . . . . . . . . 44
4.22Total spectral efficiency and power efficiency (SDPC in cellular and No-PC in D2D
links). . . . . . . . . . . . . . . . . . . . . . . . . . . . . . . . . . . . . . . . . . . . . 45
4.23Total spectral efficiency (No-PC in cellular and SDPC in D2D links). . . . . . . . . 46
viii

List of Tables
2.1 Transmitter and receiver sets for D2D communications in both UL and DL
communication phases. . . . . . . . . . . . . . . . . . . . . . . . . . . . . . . . . . . 14
2.2 SINR thresholds for link adaptation . . . . . . . . . . . . . . . . . . . . . . . . . . . 17
2.3 Simulation parameters for urban-macrocell and microcell environments. . . . . . 18
2.4 Metrics Used in Energy Efficiency. . . . . . . . . . . . . . . . . . . . . . . . . . . . 19
4.1 Relative gains of performance by applying the SD algorithm to cellular and D2D
communications. . . . . . . . . . . . . . . . . . . . . . . . . . . . . . . . . . . . . . . 28
4.2 Relative gains of system spectral efficiency by applying the SD algorithm to D2D
communications. . . . . . . . . . . . . . . . . . . . . . . . . . . . . . . . . . . . . . . 29
4.3 Relative gains by applying SDPC and OLPC to cellular or D2D links in
comparison to the No-PC approach (%). . . . . . . . . . . . . . . . . . . . . . . . . 31
4.4 Relative performance gains of Open Loop Power Control (OLPC) for D2D links
compared with no-PC for D2D links (%). . . . . . . . . . . . . . . . . . . . . . . . . 33
4.5 Calibration of σ for CLPC . . . . . . . . . . . . . . . . . . . . . . . . . . . . . . . . . 34
4.6 Closed Loop Soft Dropping (CLSD) parameters . . . . . . . . . . . . . . . . . . . . 35
4.7 Spectral efficiency relative gains applying CLSD compared with other PC
schemes (%). . . . . . . . . . . . . . . . . . . . . . . . . . . . . . . . . . . . . . . . . 36
4.8 Power efficiency relative gains applying CLSD compared with other PC schemes
(%). . . . . . . . . . . . . . . . . . . . . . . . . . . . . . . . . . . . . . . . . . . . . . . 37
4.9 Power efficiency relative gains for different downtilt angles compared without
downtilt (%). . . . . . . . . . . . . . . . . . . . . . . . . . . . . . . . . . . . . . . . . 43
ix
Notation
Acronyms
3G 3rd Generation
3GPP 3rd Generation Partnership Project
4G 4th Generation
5G 5th Generation
BLER BLock Error Rate
BS Base Station
CDF Cumulative Distribution Function
CLPC Closed Loop Power Control
CLSD Closed Loop Soft Dropping
CPU Central Processing Unit
CoMP Coordinated Multi-Point
CSI Channel State Information
D2D Device-to-Device
DIST Distance-based Grouping
DL Downlink
eNB Evolved Node B
EPA Equal Power Allocation
GSM Global System for Mobile Communications
GPL GNU General Public License
IMT International Mobile Telecommunications
ITU International Telecommunication Union
LTE Long Term Evolution
LSI Large-Scale Integration
MCS Modulation and Coding Scheme
MIMO Multiple Input Multiple Output
MR Maximum Rate
MS Mode Selection
MSE Mean Squared Error
NLOS Non-Line of Sight
NMSE Normalized Mean Square Error
OFDMA Orthogonal Frequency Division Multiple Access
OFDM Orthogonal Frequency Division Multiplexing
OLPC Open Loop Power Control
x

PAIR D2D Pair Gain-based Grouping
PC Power Control
PRB Physical Resource Block
QAM Quadrature Amplitude Modulation
QoS Quality of Service
QoE Quality of Experience
QPSK Quadri-Phase Shift Keying
RAN Radio Access Network
RA Resource Allocation
RET Remote Electrical Tilt
RB Resource Block
RM Rate Maximization
RRA Radio Resource Allocation
RRM Radio Resource Management
RR Round Robin
SCM Spatial Channel Model
SD Soft Dropping
SDPC Soft Dropping Power Control
SINR Signal to Interference-plus-Noise Ratio
SIR Signal to Interference Ratio
SNR Signal to Noise Ratio
TTI Transmission Time Interval
UE User Equipment
UL Uplink
VET Variable Electrical Tilt
WCDMA Wideband Code Division Multiple Access
WINNER Wireless World Initiative New Radio
WPAN Wireless Personal Area Network
WWAN Wireless Wide Area Network
xi

Chapter 1Introduction
1.1 Motivation
The development of Radio Access Networks (RANs) has provided triple-play services
(i.e. voice, video and data) anytime and anywhere. These features demand high spectral
efficiency and so it is essential to ensure interoperability of radio access technologies and
convergence of different services. Therefore, the International Telecommunication Union (ITU)
has established a set of requirements for a high performance 4th Generation (4G) [1] of wireless
communication systems. The key requirements are:
◮ high quality mobile services,
◮ user equipment suitable for worldwide use,
◮ user-friendly applications, services and equipment,
◮ worldwide roaming capability,
◮ compatibility of services within International Mobile Telecommunications (IMT) and with
fixed networks.
Modern wireless networks e.g. 5th Generation (5G) need to be efficiently designed in order
to support as much calls, data transmissions and mobile services as possible, and still extend
the battery lifetime of User Equipments (UEs). Additionally, the successful operation of
modern telecommunication systems is dependent, in part, on sophisticated real-time control
mechanisms. Energy-efficient wireless networks have become an important research topic
in the last years due to the increasing rate of data traffic and the quick growing of energy
consumption [2].
Device-to-Device (D2D) communications underlaying a cellular network can improve
resource utilization and potentially lead to a reduced power consumption. However, D2D
communications may increase the co-channel interference and compromise the link quality of
cellular communications [3]. Power Control (PC) is an important Radio Resource Management
(RRM) functionality in wireless communication systems, which adapts the transmit power of
the communicating devices to ensure a target Quality of Service (QoS) level, thus limiting
interference and prolong the battery lifetime. Therefore, the design of PC schemes becomes
attractive in order to keep interference under control, protect cellular communications, and
get energy-efficient transmissions [4].
Another technique used to keep interference under control is called antenna downtilt,
which is responsible for changing the antenna radiation pattern. By utilizing antenna

1.2. Device-to-Device Communication 2
downtilt, signal level within a cell can be improved and interference radiation towards other
cells can be effectively reduced due to the antenna radiation pattern. However, an excessively
large downtilt angle might lead to coverage problems at cell border areas. Therefore, it is vital
to define a suitable downtilt angle [5].
1.2 Device-to-Device Communication
D2D is an attractive means of expanding mobile network capacity, user experience, energy
efficiency and corverage. When a direct communication occurs between two UEs, this
communication is called D2D. To provide high spectral efficiency, advanced techniques are
needed to manage and control interference, because D2D users are added to cell.
D2D communication was first cited in [6] to allow multihop relays in cellular networks.
Then others papers were published [7, 8], where the main investigated subject was the
potential of D2D communications for improving spectral efficiency of cellular networks. Other
potential benefits of incorporating a D2D communication in a cellular network is metioned
such as peer-to-peer communication [9, 10], video dissemination [11], machine-to-machine
(M2M) communication [12,13] and cellular offloading [14,15].
As mentioned above, D2D communications are added to the cells of a cellular sytem. Thus,
it is important to understand how the resources are divided in the cellular network when D2D
communication is used. D2D communication can occur on unlicensed spectrum (outband)
or on cellular spectrum (inband). The inband technique can be subdivided in a group where
all spectrum of cellular network can be used to cellular or D2D communication and another
group where each communication uses a specific portion of the spectrum. These techniques
are called, respectively, underlay and overlay.
There are works about inband and outband D2D communication in the literature [16,17].
When D2D communication is used outband, the main problems are related to coordinating
the communication over different bands due a second radio interface (e.g., WiFi Direct [16]
and bluetooth [17]). Regarding the underlay case, until now, the main question is the problem
of interference mitigation between D2D and cellular communications [18–20].
The features of the D2D are described below [16,20]:
◮ Unlicensed spectrum (outband): WiFi and Bluetooth operate in unlicensed spectrum,
without any centralised control of usage or interference. This is not generally a problem
when usage densities are low, but it would become a major limitation as proximity-based
services proliferate. Throughput, range and reliability would all suffer;
◮ Security: The security features of WiFi and Bluetooth are much less robust than those
used in public cellular systems. They would not be adequate for major public services
and they would be unsuitable for public safety applications;
◮ Radio resource management: Unlike Bluetooth and WiFi, Long Term Evolution (LTE)
operates in licensed spectrum and the radio resources are carefully managed by the
network, to minimise interference and maximise the performance of the system. The
same mechanisms can be extended to D2D;
◮ Performance: Direct communication between nearby devices may be able to achieve
even higher throughput and lower latency than communication through an LTE base
station. For example, the devices may be closer to each other than either of them is to
the nearest base station and a busy base station may be a bottleneck. The network can

1.3. RRM for D2D Communication 3
still exert control over the radio resources used for these connections, to maximise the
range, throughput and overall system capacity;
◮ Spectrum reuse: D2D could enable even tighter reuse of spectrum than can be achieved
by LTE small cells, by confining radio transmissions to the point-to-point connection
between two devices;
◮ Network load: Relieving the base stations and other network components of an LTE
network of some of their traffic-carrying responsibilities, for example carrying rich media
content directly between mobile terminals, will reduce the network load and increase its
effective capacity;
◮ Energy efficiency: Integrating D2D into the LTE system provides the opportunity to
achieve energy-efficient device discovery, for example by avoiding the need to scan
for other wireless technologies, by synchronising the transmission and reception of
discovery signals to minimise their duty cycle and by waking application software only
when relevant devices are found in the local area. Meanwhile, direct transmission
between nearby devices can be achieved with low transmission power.
1.3 RRM for D2D Communication
New challenges related with interference appear when D2D communications use cellular
spectrum. Thus, it is necessary to improve and create RRM techniques for D2D
communications such as mode selection, user grouping, Power Control and adaptive
scheduling. This section gives an explanation about RRM for D2D communications, which
are illustrated in Figure 1.1.
Begin
Peer Discovery
Set D2D Pairs
Band Selection
End
Link Establishment
Power Control
Precoding Filters
Update Neighbors
List
Grouping / Scheduling
Mode Selection
RRM for D2D Communications
Figure 1.1: RRM techniques for D2D communications
1.3.1 Peer Discovery and Pairing
The goal of peer discovery is to look for UEs, which are candidates to establish D2D links.
A UE or Evolved Node B (eNB) can be responsible for this procedure, in which they transmit
beacon signals to identify its neighbors and analyze their beacon intensity. UEs have a
higher probability to become candidate for D2D communication when their beacon intensity
is strong. After the first step, the next step is the device pairing. Pairing is responsible for
determining which D2D candidates establish D2D links in the cellular network [21]. The first
and second step are well known in, for example, Bluetooth, where master node identifies in a
range the devices wishing to participate of a specific connection [22].

1.3. RRM for D2D Communication 4
1.3.2 Mode Selection
Mode Selection (MS) is an important RRM technique in D2D communication, which
determines whether UEs can communicate directly or not (i.e. via the Base Station (BS)). In
[23], the author proposes a mode selection procedure that takes into account the link quality
of the D2D link and the different interference situation when sharing cellular Uplink (UL)
or Downlink (DL) resources. The results ensure a reliable D2D communication with limited
interference to the cellular network.
Other study about MS is realized in [24]. Therein, the author derives the system
equations that can be used to analyze a system where both cellular communication and D2D
communication can share the same resources. Via numerical analysis it was shown that
communication mode selection needs to be designed carefully to prevent deteriorating the
system performance. The results show that the main affecting factors for the performance
gain from D2D are local communication probability and maximum distance between
communicating devices. In other words, D2D communication is propitious when the UE
is close to BS and the distance between the UEs of a D2D pair is short.
1.3.3 Resource Allocation
The purpose of the Resource Allocation (RA) is to select Physical Resource Block (PRB)
of a set of available PRB for each transmission/reception in cellular or D2D communication.
In [25], the authors use a method with which D2D communications can reuse the resources of
more than one cellular user. The authors assume that PRBs can be selected with an optimal
resource allocation method using the Channel State Information (CSI) of all involved links.
The results show that the proposed method is the optimal method when D2D are located in
most parts of the cell area and the method achieves better performance when the D2D pair
becomes closer to the cell edge.
The Round Robin (RR) and Maximum Rate (MR) scheduling algorithms are well-known in
literature and they can be used in D2D communication [26]. The principle of RR algorithm is
to be resource fair with each user. It is accomplished by assigning the same number of PRBs
to every user. The principle of Rate Maximization (RM) algorithm is to assign resources to the
users which maximize system rate. The algorithm is performed for each PRB and resource are
assigned the users with the largest channel gain on that PRB. The results showed that higher
throughput gains are achieved when scheduling prioritizes the D2D mode due to proximity.
1.3.4 Grouping
The grouping is the key technique to achieve high reuse gains, because it is used to choose
which cellular and D2D links should share a PRB. For example, it is possible to choose
cellular and D2D users to share a resource randomly and, therefore, no channel information
is used.
In [27], the authors developed several grouping algorithms. The Distance-based Grouping
(DIST) algorithm’s basic idea is to group the D2D transmitters that are farthest from the eNB
with the scheduled cellular UEs as to obtain resource reuse gains without much losses to
cellular communications performance. Therein, the D2D Pair Gain-based Grouping (PAIR)
method is founded on the fact that the proximity between D2DTx and D2DRx is an important
parameter for D2D communications and this aspect is prioritized for resource sharing. It is
assumed that the large-scale fading gain for the link between these nodes is made available
to the eNB, which uses it to represent the effective radio distance between nodes. This gain
can be estimated and reported to the eNB by the D2DTx, D2DRx or both.

1.4. State of the Art 5
1.3.5 Power Control
Improper use of transmit power can harm all previous blocks of RRM, because a high
transmit power for a cellular or D2D transmitter can increase the interference level of system,
decrease the QoS and reduce battery life. So, it is clear that PC schemes are important in
traditional cellular network and become essential when D2D links are added to the network.
The D2D links have to adjust their transmit powers seeking to increase spectral and power
efficiency, while cellular links keep a acceptable QoS. In [28], a dynamic PC mechanism
is proposed to reduce interference generated by D2D communications and improve the
performance of cellular communications in DL. The proposed algorithm has two phases.
In the first phase, the eNBs assigns resources to D2D communications by reusing the same
resources allocated to cellular UEs. Then, PC is usually applied for D2D communications to
decrease interference to cellular UEs. For this goal, the eNB adjusts the transmit power of the
D2D transmitter based on estimated channels gains between each desired link.
In [29], the authors consider that a cellular UE needs to communicate with an eNB in UL
while multiple D2D links coexist in the common spectrum. Two forms of PC were proposed:
centralized and distributed. Centralized PC occurs when D2D links are managed by eNB.
In this case, the eNB needs to know the global CSI. The proposed distributed PC sets the
transmit power of D2D-capable UEs based on the knowledge of direct link information and
the minimum channel gain that is fixed and known by all UEs.
1.4 State of the Art
D2D communication is a technology used to improve QoS and Quality of Experience (QoE)
of the users, while it provides the increase of resource utilization in cellular networks,
because it can operate in licensed and unlicensed spectrum bands. In other words,
D2D communications can underlay a cellular network, employing the same radio resource
to improve the system efficiency. In a cellular network, where UE have traditional
communications via eNB in a LTE system, UEs have the capacity to create a direct
communication with each other over D2D links.
However, it is necessary to manage all these links and, for this purpose, the eNB becomes
responsible for controlling the radio resources and set transmission parameters, such as,
communication duration and transmit power.
There are several industrial and academic researches related with D2D communications,
which show and explain the benefits of D2D communications to the next-generation of cellular
networks, such as:
◮ provide a better energy efficiency;
◮ offload cellular networks;
◮ improve system capacity;
◮ increase coverage;
◮ improve QoS and QoE.
The combination of cellular and D2D communications opens several issues such as the
analysis and design of techniques related to optimization, signal processing, decision theory
and layer perspectives (e.g. physical, MAC, network and application). Figure 1.2 illustrates
the main RRM procedures in a generic scenario with an eNB surrounded by UEs using cellular
and D2D communications.

1.4. State of the Art 6
Mode Selection
Peer Discovery
(Beacon)
D2D Mode
Cellular M
ode
Cellular ModeCellular vs D2D
Interference
Management
P ee r
D
isco
ver y
(B
eaco
n)
Peer Discovery
(Beacon)
Peer Discovery List
HotspotHotspot
Figure 1.2: RRM procedures in D2D generic scenario.
Peer discovery in cellular networks has been studied in [30], where the authors propose
a synchronous device discovery solution for networks based on the observations of the time
synchronization. The results indicated that the solution has a large advantage over WiFi for
device discovery, both in terms of range and energy efficiency. In [9], the authors focus on
peer discovery for D2D communication in LTE networks. A new distributed discovery protocol
is proposed for UEs to broadcast their presence. In the proposed protocol, UEs transmit
beacons periodically to advertise their presence. The purpose of such control is for an eNB
to minimize the required Resource Blocks (RBs) for beacon transmission, while still providing
efficient peer discovery for D2D UEs. The authors concluded that the algorithm provides a
good performance in discovery of UEs with mobility in LTE networks.
Regarding the resource assignment between cellular and D2D users, in [31], a heuristic
algorithm considering channel gain information appropriately selects the shared radio
resources for both users. In [32], the authors use the diversity in the cellular network to
improve the network capacity. In [33], the system spectral efficiency is increased by allowing
D2D users to reuse the resources of more than one cellular user in a system where perfect
CSI is assumed.
Mode selection has been studied in [34–36]. In [34] semi-analytical studies have shown
that when D2D communications share the same resources as the cellular network, significant
gains in total throughput can be achieved compared to the conventional case, namely by
the jointly and optimal allocation. However, numerical analyses have also shown that
mode selection algorithms need to be designed carefully in order to prevent deteriorating
the whole system performance. In [35], the authors derive equations that capture the
network information such as link gains, noise levels, and Signal to Interference-plus-Noise
Ratios (SINRs). The results shown that the main factors affecting the performance gain
of D2D communication are the local communication probability and maximum distance
between communicating nodes, as well as the mode selection algorithm. In [36], the eNB
can decide whether the underlaying D2D pair should reuse cellular resources, get dedicated
resources or communicate via eNB. One conclusion drawn from this paper is that an
optimal communication mode selection strategy does not only depend on the quality of the
link between D2D terminals and the quality of the link towards the eNB, but also on the
interference situation.
PC schemes are one of keys to the harmonious coexistence between cellular and D2D
communications. In this context, the transmit power of both communications need to be
adjusted by the eNB based on channel gain, QoS demands, coverage and/or target SINR.
A PC method for D2D communications was proposed in [37] to maximize the network sum
rate. Its optimality is discussed under practical constraints such as minimum and maximum
spectral efficiency, and maximum transmit power. In [38], a power minimization solution

1.4. State of the Art 7
with joint subcarrier allocation, adaptive modulation, and mode selection was proposed to
guarantee the QoS demand of D2D and cellular communications. A simple PC scheme
was proposed in [39] to regulate the transmit power of D2D-capable UEs and protect the
existing cellular links in a single-cell scenario and deterministic network model. The algorithm
imposes constraints on the SINR to allow quality degradation of cellular links until fixed levels
are reached in DL and UL communication phases.
Different UL PC schemes have been studied for D2D communications in the literature [40,
41], including fixed transmit power schemes, fixed target Signal to Noise Ratio (SNR) schemes,
and LTE PC schemes – Open Loop Power Control (OLPC) and Closed Loop Power Control
(CLPC). In [40], a new PC scheme with double thresholding that coordinates the transmit
power of D2D and cellular UEs to maximize the cell throughput and guarantee QoS levels
is proposed in a scenario composed of a cellular UE and a D2D pair. The results show a
throughput improvement in comparison with LTE OLPC. In [41], the authors use the LTE
OLPC for cellular links and study other PC schemes for D2D links. The authors conclude
that the LTE PC schemes gets close (especially for the conventional cellular UEs) in terms
of transmit power and SINR levels to an optimization-based approach aiming to increase
spectrum usage efficiency and to reduce sum power consumption.
In [42], the Soft Dropping Power Control (SDPC) scheme adjusts the transmit power to meet
a variable target SINR in an UL single-carrier system. In [43], the SDPC scheme was used
to protect cellular and D2D communications from mutual interference in a DL Orthogonal
Frequency Division Multiple Access (OFDMA) system. It improved the spectral efficiency of
cellular UEs in 14% and still significantly reduced the power of D2D transmitters in 49%
without harming the spectral efficiency achieved by D2D receivers. Thus, the SDPC scheme
appears as a promising solution to protect cellular UEs from the interference caused by D2D
communications.
In [44], the authors examine the consequence of antenna downtilt and UL PC on the system
level performance considering a realistic multicell 3D channel model. A highlight of the paper
is the performance evaluation considering different downtilt angles and OLPC. The paper
shows that angles between 4° and 8° are good for cells with radius in the range of 300m based
on a urban-macro path loss model based on the WINNER II [45] channel model.
A study about the relation between load balancing and antenna tilt adjustment schemes is
one of the main contributions in [46]. The authors simulated different load balancing methods
based on combinations of cell association algorithms and antenna tilt. The potential gain of
traffic load balancing in terms of cell edge user throughput and significant cell edge user
throughput improvements were observed by the authors, in contrast to the fixed case. In [47],
antenna tilt adaptation was used to redistribute cell load from high congested areas to the
areas with less congestion by using the Simulated Annealing [48] meta-heuristic and lead to
efficient utilization of radio resources.
A research in field trial is detailed in [49]. The paper presents a set of UE locations, where
downtilt could increase Signal to Interference Ratio (SIR) by about 5 dB to 10 dB. Furthermore,
the effect of downtilt on the multi-path channel, location of the user and the eNB power is
investigated.
Strategies that exploit system-level analyses for the performance gains achieved with
Radio Resource Allocation (RRA) strategies for rate maximization in downlink multi-antenna
Coordinated Multi-Point (CoMP) systems are investigated in [50]. The authors realized
analysis of the antenna downtilt to mitigate inter-cell interference and concluded that spatial
diversity-based transmission schemes combined with downtilt provided satisfactory gains,
1.5. Thesis Organization and Contributions 8
especially for low loads expressed in number of active UEs per cell. In [51], antenna
tilt adaptation is used for capacity optimization using techniques to identify the dominant
interfering cells. Results show that the proposed technique identifies a reduced set of
potentially significant interfering cells among the neighbors which have considerable impact
on system performance.
In order to present basic effects on network coverage and capacity due to changes
in the antenna downtilt angle configuration when mechanical or electrical adjustment of
the downtilt is used, the paper [52] shows the percentage of covered area under certain
circumstances. The electrical adjustment of the downtilt angle performed slightly better than
the mechanical one. According to the results presented therein, the smaller the cell size the
larger the antenna downtilt should be; and the higher the traffic load per cell the smaller
the antenna downtilt should be. In [53], the potential gain of tilt optimization due to user
traffic distribution is investigated for the 3rd Generation Partnership Project (3GPP) urban
propagation environment. Therein, a traffic hotspot situation is assumed, the tilt of each
sector is adapted, and user throughput performance targets are defined. According to the
authors, the performance gain is larger for higher traffic densities at the hotspot.
1.5 Thesis Organization and Contributions
This thesis is organized as follows. In Chapter 2, we concentrate on the methodology
and system model that are applicable in cellular networks integrating D2D communications.
More specifically, we show the RRM for cellular communications and discuss about mode
selection, resource allocation, grouping and power control for D2D communications. The
benefits of D2D communications underlaying cellular networks are detailed in different topics
as security, performance and energy efficiency. Subsequently the details about physical
radio resources, wireless channel, transmission, link-to-system interface and imperfect CSI
modeling are addressed. Finally, we show the classification of metrics used to quantify energy
efficiency at network, system and component levels.
In Chapter 3, we explain about the efficiency energy methods used to analyze the D2D
scenarios addressed in Chapter 2. In this chapter we focus on baselines such as Equal Power
Allocation (EPA), Fixed Power and Fixed SINR, which are used to compare the efficiency of
Open Loop Power Control (OLPC), Closed Loop Power Control (CLPC), Soft Dropping Power
Control (SDPC) and Closed Loop Soft Dropping (CLSD). Next, we describe the formulation of a
simple and efficient downtilting, which is used to reduce undesired effects as inter- and intra-
cell interference.
In Chapter 4, we show the results of the performance evaluation of the referred PC schemes
in a macro-cell and in a micro-cell scenario using UL or DL bands. The main contributions
are:
◮ Show the performance of PC with variable target SINR levels in a multi-cell scenario,
◮ Compare the LTE PC schemes,
◮ Suggest and analyze the parameters for the CLPC scheme,
◮ Show the performance of PC with variable target SINR levels in a multi-cell scenario,
◮ Show the minimum performance impact on cellular communications for enabling D2D
gains in a multi-cell scenario,
◮ Propose an SDPC-like alternative as PC scheme,

1.6. Scientific Production 9
◮ Calibrate operating points of the considered PC schemes for energy efficiency of cellular
and D2D communications,
◮ Create and analyze the performance of CLSD,
◮ Test the performance of PC for different loads,
◮ Examine the impact of imperfect CSI,
◮ Show the convergence of SDPC,
◮ Implement the downtilt in the OFDMA system with D2D communications underlying
cellular networks,
◮ Show the impact of downtilt in a multi-cell scenario,
◮ Determine range of downtilt angles that impact positively on cellular and D2D
communications.
In Chapter 5, we summarize the main conclusions obtained along the master’s thesis.
Furthermore, we point out the main research directions that can be considered as extension
of the study performed in this master’s thesis.
1.6 Scientific Production
The contents and contributions present in this thesis were published and submitted with
the following information:
◮ Melo, Y.V.L; Batista, Rodrigo L.; Maciel, Tarcisio F.; Silva, Carlos F.M.e; da Silva, Jose
Mairton B.; Cavalcanti, Francisco R.P., “Power control with variable target SINR for D2D
communications underlying cellular networks,” in European Wireless 2014 (EW2014),
Barcelona, Spain, May 2014.
◮ Melo, Y.V.L; Batista, Rodrigo L.; Silva, Carlos F.M.e; Maciel, Tarcisio F.; da Silva, Jose
Mairton B.; Cavalcanti, Francisco R.P., “Power Control Schemes for Energy Efficiency
of Cellular and Device-and-Device Communications,” in Wireless Communications and
Networking Conference (WCNC), New Orleans, United State of America, March 2015.
◮ Melo, Y.V.L; Batista, Rodrigo L.; Silva, Carlos F.M.e; Maciel, Tarcisio F.; da Silva,
Jose Mairton B.; Cavalcanti, Francisco R.P., “Uplink Power control with variable target
SINR for D2D communications underlying cellular networks,” in Vehicular Technology
Conference (VTC2015-Spring), Glasgow, Scotland, May 2015.
In parallel to the work developed during the master’s course, I have been working on other
research projects, which are in the context of power allocation and grouping:
◮ Melo, Y.V.L; Rodrigues, E.B.; Lima, F.R.M.; Maciel, Tarcisio F.; Cavalcanti, Francisco
R.P., “Evaluation of Utility-Based Adaptive Resource and Power Allocation for Real
Time Services in OFDMA Systems,” in International Telecommunications Symposium
(ITS-2014), São Paulo, Brazil, August 2014.
◮ da Silva, Jose Mairton B.; Maciel, Tarcisio F.; C. F. M. e Silva, Batista,
Rodrigo L. and Melo, Y.V.L, “User Equipment Grouping for Device-to-Device
Communications Underlying a Multi-Cell Wireless System” in EURASIP Journal on
Wireless Communications and Networking (submitted).

1.6. Scientific Production 10
In the context of the same project, I have participated on the following technical reports:
◮ Silva, Carlos F.M.e; J. Mairton B. da Silva Jr.;Melo, Y.V.L; Maciel, Tarcisio F.; and
Cavalcanti, Francisco R.P., “RRM and QoS Management for 5th Generation Wireless
Systems”, GTEL-UFC-Ericsson UFC.40, Tech. Rep., March. 2015, First Technical
Report.
◮ Batista, Rodrigo L.; Silva, Carlos F.M.e; da Silva, Jose Mairton B.; Melo, Y.V.L;
Maciel, Tarcisio F.; and Cavalcanti, Francisco R.P., “Network-Assisted Device-to-Device
Communications”, GTEL-UFC-Ericsson UFC.33, Tech. Rep., Aug. 2014, Fourth
Technical Report.
◮ Batista, Rodrigo L.; Silva, Carlos F.M.e; da Silva, Jose Mairton B.; Melo, Y.V.L;
Maciel, Tarcisio F.; and F. R. P. Cavalcanti, “Network-Assisted Device-to-Device
Communications”, GTEL-UFC-Ericsson UFC.33, Tech. Rep., Jan. 2014, Third Technical
Report.
◮ Batista, Rodrigo L.; Silva, Carlos F.M.e; da Silva, Jose Mairton B.; Melo, Y.V.L;
Maciel, Tarcisio F.; and Cavalcanti, Francisco R.P., “Network-Assisted Device-to-Device
Communications”, GTEL-UFC-Ericsson UFC.33, Tech. Rep., Aug. 2013, Second
Technical Report.
◮ Rodrigues, E.B.; Lima, F.R.M.;Melo, Y.V.L; Costa Neto, Francisco Hugo; Maciel, Tarcisio
F.; and Cavalcanti, Francisco R.P., “Analysis and Control of Trade-Offs Involving QoS
Provision”, GTEL-UFC-Ericsson UFC.33, Tech. Rep., Aug. 2013, Second Technical
Report.
◮ Batista, Rodrigo L.; Silva, Carlos F.M.e; da Silva, Jose Mairton B.; Melo, Y.V.L;
Maciel, Tarcisio F.; and Cavalcanti, Francisco R.P., “Network-Assisted Device-to-Device
Communications”, GTEL-UFC-Ericsson UFC.33, Tech. Rep., Feb. 2013, First Technical
Report.

Chapter 2Methodology and System Modeling
This chapter covers the fundamental issues about the methodology, system modeling and
features of Device-to-Device (D2D) communications, so that a reader without prior knowledge
could understand the problems and challenges in such systems. Terminology related to the
scope of this master’s thesis are presented in more detail. The remainder of this chapter report
is structured as follows. In Sections 2.1 and 2.2 described basic features of wireless network
and traditional Radio Resource Management (RRM) are presented. In the Sections 1.2 and
1.3, detailed aspects of D2D communication and RRM. In Sections 2.3, 2.4, 2.6 and 2.7 are
detailed the system model. Finally, Sections 2.8, 2.9, 2.10 presents imperfect Channel State
Information (CSI), simulation parameters and classification of metrics for energy efficiency.
2.1 Wireless System
The traditional standards of wireless communication can be classified in terms of coverage,
as shown in Figure 2.1. Wireless Personal Area Network (WPAN) is used in personal networks
(i.e. at small coverage) while Wireless Wide Area Network (WWAN) can cover several kilometers
and provide service to thousands of users.
Figure 2.1: Classification of wireless communication networks according to the coverage.
After the success of the Global System for Mobile Communications (GSM), new researches
have been conducted by academy and industry to improve general aspects as Quality of
Experience (QoE), security and cost, in addition to specific aspects as spectral efficiency,
power efficiency and new communication architectures.
The goals of the 3rd Generation (3G) of wireless communication systems were
announced by International Telecommunication Union (ITU) and called International Mobile
Telecommunications (IMT)-2000. By request of the ITU, several organizations joined the
3rd Generation Partnership Project (3GPP) and described its ideas for 3G networks. The

2.2. Radio Resource Management 12
outcome of the discussions was sent to ITU, which was responsible for the choice and
documentation of the proposed system. The system approved as 3G should provide worldwide
roaming, high transmissions rates (e.g. minimum of 2Mbit/s to low mobility users and
348Kbit/s to high mobility) [54].
2.2 Radio Resource Management
The goal of a communication company is to provide a capable network to keep the
maximum amount of clients with a determined Quality of Service (QoS) level. To ensure a
minimum QoS level is necessary to overcome several challenges (e.g. propagation, traffic and
interference) present in the cellular communication environment. In order to ensure high data
rate, coverage and satisfactory QoS it is fundamental to apply RRM, in other words, RRM is a
set of techniques, which ensure system capacity while the requirements of coverage and QoS
of the users are satisfied, overcoming difficulties inherent to radio propagation.
The traditional RRM techniques can be grouped into three categories: Power Control (PC),
mobility control (handover) and congestion control. PC is very important in systems that
employ frequency reuse, such as in Wideband Code Division Multiple Access (WCDMA). In
this case, all users use the same frequency and, therefore, it is important to have an efficient
interference control. Thus, PC chooses the lowest transmit power necessary to achieve a target
QoS level, otherwise a user poorly managed (in terms of transmit power) can harm links of
all users in system [55]. The mobility control is necessary when an user changes its location.
The system must provide the switching of all radio resources from one cell to another, so that
the user does not suffers any harm in his/her QoS [56].
The congestion control can be subdivided into admission control, load control and
scheduling. In congestion control, admission control and load control work together to offer
stability of QoS, coverage and capacity. There are strategies to block the access of new users
or make handover to balance the load, while keeping the stability of the system. In others
words, the admission control decides if a new connection must be established or not, while
load control tries to keep active communications at an acceptable QoS level by interrupting
(bad) connections in progress or performing handover. Finally, scheduling is responsible
for exploring the physical resources available (e.g. time, frequency and code) in an effort to
achieve fairness and capacity in the system [57].
2.3 Physical Resource
For Long Term Evolution (LTE), 3GPP specifies the Orthogonal Frequency Division Multiple
Access (OFDMA) technology as radio access technique. OFDMA allows to exploit frequency
and multiuser diversities, since different subcarriers present different fading if sufficiently
apart and channel fading also varies for User Equipments (UEs) at different locations. Thus,
one can allocate subcarriers to UEs depending on their channel fading state/channel quality.
As it is well-known, OFDMA is based on Orthogonal Frequency Division Multiplexing (OFDM)
and enables the transmission of multiple parallel low-rate data streams over orthogonal
subcarriers, which correspond to narrow band channels created by sub-dividing the system
bandwidth. It allows each UE to be assigned resources that are orthogonal in time and
frequency. Usually, due to signaling constraints, subcarriers are not allocated individually,
but in blocks of adjacent OFDM subcarriers, which represent the Physical Resource Blocks
(PRBs) [58]. Channel coherence bandwidth is assumed larger than the bandwidth of a PRB
leading to flat fading over each PRB. For a given PRB, the complex channel coefficients
considered in this thesis correspond to those associated with the middle subcarrier of the

2.4. Multi-cell Scenario 13
considered PRBs. In 3GPP LTE, an OFDM frame structure takes the form of a frequency-time
resource grid as shown in Figure 2.2.
Sub-frame 1 Sub-frame 2 Sub-frame T
Figure 2.2: OFDMA frame structure.
As it is seen in Figure 2.2, the bandwidth has NPRB PRBs and the Transmission Time
Intervals (TTIs) are grouped into frames, each composed of NSUBFRAME subframes, where each
subframe supports Downlink (DL) or Uplink (UL) links and takes the duration of one TTI. The
PRB is defined as one subframe in the time domain, which is divided into 14 symbols, and
12 contiguous OFDM sub-carriers spaced of 15 kHz in the frequency domain. The minimum
allocable resource in LTE systems is the PRB. This unit corresponds to the available resource
that can be assigned to UEs by an Radio Resource Allocation (RRA) function of the system.
2.4 Multi-cell Scenario
The multi-cell scenario considered in this master’s thesis corresponds to a cellular network
with Evolved Node Bs (eNBs) uniformly distributed over the coverage area. It was assumed
that each eNB is placed at the center of a cell site, which is represented by a regular
hexagon. Two 3GPP fading environments are considered: urban-microcell and macrocell [59].
Graphically, the multi-cell scenario is shown in Figure 2.3 for both 3GPP environments.
As depicted in Figure 2.3, in the urban-microcell environment the site comprises only
a single cell while in the urban-macrocell environment it comprises three cells. In the
considered notation, it is assumed that the multi-cell scenario is composed of NCELL cells
and serves a number NUE of UEs uniformly distributed over its coverage area. Each UE is
equipped with NUE-ANT omnidirectional antennas.
Each cell comprises a hotspot zone located near the cell-edge in order to model situations
in which D2D communications are likely to happen [3]. Herein, 50% of the total number of
UEs within the cell are clustered inside a 50× 120m hotspot zone while the remaining UEs are
uniformly distributed over the cell area. Considering that UEs inside the hotspot are close
to each other and far from most cellular UEs, pairs of D2D-capable UEs are obtained by a
simply random pairing procedure [3]. Figures 2.4(a) and 2.4(b) exemplify cellular and D2D
communications in such hotspot zones in the urban-microcell environment for the DL/UL
communication phase

2.4. Multi-cell Scenario 14
eNB
site
(a) Urban-microcell environment.
eNB
3-cell site
(b) Urban-macrocell environment.
Figure 2.3: Coverage area of the multi-cell scenario.
eNB
UE2
UE3
UE1
Ho
tsp
ot
D2D Rx
D2D Tx
Cellular UE
D2D link
Interfering links
Cellular link
(a) Cellular and D2D communication in DL.
eNB
UE2
UE3
UE1
Ho
tsp
ot
D2D Tx
D2D Rx
Cellular UE
D2D link
Interfering links
Cellular link
(b) Cellular and D2D communication in UL.
Figure 2.4: Communication within a cell for both directions(DL and UL), where the solid lines describethe interesting links and the dashed lines represent the interfering links.
Due to D2D communication, in both UL and DL communication phases both UEs and
cells may be transmitters or receivers at the same TTI. Let T denote the transmitters set
and R the receivers set. In a given communication phase, one can include the set of all
cells, denoted by C = {CELL1,CELL2, . . . ,CELLNCELL}, and/or the set of all UEs, denoted by
U = {UE1,UE2, . . . ,UENUE}, in the multi-cell system. In Table 2.1, transmitter and receiver
sets are summarized for both UL and DL communication phases.
Table 2.1: Transmitter and receiver sets for D2D communications in both UL and DL communicationphases.
Parameter DL UL
Transmitters set (T ) C ∪ U U
Receivers set (R) U C ∪ U
Number of transmitters (NTX) NCELL +NUE NUE
Number of receivers (NRX) NUE NCELL +NUE
It is assumed that frequency resources can be fully reused in all cells. Since the number
of UEs is typically larger than the number of available resources, UEs have to be scheduled
by the RRA algorithms. As shown in Figure 2.2, in each subframe there exist NPRB PRBs in
the system and each of them might be assigned to one or more UEs in each cell.

2.5. Wireless Channel Model 15
2.5 Wireless Channel Model
The modeling of the complex channel coefficients includes propagation effects on the
wireless channel, namely, path loss, shadowing, short-term fading and also includes the
antenna gains. The distance dependent Non-Line of Sight (NLOS) pathloss in the microcell
environment is based on the COST 231 Walfish-Ikegami NLOS model, whereas the pathloss
in the macrocell environment is based on the modified COST 231 Hata urban propagation
model. Particular aspects of path loss modeling for both urban-macrocell and urban-microcell
environments are described in [59]. Path loss model for macrocell and microcell environments
are 34.5 + 35 log10(d) and 35.7 + 38 log10(d), respectively. Slow channel variations due to
shadowing are modeled by a lognormal distribution of zero mean and standard deviation
σsh. For D2D communications, while the large-scale shadowing is defined according to
environment, the path loss model [60] employed for both environments is given by
PL(d) = 37 + 30 log10(d). (2.1)
Concerning the small-scale fading, the Spatial Channel Model (SCM) is considered. SCM is
a stochastic channel model developed by 3GPP for evaluating Multiple Input Multiple Output
(MIMO) system performance and incorporates important parameters such as phases, delays,
Doppler frequency, and ray angles [59]. The spatial characteristics of the SCM are described
by scatterers and clusters of scatterers placed over the considered scenario. Details of relevant
parameters for the SCM as well as their values are addressed in [59]. In this master’s thesis,
the SCM simulator available in [45]1 is used for obtaining the small-scale fading, which is in
accordance with the SCM specified in [59].
2.6 Transmission Model
It is necessary to calculate the Signal to Interference-plus-Noise Ratio (SINR) in both UL
and DL communication for each receiver in order to estimate data rates. When considering
the transmissions on a single PRB of the multi-cell scenario, the cellular and D2D SINR are,
respectively,
γ(t)CELLULAR
k,c,n =
∣∣∣h
(t)k,c,n
∣∣∣
2
p(t)k,c,n
C∑
c′ 6=c
K∑
k′
∣∣∣h
(t)k,c′,n
∣∣∣
2
p(t)k′,c′,n
︸ ︷︷ ︸
Interference from cellular links
+C∑
c′
M∑
m′
∣∣∣h
(t)k,tx(m′),c′,n
∣∣∣
2
p(t)rx(m′),tx(m′),c′,n
︸ ︷︷ ︸
Interference from D2D links
+η2
, (2.2)
and
γ(t)D2Drx,c,n =
∣∣∣h
(t)rx(m),tx(m),c,n
∣∣∣
2
p(t)rx(m),tx(m),c,n
C∑
c′
K∑
k′
∣∣∣h
(t)rx(m),c′,n
∣∣∣
2
p(t)k′,c′,n
︸ ︷︷ ︸
Interference from cellular links
+
C∑
c′ 6=c
M∑
m′
∣∣∣h
(t)rx(m),tx(m′),c′,n
∣∣∣
2
p(t)rx(m′),t(m′),c′,n
︸ ︷︷ ︸
Interference from D2D links
+η2
, (2.3)
where:
◮ k is the receiver in a cellular communication;
◮ c is the transmitter in a cellular communication;1The code of the SCM simulator of [45] was developed in the Wireless World Initiative New Radio (WINNER) project.
The software is licensed under the GNU General Public License (GPL).

2.7. Link-to-System Interface 16
◮ n is the PRB;
◮ t is the TTI;
◮ h(t)k,c,n is the channel that models the link between the receiver k and the transmitter c in
PRB n at TTI t;
◮ p(t)k,c,n is the transmit power allocated to transmitter c to link between the receiver k in
PRB n at TTI t;
◮ tx(m) is the transmitter D2D pair m ∈ {0, 1, . . . , R};
◮ rx(m) is the receiver D2D pair m ∈ {0, 1, . . . , R};
◮ p(t)rx(m),tx(m),c,n is the transmit power allocated to transmitter pair tx(m) to link between
the receiver rx(m) in PRB n at cell site c and TTI t;
◮ η2 is the thermal noise power at the receiver.
2.7 Link-to-System Interface
In the following, the link-to-system interface is addressed, which is used to map the
system-level metrics, such as SINR, into link-level performance figures, such as BLock Error
Rate (BLER). The link adaptation selects a proper Modulation and Coding Scheme (MCS) for
each link in order to maximize the throughput for each transmission based on effective gains
achieved by the RRA algorithm [61]. For the sake of simplicity, the MCS for each PRB of a UE
are adapted independently.
Aligned with LTE, a set of fifteen MCSs based on Quadrature Amplitude Modulation (QAM)
and different code rates are available for link adaptation [62]. Figure 2.5 shows the average
throughput curves available for link adaptation, from MCS-1 (leftmost) to MCS-15 (rightmost).
−10 −5 0 5 10 15 20 250
100
200
300
400
500
600
700
800
900
1000
Ave
rage
thro
ugh
pu
t(b
it/s)
SINR (dB)
MCS-1
MCS-2
MCS-3
MCS-4
MCS-5
MCS-6
MCS-7
MCS-8
MCS-9
MCS-10
MCS-11
MCS-12
MCS-13
MCS-14
MCS-15
Figure 2.5: Curves of link-level used for link adaptation.
In each transmission, the link adaptation is determined such that the MCS that yields the
maximum average throughput is selected. SINR thresholds can be found for each MCS, i.e.,
minimal SINR values required to use each MCS. The MCSs considered in this master’s thesis
and its respective SINR thresholds are summarized in Table 2.2.
It should be noted that the link adaptation can be affected by random variations on the
interference levels in the system. We consider that rates are computed considering ideal link

2.8. Imperfect Channel State Information 17
Table 2.2: SINR thresholds for link adaptation [62].
MCS Modulation Code rate [×1024] Rate [Bits/symbol] SINR threshold [dB]
MCS-1 QPSK 78 0.1523 −6.2
MCS-2 QPSK 120 0.2344 −5.6
MCS-3 QPSK 193 0.3770 −3.5
MCS-4 QPSK 308 0.6016 −1.5
MCS-5 QPSK 449 0.8770 0.5
MCS-6 QPSK 602 1.1758 2.5
MCS-7 16-QAM 378 1.4766 4.6
MCS-8 16-QAM 490 1.9141 6.4
MCS-9 16-QAM 616 2.4062 8.3
MCS-10 64-QAM 466 2.7305 10.4
MCS-11 64-QAM 567 3.3223 12.2
MCS-12 64-QAM 666 3.9023 14.1
MCS-13 64-QAM 772 4.5234 15.9
MCS-14 64-QAM 873 5.1152 17.7
MCS-15 64-QAM 948 5.5547 19.7
adaptation following the link level results from Figure 2.5 and that the communications occur
error-free, i.e., there is no packet reception errors and all transmitted data are successfully
received.
2.8 Imperfect Channel State Information
In this master’s thesis, the imperfect CSI issue is addressed in order to illustrate conditions
closer to real-world implementations. The CSI is reported to the transmitter via feedback
channel in which delays can occur, this delay has a negative impact in the system, because the
CSI values are outdated. For example, PC schemes are responsible for mitigating interference
based on channel gain or SINR and when these values do not show the current situation of
the scenario, the system is harmed due to too high or too low transmit power usage.
For the sake of simplicity, it is assumed that all UEs in the system experience the same
delay, which is denoted by an integer number ∆τ of TTIs. Finally, the outdated CSI is given
in ∆τ TTIs, i.e. h(t)k,c,n = h
(t+∆τ)k,c,n . This is the CSI effectively used as CSI. Figure 2.6 shows two
cases, the first case has ∆τ = 0 (perfect CSI), and the second case has ∆τ = 2 (imperfect CSI).
In the first TTI of the simulations all values are available to computer CSI in both case.
In the first case, when ∆τ = 0 the PC schemes determine transmit power based on current
TTI, because it does not have delay. In the second case, when ∆τ = 2 the PC schemes
determine transmit power based on the CSI of a past TTI. For example, the CSI of the 2nd
and 3th TTI are based on the CSI of the 1st TTI, while the CSI of the 5th and 6th TTI are based
on the CSI of the 4th TTI, and so on.
1 432 5 876 9 10
Fee
dbac
k
Beg
in
Fee
dbac
k
Fee
dbac
k
Fee
dbac
k
Fee
dbac
k
Fee
dbac
k
Fee
dbac
k
Fee
dbac
k
Fee
dbac
k
1 432 5 876 9 10
No
Fee
dba
ck
Beg
in
Fee
dbac
k
Fee
dbac
k
Fee
dbac
k
No
Fee
dbac
k
No
Fee
dbac
k
No
Fee
dbac
k
No
Fee
dbac
k
No
Fee
dbac
k
No delay
Delay
Figure 2.6: Imperfect CSI using feedback delay.

2.9. System Level Simulation 18
2.9 System Level Simulation
Computer simulation is taken as an important tool to analyze and assess the performance
of complex systems such as D2D links. Thus, a system-level simulation tool based on
the system model described in this chapter has been implemented. The main parameters
considered in the simulations are summarized in Table 2.3.
Table 2.3: Simulation parameters for urban-macrocell and microcell environments.
Parameters Urban-macrocell Urban-microcell Unit
Cellular scenario
Number of eNBs 7 7 -Inter-site distance 3 000 500 meNB height 32 12.5 mUE height 1.5 1.5 mCSI knowledge Perfect Perfect / Imperfect -Link adaptation LTE (15 MCSs) LTE (15 MCSs) [63]Interference margin Last interference Last interference [3]eNB transmit power 48 38 dBm [64]UE transmit power 24 24 dBm [64]Thermal noise power −112.4 −112.4 dBm [64]SINR threshold for lowest MCS −6.2 −6.2 dB [65]Average user speed 3 3 km/h [64]
OFDMA
Central carrier frequency 1.9 1.9 GHz [66]System bandwidth 5 5 MHzNumber of PRB 25 25Number of symbols per TTI 14 14
Propagation
Path loss model for cellular links 34.5 + 35 log10(d) 35.7 + 38 log10(d) dBPath loss model for D2D links 37 + 30 log10(d) 37 + 30 log10(d) dBLognormal shadowing std. deviation 8 10 dBFast fading model 3GPP SCM 3GPP SCM [66]
Simulation
Traffic model Full buffer Full bufferNumber of UEs per cell 4 4,8,16,32Snapshot duration 1 s 1 s
2.10 Classification of Metrics Used in Energy Efficiency
We need to understand some metrics used in this master’s thesis, which allow for the
comparison of different algorithms. According to [2], energy efficiency metrics are used to
describe the ability of a telecommunication system to minimize energy waste. For instance,
when a telecommunication system transmits more data (bits) with less power (Watt), this
system is considered more energy efficient. An energy efficiency metric can be defined at the
network level, the system level and the component level. In Table 2.4 are summarized the
main metrics to energy efficiency.
2.10.1 Energy Efficiency at the Network Level
Network level metrics are used to evaluate the energy efficiency of an entire network
or part of it. Network level metrics assess energy efficiency at the network level by
considering the features and properties of the capacity and coverage of the network. In other
words, it is normally used to evaluate a network for internal operator use or to satisfy an
environmental assessment. So, the network level is considered a metric that will cover not only
one equipment, but also a telecommunication network composed of different interworking
equipments.

2.10. Classification of Metrics Used in Energy Efficiency 19
2.10.2 Energy Efficiency at the System Level
System level metrics are related with access node, which is used to compare and analyze
RRM algorithms that approach resource allocation, power control, interference coordination
and cooperative scheduling. Important system level metrics used in this master’s thesis are
summarized bellow:
◮ Spectral efficiency is a metric that considers the amount of information tha can be
transmitted per bandwidth unit. Spectral efficiency is directly related with system
capacity, therefore, it is possible to compare capacity of two or more algorithms in a
system providing the same service by using it. In this master’s thesis spectral efficiency
is expressed in [bps/Hz/cell];
◮ Power efficiency is a essential metric, which can be modified according to RRM
algorithms, load, and environmental factors. Power efficiency can be describe as spectral
efficiency per unit of power, i.e., [bps/Hz/cell/W].
2.10.3 Energy Efficiency at the Component Level
Component level metrics can be used in the design, development and manufacture of
energy efficient devices. Component level metrics are useful to compare the hardware
of a communication device, such as Central Processing Unit (CPU), memory, power
source, Large-Scale Integration (LSI) microfabrication and power amplifier. Measuring and
understanding the energy efficiency or energy consumption of each component within the
equipment helps to identify key components in a system with regard to energy saving.
Table 2.4: Metrics Used in Energy Efficiency.
Level Units Description
Component Level
W/Gbps The ratio of energy consumption to effective system capacityGbps/W The ratio of useful work to power consumptionMIPS/W Millions of instructions per second per Watt
MFLOPS/W Millions of floating-point operations per second per watt
System Level
b/s/Hz Rate of information can be transmitted in a bandwidthb/s/Hz/W The spectral efficiency per Watt
(b·m)/s/Hz/W Rate of transmission and the transmission distance attainablefor a given bandwidth and power resources supplied
J/bit Number of bits transmitted per Joule of energy
Network Level
km2/W The ratio of coverage area to site power consumptionW/km2 The power consumed per unit area
Users/W The ratio of users served during the peak traffic hourJ/bit/m2 Number of transferred bits and the coverage area
W/bps/m2 The average power usage with respect to the averagetransmission rate and the coverage area

Chapter 3Energy Efficiency RRM Methods
This chapter covers the Power Control (PC) schemes and downtilt used in this master’s
thesis, so that a reader can understand the principle of Equal Power Allocation (EPA), Fixed
Power, Open Loop Power Control (OLPC), Closed Loop Power Control (CLPC), Soft Dropping
Power Control (SDPC), Closed Loop Soft Dropping (CLSD) and downtit. The remainder of this
chapter is structured as follows. In Section 3.1.1 is described the baselines EPA and Fixed
Power. Next, in the Sections 3.1.2, 3.1.3 and 3.1.4 are detailed LTE PC schemes, SDPC and
CLSD, respectively. Finally, in Section 3.2 downtilt is described.
3.1 PC
In this section, the PC schemes applied in this master’s thesis are described. The baseline
algorithms are the EPA and the Fixed Power. These algorithms have important function in
this master’s thesis, because they are the reference to the other PC schemes studied in this
master’s thesis.
3.1.1 EPA and Fixed Power
EPA is characterized by the equal distribution of the total transmit power PeNB or PUE
among the Physical Resource Block (PRB). In other words, the EPA scheme obtains the power
pk,n for each User Equipment (UE) k at PRB n as
Pk,n =
PeNB/NPRB, for eNB transmitters,
PUE/Nk, for UE transmitters.(3.1)
where Nk is the number of PRBs scheduled to the UE. Fixed Power is a simple PC scheme,
where pk,n = PUE/NPRB = 10 dBm, ∀k, n.
3.1.2 LTE Power Control
The OLPC and CLPC are the standard LTE power control algorithms which work with
fractional path loss compensation [63]. For this algorithm, the total transmit power pk of a
cellular or D2D UE k is given as
pk = min{PUE, P0 − αG+ 10 log10 Nk+ △}, (3.2)
where PUE is the maximum UE power, 0 ≤ α ≤ 1 is the pathloss compensation factor, G
denotes the path gain of the channel, Nk is the number of PRBs scheduled to UE k and △ is a
dynamic offset. This dynamic offset differentiates OLPC from CLPC, because OLPC does not

3.1. PC 21
have feedback and, therefore, △= 0, while CLPC has a feedback which can be computed as
△=
(Γk − γk)σ, if (Γk − γk)σ > 1,
1, if (Γk − γk)σ < 1.(3.3)
where 0 < σ ≤ 1 is the dynamic offset compensation factor. P0 is power level used to control
the target SNR Γk, which is given according to [67] as
P0 = α(Γk + PN) + (1− α)(PUE − 10 log10 Nk), (3.4)
where, for simplicity, PN is the thermal noise power at the cellular or D2D receiver,
respectively, eNB or UE. After total transmit power is updated, the power pk,n in each PRB n
according to the EPA scheme as
pk,n = pk/Nk. (3.5)
3.1.3 Soft Dropping Power Control (SDPC)
Power Control (PC) with variable SINR is an alternative approach to protect cellular and
D2D communications from mutual interference. This approach, in which the target Signal
to Interference-plus-Noise Ratio (SINR) gradually decreases as the required transmit power
rises, it is called Soft Dropping (SD) in [42,68–70]. It increases the probability of configuring a
feasible PC problem — in which the target SINR values of all co-channel links can be reached
— since links with worse quality, which demand higher power, aim at lower SINR values while
links with better quality, which demand lower power, aim at higher SINR values.
The principle of the SD algorithm is illustrated in the Figure 3.1.
p [dBm]
Γ [dB]
Pmin
Γmax
Pmax
Γmin
pk,n
Γk,n(pk,n)
Figure 3.1: Target SINR as function of a variable transmit power.
In the SDPC scheme, the transmit power per PRB of each link is iteratively adjusted in
order to find a power vector p for all UEs in the system such that the SINR γk,n of each UE k
in PRB n satisfies
γk,n(p) ≥ Γk,n(pk,n), (3.6)
where Γk,n(pk,n) is the target SINR of the UE k in the PRB n, which varies according to the
required transmit power pk,n.
The SDPC scheme uses a target SINR varying from a maximum value Γmax to a minimum
Γmin as the required transmit power goes from a minimum value Pmin to a maximum Pmax.
Here, the range ∆P = Pmax − Pmin is termed the PC range. For pk,n ≤ Pmin, one attempts to
maintain a high quality connection by aiming at a target SINR Γmax. For pk,n ≥ Pmax, one

3.1. PC 22
aims at a target SINR Γmin which is relatively easier to reach when channel conditions are
bad. Finally, for Pmin < pk,n < Pmax, one aims for a target SINR Γk,n(pk,n) that linearly (in
logarithmic scale) trades SINR for transmit power. The target SINR Γk,n(p(t)k,n) of UE k in the
PRB n at Transmission Time Interval (TTI) t is given according to
Γk,n(p(t)k,n) =
Γmax, p(t)k,n ≤ Pmin,
Γmax
(
p(t)k,n
Pmin
)ρ
, Pmin < p(t)k,n < Pmax,
Γmin, p(t)k,n ≥ Pmax,
(3.7)
where
ρ =log10(Γmin/Γmax)
log10(Pmax/Pmin). (3.8)
Then, the power per PRB of each UE is updated every transmission as follows
p(t+1)k,n = p
(t)k,n
(
Γk,n(p(t)k,n)
γk,n(p(t))
)β
, (3.9)
where β is a control parameter given by (1 − ρ)−1 [68].
Finally, whenever the achieved power p(t+1)k,n is over Pmax or under Pmin, it is constrained as
follows
p(t+1)k,n = min{Pmax,max{p
(t+1)k,n , Pmin}}. (3.10)
In this master’s thesis, the maximum power Pmax is exactly the power that would be
obtained in each resource by employing EPA among the total number of resources as
follows [43]:
Pmax =
PeNB/NPRB, for eNB transmitters,
PUE/NPRB, for UE transmitters.(3.11)
3.1.4 Closed Loop Soft Dropping (CLSD)
The CLSD is a hybrid PC scheme, because it uses features of CLPC and SDPC. The total
transmit power pk,n of each cellular or D2D UE k in PRB n at TTI t is given according to
p(t+1)k,n = min{PUE, P0 − αG+ 10 log10 Nk+ △}, (3.12)
where PUE is the maximum UE power, 0 ≤ α ≤ 1 is the pathloss compensation factor, G
denotes the path gain of the channel, Nk is the number of PRBs scheduled to the UE k, and
P0 is power level used to control the target SINR Γk,n(p(t)k,n), which is given as
P0 = α(Γk,n(p(t)k,n) + PN) + (1− α)(PUE − 10 log10 Nk), (3.13)
where, for simplicity, PN is the thermal noise power at the cellular or D2D receiver,
respectively, Evolved Node B (eNB) or UE and △ is a dynamic offset, which can be written
as
△=
(
Γk,n(p(t)k,n)− γk,n(p
(t)))
β, if(
Γk,n(p(t)k,n)− γk,n(p
(t)))
β > 1,
1, if(
Γk,n(p(t)k,n)− γk,n(p
(t)))
β < 1.(3.14)
where 0 ≤ β ≤ 1 is the dynamic offset compensation factor. The target SINR Γk,n(p(t)k,n) of UE k
in the PRB n at TTI t and ρ are given according Equations (3.7) and (3.8), respectively.

3.2. Downtilt 23
In this master’s thesis, the maximum power Pmax is given according
Pmax = PUE/NPRB (3.15)
3.2 Downtilt
Currently, wireless systems face several issues that must be considered in its development
and optimization. We can mention co-channel interference, irregular geographical terrain and
improper antenna position as some factors that can have a negative impact on the network
performance.
One simple and efficient method to reduce some of these negative effects is called downtilt.
This method is used to adjust the coverage radius of an eNB and reduce co-channel
interference by increasing cell isolation. There exist many different downtilt schemes, for
example, mechanical tilt, electrical tilt, Variable Electrical Tilt (VET) and Remote Electrical
Tilt (RET), which can be used to adjust coverage area, cell load, improve system capacity and
traffic distribution.
In [71], the authors show important concepts about downtilting and the relationship
between antenna height, downtilt angle, and coverage radius. The study outcomes that due
to the severe urban propagation environments, the coverage area control by antenna downtilt
has been reduced due to the high rise of tall buildings.
In [72], the authors discuss the impact of the Base Station (BS) mechanical antenna
downtilt scheme on the downlink capacity of a 6-sectored Wideband Code Division Multiple
Access (WCDMA) cellular network considering a macro-cellular environment. They conclude
that an optimum mechanical downtilt angle exists in all simulation scenarios, and clearly this
angle can be defined for each site and antenna configuration separately, depending on the BS
antenna height and vertical beamwidth together with the site spacing. In relation to capacity,
the downlink capacity increases with the downtilt angle but the coverage is reduced.
3.2.1 Antenna Fundamentals
Antenna is a device used for converting electromagnetic radiation in space into electrical
currents in conductors or vice-versa, depending on whether it is being used for reception or
for transmission, respectively. The pattern in which the radiating wave travels in the free
space can be controlled by using different antenna parameters. The main parameters used
in this master’s thesis are antenna azimuth orientation and antenna downtilt. These antenna
parameters that define the radiation pattern are explained below:
◮ Antenna azimuth orientation is the direction of the main lobe in the horizontal
direction with positive values for the clockwise measurements from the horizontal axis.
◮ Antenna downtilt is the direction of the main lobe in the vertical direction with positive
values for the down side tilting of the main lobe. The downtilt of the antenna radiation
pattern can be done either by mechanical downtilt or by electrical downtilt. In case of
mechanical downtilt, with changes in the downtilt values, there will be a variation in the
horizontal radiation pattern of the antenna. In electrical downtilt, only vertical antenna
radiation pattern is affected. In this master’s thesis, the terms downtilt and electrical
downtilt are used interchangeably.
This concept can be easier understood in Figure 3.2, which shows a macrocell scenario
with eNB in center and 6 UEs. Each cell site have an azimuth orientation, which are 60°,

3.2. Downtilt 24
180°and 300°. Another parameter in this scenario is the antenna downtilt, with each cell site
having 20°downtilt angle with respect to the horizontal direction.
������������������������������������������������������������������������������������������������������������������������������������������������������������������������������������������������������������������������������������������������������������������������������������������������������������������������������������������������������������������������������������������������������������������������������������������������������������������������������������������������������������������������������������������������������������������������������������������������������������������������������������������������������������������������������������������������������������������������������������������������������������������������������������������������������������������������������������������������������������������������������������������������������������������������������������������������������������������������������������������������������������������������������������������������������������������������������������������������������������������������������������������������������������������������������������������������������������������������������������������������������������������������������������������������������������������������������������������������������������������������������������������������������������������������������������������������������������������������������������������������������������������������������������������������������������������������������������������������������������������������������������������������������������������������������������������������������������������������������������������������������������������������������������������������������������������������������������������������������������������������������������������������������������������������������������������������������������������������������������������������������������������������������������������������������������������������������������������������������������������������������������������������������������������������������������������������������������������������������������������������������������������������������������������������������������������������������������������������������������������������������������������������������������������������������������������������������������������������������������������������������������������������������������������������������������������������������������������������������������������������������������������������������������������������������������������������������������������������������������������������������������������������������������������������������������������������������������������������������������������������������������������������������������������������������������������������������������������������������������������������������������������������������������������������������������������������������������������������������������������������������������������������������������������������������������������������������������������������������������������������������������������������������������������������������������������������������������������������������������������������������������������������������������������������������������������������������������������������������������������������������������������������������������������������������������������������������������������������������������������������������������������������������������������������������������������������������������������������������������������������������������������������������������������������������������������������������������������������������������������������������������������������������������������������������������������������������������������������������������������������������������������������������������������������������������������������������������������������������������������������������������������������������������������������������������������������������������������������������������������������������������������������������������������������������������������������������������������������������������������������������������������������������������������������������������������������������������������������������������������������������������������������������������������������������������������������������������������������������������������������������������������������������������������������������������������������������������������������������������������������������������������������������������������������������������������������������������������������������������������������������������������������������������������������������������������������������������������������������������������������������������������������������������������������������������������������������������������������������������������������������������������������������������������������������������������������������������������������������������������������������������������������������������������������������������������������������������������������������������������������������������������������������������������������������������������������������������������������������������������������������������������������������������������������������������������������������������������������������������������������������������������������������������������������������������������������������������������������������������������������������������������������������������������������������������������������������������������������������������������������������������������������������������������������������������������������������������������������������������������������������������������������������������������������������������������������������������������������������������������������������������������������������������������������������������������������������������������������������������������������������������������������������������������������������������������������������������������������������������������������������������������������������������������������������������������������������������������������������������������������������������������������������������������������������������������������������������������������������������������������������������������������������������������������������������������������������������������������������������������������������������������������������������������������������������������������������������������������������������
20°
60º
Azimuth Orientation
Downtilt
Figure 3.2: Azimuth orientation and downtilt in a macrocell scenario.
3.2.2 Electrical Antenna Downtilt
In this master’s thesis, electrical downtilt is used, which has some differences compared
to mechanical downtilt. The mechanical downtilt uses specific accessories, which are
responsible for modifying the antenna bracket, while electrical downtilt changes the phase
of the input signal and consequently the signal propagation directions. Each technique has
clear differences in antenna radiation. The coverage is reduced in central direction with
mechanical downtilt. However, the coverage in side directions is increased. When electrical
downtilt is used, the coverage has an uniform reduction in the direction of the antenna
azimuth orientation and the gain is reduced uniformly.
Antenna models were created to analyze electrical and mechanical downtilt in cellular
networks. In [66], only horizontal radiation patterns were used. Nevertheless, several
papers have described the improvement that can be achieved with the addition of the vertical
pattern [44, 46, 47, 49]. In this master’s thesis, a simple model for the vertical antenna
pattern proposed in [73] is used, which is an extension of the 3rd Generation Partnership
Project (3GPP) model. The horizontal model of antenna pattern in 3GPP [66] has a maximum
gain Gm = 14 dB, front to back ratio FRBh = 20 dB and a horizontal half power beamwidth
HPBWh = 70°. The horizontal antenna gain equation can be written as
Gh(ϕ) = −min{12(ϕ/HPBWh)2, FRBh}+Gm (3.16)
where ϕ, −180° ≤ ϕ ≤ 180°, is the azimuth in degrees. It is possible to see that the model does
not have antenna tilt, since it requires an antenna radiation pattern model defined over both
horizontal and vertical directions. In [73], not only other parameter values for Gm = 18 dB,
FRBh = 30 dB and HPBWh = 65° are selected, but also the vertical pattern is defined as
Gv(θ) = max{−12((θ− θtilt)/HPBWv)2, SSLv} (3.17)
where θ, −90° ≤ θ ≤ 90°, is the angle relative to the horizontal plane. The others parameters
are the electrical downtilt angle θtilt, side lobe level SSLv = 18 dB and vertical half power
beamwidth HPBWv = 6.2°. These parameters are defined based on the Kathrein 742215 data

3.2. Downtilt 25
sheet described in [73]. Through the combination of horizontal and vertical gain, it is possible
to get the antenna gain in a general direction (ϕ, θ) as
G(ϕ, θ) = Gh(ϕ) +Gv(θ). (3.18)

Chapter 4Results and Analysis
This chapter covers the results of Power Control (PC) schemes and antenna downtilt used
in this master’s thesis for different scenarios. The remainder of this chapter is structured
as follows. In Section 4.1.1 direction are presented and discussed the results to micro-cell
scenario for Downlink (DL). In the Section 4.1.2 is detailed micro-cell scenario for Uplink (UL).
Finally, in Section 4.2 the effect of antenna downtilt in a macro-cell scenario is discussed.
4.1 Power Control
To understand the behavior of PC schemes in a cellular network with underlaying
Device-to-Device (D2D) communications, it is important to analyze both DL and UL scenarios,
select PC schemes to cellular and D2D communications and adjust PC parameters based on
spectral efficiency and power efficiency.
There are several parameters in PC schemes that need to be verified, modified and updated
depending on the scenarios of interest. This section will present several scenarios, such
as macro-cell or micro-cell scenarios with different number of users and using perfect or
imperfect Channel State Information (CSI).
4.1.1 Power Control Evaluation in a Micro-cell Scenario (Downlink)
This section provides the performance assessment of a PC algorithm with variable Signal
to Interference-plus-Noise Ratio (SINR) for cellular and D2D communications in a multi-cell
scenario using DL direction. Results are obtained through system-level simulations aligned
with 3rd Generation Partnership Project (3GPP) Long Term Evolution (LTE) architecture [60,
63,64,66]. The main parameters considered in the simulations are summarized in Table 2.3,
a load of 4 users are considered.
It is important to calibrate the Soft Dropping Power Control (SDPC), otherwise, the SDPC
can harm the system. The results are compared with the baseline Equal Power Allocation
(EPA).
In the following, while the maximum target SINR is fixed in Γmax = 25 dB, which is higher
than the SINR threshold of the highest MCS [65], and the maximum power per Physical
Resource Block (PRB) Pmax is calculated by Equation (3.11), the PC range ∆P and the
minimum target SINR Γmin are varied for calibration purposes. The simulated minimum
SINR values Γmin are above the SINR threshold of the lowest MCS [65] while the simulated
minimum output power values Pmin of a User Equipment (UE) do not go below −40 dBm [74].
Figure 4.1 shows the total system spectral efficiency and the average transmit power achieved
by the Soft Dropping (SD) algorithm for cellular and D2D communications.

4.1. Power Control 27
010
2030
40
−50
510
15202.8
3
3.2
3.4
3.6
3.8
PC range [dB]Min. target SINR [dB]
To
tal
syst
em s
pec
tral
eff
icie
ncy
[b
ps/
Hz/
cell
]
P1
(a) Total system spectral efficiency achieved by cellularand D2D receivers (SD in cellular transmitters andEPA in D2D transmitters).
010
2030
40
−50
510
15203.2
3.4
3.6
3.8
4
PC range [dB]Min. target SINR [dB]
To
tal
syst
em s
pec
tral
eff
icie
ncy
[b
ps/
Hz/
cell
]
P2
(b) Total system spectral efficiency achieved by cellularand D2D receivers (SD in D2D transmitters and EPAin cellular transmitters).
010
2030
40
−50
510
152034
35
36
37
38
PC range [dB]Min. target SINR [dB]
Tra
nsm
it p
ow
er [
dB
m]
(c) Transmit power consumed by cellular transmitters(SD in cellular transmitters and EPA in D2Dtransmitters).
010
2030
40
−50
510
152014
16
18
20
22
24
PC range [dB]Min. target SINR [dB]
Tra
nsm
it p
ow
er [
dB
m]
(d) Transmit power consumed by D2D transmitters(SD in D2D transmitters and EPA in cellulartransmitters).
Figure 4.1: Calibration of SD algorithm regarding the total system spectral efficiency and transmitpower.
As depicted in Figures 4.1(a) and 4.1(b), the highest total system spectral efficiency values
are achieved for Γmin = 20 dB while the lowest transmit power values are achieved for Γmin =
−5 dB in both cellular and D2D communication cases. Therefore, I consider two operation
points: P1 is set for evaluating system spectral efficiency gains, while P2 is set for evaluating
the power saving.
For Γmin = 20 dB, the gains in system spectral efficiency practically saturate for ∆P greater
than 30 dB, as also shown in Figures 4.1(a) and 4.1(b). Thus, P1 is set as (Γmin = 20 dB,
∆P = 30 dB).
Considering 5% of reduction on the total system spectral efficiency achieved when applying
SD to D2D communications, P2 is set as (Γmin = −5 dB, ∆P = 30 dB), hereafter P1 and P2 will
be used for the remaining results.
The relative gains in terms of total system spectral efficiency and power saving achieved
by applying the SD algorithm to cellular and D2D communications in comparison to the
EPA scheme are summarized in Table 4.1 for the two considered operation points. The
application of SD in D2D communications always provides a better relative performance for
both operation points. As expected, while the operation point P1 provides better relative gains
for the total system spectral efficiency, P2 performs better in power saving.
In order to protect the cellular communications, the SD algorithm applied to cellular

4.1. Power Control 28
Table 4.1: Relative gains of performance by applying the SD algorithm to cellular and D2Dcommunications.
Total spectral eff. gain Power saving
P1 P2 P1 P2
SD in cellular transmitters +1% −19% 5% 57%SD in D2D transmitters +7% − 5% 49% 84%
transmitters is set to use the operation point P1 and the SD algorithm applied to D2D
transmitters is set to use P2. Figure 4.2 presents the Cumulative Distribution Function (CDF)
of SINR and interference power perceived by cellular and D2D receivers.
−30 −20 −10 0 10 20 30 40 50 600
20
40
60
80
100
SINR [dB]
CD
F [
%]
EPA (cellular) x EPA (D2D)
SD (cellular) x EPA (D2D)
EPA (cellular) x SD (D2D)
SD (cellular) x SD (D2D)
(a) SINR of cellular communications.
−30 −20 −10 0 10 20 30 40 50 600
20
40
60
80
100
SINR [dB]C
DF
[%
]
EPA (cellular) x EPA (D2D)
SD (cellular) x EPA (D2D)
EPA (cellular) x SD (D2D)
SD (cellular) x SD (D2D)
(b) SINR of D2D communications.
−110 −100 −90 −80 −700
20
40
60
80
100
Interference power [dBm]
CD
F [
%]
EPA (cellular) x EPA (D2D)
SD (cellular) x EPA (D2D)
EPA (cellular) x SD (D2D)
SD (cellular) x SD (D2D)
(c) Interference power of cellularcommunications.
−110 −100 −90 −80 −700
20
40
60
80
100
Interference power [dBm]
CD
F [
%]
EPA (cellular) x EPA (D2D)
SD (cellular) x EPA (D2D)
EPA (cellular) x SD (D2D)
SD (cellular) x SD (D2D)
(d) Interference power of D2D communications.
Figure 4.2: SINR and interference power of cellular and D2D communications by applying SD and EPAschemes.
Observing Figure 4.2(a), when the SD algorithm is applied to cellular communications the
SINR and interference curves are practically maintained in comparison to those obtained
using EPA. Following results shown in Table 4.1, the operation point P1 has the best
performance in terms of total system spectral efficiency. For this point, the highest SINR levels
achieved by cellular communications are marginally reduced while D2D communications
maintain the same SINR levels, as shown in Figure 4.2(b). In addition, the power reduction of
cellular transmitters does not contribute to the reduction of the interference power perceived
by both cellular and D2D receivers, as shown in Figures 4.2(c) and 4.2(d). In general,
interfering cellular transmitters are far away from D2D receivers (which only happen to be
inside hotspot zones at cell-edges) and from cellular receivers located in other cells.
When the SD algorithm is applied to D2D communications the high SINR levels achieved
by D2D communications are reduced, as shown in Figure 4.2(b), and the SINR levels of
cellular communications are considerably improved, as presented in Figure 4.2(a). This

4.1. Power Control 29
occurs because, in general, D2D transmitters act as interfering sources quite close to cellular
receivers while cellular transmitters are quite distant from D2D receivers since these are
inside hotspot zones at cell-edges. Besides that, D2D receivers are more distant from their
interfering D2D transmitters, which are regularly distributed over the multi-cell coverage area
at cell-edges, than cellular receivers.
When the SD algorithm is applied to both cellular and D2D communications at once, it is
possible to notice only tiny gains on the reduction of interference power levels, as shown in
Figures 4.2(c) and 4.2(d).
Figure 4.3 presents the system spectral efficiency for cellular communications, D2D
communications and both communications modes considering the SD algorithm applied to
D2D communications in both operation points P1 and P2.
Cellular D2D Total0
0.5
1
1.5
2
2.5
3
3.5
4
Communications
Sy
stem
sp
ectr
al e
ffic
ien
cy [
bp
s/H
z/ce
ll]
EPA (cellular) x EPA (D2D)
EPA (cellular) x SD (D2D) − P1
EPA (cellular) x SD (D2D) − P2
Figure 4.3: System spectral efficiency by applying SD and/or EPA to cellular algorithms and/or D2Dtransmitters.
As observed in Figure 4.3, the cellular communications always have their performance
improved when the SD algorithm is applied to D2D communications for both operation
points P1 and P2. For the operation point P1, there is a reduction of 49% on the power of
D2D transmitters, as shown in Table 4.1, while the performance of D2D communications
is practically maintained. The system spectral efficiency relative gains by applying the SD
algorithm to D2D communications in comparison to the EPA scheme are summarized in
Table 4.2.
Table 4.2: Relative gains of system spectral efficiency by applying the SD algorithm to D2Dcommunications.
Cellular gain D2D gain Total gain
P1 +14% 0% +7%P2 +39% −44% −5%
As shown in Table 4.2, there is a considerable improvement on the system spectral
efficiency of cellular communications for both operation points, which is accompanied with
high reduction on the transmit power of D2D transmitters (49% for P1, as mentioned before,
and 84% for P2) as shown in Table 4.1. The main reason for the gains is due to the SDPC has
a range of target SINR, while EPA provides a fixed transmit power.

4.1. Power Control 30
4.1.2 Power Control Evaluation in a Micro-cell Scenario (Uplink)
Section 4.1.1 showed results regarding the DL. The focus of this section is the UL in a
Micro-cell scenario, which is aligned with the LTE architecture [60, 63, 64, 66]. The main
parameters considered in the simulations are summarized in Table 2.3, a load of 4 users are
considered.
4.1.2.1 LTE PC schemes and SDPC
020
4060
−50
510
15202.4
2.6
2.8
3
3.2
3.4
3.6
PC range [dB]Min. SINR [dB]
To
tal
spec
tral
eff
. [b
ps/
Hz/
cell
]
(a) Total spectral efficiency (SDPC in cellular andNo-PC in D2D links).
020
4060
−50
510
1520
5
10
15
20
PC range [dB]Min. SINR [dB]
Po
wer
eff
icie
ncy
[b
ps/
Hz/
cell
/W]
(b) Cellular Power efficiency (SDPC in cellularand No-PC in D2D links).
020
4060
−50
510
15202.4
2.6
2.8
3
3.2
3.4
3.6
PC range [dB]Min. SINR [dB]
Tota
l sp
ectr
al e
ff.
[bps/
Hz/
cell
]
(c) Total spectral efficiency (No-PC in cellularand SDPC in D2D links).
020
4060
−50
510
1520
5
10
15
PC range [dB]Min. SINR [dB]
Po
wer
eff
icie
ncy
[b
ps/
Hz/
cell
/W]
(d) D2D Power efficiency (No-PC in cellular andSDPC in D2D links).
Figure 4.4: Calibration of the SDPC scheme by applying it to cellular or D2D links. The PC range∆P = 0dB gives the performance of fixed power approach. Minimum target SINR values aresimulated until Γmin = −5 dB because the SINR threshold of the lowest MCS is −6.2 dB.
In this section, SDPC, Open Loop Power Control (OLPC), Closed Loop Power Control (CLPC)
are step by step analyzed. At first, the SDPC and the OLPC are calibrated and evaluated.
After CLPC is calibrated based on the results obtained from OLPC. Finally, all PC schemes
are evaluated and compared to EPA and Fixed Power. For performance evaluation, the
energy efficiency is measured using the power efficiency metric [2], which gives the ratio
of the total system spectral efficiency achieved by cellular and D2D communications to the
average transmit power in [bps/Hz/cell/W]. As baseline, the No-PC approach with EPA among
scheduled PRBs, i.e., pk,n = PUE/Nk, and the fixed power approach with pk,n = PUE/NPRB =
10 dBm, ∀k, n are considered.
For calibration purposes, Figures 4.4 and 4.5 show the performance of the SDPC and
OLPC, respectively. For each PC scheme, there are operating points responsible for high
energy efficiency and reasonable total system spectral efficiency gains.
In order to protect cellular communications, operating points are chosen for each PC
scheme that maintain the total spectral efficiency or achieve the highest power efficiency
gains for D2D communications. The relative performance gains and the considered operating

4.1. Power Control 31
00.2
0.40.6
0.81
10
15
20
252.4
2.6
2.8
3
3.2
3.4
3.6
αTarget SNR [dB]
To
tal
spec
tral
eff
. [b
ps/
Hz/
cell
]
(a) Total spectral efficiency (OLPC in cellularand No-PC in D2D links).
00.2
0.40.6
0.81
10
15
20
255
10
15
αTarget SNR [dB]
Pow
er e
ffic
iency
[bps/
Hz/
cell
/W]
(b) Cellular Power efficiency (OLPC in cellularand No-PC in D2D links).
00.2
0.40.6
0.81
10
15
20
252.4
2.6
2.8
3
3.2
3.4
3.6
αTarget SNR [dB]
To
tal
spec
tral
eff
. [b
ps/
Hz/
cell
]
(c) Total spectral efficiency (No-PC in cellularand OLPC in D2D links).
00.2
0.40.6
0.81
10
15
20
250
10
20
30
αTarget SNR [dB]P
ow
er e
ffic
iency
[bps/
Hz/
cell
/W]
(d) D2D Power efficiency (No-PC in cellular andOLPC in D2D links).
Figure 4.5: Calibration of the OLPC scheme by applying it to cellular or D2D links. The pathlosscompensation factor α = 0 gives the No-PC performance.
points for each PC scheme are summarized in Table 4.3. While the SDPC scheme performs
better for cellular communications, the OLPC scheme is better for D2D communications in
terms of power efficiency. Even when OLPC uses, e.g., an operating point (Γk = 10 dB, α = 0.3)
(not shown in the table) providing a total system spectral efficiency loss of 9% like the SDPC,
its power efficiency gain of 297% is even higher than the 114% of the SDPC scheme.
Table 4.3: Relative gains by applying SDPC and OLPC to cellular or D2D links in comparison to theNo-PC approach (%).
Total spectral efficiency loss Power efficiency gain
SDPC OLPC SDPC OLPC
Cellular links 0 0 79 3D2D links 9 20 114 379
Operating points for cellular communications:SDPC (Γmin = 20 dB, ∆P = 10 dB), OLPC (Γk = 25 dB, α = 0.3)
Operating points for D2D communications:SDPC (Γmin = −5 dB, ∆P = 20 dB), OLPC (Γk = 10 dB, α = 0.5)
In order to understand the power efficiency gains presented in Table 4.3, Figure 4.6 shows
the CDFs of the SINR and interference power levels obtained by applying SDPC and OLPC
schemes to cellular or D2D links. By comparing the SDPC scheme to fixed power approach
both applied to cellular links, the SDPC scheme only improves the highest SINR levels of
cellular links, as shown in Figure 4.6(a). As the SDPC scheme uses the maximum power for all
UEs with SINR values below the minimum SINR target, their transmit power values are fixed
by Equation (3.11) as in the fixed power approach. The No-PC approach achieves higher SINR
levels than the fixed power approach, but its interference power levels are also higher. On its

4.1. Power Control 32
turn, the OLPC scheme reduces the SINR levels of D2D links, because the power reduction
does not considerably improve their interference power levels, as shown in Figure 4.6(d), but
it provides the closest performance for cellular links compared with the conventional scenario,
see Figures 4.6(a) and 4.6(c).
−30 −20 −10 0 10 20 30 40 500
20
40
60
80
100
SINR [dB]
CD
F[%
]
EPA (cellular)
Fix Pwr (cellular) x EPA (D2D)
SDPC (cellular) x EPA (D2D)
EPA (cellular) x EPA (D2D)
EPA (cellular) x OLPC (D2D)
(a) SINR of cellular communications.
−30 −20 −10 0 10 20 30 40 500
20
40
60
80
100
SINR [dB]
CD
F[%
]
Fix Pwr (cellular) x EPA (D2D)
SDPC (cellular) x EPA (D2D)
EPA (cellular) x EPA (D2D)
EPA (cellular) x OLPC (D2D)
(b) SINR of D2D communications.
−130 −120 −110 −100 −90 −80 −70 −600
20
40
60
80
100
Interference power [dBm]
CDF[%]
EPA (cellular)
Fix Pwr (cellular) x EPA (D2D)
SDPC (cellular) x EPA (D2D)
EPA (cellular) x EPA (D2D)
EPA (cellular) x OLPC (D2D)
(c) Interference power of cellular communications.
−130 −120 −110 −100 −90 −80 −70 −600
20
40
60
80
100
Interference power [dBm]
CDF[%]
Fix Pwr (cellular) x EPA (D2D)
SDPC (cellular) x EPA (D2D)
EPA (cellular) x EPA (D2D)
EPA (cellular) x OLPC (D2D)
(d) Interference power of D2D communications.
Figure 4.6: SINR and interference power levels by applying SDPC and OLPC schemes to cellular orD2D links. No-PC and fixed power approaches are considered as baselines. No-PC (cellular)represents the conventional scenario without D2D communications underlaying the cellularnetwork.
As the SDPC scheme aims mainly at the reduction of high SINR levels (which reduces the
power consumption without significantly harming the system spectral efficiency) while the
OLPC scheme compensates the pathloss even for low SINR levels, the SDPC scheme provides
a better power efficiency for cellular communications. For D2D communications, the OLPC
scheme achieves a reduced power consumption by exploiting the UEs’ physical proximity. As
the OLPC scheme applied to D2D links provides the highest energy efficiency gains, Figure 4.7
presents the system spectral efficiency of cellular and D2D communications by applying OLPC
to D2D links and no PC for cellular links.
As it can be seen, the factor α can be used to control the performance trade-off between
cellular and D2D communications. We also see that for α = 1.0, which provides the lowest
possible transmit power levels for D2D transmitters (5 dBm), the system spectral efficiency
for D2D communications is practically zero. It means that D2D transmitters are introducing
interference to the system but D2D receivers are not achieving the SINR threshold of the
lowest MCS to attain communication. Thus, the minimum cost for enabling system spectral
efficiency gains for D2D communications considering the most favorable scenario for sharing
resources in all cells represents a minimal impact of 11% on the system spectral efficiency
of cellular UEs. To get gains in the total system spectral efficiency over the conventional

4.1. Power Control 33
0
0.5
1
1.5
2
2.5
3
3.5
To
tal
syst
em s
pec
tral
eff
icie
ncy
[b
ps/
Hz/
cell
]
Cellular communications
D2D communications
11%
Pathloss compensation factor α0.0 0.1 0.2 0.3 0.4 0.5 0.6 0.7 0.8 0.9 1.0 Conv.
Figure 4.7: Total system spectral efficiency by applying OLPC to D2D links without PC for cellular links(No-PC approach). The pathloss compensation factor α of the OLPC scheme is varied fortarget SNR Γk = 10 dB. The conventional scenario considers the No-PC approach in itscellular links.
scenario, α should be lower than 0.6. For α = 0.5, the impact is 13%, but the power efficiency
is maximum, as it can be seen in Figure 4.5(d). The highest impact (which is 30%) is obtained
for α = 0, i.e., when the maximum power PUE is employed to D2D links as in the No-PC
approach.
The relative performance gains of OLPC for D2D links by varying α are summarized in
Table 4.4. Most α values provide huge power saving gains (measured against the total transmit
power used for transmission) but low α values are preferred to avoid high system spectral
efficiency losses. To achieve high power efficiency gains for D2D links, α should be {0.4, 0.5}.
Table 4.4: Relative performance gains of OLPC for D2D links compared with no-PC for D2D links (%).
α 0.1 0.2 0.3 0.4 0.5 0.6
Spectral efficiency loss 13 28 43 59 73 84Power saving gain 52 75 86 91 94 96Power efficiency gain 81 188 298 373 379 311
Using the same parameters of Table 4.3, it is possible to analyze the CLPC, which is
another LTE PC scheme. The parameter α = 0.5 is defined as the best value to provide power
efficiency at OLPC, see Figure 4.5 and the same α is used at CLPC. The CLPC has a new
parameter called dynamic offset compensation factor σ, which needs to be calibrated. It is
possible to decrease the SINR level of the best users and increase the SINR of the worst users
to different values of σ. Table 4.5 shows the SINR values of the of 5th and 95th percentiles
to both communications, and the difference between those percentiles to different values
of σ. Remembering if the value of σ is small, the users can achieve the same SINR level.
Finally, σ = 0.8 is set, because it has the smallest difference between percentiles, as shown in
Table 4.5.
After the choice of parameters, the PC schemes are evaluated. Figure 4.8 shows the CDFs
of the SINR values for cellular or D2D links, as it can be seen in Figure 4.8(a), the behavior
of SINR levels of cellular links, when the same PC scheme is applied to both communications.
Comparing OLPC and CLPC it is possible to perceive that CLPC improves the worst users
without compromising the best users.
The SDPC modifies the power of users who show SINR between Γmax and Γmin and keeps
a fixed power value given by Equation (3.11) to user’s SINR values below Γmin. Comparing
EPA with both LTE PC schemes and SDPC, a decrease in the SINR level of the users with

4.1. Power Control 34
Table 4.5: Calibration of σ for CLPC
σ SINR5% SINR95% SINR95% − SINR5%
Cellular Communication
0.2 -26.48 -1.34 25.140.4 -21.96 0.16 22.120.6 -20.45 1.17 21.620.8 -15.92 3.18 19.101.0 -19.94 9.21 29.10
D2D Communication
0.2 -13.41 8.70 22.110.4 -10.39 8.21 18.600.6 -9.38 8.21 17.590.8 -7.87 9.20 17.071.0 -10.00 10.73 20.73
high SINR level can be seen, and this behavior provides a better power efficiency to cellular
communication.
Figure 4.8(b) presents SINR levels of D2D links, when PC scheme is applied to both
communications. It can be noted that the SINR has the worst level when OLPC is applied
in D2D links. Special attention must be given to the OLPC and CLPC, since there is a fall
of SINR level when OLPC is used. This fall is due to the high path gain caused by proximity
between D2D transmitter and receiver; however, CLPC is not affected, because there is a
feedback that adjusts transmit power levels. The SDPC keeps the same SINR to users with
low SINR level and improves the users with high SINR level in relation the CLPC.
−30 −20 −10 0 10 20 30 40 500
20
40
60
80
100
CD
F (
%)
SINR (dB)
EPA Cell
SDPC Cell
OLPC Cell
CLPC Cell
(a) SINR of cellular communications.
−30 −20 −10 0 10 20 30 40 500
20
40
60
80
100
CD
F (
%)
SINR (dB)
EPA D2D
SDPC D2D
OLPC D2D
CLPC D2D
(b) SINR of D2D communications.
Figure 4.8: SINR by applying power control schemes to cellular and D2D links.
To further analyze the performance of PC schemes, Figure 4.9 shows the behavior of PC
schemes in relation to spectral and power efficiency. PC schemes with high spectral efficiency
are situated at the top of figure and high power efficiency are situated in the right of the figure.
From a cellular communications point of view, it is possible to note that EPA has the highest
spectral efficiency and the lowest power efficiency among the studied PC schemes, because
it always uses high transmit power. CLPC and OLPC have about the same power efficiency,
however, CLPC has a feedback, which increases its spectral efficiency. Both LTE PC schemes
have a spectral efficiency higher than SDPC, because SDPC provides a balance between
spectral and power efficiency. So that the SDPC keeps a reasonable spectral efficiency and
provides a gain of 70% in power efficiency compared with LTE PC schemes.
Considering D2D communications, EPA keeps the same behavior of the cellular

4.1. Power Control 35
communications. Both LTE PC schemes have low level of spectral efficiency, however, OLPC
has a little more decreased spectral efficiency, achieving the highest power efficiency. When
SDPC and LTE PC schemes are compared, it is possible to note that SDPC shows better
spectral efficiency. However, when power efficiency is compared, SDPC has a gain of 35% in
relation to CLPC and a loss of 120% in relation to OLPC. Another result that can be noted
is that PC schemes in the middle of the Figure 4.9, it can be combined to provide a tradeoff
between spectral efficiency and power efficiency.
5 10 15 20 25 30
0.3
0.8
1.3
1.8
SDPC
OLPC
CLPC
EPA
SDPC
OLPC
CLPC
EPA
Power efficiency [bps/Hz/cell/W]
Spec
tral
effi
cien
cy[b
ps/
Hz/
cell
]Cellular comm.D2D comm.
Figure 4.9: Performance of PC schemes for cellular and D2D communications.
4.1.2.2 Closed Loop Soft Dropping (CLSD) a hybrid PC scheme
The CLSD is a hybrid PC scheme based on CLPC and SDPC. For performance evaluation,
CLSD parameters are set with the values that have provided a good performance to CLPC
and SDPC in their original form in the Section 4.1.2.1. The parameters are summarized in
Table 4.6.
Table 4.6: CLSD parameters
Parameter Cellular D2D
α 0.3 0.5β 0.8 0.8∆P 10 dB 20 dBΓmax 25 dB 25 dBΓmin 20 dB −5 dB
β and σ have the same function
Figure 4.10 shows the results obtained in terms of spectral efficiency. CLSD provides the
best results of total spectral efficiency, due to knowledge of path gain, current SINR and to be
able of modifing target SINR.
Another way to view results of Figure 4.10 is in terms of relative gains. Table 4.7
summarizes spectral efficiency relative gains when CLSD is compared with other algorithms.
CLSD provides a reasonable performance to cellular communication with the highest and
lowest relative gain are of 91% and 22% compared with SDPC and EPA, respectively. From
a D2D communication point of view, CLSD has a reasonable spectral efficiency gains with
the highest and lowest relative gains are 275% and −7% compared with OLPC and EPA,
respectively.
Figure 4.11 determines the power efficiency of the PC schemes. CLSD achieves
18 bps/Hz/cell/W for cellular communications, which is the best result among all studied PC
schemes, while EPA has the lowest power efficiency achieving 7 bps/Hz/cell/W. In other words,
CLSD manages smartly the power transmit and EPA wastes it, because the transmit power is
high for all users when EPA is used. From D2D point of view, CLSD provides the second best

4.1. Power Control 36
EPA OLPC CLPC SDPC CLSD0
0.5
1
1.5
2
2.5
3
3.5
4
Sys
tem
spe
ctra
l effi
cien
cy [b
ps/H
z/ce
ll]
CellularD2DTotal
Figure 4.10: Spectral efficiency of PC schemes for cellular and D2D communications.
Table 4.7: Spectral efficiency relative gains applying CLSD compared with other PC schemes (%).
EPA OLPC CLPC SDPC
Cellular links 22 76 69 91D2D links -7 275 114 53
Total 8 124 85 73
D2D power efficiency. The reason of this high power efficiency for OLPC is the path gain of
D2D communications described in Section 4.1.2.1.
The power efficiency relative gains of CLSD compared with other PC schemes are described
in Table 4.8. It is important to highlight the highest relative gain to cellular and D2D
communications, which are 157% and 100% when compared with EPA.
It is important to highlight that the CLSD has this good performance due to knowledge of
path gain, current SINR and to be able of modify target SINR. These information are useful
to improve spectral and power efficiency of the system, however, the complexity of CLSD and
the number of subcarriers used to feedback is higher compared with other PC schemes.
EPA OLPC CLPC SDPC CLSD0
5
10
15
20
25
30
Pow
er e
ffici
ency
[bps
/Hz/
cell/
W]
CellularD2D
Figure 4.11: Power efficiency of PC schemes for cellular and D2D communications.

4.1. Power Control 37
Table 4.8: Power efficiency relative gains applying CLSD compared with other PC schemes (%).
EPA OLPC CLPC SDPC
Cellular links 157 80 75 29D2D links 100 -59 41 9
4.1.2.3 Impact of loads in PC schemes
The analysis of PC schemes in a scenario with different loads is important to understand
if they explore well the diversity that each user provides in the system. In the simulations,
both communications use the same PC scheme and its total spectral and power efficiency are
evaluated. It is seen in Figure 4.12 that EPA achieves good spectral efficiency when the offered
load increases, it surpass SDPC, OLPC and CLPC, however, this efficiency range decreases for
high loads, because EPA does not explore well the diversity that each user provides.
When SDPC is used in both communications, it achieves better results than OLPC and
CLPC, because it has feedback and variable target SINR. These two features offer the
opportunity of increasing the SINR of the worst users and keep reasonable SINR levels for
the best users.
Taking a look at LTE PC schemes, it is perceptible that the OLPC and CLPC have a similar
behavior. However, OLPC has a marginal loss due to the lack of feedback, which is present in
CLPC. Finally, the CLSD has achieved the best performance for all considered loads, because
it uses the benefits of both CLPC and SDPC.
4 8 16 321
2
3
4
5
6
7
Load (Number of Users)
Tot
al s
pect
ral e
ff. [b
ps/H
z/ce
ll]
EPAOLPCCLPCSDPCCLSD
Figure 4.12: Total spectral efficiency comparison for different loads.
From Figure 4.13(a), one sees that EPA shows the worst result in terms of power efficiency
to cellular communications. This is an indication that EPA fails in explore the diversity of
users, given that it always uses the maximum transmit power regardless of user SINR.
The OLPC and CLPC provide a similar power efficiency for four users in each cell. However,
CLPC for high loads attains a significant power efficiency gain compared with OLPC. This
results show that only knowledge of path gain is not enough to provide a good power efficiency
to cellular communications, because it shows a low information about user in the network
to PC scheme. In order to offer better power efficiency to cellular communications SDPC and
CLSD are the best choices, which achieve good performance in a scenario with high loads due
to explore well the diversity.
It may be seen in Figure 4.13(b) that incorporating EPA, D2D communications do not show
good performance in terms of power efficiency. It is possible to note that the power efficiency
decreases after 8 users in a cell, because the interference level is so high that harms the

4.1. Power Control 38
spectral efficiency of D2D users. The OLPC keeps a good performance for all offered loads.
This behavior can be explained by the high value of the path gain due to the proximity of
communications occurring inside the hotspot.
It is interesting to see that CLPC shows a low power efficiency compared with OLPC,
because it tries to keep a good spectral efficiency, therefore, it does not decrease the transmit
power as much as OLPC. The SDPC and CLSD for low loads have a similar power efficiency
for D2D communications, however, CLSD is more efficiency for high loads.
The reason for the power efficiency gain of CLSD is that it has not only information about
the path gain, which decreases the power transmit like OLPC, but also it has variable target
SINR that provides a good total spectral efficiency.
4 8 16 320
10
20
30
40
50
60
70
80
Load (Number of Users)
Pow
er e
ffici
ency
[bps
/Hz/
cell/
W]
EPAOLPCCLPCSDPCCLSD
(a) Power efficiency for cellular communications.
4 8 16 320
50
100
150
Load (Number of Users)
Pow
er e
ffici
ency
[bps
/Hz/
cell/
W]
EPAOLPCCLPCSDPCCLSD
(b) Power efficiency for D2D communications.
Figure 4.13: Power efficiency comparison for different loads in cellular and D2D communications.
4.1.2.4 Imperfect CSI
Features such as multi-user scheduling operating in fading channels can be used to
explore diversity gains and improve the quality of communications in cellular networks. For
this purpose, precise CSI (i.e. perfect CSI) needs to be available at the eNB to perform rate
adaptation and scheduling. However, in real cellular networks, CSI is impaired by channel
estimation errors and feedback delays. This impact is high in networks where the data is sent
to a central point, because high backhaul latency can cause CSI imperfections, resulting in
performance degradations [75,76].
In order to understand the effects of imperfect CSI in D2D communications underlaying
cellular networks, a scenario where both communications use the same PC scheme with the
parameters described in Section 4.1.2.1 and Section 4.1.2.2 is used. Therein, each site has
16 UEs operating in UL. The reason for choosing this scenario is due to the interference level
and effects of delay feedback being significant.
Figure 4.14 shows the total spectral efficiency to different delays ranging from 0 TTI (no
delay) to 5 TTIs. It is noticeable that without feedback delays the CLSD has the best spectral
efficiency, followed by EPA, SDPC, CLPC and OLPC. All PC schemes decrease its spectral
efficiency when delay increases, however, each PC scheme has a different drop rate. The EPA
and OLPC have slight loss of spectral efficiency compared with other PC schemes, because
EPA and OLPC are not influenced significantly by feedback. In other words, EPA does not
need feedback, because it always uses the same transmit power and OLPC requires only G
(path gain), which does not suffer a significant modification from one Transmission Time

4.1. Power Control 39
Interval (TTI) to another. The main factor that harms EPA and OLPC is scheduling, because
eNB allocates PRB to users, which decrease their quality of channel from one TTI to another.
The CLPC has an accentuated loss of spectral efficiency compared with EPA and OLPC,
because CLPC computes transmit power based on G (path gain) and current SINR, so CLPC
computes transmit power using two out-of-date measures.
The SDPC and CLSD have the worst spectral efficiency for high delays, because SDPC is
dependent on the current SINR, target SINR and previous transmit power. Moreover, CLSD is
not only dependent on same parameters as SDPC measures, but also on CLPC measures.
The PC schemes have a similar spectral efficiency when the delay increases up to one
TTI, the spectral efficiency keeps between 4.8 bps/Hz/cell and 5.4 bps/Hz/cell. This difference
becomes expressive when delay is higher than one TTI, in this case the difference between
values achieves 3.4 bps/Hz/cell when delay is 5 TTIs.
0 1 2 3 4 50
1
2
3
4
5
6
Delay (TTI)
Tot
al s
pect
ral e
ff. [b
ps/H
z/ce
ll]
EPAOLPCCLPCSDPCCLSD
Figure 4.14: Total spectral efficiency for different delays.
As it is shown in Figure 4.15(a), cellular power efficiency has the same behavior of spectral
efficiency, that is to say, power efficiency decreases for high delay. SDPC and CLSD have the
best results in terms of power efficiency when CSI is perfect, however, these PC schemes are
affected negatively after a delay of 2 TTIs. CLPC has an acceptable power efficiency for low
delay values, however, it is outweighed by OLPC for high delay. EPA has the worst results in
terms of power efficiency up to a delay of 4 TTI and after this delay value, CLSD has the worst
performance due to the number of out-of-date measurements.
Figure 4.15(b) presents D2D power efficiency, it is noticeable that OLPC has the lowest loss
of power efficiency compared with other PC schemes. This behavior is due to G (path gain) of
D2D communications to be similar from one TTI to another, due to the proximity among UEs
communicating in D2D mode. Among the PC schemes, SDPC and CLSD have a high power
efficiency loss, while CLPC keeps a reasonable performance.
The PC schemes based on many measures suffer a significant loss of spectral and power
efficiency, when feedback delay occurs. In terms of total spectral efficiency and cellular power
efficiency, feedback delay becomes significant when the system has a delay higher than 2
TTIs, thus it is better to use PC schemes simpler to provide the best efficiency to the system.
It is interesting to note that OLPC keeps a good power efficiency to D2D communications
independent of the delay, because OLPC provides transmit power based on the metric G (path
gain), which does not vary significantly among TTIs.

4.1. Power Control 40
0 1 2 3 4 50
10
20
30
40
50
Delay (TTI)
Pow
er e
ffici
ency
[bps
/Hz/
cell/
W]
EPAOLPCCLPCSDPCCLSD
(a) Power efficiency for cellular communications.
0 1 2 3 4 50
20
40
60
80
100
Delay (TTI)
Pow
er e
ffici
ency
[bps
/Hz/
cell/
W]
EPAOLPCCLPCSDPCCLSD
(b) Power efficiency for D2D communications.
Figure 4.15: Power efficiency for different delays in cellular and D2D communications.
4.1.2.5 Convergence of SD
It is important to verify the convergence of SD, an analytical analysis of convergence
is demonstrated in Appendix A. In this master’s thesis, a complementary analysis using
computational simulations is also realized. It is important to make clear that the convergence
is influenced by parameters values, loads, cell size and CSI. So, a scenario with 8 users,
using SD parameters ∆P = 30 dB, Γmax = 25 dB and Γmin = −5 dB was selected for analysis
considering both cellular and D2D communications.
In order to show the convergence of SD, it was used Mean Squared Error (MSE), which is
based on values of target SINR Γk,n and current SINR γk,n of user k scheduled to PRB n in each
cell site. In Figure 4.16, I illustrate the step-by-step on how the convergence is calculated.
First step is to create a matrix that contains the difference between target SINR Γk,n and user
SINR γk,n squared. Second step is to create another matrix, where each element corresponds
the mean of difference between target SINR Γk,n and user SINR γk,n squared to each TTI. Third
step represents the mean to each sample. Finally, the last step aims at the normalization of
the elements.
. .
Sites
PRBs TTIs
Sam
ples
. . .
1 . . .
( )γΓ nk,nk,2 −
Mean
Normalised
Mean
∑∑ −= =⋅
N Nk PRB
k nSitePRB NN 1 1
2
)γΓ( nk,nk,1
(1) (2)
(3)
(4)
.
Figure 4.16: Detailed description of calculation of convergence.
Figure 4.17(a) shows the MSE for the SINR of cellular and D2D communications, the mean
of difference between target SINR Γk,n and user SINR γk,n squared. It shows that SD keep a
decrease from 153 to 5 , this means that the variation of the difference was about 10 dB, in
other words, the SDPC improved the accuracy of target SINR in 10 dB.
Figure 4.17(b) shows the convergence using normalization of cellular communications in
DL/UL and D2D communications, respectively. In both communications, the Normalized
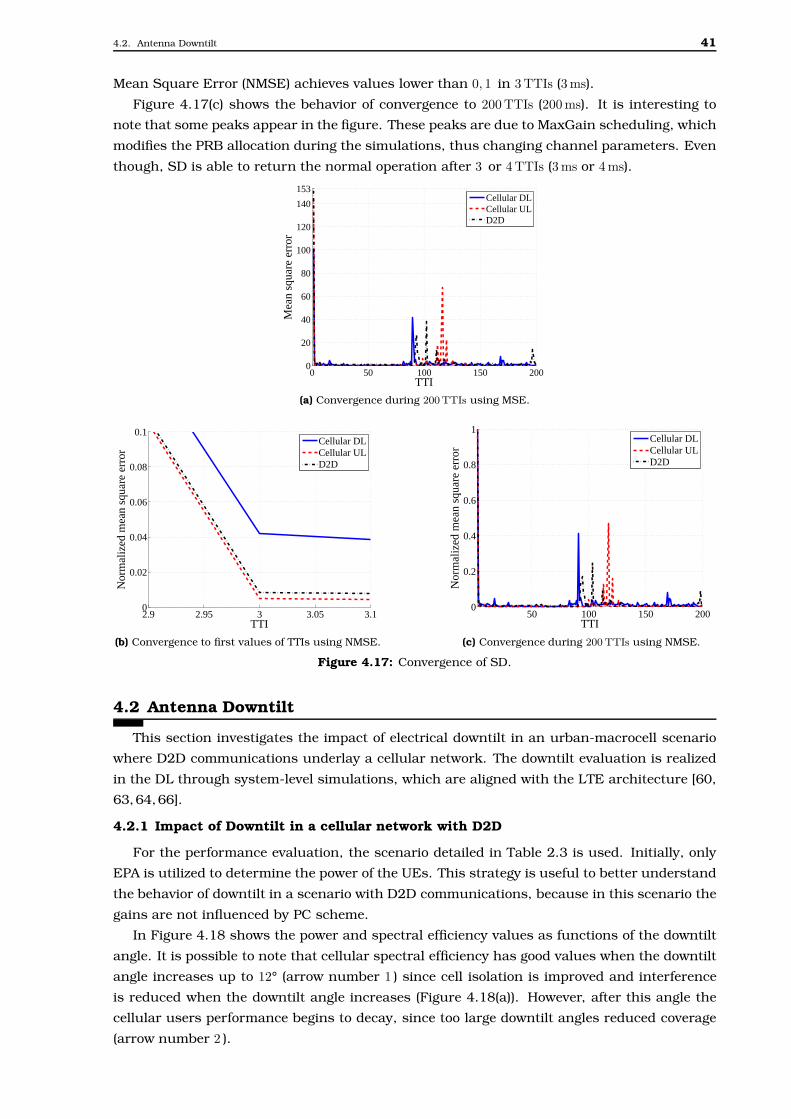
4.2. Antenna Downtilt 41
Mean Square Error (NMSE) achieves values lower than 0, 1 in 3TTIs (3ms).
Figure 4.17(c) shows the behavior of convergence to 200TTIs (200ms). It is interesting to
note that some peaks appear in the figure. These peaks are due to MaxGain scheduling, which
modifies the PRB allocation during the simulations, thus changing channel parameters. Even
though, SD is able to return the normal operation after 3 or 4TTIs (3ms or 4ms).
0 50 100 150 2000
20
40
60
80
100
120
140
153
TTI
Mea
n sq
uare
err
or
Cellular DLCellular ULD2D
(a) Convergence during 200TTIs using MSE.
2.9 2.95 3 3.05 3.10
0.02
0.04
0.06
0.08
0.1
TTI
Nor
mal
ized
mea
n sq
uare
err
or
Cellular DLCellular ULD2D
(b) Convergence to first values of TTIs using NMSE.
50 100 150 2000
0.2
0.4
0.6
0.8
1
TTI
Nor
mal
ized
mea
n sq
uare
err
or
Cellular DLCellular ULD2D
(c) Convergence during 200TTIs using NMSE.
Figure 4.17: Convergence of SD.
4.2 Antenna Downtilt
This section investigates the impact of electrical downtilt in an urban-macrocell scenario
where D2D communications underlay a cellular network. The downtilt evaluation is realized
in the DL through system-level simulations, which are aligned with the LTE architecture [60,
63,64,66].
4.2.1 Impact of Downtilt in a cellular network with D2D
For the performance evaluation, the scenario detailed in Table 2.3 is used. Initially, only
EPA is utilized to determine the power of the UEs. This strategy is useful to better understand
the behavior of downtilt in a scenario with D2D communications, because in this scenario the
gains are not influenced by PC scheme.
In Figure 4.18 shows the power and spectral efficiency values as functions of the downtilt
angle. It is possible to note that cellular spectral efficiency has good values when the downtilt
angle increases up to 12° (arrow number 1 ) since cell isolation is improved and interference
is reduced when the downtilt angle increases (Figure 4.18(a)). However, after this angle the
cellular users performance begins to decay, since too large downtilt angles reduced coverage
(arrow number 2 ).

4.2. Antenna Downtilt 42
1 2 3 4 5 6 7 8 9 10 11 12 13 14 15 16 170.5
1
1.5
2
2.5
3
3.5
4
Angle (°)
Cel
lula
r sp
ectr
al e
ff. [b
ps/
Hz/
cell
]
2
1
(a) Cellular spectral efficiency.
1 2 3 4 5 6 7 8 9 10 11 12 13 14 15 16 170.2
0.4
0.6
0.8
1
1.2
1.4
Angle (°)
D2D
spec
tral
eff
. [b
ps/
Hz/
cell
]
3
4
(b) D2D spectral efficiency.
1 2 3 4 5 6 7 8 9 10 11 12 13 14 15 16 171
1.5
2
2.5
3
3.5
4
4.5
Angle (°)
Tota
l sp
ectr
al e
ff. [b
ps/
Hz/
cell
]
(c) Total spectral efficiency.
1 2 3 4 5 6 7 8 9 10 11 12 13 14 15 16 170
1
2
3
4
5
6
Angle (°)
Pow
er e
ffic
iency
[bps/
Hz/
cell
/W]
Cellular Communications
D2D Communications
(d) Power efficiency.
Figure 4.18: Behavior of spectral and power efficiency for different levels of tilt.
From a D2D point of view (Figure 4.18(b)), spectral efficiency has the opposite behavior
compared with cellular UEs. At first, a spectral efficiency decline occurs, which reaches the
worst result at 7° (arrow number 3 ), since the Evolved Node B (eNB) interference is focused in
the hotspot area near the cell edge. After 7°, it is possible to improve D2D spectral efficiency,
because the interference inside hotspot zone decreases (arrow number 4 ).
Figure 4.18(c) shows the total spectral efficiency to downtilt angles between 1° and 17°.
The rectangle determines the range of downtilt angles where the total spectral efficiency is
higher than without downtilt (0°) and does not harm the coverage area of cellular users. In
other words, angles between 8° and 12° improve spectral efficiency of system, while preserving
cellular communications.
In the following, it is adopted an angle of 12° for downtilt in the simulations, since it
corresponds to the angle that provided the best total spectral efficiency in the previous
evaluation. Then, the influence of the downtilt angle in the SINR and interference curves
is analyzed, as illustrated in Figure 4.19. It is shown in Figures 4.19(a) that using downtilt
it is possible to improve the SINR curves for cellular and D2D communications. The analysis
at 50% in Figure 4.19(b) confirms the results of the SINR curves, because the interference of
cellular and D2D communications decreases 10 dB and 4 dB, respectively.
Figure 4.20 compares the system spectral efficiency of cellular and D2D communications
applying 12° as downtilt angle at eNB.
D2D communications do not get a significant gain in spectral efficiency, while cellular
communications get a performance which is better than in the conventional scenario, where
0° of downtilt is used. The total spectral efficiency achieves 58% of gain, so that it can be
concluded that angles between 8° and 12° offer the possibility to keep D2D communications’

4.2. Antenna Downtilt 43
−30 −25 −20 −15 −10 −5 0 5 10 15 20 25 30 35 400
10
20
30
40
50
60
70
80
90
100
CD
F (
%)
SINR (dB)
0 ° − Cell users
0 ° − D2D users
12 ° − Cell users
12 ° − D2D users
(a) SINR Curves.
−95 −90 −85 −80 −75 −70 −65 −60 −55 −500
10
20
30
40
50
60
70
80
90
100
CD
F (
%)
Interference power (dBm)
0 ° − Cell users
0 ° − D2D users
12 ° − Cell users
12 ° − D2D users
(b) Interference Curves.
Figure 4.19: SINR and interference levels by applying downtilt.
quality while improving considerably the performance of cellular communications. In terms
of power efficiency, the behavior is shown in Figure 4.18(d) and the values are summarized in
Table 4.9. It is possible to note that angles between 11° and 12° have better power efficiency to
both communications, while angles lower than 11° do not have good power efficiency for D2D
communications.
Table 4.9: Power efficiency relative gains for different downtilt angles compared without downtilt (%).
8◦ 9◦ 10◦ 11◦ 12◦
Cellular communications 4% 22% 40% 53% 65%D2D communications -29% -23% -0.1% 1.7% 22%
Cellular D2D Total0
1
2
3
4
5
Syst
em s
pec
tral
eff
icie
ncy
[bps/
Hz/
cell
]
0°
12°
Figure 4.20: System spectral efficiency of cellular and D2D communications in scenario with andwithout downtilt.
In Figure 4.21, the impact of outage to both communications and the outage reduction
compared without downtilt can be seen. This outage reduction represents the number of
users who previously were in outage and currently are not in outage. For example, 10 users
are in outage without downtilt and an outage reduction of 50% with downtilt means that 5 of
the 10 users are not in outage currently.
The positive impact of downtilt occurs in a range of angles between 7° and 15° which are

4.2. Antenna Downtilt 44
named critical angles because angles lower than 7° and higher than 15° do not reduce the
outage to cellular communications. Angles out of this range must be avoided.
Analyzing the cellular communications, it is possible to note that for angles from 7° to 12°
a reduction of the outage level occurs due to decrease of the intercellular interference level.
After 12°, the coverage radius of the eNB reduces to each angle, leaving cellular users without
communication.
From the D2D communication point of view, the outage reduction decreases for low
downtilt angles. However, it keeps a gain in relation to case without downtilt. After 7° a
decrease of the outage level occurs because the interference level inside the hotspot decreases.
It is important to clarify that the focus is to provide the best outage level to cellular users.
When 12° of downtilt is used, it is possible to achieve an outage reduction of 75% for cellular
communications, while D2D communications achieve a gain of 28%.
1 2 3 4 5 6 7 8 9 10 11 12 13 14 15 16 170
10
20
30
40
50
60
70
80
Angle (°)
Out
age
redu
ctio
n (%
)
Cellular communicationsD2D communications
Critical angle
Figure 4.21: Outage reduction for different levels of tilt.
4.2.2 SDPC in a Downtilt scenario
Section 4.2.1 shows the impact of downtilt in a scenario only with EPA. In this section,
the performance of SDPC is studied jointly with downtilt. The SDPC is evaluated using 12°of
downtilt, because this angle achieved good results in terms of spectral and power efficiency
with EPA.
Figure 4.22 shows the total spectral efficiency and power efficiency, when cellular and
D2D communications use SDPC and EPA, respectively. Figure 4.22(a) shows the case where
SDPC does not use downtilt. When a downtilt of 12° is used (see Figure 4.22(b)) the spectral
efficiency increases for all sets of parameters analyzed. The highest possible spectral efficiency
(∆P = 40 dB and Γmin = 20 dB) using SDPC without downtilt is 3 bps/Hz/cell, however, it is
possible to achieve 4.5 bps/Hz/cell using 12° of tilt, in other words, SDPC working together with
downtilt provide a gain of 50%.
Power efficiency has a similar behavior of spectral efficiency, because it increases for all
set of parameters due to cell isolation. Taking a look in Figure 4.22(c), it is evident that
the parameters ∆P = 20 dB and Γmin = −5 dB provide the highest power efficiency, the gain
achieved in this point using downtilt (see Figure 4.22(d)) is 63% compared without downtilt.
Figure 4.23 shows the total spectral efficiency and power efficiency, when cellular and D2D
communications use EPA and SDPC, respectively.
Taking a look in Figure 4.23(a), it is possible to note that spectral efficiency has small
variation when the parameters are modified, however, after the eNB changes downtilt to 12° as
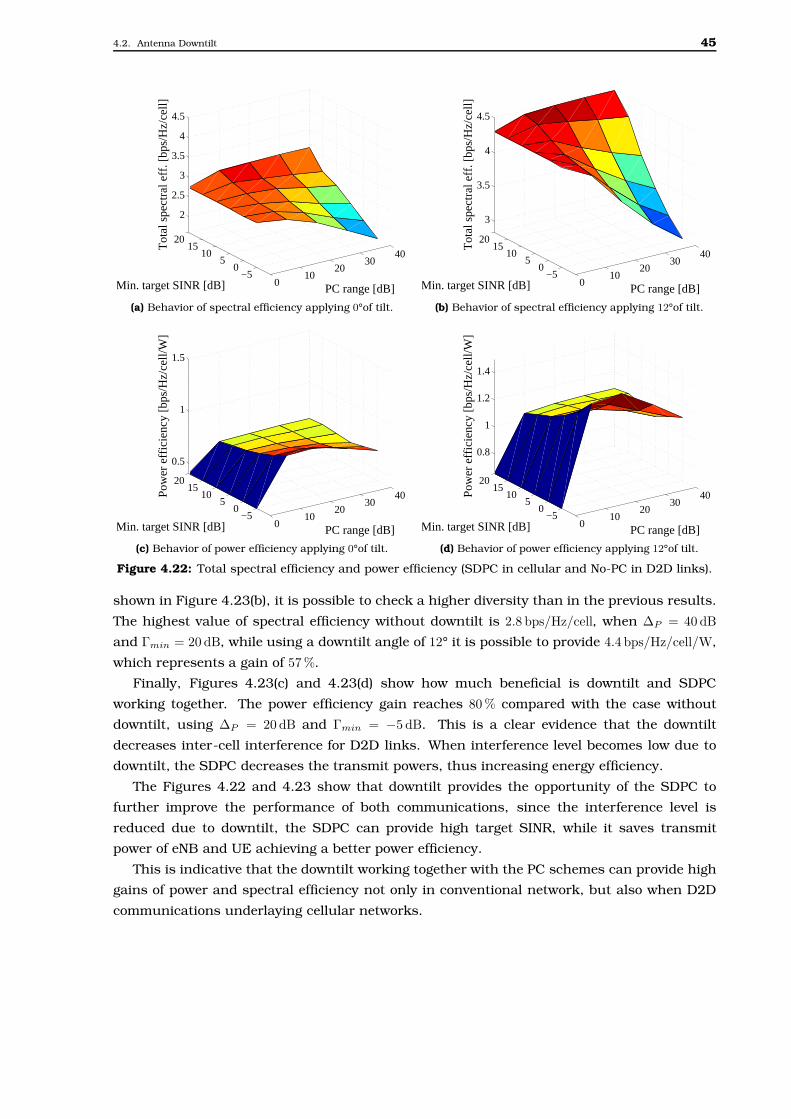
4.2. Antenna Downtilt 45
010
2030
40
−50
510
1520
2
2.5
3
3.5
4
4.5
PC range [dB]Min. target SINR [dB]
Tot
al s
pect
ral e
ff. [b
ps/H
z/ce
ll]
(a) Behavior of spectral efficiency applying 0°of tilt.
010
2030
40
−50
510
1520
3
3.5
4
4.5
PC range [dB]Min. target SINR [dB]
Tot
al s
pect
ral e
ff. [b
ps/H
z/ce
ll]
(b) Behavior of spectral efficiency applying 12°of tilt.
010
2030
40
−50
510
1520
0.5
1
1.5
PC range [dB]Min. target SINR [dB]
Pow
er e
ffici
ency
[bps
/Hz/
cell/
W]
(c) Behavior of power efficiency applying 0°of tilt.
010
2030
40
−50
510
1520
0.8
1
1.2
1.4
PC range [dB]Min. target SINR [dB]
Pow
er e
ffici
ency
[bps
/Hz/
cell/
W]
(d) Behavior of power efficiency applying 12°of tilt.
Figure 4.22: Total spectral efficiency and power efficiency (SDPC in cellular and No-PC in D2D links).
shown in Figure 4.23(b), it is possible to check a higher diversity than in the previous results.
The highest value of spectral efficiency without downtilt is 2.8 bps/Hz/cell, when ∆P = 40 dB
and Γmin = 20 dB, while using a downtilt angle of 12° it is possible to provide 4.4 bps/Hz/cell/W,
which represents a gain of 57%.
Finally, Figures 4.23(c) and 4.23(d) show how much beneficial is downtilt and SDPC
working together. The power efficiency gain reaches 80% compared with the case without
downtilt, using ∆P = 20 dB and Γmin = −5 dB. This is a clear evidence that the downtilt
decreases inter-cell interference for D2D links. When interference level becomes low due to
downtilt, the SDPC decreases the transmit powers, thus increasing energy efficiency.
The Figures 4.22 and 4.23 show that downtilt provides the opportunity of the SDPC to
further improve the performance of both communications, since the interference level is
reduced due to downtilt, the SDPC can provide high target SINR, while it saves transmit
power of eNB and UE achieving a better power efficiency.
This is indicative that the downtilt working together with the PC schemes can provide high
gains of power and spectral efficiency not only in conventional network, but also when D2D
communications underlaying cellular networks.

4.2. Antenna Downtilt 46
010
2030
40
−50
510
1520
3
3.5
4
4.5
PC range [dB]Min. target SINR [dB]
Tot
al s
pect
ral e
ff. [b
ps/H
z/ce
ll]
(a) Behavior of spectral efficiency applying 0° of tilt.
010
2030
40
−50
510
1520
4.2
4.3
4.4
4.5
PC range [dB]Min. target SINR [dB]
Tot
al s
pect
ral e
ff. [b
ps/H
z/ce
ll]
(b) Behavior of spectral efficiency applying 12° of tilt.
010
2030
40
−50
510
1520
2.5
3
3.5
4
4.5
PC range [dB]Min. target SINR [dB]
Pow
er e
ffici
ency
[bps
/Hz/
cell/
W]
(c) Behavior of power efficiency applying 0°of tilt.
010
2030
40
−50
510
15202.5
3
3.5
4
4.5
PC range [dB]Min. target SINR [dB]
Pow
er e
ffici
ency
[bps
/Hz/
cell/
W]
(d) Behavior of power efficiency applying 12° of tilt.
Figure 4.23: Total spectral efficiency (No-PC in cellular and SDPC in D2D links).

Chapter 5Conclusions
This master’s thesis has dealt with Radio Resource Management (RRM) for cellular and
network-assisted Device-to-Device (D2D) communications, as well as strategies used to
improve energy efficiency in a scenario where D2D communications underlays the cellular
network. Strategies for interference management, such as Power Control (PC) and downtilt
have been analyzed and calibrated seeking for the minimum waste of energy in the cellular
network without harming its capacity.
This master’s thesis addressed the benefits of the Soft Dropping (SD) algorithm for cellular
and D2D communications in the Downlink (DL) of a multi-cell scenario through system-level
simulations. Results indicate that the SD algorithm in a Micro-cell scenario is effective in
controlling the trade-off between system spectral efficiency of cellular communications and
power saving of D2D transmitters. The application of SD in D2D communications always
provides better performance in terms of total system spectral efficiency and power economy
for any operation point than the application of SD to cellular communications. The main
reason for that is related with the reduction of the high interference power originated from
D2D communications. In DL, D2D transmitters act as interfering sources close to cellular
receivers while D2D receivers are far way from both cellular and D2D transmitters. Thus, the
SD algorithm appears as a promising solution to protect cellular communications from the
interference caused by D2D communications.
PC schemes to protect cellular communications and achieve higher energy efficiency gains
for D2D communications on the Uplink (UL) in a Micro-cell scenario were also investigated.
Results indicate that in terms of energy efficiency the Soft Dropping Power Control (SDPC)
performs better for cellular links while the Open Loop Power Control (OLPC) provides high
gains for D2D links. While high values of α have been widely used in OLPC studies,
α ∈ {0.4, 0.5} has provided high energy efficiency gains for D2D links. Considering the most
favorable scenario for sharing resources in all cells, it was also seen that the minimum cost
for enabling system spectral efficiency gains for D2D communications represents a minimal
impact of 11% on the system spectral efficiency of cellular communications.
Indeed, different PC schemes vary greatly in complexity, numbers of parameters, and
have different performance levels. It has been noted that the Equal Power Allocation (EPA)
scheme always has the highest spectral efficiency and the lowest power efficiency in both
communications. SDPC keeps a reasonable spectral efficiency and provides a gain of 70%
in power efficiency compared to the Long Term Evolution (LTE) PC schemes for cellular
communications. If the purpose of PC is to be power efficient, it would be interesting to

48
use SDPC in cellular communications and OLPC in D2D communications.
We also conclude that for OLPC and Closed Loop Power Control (CLPC), path gain is an
important factor affecting performance of the both communication modes and the factor σ =
0.8 can modify the behavior of CLPC, because it increases the Signal to Interference-plus-Noise
Ratio (SINR) of the worst users.
Another conclusion is that Closed Loop Soft Dropping (CLSD), which is based on SDPC
and CLPC provides a tradeoff between spectral efficiency and power efficiency, because CLSD
has good performance due to knowledge of path gain, current SINR and because it is able to
modify the target SINR values. These information are useful to improve spectral and power
efficiency of the system, however, the complexity of CLSD and the number of subcarriers used
to feedback is higher compared with other PC schemes.
It was shown that algorithms PC schemes are influenced by the load of system. PC
schemes such as CLSD provide the best results in terms of total spectral efficiency when
the load increases, because it uses the benefits of both CLPC and SDPC, such as feedback
and variable target SINR. In terms of power efficiency, EPA shows the worst result to both
communications, while SDPC and CLSD provide good results to cellular communications
due to explore the diversity. From D2D point of view, OLPC keeps a good performance for
all offered loads. This behavior can be explained by the high path gain values due to the
proximity of communications inside the hotspot.
In terms of Channel State Information (CSI), we concluded that PC schemes based on many
measures suffer a significant loss of spectral and power efficiency when subject to feedback
delay. High delays harm the total spectral efficiency and cellular power efficiency, so in this
case it should be adopted simple PC schemes to provide the best efficiency to the system.
From the D2D point of view, OLPC keeps a good power efficiency independent of the delay,
because OLPC provides transmit power based on the metric G (path gain), which does not
vary significantly among Transmission Time Intervals (TTIs).
Based on the results of this master’s thesis, we concluded that antenna downtilt can be
used as a simple and efficient technique not only in conventional cellular networks, but
also for D2D communications underlying cellular networks. Regions that offer improved
spectral and power efficiency to both types of communication were determined and the range
between 8° and 12° for downtilt angle provided good spectral efficiency to cellular and D2D
communications. However, angles between 8° and 10° are not good parameter values for D2D
communications, since they do not lead to power efficiency gains. In this way, angles between
11◦ and 12◦ should be chosen, which provide gains in terms of power efficiency to both cellular
and D2D communications that reach 65% and 22%, respectively, while they improved the total
spectral efficiency in 58%.
Downtilt working together with SDPC schemes brings opportunity to reduce inter-cell
interference in D2D links due to downtilt and to save transmit power due to SDPC. In other
words, downtilt intensifies the gain of SDPC.
This master’s thesis intends to contribute to a better understanding of the role and
behavior of PC schemes when D2D communications underlay a cellular network.

Appendix AProof of convergence SDPC
The target SINR Γk,c,n(p(t)k,c,n) of User Equipment (UE) k in the cell c and Physical Resource
Block (PRB) n at TTI t is given according to
Γk,c,n(p(t)k,c,n) =
Γmax, p(t)k,c,n ≤ Pmin,
Γmax
(
p(t)k,c,n
Pmin
)ρ
, Pmin < p(t)k,c,n < Pmax,
Γmin, p(t)k,c,n ≥ Pmax,
(A.1)
where
ρ =log10(Γmin/Γmax)
log10(Pmax/Pmin). (A.2)
Then, the power per PRB of each UE is updated every transmission as follows
p(t+1)k,c,n = p
(t)k,c,n
(
Γk,c,n(p(t)k,c,n)
γk,c,n(p(t))
)β
, (A.3)
By assuming η as the thermal noise at the receiver and tx(m) the transmitter D2D pair
m ∈ {0, 1, . . . , R}, the SINR (γ(t)k,c,n) perceived by of cellular user k in the cell c and PRB n at TTI
t can be written as show in Equation (A.4):
γ(t)k,c,n =
∣∣∣h
(t)k,c,n
∣∣∣
2
p(t)k,c,n
C∑
c′ 6=c
k∑
k′
∣∣∣h
(t)k,c′,n
∣∣∣
2
p(t)k′,c′,n
︸ ︷︷ ︸
Interference from cellular links
+C∑
c′
M∑
m′
∣∣∣h
(t)k,tx(m′),c′,n
∣∣∣
2
p(t)tx(m′),c′,n
︸ ︷︷ ︸
Interference from D2D links
+η2
(A.4)

50
For power value in Pmin < p(t)k,c,n < Pmax
I(p(t)k,n
) = p
(t+1)k,c,n
= p
(t)k,c,n
Γmax
p
(t)k,c,n
Pmin
ρ
∣
∣
∣h(t)k,c,n
∣
∣
∣
2p(t)k,c,n
C∑
c′ 6=c
k∑
k′
∣
∣
∣h(t)
k,c′,n
∣
∣
∣
2p(t)
k′,c′,n+
C∑
c′
M∑
m′
∣
∣
∣
∣
h(t)
k,tx(m′),c′,n
∣
∣
∣
∣
2
p(t)
tx(m′),c′,n+η2
β
,
= p
(t)k,c,n
Γmax
p
(t)k,c,n
Pmin
ρ(C∑
c′ 6=c
k∑
k′
∣
∣
∣h
(t)k,c′,n
∣
∣
∣
2p
(t)k′,c′,n
+
C∑
c′
M∑
m′
∣
∣
∣h
(t)k,tx(m′),c′,n
∣
∣
∣
2p
(t)tx(m′),c′,n
+ η
2
)
∣
∣
∣h
(t)k,c,n
∣
∣
∣
2p
(t)k,c,n
β
,
= p
(t)k,c,n
(
p
(t)k,c,n
)ρβ
(
p
(t)k,c,n
)β
Γmax
(
C∑
c′ 6=c
k∑
k′
∣
∣
∣h
(t)k,c′,n
∣
∣
∣
2p
(t)k′,c′,n
+
C∑
c′
M∑
m′
∣
∣
∣h
(t)k,tx(m′),c′,n
∣
∣
∣
2p
(t)tx(m′),c′,n
+ η
2
)
∣
∣
∣h
(t)k,c,n
∣
∣
∣
2P
ρmin
β
,
=
(
p
(t)k,c,n
)1+ρβ−β
Γmax
(
C∑
c′ 6=c
k∑
k′
∣
∣
∣h
(t)k,c′,n
∣
∣
∣
2p
(t)k′,c′,n
+
C∑
c′
M∑
m′
∣
∣
∣h
(t)k,tx(m′),c′,n
∣
∣
∣
2p
(t)tx(m′),c′,n
+ η
2
)
∣
∣
∣h
(t)k,c,n
∣
∣
∣
2P
ρmin
β
,
(A.5)
Once the all terms in Equation (A.5) are positive, I(p(t)k,n) satisfies positivity. To verify
monotonicity, it is necessary to ensure that I(p(t)k,c,n) ≥ I(p′
(t)k,c,n), for all p
(t)k,c,n ≥ p′
(t)k,c,n, then
the value of exponent must be positive.
(
p(t)k,c,n
)1+ρβ−β
≥(
p′(t)k,c,n
)1+ρβ−β
,
1 + ρβ − β ≥ 0,
1 + β(ρ− 1) ≥ 0,
β(ρ− 1) ≥ −1,
β(1− ρ) ≤ 1,
β ≤1
(1 − ρ),
(A.6)
To ensure scalability, aI(p(t)k,c,n) ≥ I(ap(t)k,c,n), for a ≥ 1. This way
a1 ≥ a1+ρβ−β,
1 ≥ 1 + ρβ − β,
0 ≥ ρβ − β,
ρβ − β ≤ 0,
ρβ ≤ β,
ρ ≤ 1,
(A.7)

51
For power value in p(t)k,c,n ≤ Pmin
I(p(t)k,n
) = p
(t+1)k,c,n
= p
(t)k,c,n
Γmax∣
∣
∣h(t)k,c,n
∣
∣
∣
2p(t)k,c,n
C∑
c′ 6=c
k∑
k′
∣
∣
∣h(t)
k,c′,n
∣
∣
∣
2p(t)
k′,c′,n+
C∑
c′
M∑
m′
∣
∣
∣
∣
h(t)
k,tx(m′),c′,n
∣
∣
∣
∣
2
p(t)
tx(m′),c′,n+η2
β
,
= p
(t)k,c,n
Γmax
(
C∑
c′ 6=c
k∑
k′
∣
∣
∣h
(t)k,c′,n
∣
∣
∣
2p
(t)k′,c′,n
+
C∑
c′
M∑
m′
∣
∣
∣h
(t)k,tx(m′),c′,n
∣
∣
∣
2p
(t)tx(m′),c′,n
+ η
2
)
∣
∣
∣h
(t)k,c,n
∣
∣
∣
2p
(t)k,c,n
β
,
=
(
p
(t)k,c,n
)1−β
Γmax
(
C∑
c′ 6=c
k∑
k′
∣
∣
∣h
(t)k,c′,n
∣
∣
∣
2p
(t)k′,c′,n
+
C∑
c′
M∑
m′
∣
∣
∣h
(t)k,tx(m′),c′,n
∣
∣
∣
2p
(t)tx(m′),c′,n
+ η
2
)
∣
∣
∣h
(t)k,c,n
∣
∣
∣
2
β
,
=
(
p
(t)k,c,n
)1−β
Γmax
(
C∑
c′ 6=c
k∑
k′
∣
∣
∣h
(t)k,c′,n
∣
∣
∣
2p
(t)k′,c′,n
+
C∑
c′
M∑
m′
∣
∣
∣h
(t)k,tx(m′),c′,n
∣
∣
∣
2p
(t)tx(m′),c′,n
+ η
2
)
∣
∣
∣h
(t)k,c,n
∣
∣
∣
2
β
,
(A.8)
Once the all terms in Equation (A.8) are positive, I(p(t)k,n) satisfies positivity. To verify
monotonicity, it is necessary to ensure that I(p(t)k,c,n) ≥ I(p′
(t)k,c,n), for all p
(t)k,c,n ≥ p′
(t)k,c,n, then
the value of exponent must be positive.
(
p(t)k,c,n
)1−β
≥(
p(t)k,c,n
)1−β
,
1− β ≥ 0,
1 ≥ β,
β ≤ 1,
(A.9)
To ensure scalability, aI(p(t)k,c,n) ≥ I(ap(t)k,c,n), for a ≥ 1. This way
a1 ≥ a1−β,
1 ≥ 1− β,
β ≥ 0,
(A.10)
The main relations are defined below:
ρ ≤ 1, (A.11)
β ≤1
(1− ρ), (A.12)
β ≤ 1, (A.13)
β ≥ 0, (A.14)

52
Finally, we can combining them
−∞ ≤ ρ ≤ 0, (A.15)
0 ≤ β ≤1
(1− ρ), (A.16)

Bibliography
[1] ITU, “Background on IMT-Advanced , recommendation ITU, tech. rep. doc. IMT-ADV/1„”
Tech. Rep., 2008.
[2] L. Suarez, L. Nuaymi, and J.-M. Bonnin, “An overview and classification of research
approaches in green wireless networks,” EURASIP Journal on Wireless Communications
and Networking, vol. 2012, no. 1, pp. 1–18, 2012.
[3] R. L. Batista, C. F. M. e Silva, J. M. B. da Silva Jr., T. F. Maciel, and F. R. P. Cavalcanti,
“What happens with a proportional fair cellular scheduling when D2D communications
underlay a cellular network?” in IEEE WCNC 2014 - Workshop on Device-to-Device and
Public Safety Communications (WCNC’14 - WDPC Workshop), Istambul, Turkey, Apr. 2014,
pp. 260–265.
[4] G. Fodor and N. Reider, “A distributed power control scheme for cellular network assisted
D2D communications,” pp. 1–6, Dec 2011.
[5] J. Niemelä, T. Isotalo, and J. Lempiäinen, Optimum Antenna Downtilt Angles for
Macrocellular WCDMA Network, vol. 5, Issue 5, pp. 816–827, October 2005.
[6] Y.-D. Lin and Y.-C. Hsu, “Multihop cellular: a new architecture for wireless
communications,” in INFOCOM 2000. Nineteenth Annual Joint Conference of the IEEE
Computer and Communications Societies. Proceedings. IEEE, vol. 3, Mar 2000, pp.
1273–1282 vol.3.
[7] L. Lei, Z. Zhong, C. Lin, and X. Shen, “Operator controlled device-to-device
communications in lte-advanced networks,” Wireless Communications, IEEE, vol. 19,
no. 3, pp. 96–104, June 2012.
[8] M. S. Corson, R. Laroia, J. Li, V. Park, T. Richardson, and G. Tsirtsis, “Toward
proximity-aware internetworking,” IEEE Wireless Communications, vol. 17, no. 6, pp.
26–33, Dec. 2010.
[9] Z.-J. Yang, J.-C. Huang, C.-T. Chou, H.-Y. Hsieh, C.-W. Hsu, P.-C. Yeh, and C.-C. Hsu,
“Peer discovery for device-to-device (d2d) communication in lte-a networks,” in Globecom
Workshops (GC Wkshps), 2013 IEEE, Dec 2013, pp. 665–670.
[10] Q. Du, P. Ren, H. Song, Y. Wang, and L. Sun, “On p2p-share oriented routing over
interference-constrained d2d networks,” in Mobile Ad-hoc and Sensor Networks (MSN),
2014 10th International Conference on, Dec 2014, pp. 138–143.
53

Bibliography 54
[11] A. Le, L. Keller, H. Seferoglu, B. Cici, C. Fragouli, and A. Markopoulou, “Microcast:
Cooperative video streaming using cellular and D2D connections,” CoRR, vol.
abs/1405.3622, 2014. [Online]. Available: http://arxiv.org/abs/1405.3622
[12] R.-S. Cheng, C.-M. Huang, and G.-S. Cheng, “A d2d cooperative relay scheme for
machine-to-machine communication in the lte-a cellular network,” in Information
Networking (ICOIN), 2015 International Conference on, Jan 2015, pp. 153–158.
[13] G. Rigazzi, N. K. Pratas, P. Popovski, and R. Fantacci, “Aggregation and trunking of M2M
traffic via D2D connections,” CoRR, vol. abs/1502.01708, 2015. [Online]. Available:
http://arxiv.org/abs/1502.01708
[14] S. Andreev, O. Galinina, A. Pyattaev, K. Johnsson, and Y. Koucheryavy, “Analyzing
assisted offloading of cellular user sessions onto d2d links in unlicensed bands,” Selected
Areas in Communications, IEEE Journal on, vol. 33, no. 1, pp. 67–80, Jan 2015.
[15] T. Han and N. Ansari, “Offloading mobile traffic via green content broker,” Internet of
Things Journal, IEEE, vol. 1, no. 2, pp. 161–170, April 2014.
[16] A. Asadi, Q. Wang, and V. Mancuso, “A survey on device-to-device communication in
cellular networks,” http://arxiv.org/abs/1310.0720v1, oct 2013.
[17] K. Doppler, M. Rinne, C. Wijting, C. Ribeiro, and K. Hugl, “Device-to-device
communication as an underlay to lte-advanced networks,” Communications Magazine,
IEEE, vol. 47, no. 12, pp. 42–49, Dec 2009.
[18] R. Yin, G. Yu, H. Zhang, Z. Zhang, and G. Li, “Pricing-based interference coordination for
d2d communications in cellular networks,” Wireless Communications, IEEE Transactions
on, vol. 14, no. 3, pp. 1519–1532, March 2015.
[19] S. Xu, H. Wang, T. Chen, Q. Huang, and T. Peng, “Effective interference cancellation
scheme for device-to-device communication underlaying cellular networks,” in Vehicular
Technology Conference Fall (VTC 2010-Fall), 2010 IEEE 72nd, Sept 2010, pp. 1–5.
[20] T. Peng, Q. Lu, H. Wang, S. Xu, and W. Wang, “Interference avoidance mechanisms in
the hybrid cellular and device-to-device systems,” in Personal, Indoor and Mobile Radio
Communications, 2009 IEEE 20th International Symposium on, Sept 2009, pp. 617–621.
[21] C. F. M. Silva, José Mairton B. Silva Jr., and T. F. Maciel, “Radio resource management
for device-to-device communications in long term evolution networks,” in Resource
Allocation and MIMO for 4G and Beyond, F. R. P. Cavalcanti, Ed. New York: Springer
Science+Business Media, 2014, pp. 105–156.
[22] G. Fodor, E. Dahlman, G. Mildh, S. Parkvall, N. Reider, G. Mikló, and Z. Turányi, “Design
Aspects of Network Assisted Device-to-Device Communications,” IEEE Communications
Magazine, vol. 50, no. 3, pp. 170 –177, March 2012.
[23] K. Doppler, C.-H. Yu, C. Ribeiro, and P. Janis, “Mode selection for device-to-device
communication underlaying an lte-advanced network,” in Wireless Communications and
Networking Conference (WCNC), 2010 IEEE, April 2010, pp. 1–6.
[24] S. Hakola, T. Chen, J. Lehtomaki, and T. Koskela, “Device-to-device (d2d) communication
in cellular network - performance analysis of optimum and practical communication

Bibliography 55
mode selection,” in Wireless Communications and Networking Conference (WCNC), 2010
IEEE, April 2010, pp. 1–6.
[25] B. Wang, L. Chen, X. Chen, X. Zhang, and D. Yang, “Resource allocation optimization for
device-to-device communication underlaying cellular networks,” in Vehicular Technology
Conference (VTC Spring), 2011 IEEE 73rd, May 2011, pp. 1–6.
[26] A. Asadi and V. Mancuso, “A Survey on Opportunistic Scheduling in Wireless
Communications,” IEEE Communications Surveys Tutorials, vol. 15, no. 4, pp.
1671–1688, 2013.
[27] J. M. B. da Silva Jr., T. F. Maciel, R. L. Batista, C. F. M. e Silva, and F. R. P.
Cavalcanti, “UE grouping and mode selection for D2D communications underlaying a
multicellular wireless system,” in IEEE WCNC 2014 - Workshop on Device-to-Device and
Public Safety Communications (WCNC’14 - WDPC Workshop), Istambul, Turkey, Apr. 2014,
pp. 230–235.
[28] J. Gu, S. J. Bae, B.-G. Choi, and M. Y. Chung, “Dynamic power control mechanism
for interference coordination of device-to-device communication in cellular networks,” in
Ubiquitous and Future Networks (ICUFN), 2011 Third International Conference on, 2011,
pp. 71–75.
[29] N. Lee, X. Lin, J. G. Andrews, and R. W. H. Jr, “Power Control for D2D Underlaid Cellular
Networks: Modeling, Algorithms and Analysis,” http://arxiv.org/abs/1305.6161, may
2013.
[30] F. Baccelli, N. Khude, R. Laroia, J. Li, T. Richardson, S. Shakkottai, S. Tavildar, and
X. Wu, “On the design of device-to-device autonomous discovery,” in Communication
Systems and Networks (COMSNETS), 2012 Fourth International Conference on, Jan 2012,
pp. 1–9.
[31] M. Zulhasnine, C. Huang, and A. Srinivasan, “Efficient resource allocation for
device-to-device communication underlaying LTE network,” in Proceedings of the IEEE
Wireless and Mobile Computing, Networking and Communications (WiMob), Oct 2010, pp.
368–375.
[32] P. Janis, V. Koivunen, C. B. Ribeiro, K. Doppler, and K. Hugl, “Interference-avoiding
mimo schemes for device-to-device radio underlaying cellular networks,” in IEEE 20th
International Symposium on Personal, Indoor and Mobile Radio Communications, 2009,
Sep. 2009, pp. 2385 – 2389.
[33] B. Wang, L. Chen, X. Chen, X. Zhang, and D. Yan, “Resource Allocation Optimization
for Device-to-Device Communication Underlaying Cellular Networks,” in Vehicular
Technology Conference (VTC Spring), 2011 IEEE 73rd, May 2011, pp. 1–6.
[34] P. Jänis, C.-H. Yu, K. Doppler, C. Ribeiro, C. Wijting, K. Hugl, O. Tirkkonen, and
V. Koivunen, “Device-to-device communication underlaying cellular communications
systems,” in International Journal of Communications, Network and System
Sciences,2009, vol. 2, no. 3, Jun. 2009, pp. 169–178.
[35] S. Hakola, T. Chen, J. Lehtomaki, and T. Koskela, “Device-to-device (D2D)
communication in cellular network - performance analysis of optimum and practical

Bibliography 56
communication mode selection,” in Proceedings of the IEEE Wireless Communications and
Networking Conference (WCNC), Apr. 2010, pp. 1 –6.
[36] K. Doppler, C.-H. Yu, C. B. Ribeiro, and P. Janis, “Mode selection for device-to-device
communication underlaying an LTE-advanced network,” in Proceedings of the IEEE
Wireless Communications and Networking Conference (WCNC), Apr. 2010, pp. 1 –6.
[37] C.-H. Yu, K. Doppler, C. Ribeiro, and O. Tirkkonen, “Resource sharing
optimization for device-to-device communication underlaying cellular networks,”
Wireless Communications, IEEE Transactions on, vol. 10, no. 8, pp. 2752–2763, 2011.
[38] X. Xiao, X. Tao, and J. Lu, “A QoS-Aware Power Optimization Scheme in OFDMA Systems
with Integrated Device-to-Device (D2D) Communications,” in Vehicular Technology
Conference (VTC Fall), 2011 IEEE, 2011, pp. 1–5.
[39] C. Yu, O. Tirkkonen, K. Doppler, and C. Ribeiro, “On the Performance of Device-to-Device
Underlay Communication with Simple Power Control,” in Vehicular Technology
Conference, 2009. VTC Spring 2009. IEEE 69th, Apr. 2009, pp. 1–5.
[40] C. Li, B. Li, B. Lan, Y. Zhang, and T. Wang, “Uplink power control for device to device
communication underlaying cellular networks,” in Communications and Networking in
China (CHINACOM), 2013 8th International ICST Conference on, Aug 2013, pp. 256–259.
[41] G. Fodor, D. Della Penda, M. Belleschi, M. Johansson, and A. Abrardo, “A
comparative study of power control approaches for device-to-device communications,”
Communications (ICC), 2013 IEEE International Conference on, pp. 6008 – 6013, 2013.
[42] S. Gupta, R. Yates, and C. Rose, “Soft Dropping Power Control - A Power Control Backoff
Strategy,” in IEEE International Conference on Personal Wireless Communications, 1997,
Dec. 1997, pp. 210 –214.
[43] Y. V. L. Melo, R. L. Batista, T. F. Maciel, C. F. M. e Silva, J. M. B. da Silva Jr., and F. R. P.
Cavalcanti, “Power control with variable target SINR for D2D communications underlying
cellular networks,” in European Wireless 2014 (EW2014), Barcelona, Spain, May 2014.
[44] X. Lu, E. Kunnari, J. Leinonen, O. Piirainen, M. Vainikka, and M. Juntti, “Lte uplink
power control and base station antenna down tilt in a 3d channel model,” in Wireless
Conference (EW), 2010 European, April 2010, pp. 377–381.
[45] J. Salo, G. Del Galdo, J. Salmi, P. Kyösti, M. Milojevic, D. Laselva, and C. Schneider,
“MATLAB implementation of the 3GPP Spatial Channel Model (3GPP TR 25.996),”
On-line, Jan. 2005, http://www.tkk.fi/Units/Radio/scm/.
[46] B. Yu, L. Yang, H. Ishii, and X. Cheng, “Load balancing with antenna tilt control in
enhanced local area architecture,” in Vehicular Technology Conference (VTC Spring), 2014
IEEE 79th, May 2014, pp. 1–6.
[47] M. Garcia-Lozano, S. Ruiz, and J. Olmos, “UMTS optimum cell load balancing
for inhomogeneous traffic patterns,” in Vehicular Technology Conference, 2004.
VTC2004-Fall. 2004 IEEE 60th, vol. 2, Sept 2004, pp. 909–913 Vol. 2.
[48] K. S., G. C. D., and V. M. P., “Optimization by simulated annealing,” Science, 1983.

Bibliography 57
[49] M. Danneberg, J. Holfeld, M. Grieger, M. Amro, and G. Fettweis, “Field trial evaluation
of ue specific antenna downtilt in an lte downlink,” in Smart Antennas (WSA), 2012
International ITG Workshop on, March 2012, pp. 274–280.
[50] R. L. Batista, “Coordinated multipoint transmission and reception (comp) in a wireless
telecommunications network,” US Patent P37 998, Dec., 2012.
[51] A. A. Gebremariam, D. W. Kifle, B. Wegmann, I. Viering, and F. Granelli, “Techniques of
candidate cell selection for antenna tilt adaptation in lte-advanced,” in European Wireless
2014; 20th European Wireless Conference; Proceedings of, May 2014, pp. 1–6.
[52] I. Forkel, A. Kemper, R. Pabst, and R. Hermans, “The effect of electrical and mechanical
antenna down-tilting in umts networks,” in 3G Mobile Communication Technologies, 2002.
Third International Conference on (Conf. Publ. No. 489), May 2002, pp. 86–90.
[53] D. W. Kifle, B. Wegmann, I. Viering, and A. Klein, “On the potential of traffic driven
tilt optimization in lte-a networks,” in Personal Indoor and Mobile Radio Communications
(PIMRC), 2013 IEEE 24th International Symposium on, Sept 2013, pp. 2909–2913.
[54] ITU, “Framework and overall objectives of the future development of imt-2000 and
systems beyond IMT-2000, recommendation itu-r m.1645,” Tech. Rep., 2006.
[55] V. Hasu, “Radio resource management in wireless communication: Beamforming,
transmission power control, and rate allocation.” Ph.D. dissertation, Helsinki University
of Technology, 2007.
[56] J. Laiho and T. N. Achim Wacker, Radio Network Planning and Optimisation for UMTS.
John Wiley & Sons, 2006.
[57] R. C. David Soldani, Man Li, QoS and QoE Management in UMTS Cellular Systems. John
Wiley & Sons, 2006.
[58] 3GPP, “Physical layer aspect for evolved Universal Terrestrial Radio Access (UTRA),”
3rd Generation Partnership Project (3GPP), TR 25.814, Oct. 2006. [Online]. Available:
http://www.3gpp.org/ftp/Specs/html-info/25814.htm
[59] ——, “Spatial channel model for Multiple Input Multiple Output (MIMO) simulations,”
3rd Generation Partnership Project (3GPP), TR 25.996, Dec. 2009. [Online]. Available:
http://www.3gpp.org/ftp/Specs/html-info/25996.htm
[60] ——, “Further advancements for E-UTRA physical layer aspects,” Third Generation
Partnership Project, TR 36.814 V9.0.0, Mar. 2009.
[61] C. Mehlführer, M. Wrulich, J. C. Ikuno, D. Bosanska, and M. Rupp,
“Simulating the long term evolution physical layer,” in Procedings of the European
Signal Processing Conference, Glasgow, Scotland, Aug. 2009. [Online]. Available:
http://publik.tuwien.ac.at/files/PubDat_175708.pdf
[62] 3GPP, “Evolved Universal Terrestrial Radio Access (E-UTRA); Physical layer procedures,”
3rd Generation Partnership Project (3GPP), TS 36.213, Oct. 2010. [Online]. Available:
http://www.3gpp.org/ftp/Specs/html-info/36213.htm
[63] ——, “Evolved Universal Terrestrial Radio Access (E-UTRA); physical layer procedures,”
Third Generation Partnership Project, TS 36.213 V8.6.0, Mar. 2009.
Bibliography 58
[64] ——, “Physical layer aspects for evolved universal terrestrial radio access (UTRA),” Third
Generation Partnership Project, TR 25.814 V7.1.0, Sep. 2006.
[65] J. C. Ikuno, M. Wrulich, and M. Rupp, “System level simulation of LTE networks,” in
Proceedings of the IEEE Vehicular Technology Conference (VTC), May 2010, pp. 1–5.
[66] 3GPP, “Spatial channel model for multiple input multiple output (MIMO) simulations,”
Third Generation Partnership Project, TR 25.996 V7.0.0, Jun. 2007.
[67] G. Fodor, D. Della Penda, M. Belleschi, M. Johansson, and A. Abrardo, “A
comparative study of power control approaches for device-to-device communications,”
in Communications (ICC), 2013 IEEE International Conference on, June 2013, pp.
6008–6013.
[68] T. Maciel and A. Klein, “On the performance of SDMA with soft dropping and SINR
balancing power control in the downlink of multi-user MIMO systems,” in IEEE Workshop
on Smart Antennas (WSA 2007), Vienna, Austria, Feb. 2007.
[69] M. da S Rego, T. Maciel, H. de H M Barros, F. R. P. Cavalcanti, and G. Fodor, “Performance
analysis of power control for device-to-device communication in cellular mimo systems,”
in Wireless Communication Systems (ISWCS), 2012 International Symposium on, 2012,
pp. 336–340.
[70] C. F. Silva, J. M. B. Silva, and T. F. Maciel, Radio Resource Management
for Device-to-Device Communications in Long Term Evolution Networks, 1st ed.,
F. R. P. Cavalcanti, Ed. Springer New York, 2014. [Online]. Available:
http://dx.doi.org/10.1007/978-1-4614-8057-0_3
[71] W. Jianhui and Y. Dongfeng, “Antenna downtilt performance in urban environments,” in
Military Communications Conference, 1996. MILCOM ’96, Conference Proceedings, IEEE,
vol. 3, Oct 1996, pp. 739–744 vol.3.
[72] J. Niemela and J. Lempiainen, “Impact of mechanical antenna downtilt on performance
of wcdma cellular network,” in Vehicular Technology Conference, 2004. VTC 2004-Spring.
2004 IEEE 59th, vol. 4, May 2004, pp. 2091–2095 Vol.4.
[73] F. Gunnarsson, M. Johansson, A. Furuskar, M. Lundevall, A. Simonsson, C. Tidestav,
and M. Blomgren, “Downtilted base station antennas - a simulation model proposal and
impact on hspa and lte performance,” pp. 1–5, Sept 2008.
[74] 3GPP, “Evolved Universal Terrestrial Radio Access (e-utra); User Equipment (UE) Radio
Transmission and Reception,” Third Generation Partnership Project, Tech. Rep. TR
36.101 V12.2.0, Dec. 2013.
[75] D. Jaramillo-Ramirez, M. Kountouris, and E. Hardouin, “Coordinated multi-point
transmission with imperfect csi and other-cell interference,” Wireless Communications,
IEEE Transactions on, vol. 14, no. 4, pp. 1882–1896, April 2015.
[76] R. Fritzsche, P. Rost, and G. Fettweis, “Robust rate adaptation and proportional fair
scheduling with imperfect csi,” Wireless Communications, IEEE Transactions on, vol. PP,
no. 99, pp. 1–1, 2015.