power congestion trading outlook - platts · · 2017-11-07power congestion trading outlook sergio...
TRANSCRIPT

Power Congestion Trading Outlook
Sergio Brignone, Trader
2017 Nodal Conference October 26, 2017

Antitrust Precaution and Disclaimers
Anti-trust Precaution:
During this presentation I intend to keep the content at a high level, and ask that you be mindful of antitrust laws which
prohibit discussing certain topics including but not limited to agreements between or among competitors regarding
prices, bid and offer practices, availability of service, product design, terms of sale, division of markets, allocation of
customers or any other activity that might unreasonably restrain competition. If any of these items are discussed, we
will re-direct the conversation. If the conversation persists, we will terminate the discussion.
Disclaimers:
The ideas, views, and opinions expressed in this presentation and in my spoken remarks are mine and mine only and
are based upon my personal experiences and observations. These ideas, views, and opinions do not necessarily
reflect those of my employer and are not based upon any confidential information.
I may use many terms, including but not limited to, forward, over-the counter, OTC, exchange, physical, financial,
and/or bilateral, to describe energy markets in New England that exist outside of the ISO NE facilitated energy markets,
but my intention for this presentation is to refer to these outside markets in the general sense.
Fair Value:
Expected Congestion Adjusted by Risk
Congestion Distribution belong to Extreme Value Theory (long tail
events)
Each participant chooses its Risk function (implicitly or explicitly)
The larger the unmanaged risk the higher the “haircut” the price
valuation will have it embedded
FTR Fair Price Valuation

Transmission Outages are the largest source of congestion.
Weak transmission schedules increases the uncertainty of outages.
Larger uncertainty means higher risks.
Higher risks impacts the fair valuation of FTRs.
Consequently:
Reduces the ARR revenues.
Increases the dislocation between DA and FTR markets.
FTR Fair Price Valuation (cont.)
Are the ISOs managing this market risks properly ?
FTR Fair Price Valuation (cont.)
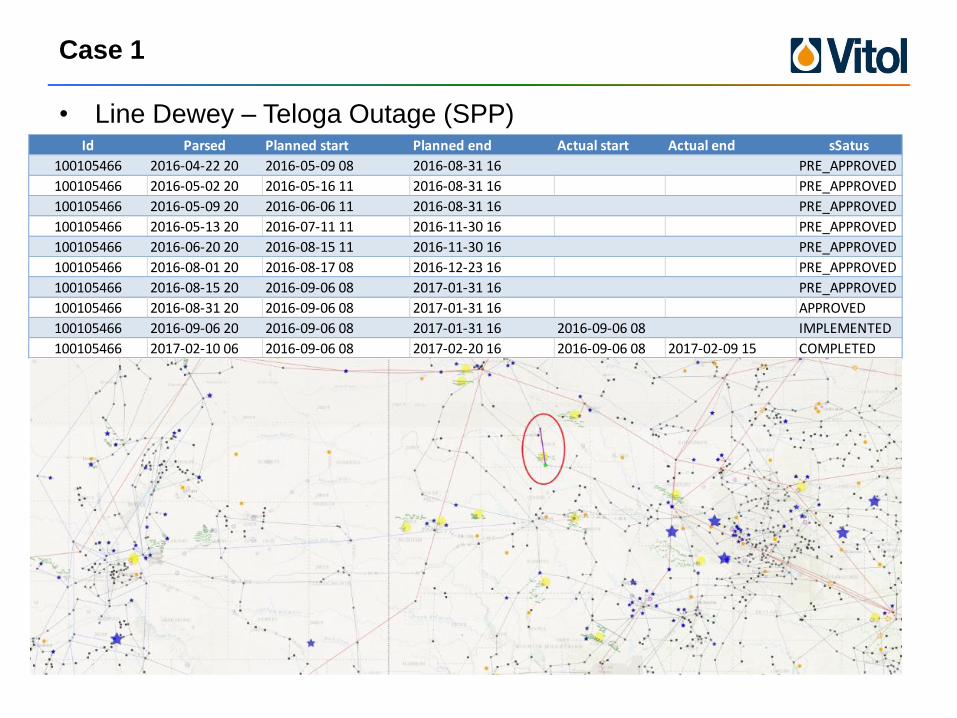
Case 1
• Line Dewey – Teloga Outage (SPP) Id Parsed Planned start Planned end Actual start Actual end sSatus
100105466 2016-04-22 20 2016-05-09 08 2016-08-31 16 PRE_APPROVED
100105466 2016-05-02 20 2016-05-16 11 2016-08-31 16 PRE_APPROVED
100105466 2016-05-09 20 2016-06-06 11 2016-08-31 16 PRE_APPROVED
100105466 2016-05-13 20 2016-07-11 11 2016-11-30 16 PRE_APPROVED
100105466 2016-06-20 20 2016-08-15 11 2016-11-30 16 PRE_APPROVED
100105466 2016-08-01 20 2016-08-17 08 2016-12-23 16 PRE_APPROVED
100105466 2016-08-15 20 2016-09-06 08 2017-01-31 16 PRE_APPROVED
100105466 2016-08-31 20 2016-09-06 08 2017-01-31 16 APPROVED
100105466 2016-09-06 20 2016-09-06 08 2017-01-31 16 2016-09-06 08 IMPLEMENTED
100105466 2017-02-10 06 2016-09-06 08 2017-02-20 16 2016-09-06 08 2017-02-09 15 COMPLETED
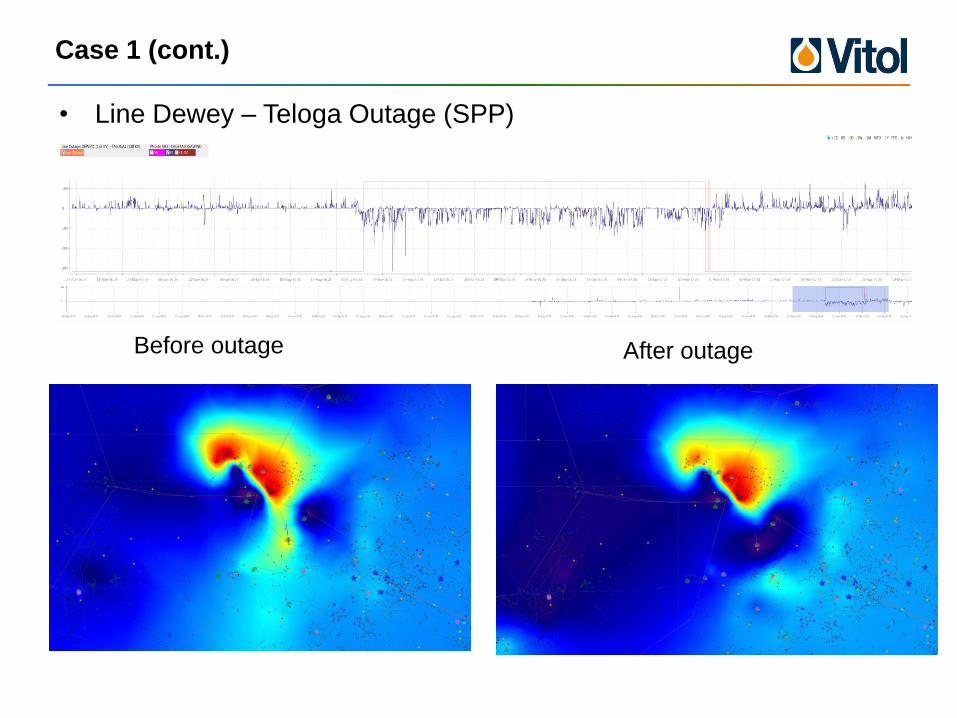
Case 1 (cont.)
• Line Dewey – Teloga Outage (SPP)
Before outage After outage

Case 2
• Greentown Transformer (MISO) Id Parsed Planned start Planned end Actual start Actual end Status Type
1-13053805 2017-02-27 20 2017-03-06 08 2017-03-27 11 SUBMITTED DISCRETIONARY
1-13053805 2017-02-28 20 2017-03-06 08 2017-03-27 11 APPROVED DISCRETIONARY
1-13053805 2017-03-09 20 2017-03-06 08 2017-03-27 11 2017-03-06 08 IMPLEMENTED DISCRETIONARY
1-13053805 2017-03-28 20 2017-03-06 08 2017-03-27 16 2017-03-06 08 2017-03-27 14 COMPLETED DISCRETIONARY

ISOs and Outages
ISO Out of window # of Outages percent
CAISO
ERCOT 23,597.00 179,659.00 13%
ISONE 704.00 43,502.00 2%
MISO 10,816.00 185,041.00 6%
NYISO - 8,685.00 0%
PJM 32,453.00 316,379.00 10%
SPP 1,826.00 13,580.00 13%
Outages since Jan 1st 2016
Greater than 69KV
Duration more than 2 days
That were submitted after the corresponding monthly Auction closes
Disclaimer: Please Consume Data with Care

Needed ISO Actions
• Improve their outage reporting sites.
• Be more diligent controlling the quality of information on their
outage reporting sites.
• Coordinate when outages span more than one ISO.
• Reject outages for reasons other than reliability (e.g. economics,
market impact, etc.)
• Make TO financially responsible when an outage is scheduled after
the close of the corresponding auction and causes congestion.
• Provide products to help to mitigate risk (e.g. FTR Options).
• Moves towards a unified market structure across all ISOs.

Obligation vs Options Volumes
ERCOT Options holds larger volume than Obligations
PJM Options are a tiny fractions of all FTRs
0.00
50,000.00
100,000.00
150,000.00
200,000.00
250,000.00
300,000.00
350,000.00
400,000.00
OFF_PEAK PEAK PEAK_WE Grand Total
OBL MW
OPT MW
TOTAL MW
0.00
200,000.00
400,000.00
600,000.00
800,000.00
1,000,000.00
1,200,000.00
H24 OFF_PEAK PEAK Grand Total
OBL MW
OPT MW
TOTAL MW
ERCOT
PJM