power-aware bus coscheduling for periodic realtime ... filekhaled z. ibrahim1 and smail niar2 1 suez...
TRANSCRIPT

accepted for Transactions on High-Performance Embedded Architecture andCompilation
Power-aware Bus Coscheduling for Periodic RealtimeApplications Running on Multiprocessor SoC
Khaled Z. Ibrahim1 and Smail Niar2
1 Suez Canal University, 42563 Port Said, Egypt2 University of Valenciennes, 59313 Valenciennes Cedex 9, France
Abstract. Execution time for realtime processes running on multiprocessor system-on-chip platform varies due to the contention on the bus. Considering the worstcase execution cycles necessitates over-clocking the system to meet the realtimedeadlines, which has a negative impact on the system power requirements. Forperiodic applications coscheduled on multiprocessor withshared bus, the cyclesneeded by a memory transaction fluctuate based on the execution overlap betweenprocesses’ activities on bus. In this work, we show the effect on execution cyclesof different scheduling overlap of processes. Experiment results demonstrate thatthe execution cycles, and therefore the clock frequency, can be lowered by upto 24% on a 4 processor MPSoC. As the power consumption variescubicallywith frequency, this reduction can lead to a significant power saving. Instead ofexhaustively simulating all configurations to search for optimal scheduling over-lap, we devise a scheme to predict the effect of scheduling. We propose the useof shift-variance of bus traffic profile of applications running individually on thesystem to predict the effect when scheduling these applications simultaneously.We show that the devised predictor of scheduling effect highly correlates to thebehavior observed through simulations.
1 Introduction
In bus-based multiprocessor system, running multiple contending processes onthe shared bus increases the completion time of bus transactions and conse-quently the number of cycles needed to finish these processes. In realtime sys-tem,worst case execution time (WCET) is usually considered while schedulingthese processes. The system clock frequency is adjusted to meet the processrealtime constraints.
Unfortunately, increasing the frequency (and possibly increasing the volt-age, as well) to meet realtime deadlines negatively impactsthe power consump-tion of the system. The dynamic power dissipation varies linearly with fre-quency and quadratically with supply voltage. With a linearrelation betweenvoltage and frequency, the increase in the number of cycles needed to exe-cute a process can lead to a cubical increase in the dynamic power. The vari-ation of application requirements and system state with time usually necessi-tates the dynamic adaptation of the system voltage and frequency. Dynamic
1

��������������������������������
C1
��������������������������������
C1
����������������
����������������������������
����������������
����������������������������
����������������
����������������������������
����������������
C1’C2’
����������������
����������������������������
����������������
����������������������������
����������������������������
����������������
C1’C2’
�������������� �������������������������������������������������������������������������� ������������������������������������������������������������
C1" ( < C1’)
C2" ( < C2’)C2" ( < C2’)
C1" ( < C1’)
����������������������������
����������������������������
����������������������������
����������������������������
����������������������������
����������������������������
����������������
C2C2
Periodic standalone bus traffic for process 1
Periodic standalone bus traffic for process 2
Bus overlap
Optimal bus overlap
Fig. 1.The effect of bus traffic overlap of two processes sharing a common bus.
voltage/frequency scaling (DVS) technique adapts the system frequency andvoltage to the realtime constraints of the system [1,2], thus optimizing for thesystem power and energy.
Scheduling processes in multiprocessor system aims at coordinating the uti-lization of shared resources between competing processes [3,4,5]. The stress ofeach process on the memory system varies with time. The number of cycles toexecute these processes can decrease if we could find anoptimal overlap of thebus demands from processes running on the system. By “optimal overlap”, wemean an overlap that minimize the average clock cycles that each process needsto complete a memory transaction.
In this work, we show the impact of coscheduling of processeson a sharedbus for multiprocessor embedded system. We illustrate the variation in execu-tion cycles based on the overlap of processes coscheduled onshared bus. Bruteforce search for optimal overlap of coscheduled processes requires simulationsof the processes with all possible overlaps. This can be a prohibitively expen-sive process. Instead, we devise a scheme to predict optimalcoschedule. Thisscheme narrows the search space for optimal overlap. We propose a process thatcomprises the following steps: identifying the initial phase of each process, find-ing periodicity in the process behavior, determining a common period betweenthe coscheduled processes, finding profile of performance variation with all pos-sible overlaps, and finally finding an optimal bus coscheduleof the processes.We also introduce the use of scheduling barrier to maintain the optimal overlapof coscheduled processes.
The proposed scheme predicts the effect of coscheduling on the performanceunder all possible execution overlaps. This helps in identifying a schedule withminimum negative impact on performance (through minimizing bus contention)

and helps in reducing the number of cycles needed to execute each process. Forrealtime application reducing the number of cycles to execute a task reduces thepower requirement because the system frequency and voltagecan be reducedaccordingly.
The proposed technique can be applied for coscheduling applications withperiodic pattern of accessing the memory systems. For this class of applica-tions, the same processing is usually applied on different frames of data andthe processing is independent of the values of data processed. Even though theapplicability of the proposed scheme is limited to this class of applications, spe-cialized design process is common in embedded systems to achieve the bestpower consumption especially that these systems are usually dedicated to run afixed set of applications.
The rest of this paper is organized as follows: Section 2 introduces the im-pact of contention on shared bus and its effect on the number of cycles a periodictask needs for execution. The simulation environment is described in Section 3.Our proposed technique to predict optimal bus scheduling isdetailed in Sec-tion 4. We extend our formulation of the proposed scheme, in Section 5, tosystems running arbitrary number of processes. Section 6 summarizes relatedwork as well as future work. Section 7 concludes our work.
2 Impact of Bus Overlap on Performance
In this work, we constrain our discussion to multiprocessorsystem with appli-cations knowna priori. For clarity, we will consider system with two processesrunning concurrently. We will generalize our formulation in Section 5
In Figure 1, two processes with different traffic patterns are shown. Theupper part of the figure shows the bus traffic for each application running indi-vidually on the system. Two different execution overlaps are shown in the lowerpart of the figure. The number of cycles (Ci) for each process depends on theoverlap with the other processes running on the system. The clock frequency ofthe systemf needed to meet deadline constraint is defined asC/T whereC isnumber of cycles of a process with the realtime periodT . Increasing the numberof cyclesC of a process necessitates increasing the frequency of the system f .Different proposals [2,6,7] describe how to adapt the frequency to the demandof a process with realtime constraints.
Increasing the frequency severely impacts the power requirements of thesystem. In CMOS based system, the commonly used technology in embeddedsystems, the power consumption is mainly due to dynamic power [8] that isgiven byP = Ce f ·V 2
dd · f whereCe f is the effective switched capacitance,Vdd
is the supply voltage. The frequency is almost linearly related to the supply

20 40 60 80 100
-6
-5
-4
-3
-2
-1
0
20 40 60 80
-12
-8
-4
0
20 40 60 80
-4
-3
-2
-1
0
0 50 100 150 200 250 300 350
-4
-2
0
2
4
50 100 150 200 250 300 -2.0
-1.5
-1.0
-0.5
0.0
0.5
1.0
20 40 60 80 100 -16
-12
-8
-4
0
Blowfish encrypt/decrypt R
elat
ive
exec
uti
on
cyc
les
in %
Overlap offset
Rijndael encrypt/decrypt
Rel
ativ
e ex
ecu
tio
n c
ycle
s in
%
Overlap offset
SHA/SHA
Rel
ativ
e ex
ecu
tio
n c
ycle
s in
%
Overlap offset
GSM encode/decode
Rel
ativ
e ex
ecu
tio
n c
ycle
s in
%
Overlap offset
PCM encode/decode
Rel
ativ
e ex
ecu
tio
n c
ycle
s in
%
Overlap offset
MAD/MAD
Rel
ativ
e ex
ecu
tio
n c
ycle
s in
%
Overlap offset
Fig. 2. Effect of all execution overlaps on the total execution cycles for six pairs of embeddedapplications. The effect is shown as a percentage of the execution cycles of an initial overlap.
voltage [8]. Consequently, the dynamic power is cubically related with the fre-quency (P ∝ f 3). The energy (computed asE = P ·T ) is quadratically relatedwith the frequency, which is an important factor for batterypowered devices.
Static power usually has negligible contribution to total power for embed-ded systems with low frequency. Static power is proportional to supply voltageVdd [9,10], and thus can benefit linearly from decreasing frequency.
Figure 2 shows the effect of all execution overlaps for six pairs of embed-ded applications. Execution overlaps are generated by sliding the execution ofone application with respect to the other application in thepair. These pairs ofapplications are taken from three categories of MiBench suite [11], namely thesecurity, the telecommunication and the consumer categories. Each group is runon a dual processor system with shared bus. Each applicationexhibits a peri-odic behavior in accessing the bus. Figure 2 shows the percentage of change inexecution cycles when we have different overlaps for each pair of applications.Depending on overlap (or shift), the execution cycles change by up to 5.5% forBlowfish, 12% for Rijndael, 4% for SHA, 6.5% for GSM, 1.5% for PCM, and12.5% for MAD. These changes consider the difference between the maximumand the minimum execution cycles. The changes in the execution time are dueto the memory latency changes that arise because of the different contentionscenarios that these applications face on the bus. The details of the simulationenvironment are given in Section 3.
During the run of these applications, the execution cycles alternate betweenthe values shown in Figure 2. To guarantee meeting deadline for real-time ap-plication, system designer usually considers worst-case execution cycles thus

necessitating overclocking the system. Based on the early discussion, if we canenforce a coscheduling that provide the minimum execution cycles then we canobtain a saving in the dynamic power consumption, relative to the power asso-ciated with worst-case execution cycles, from 4% for PCM up to 33% for MADassuming a dual-core MPSoC. Even if the system bus and memoryare not af-fected by the frequency scaling and only the processor core and caches are af-fected, the gain in reducing the processor power is very large. This is attributableto the large ratio of power consumed by the processor core andcaches comparedwith the power consumed by the bus and memory subsystems. ForPCM, thisratio is 50:1 and the ratio for MAD is 4:1. The saving due to frequency reductionis especially important for battery powered systems.
The cubic scaling of power with frequency is one of the main motives forbuilding MPSoC for realtime systems running concurrent jobs, in constrainedpower environment. This alternative is based on using multiple processor coreswith a lower frequency. The other, less efficient, alternative is to run the con-current jobs on one processor core with higher frequency. Replicating the num-ber of cores almost linearly increases the power demands while increasing fre-quency increase power demands cubically.
The above discussion shows the importance of coscheduling processes andits severe impact on the system power requirements. The mainproblem is tosearch for optimal configuration. This involves simulationof all possible over-laps which can be excessively expensive. We simulated 99 configurations forBlowfish, 90 for Rijndael, 79 for SHA, 368 for GSM, 321 for PCM,and 98 forMAD. The number of simulated configurations for each application is chosento avoid repeated simulations and is determined by the common periodicity de-tected for each pair of applications as will be detailed in Section 4.3. Searchingfor a local minimum execution cycles using a technique such as steepest descentcan face difficulty because of the existence of multiple minima and the existenceof fast-varying change (ripples) as an additional component to the more impor-tant slowly-varying change. It will also require many simulation runs.
The determination of the optimal scheduling is an additional dimension tothe design space for MPSoC. Multiple hardware configurations are usually ex-plored in designing such systems. It is also common to have systems that rundifferent combinations of applications simultaneously. For every set of appli-cations, we need to find an optimal coschedule that saves execution cycles aswell as energy. In this work, our objective is to predict the effect of coschedul-ing of multiple processes in a simple and accurate way that enables fast andprecise design process. The details of our proposed technique are presented inSection 4.

Table 1.Embedded Benchmarks used in this study.
benchmark Description
Blowfish Symmetric block cipher with multiple lengths key.Rijndael A Symmetric block cipher encryption/decryption algorithmthat is chosen by
the National Institute of Standards as Advanced EncryptionStandard (AES).SHA Secure Hash Algorithm (SHA) that produces a 160-bit messagedigest.GSM Global Standard for Mobile communication.ADPCM Adaptive Differential Pulse Code Modulation (ADPCM).MAD MPEG Audio Decoder. It supports MPEG-1, MPEG-2, and MPEG-2.5.
3 Simulation Environment
The simulation environment is based on MPARM [12] environment. MPARMmodels a Multiprocessor System-on-Chip (MPSoC). The processor models ARM 7processors based on a software implementation called SWARM[13]. The sys-tem is interconnected using an AMBA [14] communication standard (architec-ture for high performance embedded systems). Multiple bus arbitration schemesare implemented by the MPARM. We choose a simple round-robinscheme. Thesimulated system has data cache (4KB size, 4-way set-associative) and instruc-tion cache (2KB size, 2-way set-associative). Both caches are with writebackpolicy. The clock frequencies of all CPUs are the same,i.e., homogeneous pro-cessor cores. Uncontended memory latency is 40 cycles.
Benchmarks used in this study are taken from security, telecommunication,and consumer categories of MiBench suite of embedded benchmarks [11]. Ex-cept for SHA and MAD, all benchmarks have a decode functionality in additionto the encode functionality. In this study, we run these two functionalities inpairs. For MAD and SHA, we run similar copies of the application. These pairsof applications can normally run concurrently in a multiprocessor embeddedsystem.
Rijndael and MAD represent memory intensive applications with large per-centage of cache misses, while PCM is less memory intensive application withsmall percentage of cache misses. The average memory accesstime is affectedby the miss penalty that increases with the contention on shared bus. These ap-plications are sequential applications that are run in parallel with non-sharedmemory spaces.
4 Finding Optimal Bus Coschedule
This section presents our technique to search for an optimalcoschedule for twoprocesses running on system with a shared bus. The approach is generalized

100 200 300 400 0
10
20
30
40
50
Bu
s-b
usy
per
cen
tag
e
Time sample
Blowfish
100 200 300 400 0
10
20
30
40
50
Bu
s-B
usy
Per
cen
tag
e Time sample
Rijndael encrypt/decrypt
100 200 300 400 0
5
10
15
20
25
Bu
s-b
usy
per
cen
tag
e
Time sample
SHA
200 400 600 800 0
10
20
30
40
50
Bu
s-b
usy
per
cen
tag
e
Time sample
GSM decode
200 400 600 800 0
10
20
30
40
50
Bu
s-b
usy
per
cen
tag
e
Time sample
GSM encode
100 200 300 400 0
5
10
15
Bu
s-b
usy
per
cen
tag
e
Time sample
PCM-encode
100 200 300 400 0
5
10
15
Bu
s-b
usy
per
cen
tag
e
Time sample
PCM decode
100 200 300 400 0
10
20
30
40
50
Bu
s-b
usy
per
cen
tag
e
Time sample
MAD
Fig. 3. Percentage of bus-busy for applications running standalone on the system bus.
to more than two processes in Section 5. We target finding an optimal staticcoschedule between two running processes that exhibit periodicity. Many em-bedded applications exhibit periodicity in their execution and consequently pe-riodicity in the traffic sent to the memory system. This periodic behavior usuallyappears after an initialization period and may be trailed bya termination period.We are more interested in the periodic part of the application because it domi-nates the execution time of the application.
We start the search for optimal coschedule by running each process individu-ally on the system. We record the bus-busy percentages over fixed interval of cy-cles. These recordings constitute a time-series of measurementsbk, k = 1, . . . , n,wherebk is the bus-busy percentage at time intervalk.
Figure 3 shows the percentages of the bus-busy cycles for ourbenchmarks.The time samples are 0.5K cycles for Blowfish and Rijndael; 2Kcycles for GSMand PCM; and 20K cycles for SHA and MAD. These choices for sampling sizesare empirically chosen to compromise between having enoughbus traffic detailsand limiting the number of scheduling decisions (bus trafficperiodicity) to fa-cilitate verifications. Decreasing the sampling interval increases the number ofsamples per application periodicity. While the proposed scheme has no difficultyin predicting performance with any number of samples per periodicity; it willbe very difficult to simulate all configurations to verify thecorrelation betweenthe performance predicted by our model and the outcomes of the simulations.
As shown in Figure 3, Blowfish and GSM bus traffics have burstiness inaccessing the memory. Execution is divided into phases of large bus traffic fol-lowed by almost idle phases. Applications such as Rijndael,on the other hand,have slowly varying bus traffic. The encode and the decode functionalities pro-duce different traffic profile for GSM and PCM. For Rijndael and Blowfish, the

Bu
s b
usy
Time sample
Application X
1- Detecting initialization
Bu
s b
usy
Time sample
Application Y
2- Detecting periodicity
p x
Bu
s b
usy
Time sample p
y
Bu
s b
usy
Time sample
p c ~=3*p
x
Bu
s b
usy
Time sample
3- Finding common period
p c ~=2*p
y
Bu
s b
usy
Time sample
Scheduling Shift
Bu
s b
usy
Time sample
4- Scheduling applications
p c
p c
Bu
s b
usy
Time sample
Fig. 4. Four steps in scheduling processes in MPSoC.
bus traffic for encrypt and decrypt follows the same profile. All these applica-tions show periodic behavior in dealing with the system bus.To find an optimalbus coschedule, we propose the following steps:
1. Isolation of the initialization part of the application from the periodic partfor each application, Section 4.1.
2. Identification of the periodicity of the bus traffic for each application indi-vidually, Section 4.2.
3. Creation of common coscheduling period for all applications designated forcoexistence on the system, Section 4.3.
4. Analysis of the effect of different coscheduling overlaps/shifts, for the com-mon coscheduling period, on the execution cycles, Section 4.4.
Figure 4 summarizes the four steps proposed to find optimal scheduling decisionfor a pair of processes. With the outlined technique, using simulation to exhaus-tively search for optimal coschedule is not needed. Enforcement of coschedulingdecision to guarantee repetitiveness usingscheduling barriers is introduced inSection 4.5. We asses the goodness of our technique in the prediction of optimalbus coschedule in Section 4.6.
4.1 Identifying Initialization Period
To identify the bus-traffic initialization phase of each process, we start by form-ing aninitialization approximate vector (IAV). The IAV vector is formed by tak-ing an initial subset of the vectorbk. We arbitrary choose a divisord for the num-ber of samplesn. The IAV is chosen asbk, k = 1, . . . ,n/d. Then, we compute the

0 50 100 150 200 250 300
0.5
1.0
1.5
2.0
2.5
0 50 100 150 200 250 300 0.4
0.6
0.8
1.0
1.2
1.4
1.6
0 100 200 300 400 500
0.5
1.0
1.5
2.0
2.5
3.0
3.5
0 50 100 150 200 250 300 0
1
2
3
4
5
6
0 50 100 150 200 250 300
0.5
1.0
1.5
2.0
2.5
3.0
3.5
4.0
4.5
5.0
0 50 100 150 200 250 300 0
2
4
6
8
10
12
0 50 100 150 200 250 300
0.5
1.0
1.5
2.0
2.5 0 100 200 300 400 500
0.5
1.0
1.5
2.0
2.5
3.0
Divisor 32 Divisor 64
D s
Time sample
Blowfish encrypt/decrypt
D s
Time sample
Rijndael encrypt/decrypt
D s
Time sample
GSM decode
D s
Time sample
SHA
D s
Time sample
PCM encode
D s
Time sample
PCM decode
D s
Time sample
MAD
D s
Time sample
GSM encode
Fig. 5. Initialization phase detection based on difference graph of bus traffic.
difference between the IAV and shifted versions of the original time series, asDs = ∑n/d
j=1
∣
∣b j+s −b j
∣
∣ , s = 1, . . . , 2n/d. We compute an approximation of thesecond order difference as∆D
2s = (Ds+1−2Ds +Ds−1), s = 2, . . . , 2n/d −1.
The peaks of the second degree difference(∆D2s ) occur at the possible end
of initialization points. It is notable that multiple localmaxima may arise duedo the inclusion of part of the periodic behavior within the IAV. We used mul-tiple divisorsd to get confidence of the result. The outcome of initializationidentification is independent ofd as long as the initialization is a subset of IAV.
This approach is analogous to that used in finding application initializationbased on basic block difference graph [15]. After identifying them initial inter-vals, we form a new time seriesgk with the initialization phase stripped; suchthatgk = bk+m, k = 1, . . . , r wherer = n−m.
Figure 5 showsDs for the GSM pair of applications and Rijndael pair ofapplications. We show a small fraction of the computation curve for clarity. Weused large value ford, 32 and 64, because the initialization part is a very smallpart of the execution time. It is notable that the maximum∆D
2s occurs at sharp
local minima of the graphs. We choose the end of initialization interval at anypoint after the first maximum of∆D
2s . Any point that follows the initialization
can be considered a start for the periodic behavior. The end of the initializationinterval can be taken as the first scheduling point for the application; that is whyit is not advisable to excessively delay the choice for the end of initialization.For the following analysis, though, we need to make sure thatenough cachewarming has occurred before identifying a period representative to all otherexecution periods. In summary, we use early initializationpoint for scheduling
synchronization, to be introduced later in Section 4.5, while for the sake ofanalysis we consider a late initialization point.
4.2 Periodicity Detection
Detection of periodicity in experimental data has been studied by many re-searchers [16,17,15]. Autocorrelation (self-correlation) R is one of the mathe-matical formulas used to detect periodicity in a time series. The autocorrelationR is computed based on the autocovarianceCd , whered represent the time lagbetween the time series and its shifted version. The computation proceeds asfollows:
Let g be the average of the time seriesgk, thenCd = 1r
r
∑k=d
(gk − g)(
g(k−d) − g)
andRd = CdC0
. In this work, we adopted a methodology based on special formofautocorrelation called thefolded autocorrelation. First, we definefolded covari-
ance asFCd = 1r
r
∑k=1
(gk − g)(
g(k+d) − g)
. We assumegk = gk−r for all k > r. The
folded autocorrelation is then defined asFRd = FCdFC0
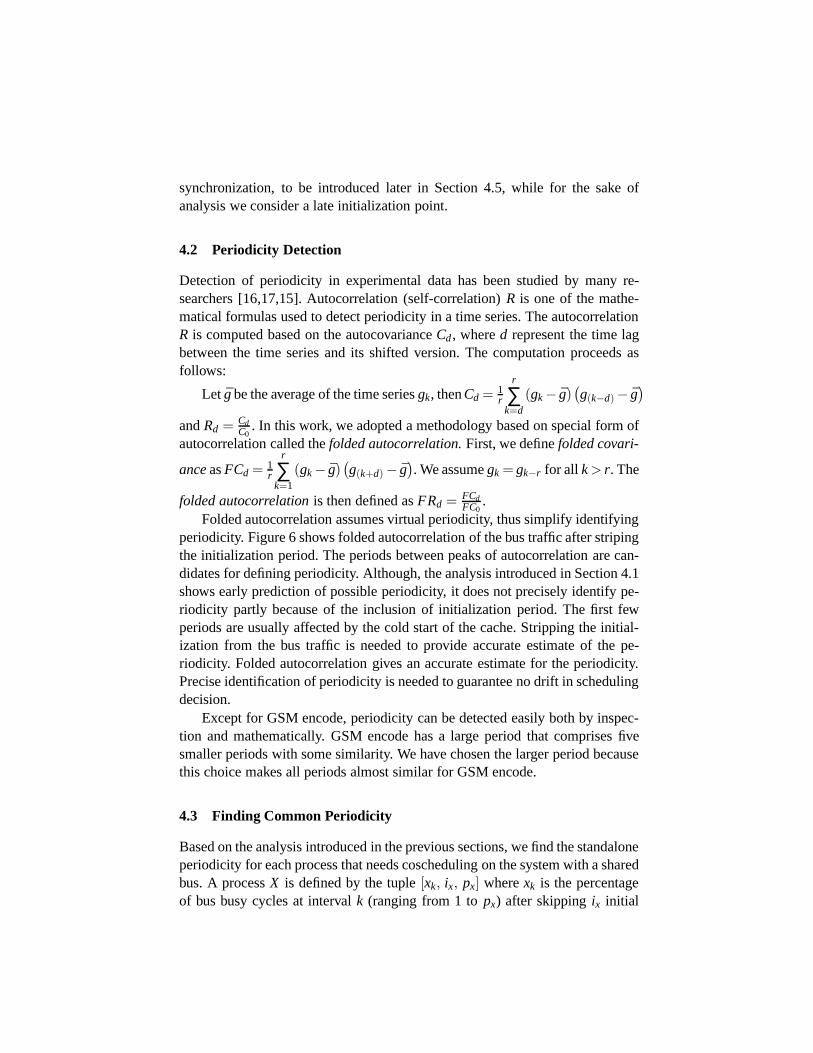
.Folded autocorrelation assumes virtual periodicity, thussimplify identifying
periodicity. Figure 6 shows folded autocorrelation of the bus traffic after stripingthe initialization period. The periods between peaks of autocorrelation are can-didates for defining periodicity. Although, the analysis introduced in Section 4.1shows early prediction of possible periodicity, it does notprecisely identify pe-riodicity partly because of the inclusion of initialization period. The first fewperiods are usually affected by the cold start of the cache. Stripping the initial-ization from the bus traffic is needed to provide accurate estimate of the pe-riodicity. Folded autocorrelation gives an accurate estimate for the periodicity.Precise identification of periodicity is needed to guarantee no drift in schedulingdecision.
Except for GSM encode, periodicity can be detected easily both by inspec-tion and mathematically. GSM encode has a large period that comprises fivesmaller periods with some similarity. We have chosen the larger period becausethis choice makes all periods almost similar for GSM encode.
4.3 Finding Common Periodicity
Based on the analysis introduced in the previous sections, we find the standaloneperiodicity for each process that needs coscheduling on thesystem with a sharedbus. A processX is defined by the tuple[xk, ix, px] wherexk is the percentageof bus busy cycles at intervalk (ranging from 1 topx) after skippingix initial

0 50 100 150 200 250 300
-0.4
-0.2
0.0
0.2
0.4
0.6
0.8
1.0
0 50 100 150 200 250 300
-0.4
-0.2
0.0
0.2
0.4
0.6
0.8
1.0
0 100 200 300 400 500 600 700
-0.4
-0.2
0.0
0.2
0.4
0.6
0.8
1.0
0 100 200 300 400
-0.4
-0.2
0.0
0.2
0.4
0.6
0.8
1.0
0 50 100 150 200 250 300
-0.4
-0.2
0.0
0.2
0.4
0.6
0.8
1.0
0 50 100 150 200 250 300
-0.4
-0.2
0.0
0.2
0.4
0.6
0.8
1.0
Fo
lded
Au
toco
rrel
atio
n (
FR
d )
Scheduling Shift
Rijndael encrypt/decrypt F
old
ed A
uto
corr
elat
ion
( F
R d
)
Scheduling Shift
Blowfish encrypt/decrypt
Fo
lded
Au
toco
rrel
atio
n (
FR
d )
Scheduling Shift
GSM encode GSM decode
Fo
lded
Au
toco
rrel
atio
n (
FR
d )
Scheduling Shift
PCM encode PCM decode
Fo
lded
Au
toco
rrel
atio
n (
FR
d )
Scheduling Shift
MAD
Fo
lded
Au
toco
rrel
atio
n (
FR
d )
Scheduling Shift
SHA
Fig. 6. Folded autocorrelation for periodicity detection.
intervals. Similarly, we define the tuple[yk, iy, py] for processY . The periodicitycan vary from one process to another.
Finding optimal coschedule of bus traffic requires analyzing a common pe-riod that repeats for all processes sharing the bus. Common period makes thescheduling decision repeatable for all processes. A commonperiod is composedof multiple basic periods of the coscheduled applications.Multiple criteria canbe used in finding common period, as follows:
– For same realtime requirements for all processes: The shorter process is ei-ther appended with inactivity period to make all processes with the sameperiod, or stretched assuming that it will run on a slower processor (hetero-geneous system) such that all processes have similar periods.
– For different realtime requirements for considered processes: We need todefine a common periodpc using the least common multiple of the twoperiod countpx, py. To avoid having a common period,pc, that is as largeaspx · py, it is sufficient to havepc such that(pc mod px)/px < tol and (pc
mod py)/py < tol, wheretol can be arbitrarily chosen, for instance less than0.05. Increasing the common period (pc) for coscheduling may reduce theeffectiveness of the scheduling mechanism that is described in Section 4.5.
To computepc based on a certaintol, we start with an initial value forpc ofpx · py; we repeat decreasingpc as long as the condition (pc mod pi)/pi < tolis satisfied for all processes. The minimum value forpc while satisfying thecondition is considered as a common period for coscheduling.
For Blowfish and Rijndael pairs of applications, we used the same realtimeconstraint for encrypt and decrypt. Both encrypt and decrypt have the same pe-riodicity, which facilitates choosing a common period (pc = px = py). Similarly,

we used the same periodicity for SHA and MAD because two identical copiesare run for both applications.
For GSM pair of applications, GSM encode periodicity is almost three timesthe periodicity for GSM decode, assuming atol = 0.01. While for most mobilecomputing applications the realtime constraint is the samefor GSM encode anddecode, we assumed an application where decode is needed formore framesthan for encode, for instance in conference calls. Usingtol = 0.01 for PCMpair, we find a common periodicity that coincides with three basic periods ofPCM encode and with five basic periods of PCM decode.
In future work, we can consider a system with heterogeneous processor coreto handle the same realtime constraint for different computational requirement.
4.4 Predicting Optimal Overlap of Coscheduled Processes
In this section, we aim at finding an overlap between two periodic processessuch that the number of cycles needed to finish both processesis minimal. Simu-lation of all possible overlaps between coscheduled processes is extremely timeconsuming process, especially with large common periodicity of coscheduledprocesses. The computational requirement for simulation increases if we needto repeat the coscheduling search for different hardware configuration.
We like to narrow the search space for optimal coschedule based on the in-formation we get from running each process as a standalone process. Formally,we need to find a scheduling shiftl between the processes to be coscheduledgiven the bus-busy percentagesxk, yk for processX andY ; respectively, wherek = 1, . . . , pc. To achieve this objective, we propose the use of one of the fol-lowing two metrics:
1. Find the minimum shift-variance of the sum ofxk and yk shifted by l =1, . . . , pc −1. let zl
k = xk + y(k+l)modpc
Var(l) =1pc
pc
∑k=1
(zlk − z)2 (1)
where ¯z = 1pc
∑pck=1 zl
k = 1pc
∑pck=1 (xk + yk). Note that ¯z is the same for all over-
laps, which leads to the simple form on the right hand side of the equationfor z.
2. Find the minimum convolution ofxk, yk for all scheduling shiftsl.
Conv(l) =1pc
pc
∑k=1
xk · y(k+l)modpc(2)

These two metrics give profiles of the effect of overlapping the bus traffic of thetwo processes. While these profiles help in knowing approximate area whereminimum negative impact of overlap occurs, they do not provide a quantitativemeasure of the effect that optimal coschedule may introduce.
These measures will be highly accurate if the effect of overlapping a bustraffic from one process with the traffic from the other process is self-contained.The effect of overlap of two points is hopefully not biased toward extendingthe execution time for one process over the other. This requirement necessitatesusing fair arbitration policy on the bus. Coscheduling on bus with prioritiza-tion scheme may be less fruitful. A necessary condition is that the timing doesnot accidentally favor one process over the others, where one process alwaysacquires the bus ahead of the other processes. Round-robin with preemption isone of those fair schemes but is unfortunately difficult to implement on multi-processor bus. Simple round-robin, used in this study, provides a relatively fairarbitration mechanism.
Another inherent assumption is that criticality of cache misses are mostlythe same for all cache misses, thus delaying a bus transactions impact perfor-mance the same. This is mostly true for simple cores with blocking cache missesthat is modeled in this study. For systems with more complex cores, further in-vestigation may be needed.
4.5 Coscheduling Enforcement Using Barriers
We propose to use barriers to define the overlap between coscheduled processesand to maintain this coschedule. We cannot use timing information collected bythe standalone runs as a basis for scheduling synchronization. These timings arestretched due to the increase in memory latency because of the bus contention.
A robust technique would be to identify barrier locations onsource code andto add barrier calls where necessary. Inserting software barrier has difficulties:First it requires changing the source code for each scheduling decision. Second,it cannot be inserted easily anywhere in the code; only specific locations aresuitable for barrier insertion.
We adopted a simple approach based on the number of graduatedinstruc-tions. The initialization and periodicity of an application are translated into in-struction counts. The scheduling barriers are applied based on the number ofgraduated instructions. This simple mechanism can be applied easily in embed-ded environment where simple OS is used and program execution is repeatableand deterministic.
In this study, we considered hardware barrier [18,19] for synchronization,which is associated with little execution overheads. Hardware barrier can beimplemented using a simple wired-and line(s). Triggering synchronization is

Fig. 7.Effect of coscheduling on bus wait time.
system dependent. A possible implementation that is explored in this study in-volves additional registers to hold the initial synchronization and the periodicityin terms of graduated instructions counts. These registersare part of the pro-cess context. An additional register is needed to hold the graduated instructionscount. This register is initialized with the synchronization point. It is decre-mented each time an instruction is graduated. When the register value reachzero, the barrier synchronization is acquired. The barriersynchronization is re-leased after all processes reach the barrier (the wired-andbarrier line is assertedby all processors). During release, the register is reset tothe periodicity instruc-tion count.
Scheduling barriers do not represent any data dependency. They are not re-quired for correct execution of coscheduled programs. Theyare used to ensurethat no drift in scheduling occurs after executing many periods, and thus guaran-teeing the persistence of the scheduling decision. With appropriate scheduling,this does not only maintain less execution cycles but also reduce the variabilityof execution because the memory traffic overlap will continuously repeat.
Using barriers usually causes period of idleness for the processors finishingwork earlier, i.e. arriving earlier to the barrier. The waiting period on the barrieris quantified in Section 4.6.

0 50 100 150 200 250 300 350 0.0
0.2
0.4
0.6
0.8
1.0
1.2
0 20 40 60 80 0.4
0.5
0.6
0.7
0.8
0.9
1.0
0 20 40 60 80 100
0.3
0.4
0.5
0.6
0.7
0.8
0.9
1.0
0 20 40 60 80 0.2
0.3
0.4
0.5
0.6
0.7
0.8
0.9
1.0
0 20 40 60 80 100 0.4
0.5
0.6
0.7
0.8
0.9
1.0
0 50 100 150 200 250 300 0.5
0.6
0.7
0.8
0.9
1.0
1.1
Scheduling shift
GSM
Normalized Convolution Normalized Shift-variance
Scheduling shift
Rijndael
Scheduling shift
Blowfish
Scheduling shift
SHA
Scheduling shift
MAD
Scheduling shift
PCM
Fig. 8.Coscheduling effect prediction based on convolution and shift-variance.
4.6 Accuracy of Coscheduling Prediction for Two Processes Systems
In this section, we introduce the effect of coscheduling on memory access timeand prediction accuracy of the effect of overlap. The memoryaccess time af-fected by contention during the arbitration phase, the timeto be granted the busto start memory transfer, and the time to transfer data, especially that burst ofdata can be split into multiple non-contingent transfers.
Figure 7 shows the effect of scheduling shift on the average wait time on thebus for the six pairs of applications. The figure shows the percentage of changeof wait time per memory transaction compared with the wait time for the initialscheduling decision (thereference). Every memory transaction faces the un-contended latency in addition to the additional wait time due to contention. Theprofiles for the bus-access wait-time follow the profiles predicted by equations 1and equation 2. Both equations correlate to the wait on bus, as will be quantifiedlater. The reference average wait-time per memory transaction is small (in therange of 2 to 8 cycles) for applications with low bus contentions; specifically forPCM, SHA and GSM benchmarks. For Blowfish, Rijndael, and MAD bench-marks, the reference average wait time per memory transaction ranges from 12to 15 cycles. Percentage-wise the coscheduling decision impacts the wait timeof some benchmarks, for instance GSM, more than others, for instance Rijn-dael, while scheduling decision impacts the latter’s performance more. This isattributable to the higher miss rate and the higher wait timeinvolved such thatthe overall performance is more sensitive to the memory system performance.
The execution cycles for different scheduling decisions (Figure 2) follow theprofile of the bus performance introduced in Figure 8. To quantify the prediction

accuracy of our proposed scheme, we use the correlation coefficient; defined asfollows: let x be the average value of a random variableX . The variance is
defined asE{
(X − x)2}
= σXX ≡ 1n ∑n
i=1(xi − x)2. We also defineσX ≡√σXX .
A good measure of dependence between the two random variables X andY isthe correlation coefficient [20], defined as
ρXY ≡ E {(X − x)(Y − y)}σX ·σY
=σXY
σX ·σY(3)
The numerator of the right hand side is called the covarianceσXY of X andY . If X andY are linearly dependent, then|ρXY |= 1. If |ρXY |= 0, then observingthe valueX has no value in estimatingY .
We use the correlation coefficient to study the relation between equation 1,equation 2, bus access wait-time, and execution cycles. Table 2 shows the corre-lation coefficient between these measurements. Both shift-variance (defined byequation 1) and convolution (defined by equation 2) are very strongly relatedfor two processors system. One can replace the other, and preference is given tocomputational simplicity which favors convolution.
The correlation between the bus waits and the execution cycles ranges be-tween a lowest of 0.72 for PCM and highest of 0.97 for GSM. These values canbe classified as high to very high correlation according to Williams [21]. The busperformance does not perfectly correlate to the execution cycles (correlation of1) because the effects of cache misses on the performance arenot similar. Somebus transactions are more critical to performance than others, while all transac-tions contribute to the bus contention similarly. Additionally, the bus arbitrationpolicy is not perfectly fair.
The bus wait is more correlated to convolution (and to shift-variance), com-pared with correlation to execution cycles, because we usedthe bus traffic onlyin the convolution computation. These correlations, between bus wait and con-volution, range from a lowest of 0.71 for Rijndael to a highest of 0.93 for GSM.The total execution cycles depends on the interaction with other components onthe system. It is apparent that correlation coefficients between execution cyclesand convolution are lowered if the correlation between bus wait and executioncycles is low, or if the correlation between bus wait and shift variance is low.
These high correlation coefficients show that we can predictthe effect ofscheduling multiple processes sharing a bus. This prediction helps in identify-ing the best scheduling region. The exact performance difference, due to thescheduling, can be obtained through simulation of only few points of interest inthe regions identified by the proposed scheme.
Simulating the system without scheduling barriers, we found a drift in theexecution overlap that leads to performance change from onescheduling period

Table 2. Correlation coefficient (ρXY ) between bus wait time(Wait), execution cycles (Cycles),convolution(Conv), and shift-variance (SVar).
Bench Conv/SVarCycles/SVarWait/SVarWait/Cycles
Blowfish ∼= 1.000 0.7675 0.8043 0.8610Rijndael 0.9974 0.7238 0.7085 0.7956
SHA ∼= 1.000 0.7087 0.8707 0.8827GSM ∼= 1.000 0.8580 0.9266 0.9764PCM ∼= 1.000 0.5537 0.8538 0.7243MAD ∼= 1.000 0.8610 0.8858 0.9380
to the other. As discussed earlier, we propose using scheduling barrier to cir-cumvent this problem. We show the effect on performance of scheduling barrierin Figure 9, which shows the percentage of barrier wait for different schedulingdecision. The barrier overhead is reported as average and the variation in thewait time is reported as the 99th percentile around the average. Using schedul-ing barriers incurs a small overhead for all applications studied. The barriersynchronization time relative to the total execution time does not exceed 1.3%for Rijndael and Blowfish. We noticed that the variation of barrier wait time islargest for Rijndael and Blowfish, although almost two identical processes areoverlapping. This shows that the variation is mostly causedby the changes onoverlap of bus transactions and not the difference in the amount of work, whichis adjusted by the choice of common periodicity.
4.7 Proposed Scheme Applicability
Dynamic Voltage Scaling (DVS) and the proposed technique tackle the sameproblem of adjusting driving frequency/voltage for the sake of reducing thepower of applications with varying execution time. For hardrealtime applica-tions, DVS increase clock/voltage of the system to meet worst case executiontime and then tries to reclaim slack time by reducing voltage/frequency if itarises during execution [22,23].
The advantage of DVS is that this technique can be applied to all kind oftasks, but faces the following challenges: a) estimating the worst case executiontime, needed for hard realtime applications, is not always feasible for multipro-cessor machines; b) changing voltage/frequency usually involves complexity indesign and delayed response that reduces the amount of saving in power. The dy-namic adjustment may overclock frequency thus wasting power, or under-clockthe system frequency thus not meeting real time deadlines.
The proposed technique in this paper is applicable for special class of appli-cations with repeating pattern of accessing the memory. Forthese applications,a static schedule is selected that minimize the execution cycles and thus the

Blowfish Rijndael SHA GSM PCM MAD -0.2
0.0
0.2
0.4
0.6
0.8
1.0
1.2
1.4
Per
cen
tag
e o
f to
tal e
xecu
tio
n t
ime Average barrier wait time
Fig. 9.Scheduling barrier wait-time percentage with the 99th percentile around the average.
frequency/voltage needed to drive the system. This schedule is maintained bylow-overhead hardware barrier, thus reducing the variability in execution time.
The proposed scheme exploits repetitiveness of bus traffic.We show thatthe design space exploration can be surrogated by static analysis that alleviatesthe need of seemingly infeasible simulations. We studied different embeddedapplications from three different categories of benchmarks included in MiBenchsuite. The sources of bus traffic repetitiveness are as follows: a) algorithmicrepetition of processing, for instance, applying the same processing to multipleframes of data; b) control flow of the application that is not dependent on thedata processed.
Certainly these conditions do not apply for all embedded application. Wefound that some applications, from MiBench suite, may not benefit from theproposed scheme as summarized below: a) Applications that have amount andtype of processing dependent on the data in the frame processed. The trafficgenerated on the bus is thus not cleanly periodic, although the processing ofsome frames can be similar. Lame application, GPL’d MP3 encoder, and JPEGapplication, a standard lossy compression standard, are example applicationsthat exhibit this behavior. Fortunately, many of these applications are usuallynot hard realtime applications; b) Applications with constant bus traffic on thebus, for instance CRC32, 32-bit Cyclic Redundancy Check. Applications withconstant behavior does not benefit from DVS, as well as our technique, becausethere is no variability in execution time; c) Applications with no periodic be-havior, for instance FFT (Fast Fourier Transform). Some of these benchmarksare kernel codes that are called by higher level codes, and may be called in arepetitive way. In this case they can benefit from the proposed scheme.
We do not view these as limitations of applicability becausethe design ofembedded systems does not involve generalized design rules. Special techniquesare needed for different classes of systems to achieve certain design objectives,for instance ultra low-power systems. The proposed scheme can be thought ofas Static Voltage Scaling (SVS) technique that suites special applications that

shows periodicity. For this class of applications, SVS doesnot require com-plex mechanism for detecting and changing the driving frequency and voltage.Additionally, SVS reduce the variability in execution timeby forcing repetitiveoverlap of contending processes through barrier synchronization.
5 Multidimensional Coscheduling
Applying the proposed coscheduling techniques gain importance if the num-ber of scheduled processes increases because the search space for schedulingincreases exponentially. For instance, if we would like to explore one hundredscheduling decision for a certain application, then scheduling two processes ofthis application will require one hundred simulation runs,while scheduling fourprocesses will require 106 simulation runs. For the applications considered inthis study, GSM would have 49,836,032 scheduling decisionsfor four processes.Certainly, exploring such design spaces is not feasible through simulations; anda tool to predict points of interest in the design space is critically needed. Formultiprocessor system, estimating WCET is very challenging because of thenumerous contention scenarios that a process may encounter. Conventionally, asimple approach involves overestimating the clock frequency to guarantee prob-abilistic meet of deadlines.
In this section, we introduce the following generalizationof the formulationintroduced earlier in Section 4.4 to predict the effect of coscheduling, as follows:
Let the periodic time series for bus-busy percentages for the m applicationsthat need to be coscheduled in the systemx1
k , x2k , · · ·,xm
k ; The common periodicitypc is then computed such that(pc mod pxi)/pxi < tol.
Extending the definition for the shift-variance will be as follows: We definescheduling-shift vector asL : (l1, l2, ..., lm−1), whereli = 1, . . . , pc − 1. zL
k ,
x1k + ∑m
i=2xi(k+li−1)modpc
Var(L) =1pc
pc
∑k=1
(zLk − z)2 (4)
where ¯z = 1pc
∑pck=1∑m
i=1 xik. The convolution definition can be formulated as
follows:
Conv(L) =1pc
pc
∑k=1
x1k
m
∏i=2
xi(k+li−1)modpc
(5)
Traditionally, shared bus systems are limited to few processors on the sys-tem bus. We limited system exploration to a system of four processors. Unfor-tunately, we cannot perform full verification of the prediction of coscheduling

Table 3.Results summary for four processors system; Maximum difference of execution cycles(Cycles), and correlation with Convolution (Conv) and shift-variance (SVar).
benchmarkConv/SVarCycles/SVarCycles/Conv%Cycles Diff.
Blowfish 0.9001 0.6900 0.6334 9.35Rijndael 0.9675 0.4705 0.3875 23.84
SHA 0.9049 0.7074 0.4863 5.02GSM 0.6427 0.8241 0.5015 13.74PCM 0.9070 0.6592 0.4696 4.17MAD 0.8691 0.9002 0.7368 20.96
effect on performance, because we cannot simulate all the points of the schedul-ing space. Instead, we simulated three hundreds randomly selected schedulingpoints of the design space for each pair of applications. We also conducted sim-ulation of the best and worst scheduling points that were predicted by the mul-tidimensional shift-variance defined by equation 4.
To evaluate the correlation between the prediction function and the simu-lated point; the multidimensional space of scheduling is projected into a singledimensional space, and then the formulation defined by equation 3 is used.
Table 3 summarizes the results for the same set of applications studied inSection 4.6. We explored systems of four processes. We doubled the processesby repeating the pairs introduced in Section 4.6. Table 3 shows percentage ofchange in the execution cycles. The percentage of change increases with increas-ing of the number of processes contending on the bus. The mainreason is thatthe difference between coincidence of high traffic burst of four processes andthe optimal distribution of bus traffic gets larger. Certainly, this trend happensbecause of the ability of bus to absorb the bandwidth required by all runningprocesses. If the applications bandwidth demands exceededthe bus ability, weexpect that all processes will be slowed down and the difference in executioncycles will become smaller. The execution cycles difference is computed forthe randomly selected scheduling points that were simulated, including pointspredicted by the shift variance as candidate for minimum andmaximum cycles.The difference reaches a peak of 24% for Rijndael. Even if these differencesin cycles are not proved global minimum and global maximum, they show theimpact of scheduling on performance, and the need to enforcea scheduling toavoid missing deadlines for realtime systems.
Table 3 shows that the correlation between the convolution and shift vari-ance is not perfect for multidimensional scheduling, as we have seen earlier forone-dimensional scheduling. The shift variance gives better correlation with theperformance observed through simulations. This behavior is observed for all ap-

plications because the shift variance predicts performance based on the effect ofthe sum of all traffic instead of multiplying them.
Another observation is that the correlation of cycles with shift-variance de-creased with four processors systems compared with two processors system be-cause the fairness of the bus gets stressed. Although there is a need for furtherimprovements in this direction, simulations can not be seenas a feasible alter-native.
6 Related and Future Works
Recently numerous research proposals targeted optimizingcommunication ar-chitecture for efficient use of energy [24,25]. These proposals adapt commu-nication architecture to the application need or more specifically to the trafficgenerated by the application.
Adapting the system frequency/voltage to the application need is inten-sively studied for uniprocessor and multiprocessor systems. For uniprocessormachines, different proposals [6,26] address the problem of adapting frequency-voltage to meet realtime constraint and optimize for the energy consumption.
For multiprocessor, Yang et al. [27] propose dividing power-aware schedul-ing of processes into two phases: The first phase, done offline, summarizesthe possible schedule decisions. During runtime, the second phase, the actualscheduling decision is taken based on the predetermined scheduling options.Static Power Management is utilized by Gruian [1] to adjust the best supplyvoltage/frequency for each processor. Zhu et al. [8] adjustthe voltage/frequencylevel of the system to reclaim the slack time [28] in executing tasks by reducingthe frequency of future tasks.
In contrast, our work addresses one of the main causes of variability inshared memory multiprocessor which is the contention for memory on a sharedbus. Our proposed technique finds a scheduling decision thatreduces the num-ber of cycles needed to execute a task by reducing the effect of bus contention.We predict a good offline static schedule for the applications. We verified ourtechnique for six pairs of applications. We explored extending the coschedule toany number of coscheduled applications. One constraint to this work is that it isapplicable for applications that exhibit periodic bus behavior.
Future work includes exploring different bus arbitration policies and study-ing the best scheduling decision under these policies. Differentiating bus trafficinto critical and less critical to performance need to be augmented to our for-mulation to reach a better estimate of performance and servethe needs for morecomplex processors systems. We believe that studying the effect of contentionon shared resources should gain more attention from system designers.

7 Conclusions
Minimization of execution cycles for a given periodic task is essential for powersaving. For a given realtime deadline, the frequency increases linearly with theexecution cycles. The power consumption varies cubically with the frequency.One source of increasing the execution cycles is the contention on the shared busin multiprocessor system. Through cycle simulation, we show that the executioncycles can vary by up to 13% for benchmarks running on two processors system,and 24% for four processors systems. These executions cycles varies the systempower requirements greatly, because of the need to adjust the clock frequencyto meet the system realtime constraints. This dynamic powersaving can reach57% for Rijndael executed on a quad-core MPSoC.
To alleviate the high cost of searching best scheduling overlap using simu-lation, we propose a scheme based on shift variance of the bustraffic profilesobtained while running these applications individually. We outlined the stepsneeded to strip application’s initialization period and todetect the applicationperiodicity based on bus traffic. Using shift-variance, we show that we can pre-dict the effect of coscheduling under multiple scheduling overlaps. We also pro-pose the use of scheduling barrier to maintain scheduling decision, which incursvery little overhead. We show that the prediction of scheduling effect using shiftvariance is highly correlated to the results obtained usingsimulations. We alsoextended our performance prediction mechanism to systems of larger numberof processors with acceptable prediction accuracy.
References
1. Gruian, F.: System-Level Design Methods for Low-Energy Architectures Containing Vari-able Voltage Processors. The First Int’l Workshop on Power-Aware Computer Systems-Revised Papers (PACS’00) (2000) 1–12
2. Shin, Y., Choi, K., Sakurai, T.: Power Optimization of Real-time Embedded Systems onVariable Speed Processors. The 2000 IEEE/ACM Int’l Conf. onComputer-Aided Design(ICCAD’00) (2000) 365–368
3. Weiser, M., Welch, B., Demers, A., Shenker, S.: Scheduling for Reduced CPU Energy. TheFirst USENIX Symp. on Operating Systems Design and Implementation (OSDI’94) (1994)13–23
4. Nguyen, T.D., Vaswani, R., Zahorjan, J.: Using Runtime Measured Workload Characteris-tics in Parallel Processor Scheduling. Workshop on Job Scheduling Strategies for ParallelProcessing (IPPS’96) (1996) 93–104
5. Snavely, A., Tullsen, D.M.: Symbiotic Jobscheduling fora Simultaneous MultithreadedProcessor. The 9th Int’l Conf. on Architectural Support forProgramming Languages andOperating Systems (ASPLOS-IX) (2000) 234–244
6. Rotenberg, E.: Using Variable-MHz Microprocessors to Efficiently Handle Uncertainty inReal-time Systems. The 34th annual ACM/IEEE Int’l Symp. on Microarchitecture (MICRO34) (2001) 28–39

7. Seth, K., Anantaraman, A., Mueller, F., Rotenberg, E.: FAST: Frequency-Aware Static Tim-ing Analysis. The 24th IEEE Real-Time Systems Symp. (RTSS’03) (2003) 40–51
8. Zhu, D., Melhem, R., Childers, B.R.: Scheduling with Dynamic Voltage/Speed AdjustmentUsing Slack Reclamation in Multiprocessor Real-Time Systems. IEEE Trans. on Paralleland Distributed Systems14(7) (2003) 686–700
9. Butts, J.A., Sohi, G.S.: A Static Power Model for Architects. (2000) 191–20110. Brandolese, C., Salice, F., Fornaciari, W., Sciuto, D.:Static Power Modeling of 32-bit Mi-
croprocessors. IEEE Trans. on Computer-Aided Design of Integrated Circuits and Systems21(11) (2002) 1306–1316
11. Guthaus, M.R., Ringenberg, J.S., Ernst, D., Austin, T.M., Mudge, T., Brown, R.B.: MiBench:A Free, Commercially Representative Embedded Benchmark Suite. The IEEE 4th AnnualWorkshop on Workload Characterization (2001)
12. Benini, L., Bertozzi, D., Bogliolo, A., Menichelli, F.,Olivieri, M.: MPARM: Exploring theMulti-Processor SoC Design Space with SystemC. Journal of VLSI Signal Processing41(2005) 169–182
13. Dales, M.: SWARM – Software ARM. (http://www.cl.cam.ac.uk/ mwd24/phd/swarm.html)14. : ARM, AMBA Bus. (http://www.arm.com/products/solutions/AMBA_Spec.html)15. Sherwood, T., Perelman, E., Calder, B.: Basic Block Distribution Analysis to Find Periodic
Behavior and Simulation Points in Applications. Int’l Conf. on Parallel Architectures andCompilation Techniques (2001)
16. Small, M., Judd, K.: Detecting Periodicity in Experimental Data Using Linear ModelingTechniques. Physical Review E59(2) (1999) 1379–1385
17. Sherwood, T., Perelman, E., Hamerly, G., Calder, B.: Automatically Characterizing LargeScale Program Behavior. The 10th Int’l Conf. on Architectural Support for ProgrammingLanguages and Operating Systems (ASPLOS-X) (2002) 45–57
18. Beckmann, C.J., Polychronopoulos, C.D.: Fast Barrier Synchronization Hardware. The 1990ACM/IEEE conference on Supercomputing (Supercomputing’90) (1990) 180–189
19. Sivaram, R., Stunkel, C.B., Panda, D.K.: A Reliable Hardware Barrier SynchronizationScheme. The 11th Int’l Symp. on Parallel Processing (IPPS’97) (1997) 274–280
20. Shanmugan, K.S., Breipohl, A.M.: Random Signals: Detection, Estimation and Data Anal-ysis. Wiley (1988)
21. Williams, F., Monge, P.: Reasoning with statistics: Howto read quantitative research (5thed.). London: Harcourt College Publishers (2001)
22. Lee, Y.H., Krishna, C.M.: Voltage-Clock Scaling for LowEnergy Consumption in Fixed-Priority Real-Time Systems. Real-Time Systems24(3) (2003) 303–317
23. Krishna, C.M., Lee, Y.H.: Voltage-clock-scaling adaptive scheduling techniques for lowpower in hard real-time systems. IEEE Trans. on Computers52(12) (2003) 1586–1593
24. Nicoud, J.D., Skala, K.: REYSM, a High Performance, Low Power Multi-processor Bus.The 13th Int’l Symp. on Computer Architecture (1986) 169–174
25. Lahiri, K., Dey, S., Raghunathan, A.: Communication Architecture Based Power Manage-ment for Battery Efficient System Design. The 39th Conf. on Design Automation (DAC’02)(2002) 691–696
26. Anantaraman, A., Seth, K., Patil, K., Rotenberg, E., Mueller, F.: Virtual Simple Architecture(VISA): Exceeding the Complexity Limit in Safe Real-time Systems. The 30th annual int’lSymp. on Computer Architecture (ISCA ’03) (2003) 350–361
27. Yang, P., Wong, C., Marchal, P., Catthoor, F., Desmet, D., Verkest, D., , Lauwereins, R.:Energy-Aware Runtime Scheduling for Embedded-Multiprocessor SOCs. IEEE Design andTest of Computers18(5) (2001) 46–58
28. Hua, S., Qu, G.: Power Minimization Techniques on Distributed Real-time Systems byGlobal and Local Slack Management. The 2005 Conf. on Asia South Pacific Design Au-tomation (ASP-DAC’05) (2005) 830–835