power and sample size - vch research institute · pdf filepower and sample size lisa kuramoto...
TRANSCRIPT

Power and Sample Size
Lisa KuramotoCentre for Clinical Epidemiology and
Evaluation
OverviewOutline• Review• Introduction to power and effect size• Power and other factors• Example – estimating sample size
Learning objectives• to be able to define power• to be able to name 3 factors that affect power• to be aware of power and sample size resources

Review
Terminology
• null hypothesis, HO
• alternative hypothesis, HA
typically states that there is no relationship between the response and explanatory variable(s)
typically states that there is a relationship between the response and explanatory variable(s)

Review
More terminology
• type I error, α
• type II error, β
chance of mistakenly rejecting HO
chance of mistakenly accepting HO
Review
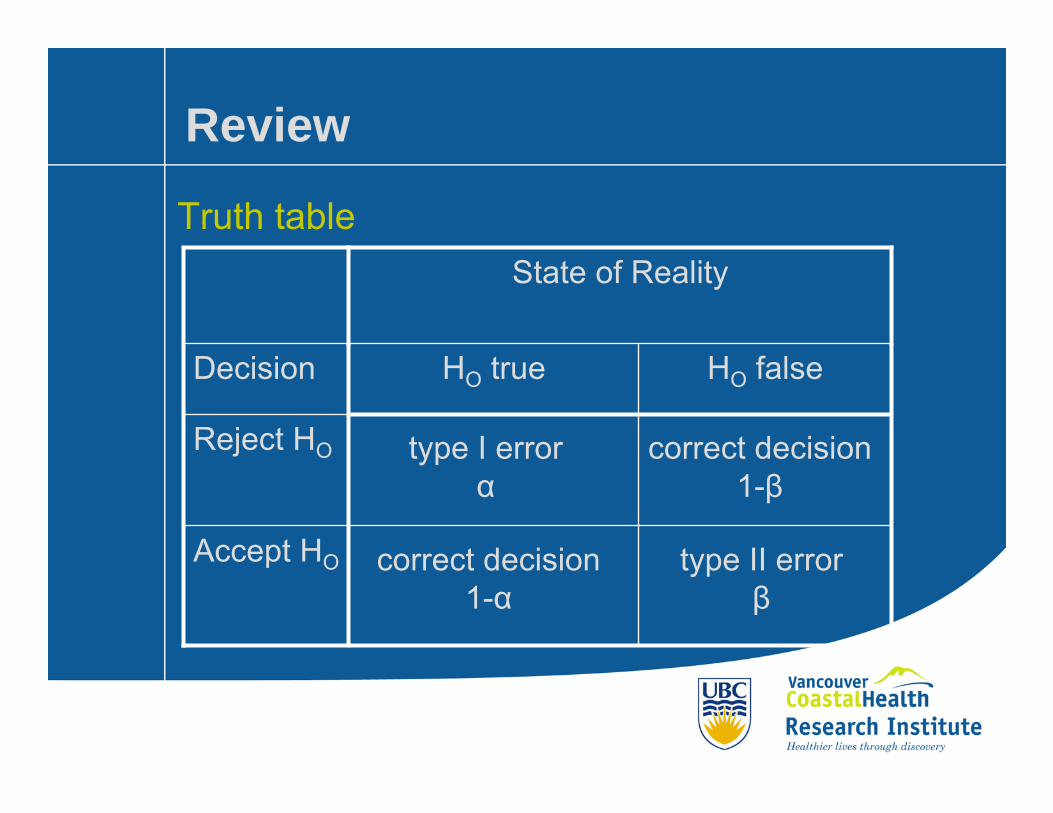
Truth tableState of Reality
Accept HO
Reject HO
HO falseHO trueDecision
type I errorα
type II errorβ
correct decision1-α
correct decision1-β
Introduction to power
What is power?• chance of correctly rejecting HO
ie. finding a true significant result
Why is power analysis important?• helps to design study
• determines if we are able to detect a meaningful effect

Introduction to powerGraphical representation

Introduction to effect size
What is effect size?• “the degree to which the null hypothesis is false”
(Cohen, 1977)• refers to the population rather than a specific sample• effect size is a scale-free, continuous measure• under HO, effect size, d, is 0• each statistical test has its own effect size index

Introduction to effect size
Some tests and their effect sizes• two sample t-test: difference between means in terms
of within group standard deviation • product-moment correlation: correlation• one-way analysis of variance: ratio of standard
deviation between groups and standard deviation within groups
• see Cohen (1992)

Introduction to effect size
How to estimate effect size?• prior research• theoretical context of the research
“What is the smallest, clinically significant difference?”“What is important enough to warrant attention?”
• use of special conventions
Power and other factors
What affects power?• type I error• type II error• sample size• effect size

Power and other factors
Power and type I error• α level is the chance of a type I error• as α decreases, power decreases• we want α to be small• generally α is 0.01 or 0.05

Power and other factors
Power and type II error• β is the chance of a type II error• as β decreases, power increases• we want β to be small• generally, β ≤ 0.20

Power and other factors
Power and sample size• n is the number of sampling units in your study• as sample size increases, power increases• the more power you want in your study, the larger the
sample size you will require

Power and other factors
Power and effect size• effect size is “the degree to which the null hypothesis
is false” (Cohen, 1977)• as the effect size increases in magnitude, power
increases• we can denote effect size by d

Power and other factors
Check your understanding

Types of power analyses
A priori • done before the study is conducted• helps in the design of study
Post hoc• done after the study is conducted• helps to understand observed results
Compromise• done when sample size is restricted

How can we estimate sample size?Analytical formulae• some exact or approximate formulae available • typically difficult to obtain
Published tables• literature has tables of sample size for specific type I
error, power, and effect size combinationseg. Cohen (1977)
Software• some software can do power analysis; important to
understand inputs and outputseg. G*Power, UnifyPow (SAS)
Example: scenario
Suppose that you would like to compare the effect of a newly developed drug (drug A) and a current drug (drug B) on systolic blood pressure (sbp). You would like to know how many patients to include in your study.
What information do we need?

Example: statistical problemWhat is the hypothesis?HO:
HA:
How will we test this hypothesis?
.
the mean sbp among patients on drug A is the same as those patients on drug B
ie. µA= µB
the mean sbp among patients on drug A is different from those patients on drug B
ie. µA≠ µB
independent two-sample t-test with two-sided alternative

Example: What affects sample size?
Q: How often would you be comfortable with rejecting HO when there is no difference?
A: 1 out of 20 timesα = 0.05
type I error

Example: What affects sample size?
Q: If there is actually a difference, with what probability would you like to detect this difference?
A: want 80% chance of detecting difference1-β = 0.80
power

Example: What affects sample size?
Q: What is the smallest, clinically significant difference that you would like to detect?
A: It is known from past studies that patients on the current drug have an average sbp of 125 mmHg with a standard deviation of 20 mmHg. We would like to detect a 10% difference. We assume the standard deviation of sbp using the new drug will be 20 also.
d = (125*0.10)/20 ≈ 0.63
effect size

Example: estimating sample sizeHow can we compute sample size using analytical methods?
For an independent two-sided t-test (with two-sided alternative):
n ≥ 2*(z1-α/2 - zβ)2/d2
≥ 2*(1.96 - (-0.84))2/(0.63)2
≥ 40.2
We need at least 41 subjects per group
Example: estimating sample size
How can we compute sample size using tables?• reference: Cohen, 1977• How to read the table:
a1 is type I error for one-sided testa2 is type I error for two-sided testd is effect sizePower is power
• table shows sample size per group

Example: estimating sample size
How can we compute sample size using tables?• From the table, we can see that we need a sample
size that is more than , but less than in each group
• Using linear interpolation, an effect size of 0.63 corresponds to a sample size of about 41.4
33 45
We need at least 42 subjects per group
Example: estimating sample size
How can we compute sample size using software?
G*Power (Erdfelder, et al 1996)• general power analysis program • can compute sample size and power for t-tests,
F-tests, chi-square tests • freeware for Windows and MacIntosh• website: http://www.psycho.uni-
duesseldorf.de/aap/projects/gpower/

Example: estimating sample sizeHow can we compute sample size using
software?
1. Select type of test: t-Test (means) default2. Select type of analysis: A priori3. Select alternative hypothesis: Two tailed4. Input parameters:
effect size = 0.63alpha = 0.05power = 0.80
5. Hit “enter”

Example: estimating sample size
What does G*Power output tell us?• Total sample size is 82 • Actual power is 0.8046• Critical t(80) is 1.9901
We need at least 41 subjects per group

Example: follow-up
How do the following affect sample size?1. want the chance of finding an effect, if one really
exists, to be 0.952. want to detect a 15% difference3. standard deviation of sbp ranges from 15-25 mmHg4. want 99% chance of correctly claiming there is no
difference between the two drugs5. want to see if drug B lowers sbp more than drug A

Example: follow-up part 1
Power, 1-β
1-β = 0.95, so β = 0.05
Using analytical methods:n ≥ 2*(z1-α/2 - zβ)2/d2
≥ 2*(1.96 - (-1.64))2/(0.63)2
≥ 66.5
We need at least 67 subjects per group.

Example: follow-up part 2
Effect size, d
d =(125*0.15)/20 ≈ 0.94
Using analytical methods:n ≥ 2*(z1-α/2 - zβ)2/d2
≥ 2*(1.96 - (-0.84))2/(0.94)2
≥ 17.9
We need at least 18 subjects per group.

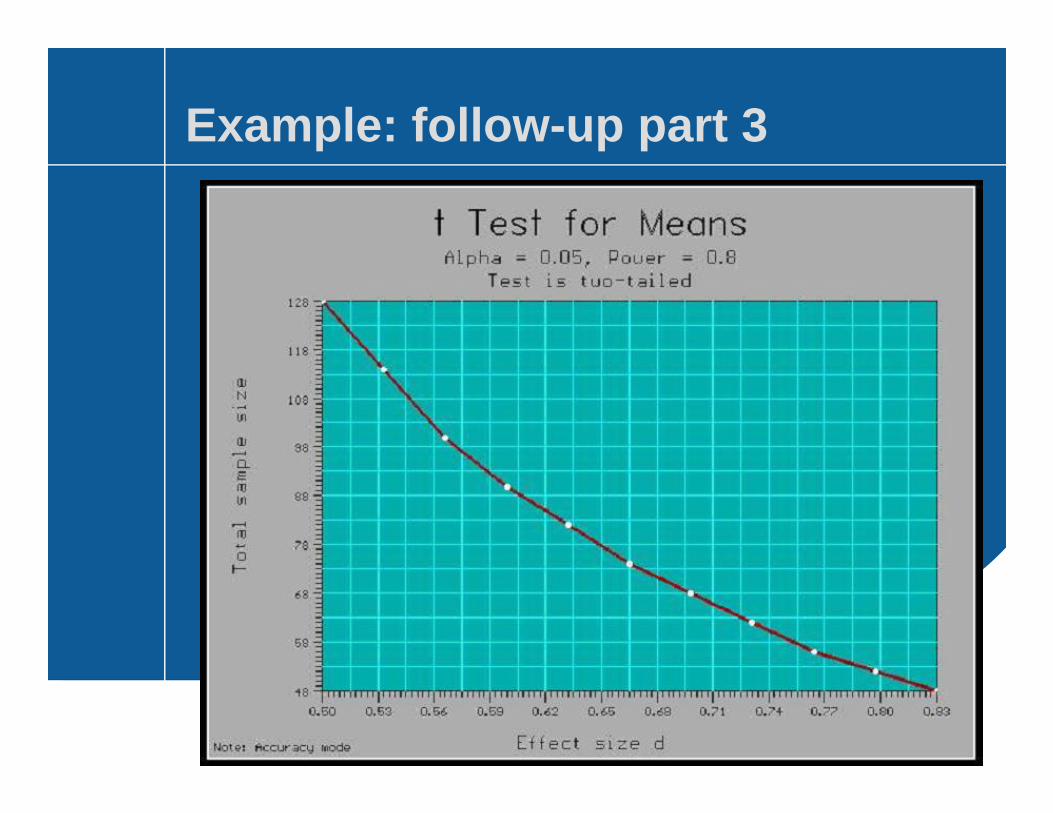
Example: follow-up part 3
Effect size, d
d ranges from 0.50 to 0.83[ d = (125*0.10)/15 ≈ 0.83; d = (125*0.10)/25 ≈ 0.50 ]
Using software:We can see how sample size changes with effect size
Example: follow-up part 3

Example: follow-up part 4
type I error, α
α = 0.01
Using published tables:β = 0.20, d = 0.63, α = 0.01
We need at least 61 subjects per group.

Example: follow-up part 5
hypothesis
one-sided alternativeHO: µA ≤ µB
HA: µA > µB
Using software:Select alternative hypothesis: One tailed
We need at least 32 subjects per group.

References
• Bartko JJ, Pulver AE, & Carpenter WT. (1988). “The power of analysis: Statistical perspectives. Part II.” Psychiatry Research, 23: 301-309.
• Cohen, J. (1992). A Power Primer. Psychological Bulletin, 112:155-159.
• Cohen, J. (1977). Statistical Power Analysis for the Behavioral Sciences. New York: Academic Press.
• Erdfelder E, Faul F, & Buchner A. (1996). “GPOWER: A general power analysis program.” Behavior Research Methods, Instruments, & Computers, 28: 1-11.
• Franklin R, Allison D, & Gorman B. (1997). Design and Analysis of Single-Case Research. New Jersey: Erlbaum.
• O'Brien, RG (1998), "A Tour of UnifyPow: A SAS Module/Macro for Sample-Size Analysis," Proceedings of the 23rd SAS Users Group International Conference, Cary NC: SAS Institute, 1346-1355.