poverty: teaching mathematics and social justice
TRANSCRIPT
POVERTY: Teaching Mathematics and Social JusticeAuthor(s): Leah P. McCoySource: The Mathematics Teacher, Vol. 101, No. 6 (FEBRUARY 2008), pp. 456-461Published by: National Council of Teachers of MathematicsStable URL: http://www.jstor.org/stable/20876177 .
Accessed: 24/04/2014 11:45
Your use of the JSTOR archive indicates your acceptance of the Terms & Conditions of Use, available at .http://www.jstor.org/page/info/about/policies/terms.jsp
.JSTOR is a not-for-profit service that helps scholars, researchers, and students discover, use, and build upon a wide range ofcontent in a trusted digital archive. We use information technology and tools to increase productivity and facilitate new formsof scholarship. For more information about JSTOR, please contact [email protected].
.
National Council of Teachers of Mathematics is collaborating with JSTOR to digitize, preserve and extendaccess to The Mathematics Teacher.
http://www.jstor.org
This content downloaded from 89.160.155.250 on Thu, 24 Apr 2014 11:45:55 AMAll use subject to JSTOR Terms and Conditions
POVERTY
Teaching Mathematics
and Social Justice
Leah P. McCoy
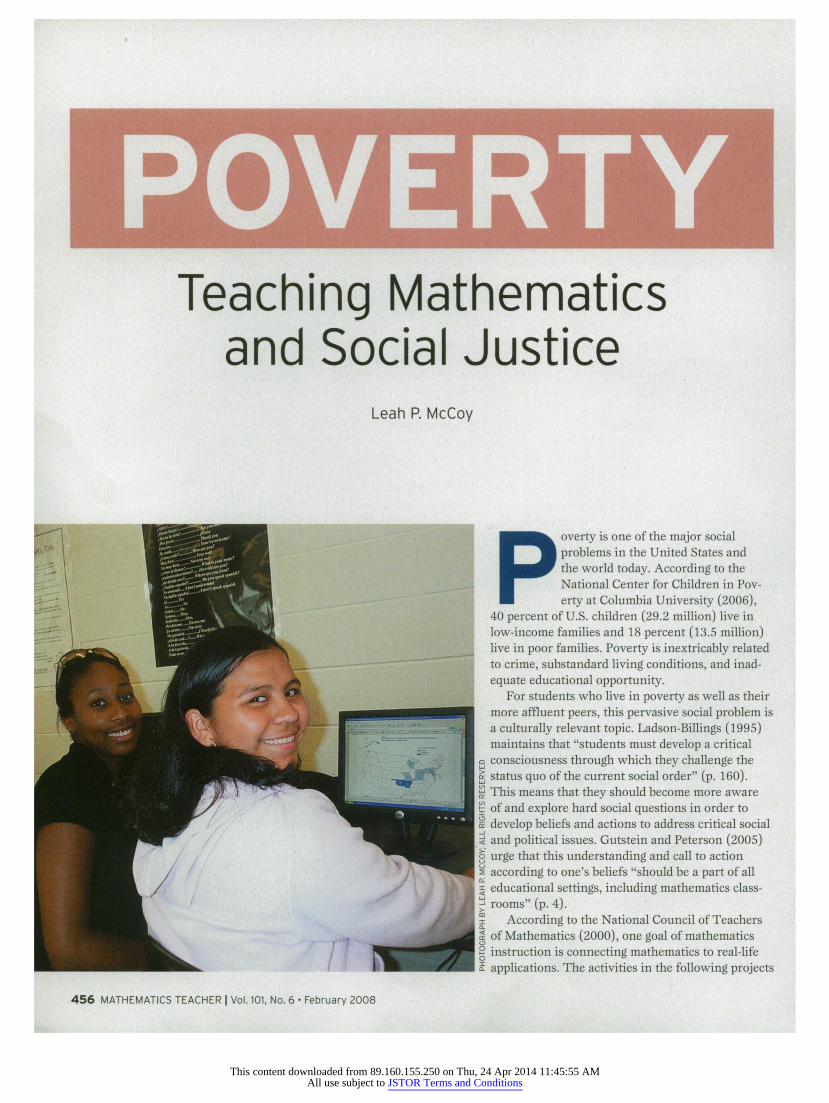
Poverty is one of the major social
problems in the United States and the world today. According to the
National Center for Children in Pov
erty at Columbia University (2006), 40 percent of U.S. children (29.2 million) live in low-income families and 18 percent (13.5 million) live in poor families. Poverty is inextricably related to crime, substandard living conditions, and inad
equate educational opportunity. For students who live in poverty as well as their
more affluent peers, this pervasive social problem is a culturally relevant topic. Ladson-Billings (1995) maintains that "students must develop a critical consciousness through which they challenge the status quo of the current social order" (p. 160). This means that they should become more aware of and explore hard social questions in order to
develop beliefs and actions to address critical social and political issues. Gutstein and Peterson (2005) urge that this understanding and call to action
according to one's beliefs "should be a part of all educational settings, including mathematics class rooms" (p. 4).
According to the National Council of Teachers of Mathematics (2000), one goal of mathematics instruction is connecting mathematics to real-life
applications. The activities in the following projects
456 MATHEMATICS TEACHER | Vol. 101, No. 6 February 2008
This content downloaded from 89.160.155.250 on Thu, 24 Apr 2014 11:45:55 AMAll use subject to JSTOR Terms and Conditions
use all five of the NCTM Process Standards. The authentic context provides a relevant connection between mathematics and the real world and allows students to experience significant activities in a
problem-solving format. Analysis involves reason
ing through the use of multiple representations of data as well as communicating conclusions.
Acquiring skills in computation and reasoning mathematically are two significant components of students' education. Another component is enhanc
ing students' social consciousness?it is important that they think and talk about issues of social jus tice, such as poverty. The following activities stress both good mathematics and awareness of social issues.
WHAT IS POVERTY? The first activity introduces the reality of poverty and asks students to consider life below the poverty level. It asks them to create a budget for a family below the poverty line and then reflect in writing about living in poverty. This activity could be used with any mathematics course in grades 6-12.
In a speech on the Senate floor about the Hur ricane Katrina disaster in New Orleans, Senator Barak Obama charged that "the government was so detached from the realities of inner city life in New Orleans that they couldn't conceive of the notion that every American couldn't," in Obama's words, "
'load up their family in an SUV, fill it up with
$100 worth of gasoline, stick some bottled water in the trunk and use a credit card to check into a hotel on safe ground'" (Alter 2005).
Food, shelter, clothing, health care, and trans
portation are only the most basic necessities of life in modern America. Each year, the federal govern
ment calculates the minimum amount of money required by families to meet these basic needs. The
resulting calculation is commonly referred to as the
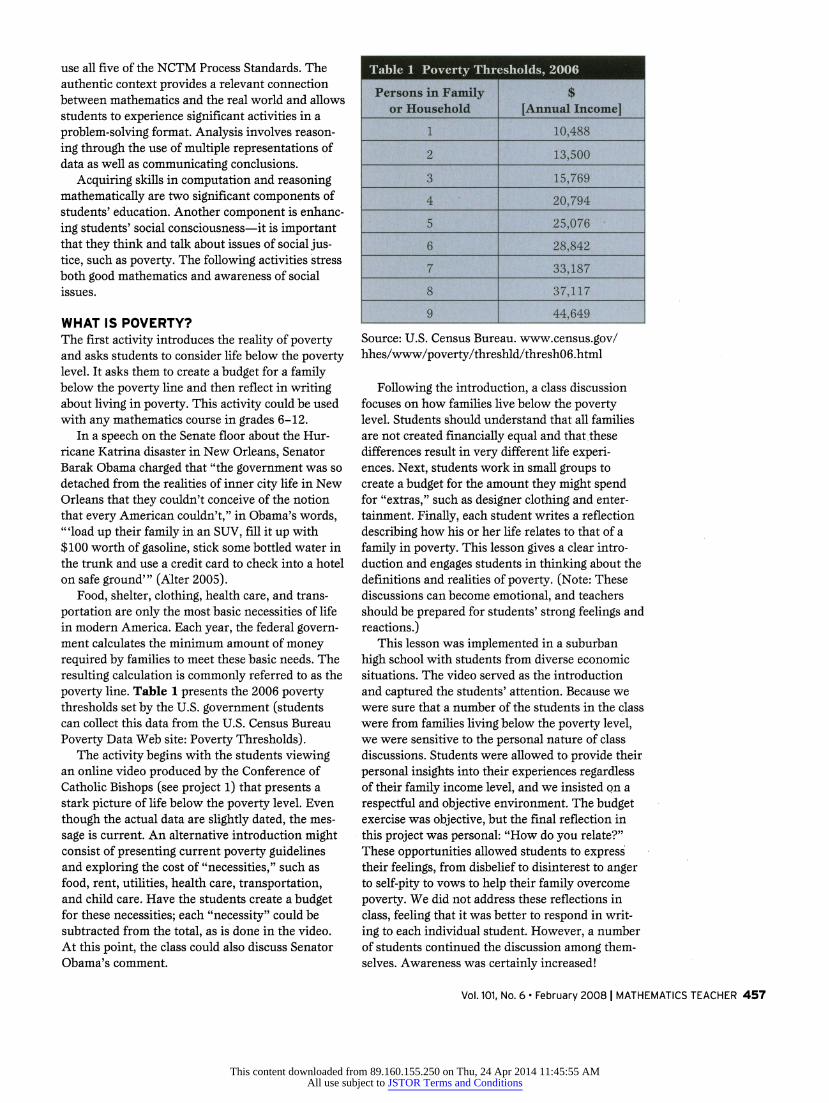
poverty line. Table 1 presents the 2006 poverty thresholds set by the U.S. government (students can collect this data from the U.S. Census Bureau
Poverty Data Web site: Poverty Thresholds). The activity begins with the students viewing
an online video produced by the Conference of Catholic Bishops (see project 1) that presents a stark picture of life below the poverty level. Even
though the actual data are slightly dated, the mes
sage is current. An alternative introduction might consist of presenting current poverty guidelines and exploring the cost of "necessities," such as
food, rent, utilities, health care, transportation, and child care. Have the students create a budget for these necessities; each "necessity" could be subtracted from the total, as is done in the video.
At this point, the class could also discuss Senator Obama's comment.
Table 1 Poverty Thresholds, 2006
Persons in Family or Household [Annual Income]
1 10,488
13,500
15,769
20,794
25,076
28,842
33,187
37,117
44,649
Source: U.S. Census Bureau, www.census.gov/
hhes/www/poverty/threshld/thresh06.html
Following the introduction, a class discussion focuses on how families live below the poverty level. Students should understand that all families are not created financially equal and that these differences result in very different life experi ences. Next, students work in small groups to create a budget for the amount they might spend for "extras," such as designer clothing and enter tainment. Finally, each student writes a reflection
describing how his or her life relates to that of a
family in poverty. This lesson gives a clear intro duction and engages students in thinking about the definitions and realities of poverty. (Note: These discussions can become emotional, and teachers should be prepared for students' strong feelings and
reactions.)
This lesson was implemented in a suburban
high school with students from diverse economic situations. The video served as the introduction and captured the students' attention. Because we were sure that a number of the students in the class were from families living below the poverty level, we were sensitive to the personal nature of class discussions. Students were allowed to provide their
personal insights into their experiences regardless of their family income level, and we insisted on a
respectful and objective environment. The budget exercise was objective, but the final reflection in this project was personal: "How do you relate?" These opportunities allowed students to express their feelings, from disbelief to disinterest to anger to self-pity to vows to help their family overcome
poverty. We did not address these reflections in
class, feeling that it was better to respond in writ
ing to each individual student. However, a number of students continued the discussion among them selves. Awareness was certainly increased!
Vol. 101, No. 6 February 2008 | MATHEMATICS TEACHER 457
This content downloaded from 89.160.155.250 on Thu, 24 Apr 2014 11:45:55 AMAll use subject to JSTOR Terms and Conditions
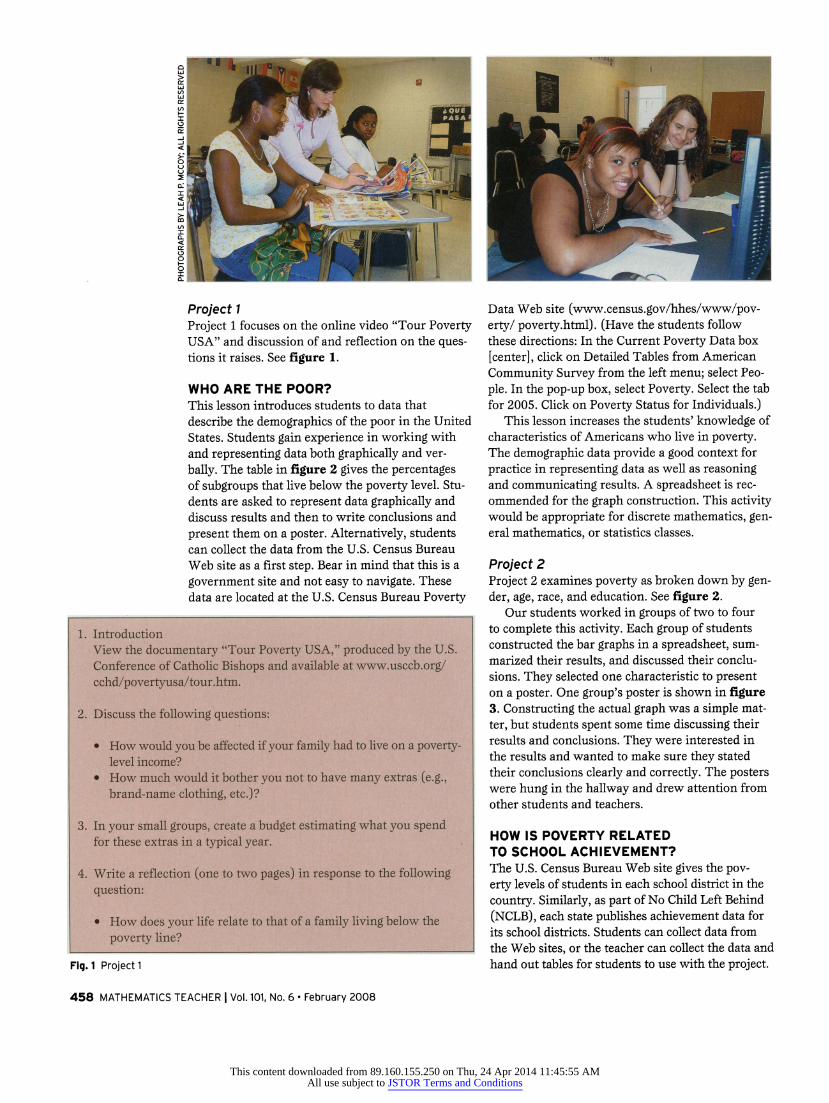
Project 1 Project 1 focuses on the online video "Tour Poverty USA" and discussion of and reflection on the ques tions it raises. See figure 1.
WHO ARE THE POOR? This lesson introduces students to data that describe the demographics of the poor in the United States. Students gain experience in working with and representing data both graphically and ver
bally. The table in figure 2 gives the percentages of subgroups that live below the poverty level. Stu dents are asked to represent data graphically and discuss results and then to write conclusions and
present them on a poster. Alternatively, students can collect the data from the U.S. Census Bureau
Web site as a first step. Bear in mind that this is a
government site and not easy to navigate. These data are located at the U.S. Census Bureau Poverty
1. Introduction View the documentary "Tour Poverty USA," produced by the U.S.
Conference of Catholic Bishops and available at www.usccb.org/
cchd/povertyusa/tour.htm.
2. Discuss the following questions:
How would you be affected if your family had to live on a poverty level income? How much would it bother you not to have many extras (e.g., brand-name clothing, etc.)?
3. In your small groups, create a budget estimating what you spend for these extras in a typical year.
4. Write a reflection (one to two pages) in response to the following
question:
How does your life relate to that of a family living below the
poverty line?
Fig. 1 Project 1
Data Web site (wwwxensus.gov/hhes/vvww/pov erty/ poverty.html). (Have the students follow these directions: In the Current Poverty Data box
[center], click on Detailed Tables from American
Community Survey from the left menu; select Peo
ple. In the pop-up box, select Poverty. Select the tab for 2005. Click on Poverty Status for Individuals.)
This lesson increases the students' knowledge of characteristics of Americans who live in poverty. The demographic data provide a good context for
practice in representing data as well as reasoning and communicating results. A spreadsheet is rec
ommended for the graph construction. This activity would be appropriate for discrete mathematics, gen eral mathematics, or statistics classes.
Project 2 Project 2 examines poverty as broken down by gen der, age, race, and education. See figure 2.
Our students worked in groups of two to four to complete this activity. Each group of students constructed the bar graphs in a spreadsheet, sum
marized their results, and discussed their conclu sions. They selected one characteristic to present on a poster. One group's poster is shown in figure 3. Constructing the actual graph was a simple mat
ter, but students spent some time discussing their results and conclusions. They were interested in
the results and wanted to make sure they stated their conclusions clearly and correctly. The posters
were hung in the hallway and drew attention from
other students and teachers.
HOW IS POVERTY RELATED TO SCHOOL ACHIEVEMENT? The U.S. Census Bureau Web site gives the pov
erty levels of students in each school district in the
country. Similarly, as part of No Child Left Behind
(NCLB), each state publishes achievement data for its school districts. Students can collect data from the Web sites, or the teacher can collect the data and hand out tables for students to use with the project.
458 MATHEMATICS TEACHER | Vol. 101, No. 6 February 2008
This content downloaded from 89.160.155.250 on Thu, 24 Apr 2014 11:45:55 AMAll use subject to JSTOR Terms and Conditions
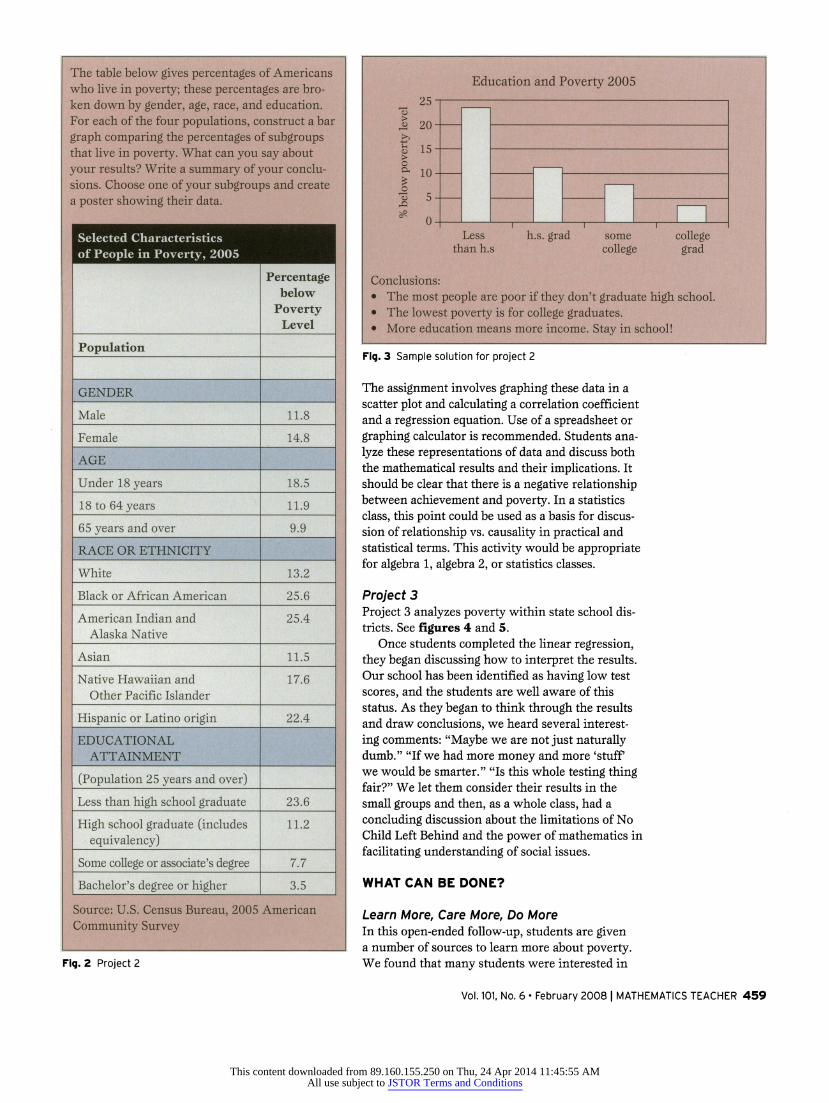
The table below gives percentages of Americans who live in poverty; these percentages are bro ken down by gender, age, race, and education. For each of the four populations, construct a bar
graph comparing the percentages of subgroups that live in poverty. What can you say about
your results? Write a summary of your conclu sions. Choose one of your subgroups and create a poster showing their data.
Selected Characteristics
of People in Poverty, 2005
Percentage
below
Poverty Level
Population
GENDER
Male
Female
AGE
Under 18 years
18 to 64 years
65 years and over
RACE OR ETHNICITY
White
Black or African American
American Indian and Alaska Native
Asian
Native Hawaiian and Other Pacific Islander
Hispanic or Latino origin
EDUCATIONAL ATTAINMENT
(Population 25 years and over)
Less than high school graduate
High school graduate (includes equivalency)
Some college or associate's degree
Bachelor's degree or higher
Source: U.S. Census Bureau, 2005
Community Survey
American
Fig. 2 Project 2
Education and Poverty 2005
25
20
15
10
0
5
Less
than h.s
h.s. grad some
college college grad
Conclusions: The most people are poor if they don't graduate high school. The lowest poverty is for college graduates. More education means more income. Stay in school!
Fig. 3 Sample solution for project 2
The assignment involves graphing these data in a scatter plot and calculating a correlation coefficient and a regression equation. Use of a spreadsheet or
graphing calculator is recommended. Students ana
lyze these representations of data and discuss both the mathematical results and their implications. It should be clear that there is a negative relationship between achievement and poverty. In a statistics
class, this point could be used as a basis for discus sion of relationship vs. causality in practical and statistical terms. This activity would be appropriate for algebra 1, algebra 2, or statistics classes.
Project 3 Project 3 analyzes poverty within state school dis tricts. See figures 4 and 5.
Once students completed the linear regression, they began discussing how to interpret the results. Our school has been identified as having low test
scores, and the students are well aware of this status. As they began to think through the results and draw conclusions, we heard several interest
ing comments: "Maybe we are not just naturally dumb." "If we had more money and more 'stuff we would be smarter." "Is this whole testing thing fair?" We let them consider their results in the small groups and then, as a whole class, had a
concluding discussion about the limitations of No Child Left Behind and the power of mathematics in
facilitating understanding of social issues.
WHAT CAN BE DONE?
Learn More, Care More, Do More In this open-ended follow-up, students are given a number of sources to learn more about poverty.
We found that many students were interested in
Vol. 101, No. 6 February 2008 | MATHEMATICS TEACHER 459
This content downloaded from 89.160.155.250 on Thu, 24 Apr 2014 11:45:55 AMAll use subject to JSTOR Terms and Conditions
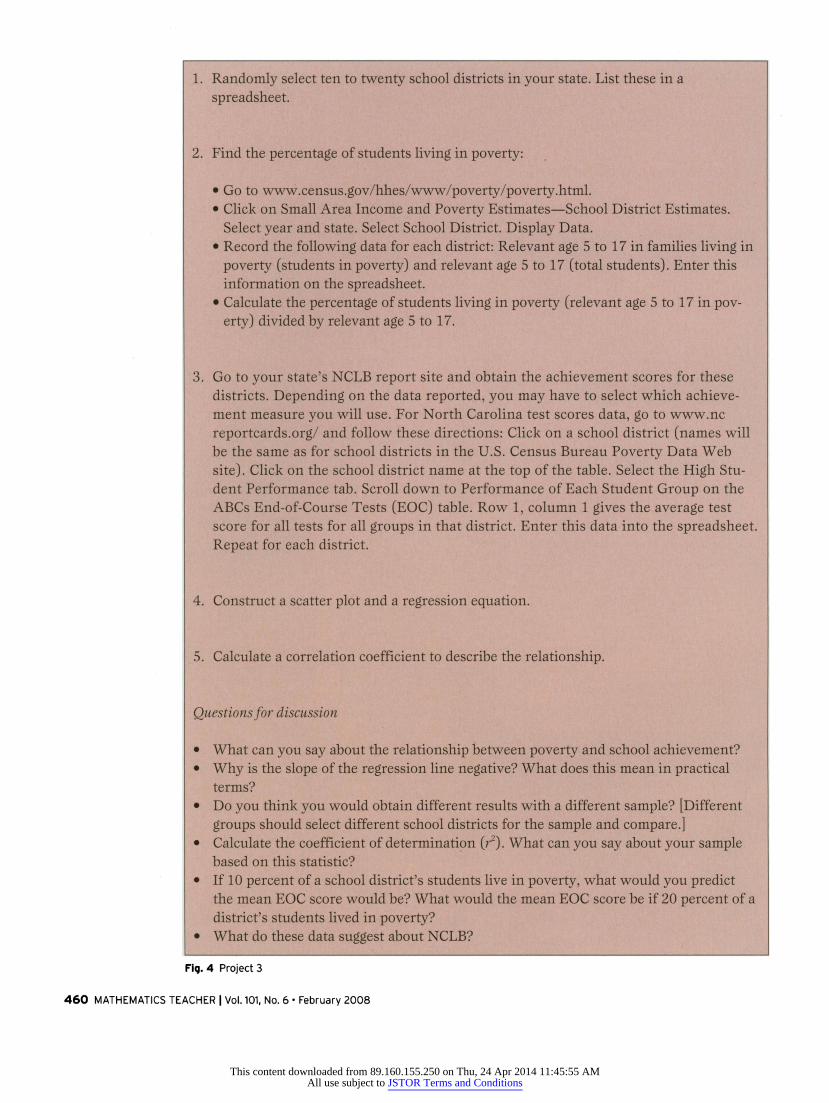
1. Randomly select ten to twenty school districts in your state. List these in a
spreadsheet.
2. Find the percentage of students living in poverty:
Go to wwwxensus.gov/hhes/www/poverty/poverty.html. Click on Small Area Income and Poverty Estimates?School District Estimates.
Select year and state. Select School District. Display Data.
Record the following data for each district: Relevant age 5 to 17 in families living in
poverty (students in poverty) and relevant age 5 to 17 (total students). Enter this information on the spreadsheet. Calculate the percentage of students living in poverty (relevant age 5 to 17 in pov erty) divided by relevant age 5 to 17.
3. Go to your state's NCLB report site and obtain the achievement scores for these
districts. Depending on the data reported, you may have to select which achieve ment measure you will use. For North Carolina test scores data, go to www.nc
reportcards.org/ and follow these directions: Click on a school district (names will be the same as for school districts in the U.S. Census Bureau Poverty Data Web
site). Click on the school district name at the top of the table. Select the High Stu dent Performance tab. Scroll down to Performance of Each Student Group on the
ABCs End-of-Course Tests (EOC) table. Row 1, column 1 gives the average test score for all tests for all groups in that district. Enter this data into the spreadsheet. Repeat for each district.
4. Construct a scatter plot and a regression equation.
5. Calculate a correlation coefficient to describe the relationship.
Questions for discussion
What can you say about the relationship between poverty and school achievement?
Why is the slope of the regression line negative? What does this mean in practical terms?
Do you think you would obtain different results with a different sample? [Different groups should select different school districts for the sample and compare.] Calculate the coefficient of determination (r2). What can you say about your sample based on this statistic? If 10 percent of a school district's students live in poverty, what would you predict the mean EOC score would be? What would the mean EOC score be if 20 percent of a district's students lived in poverty?
What do these data suggest about NCLB?
Fiq. 4 Project 3
460 MATHEMATICS TEACHER | Vol. 101, No. 6 February 2008
This content downloaded from 89.160.155.250 on Thu, 24 Apr 2014 11:45:55 AMAll use subject to JSTOR Terms and Conditions
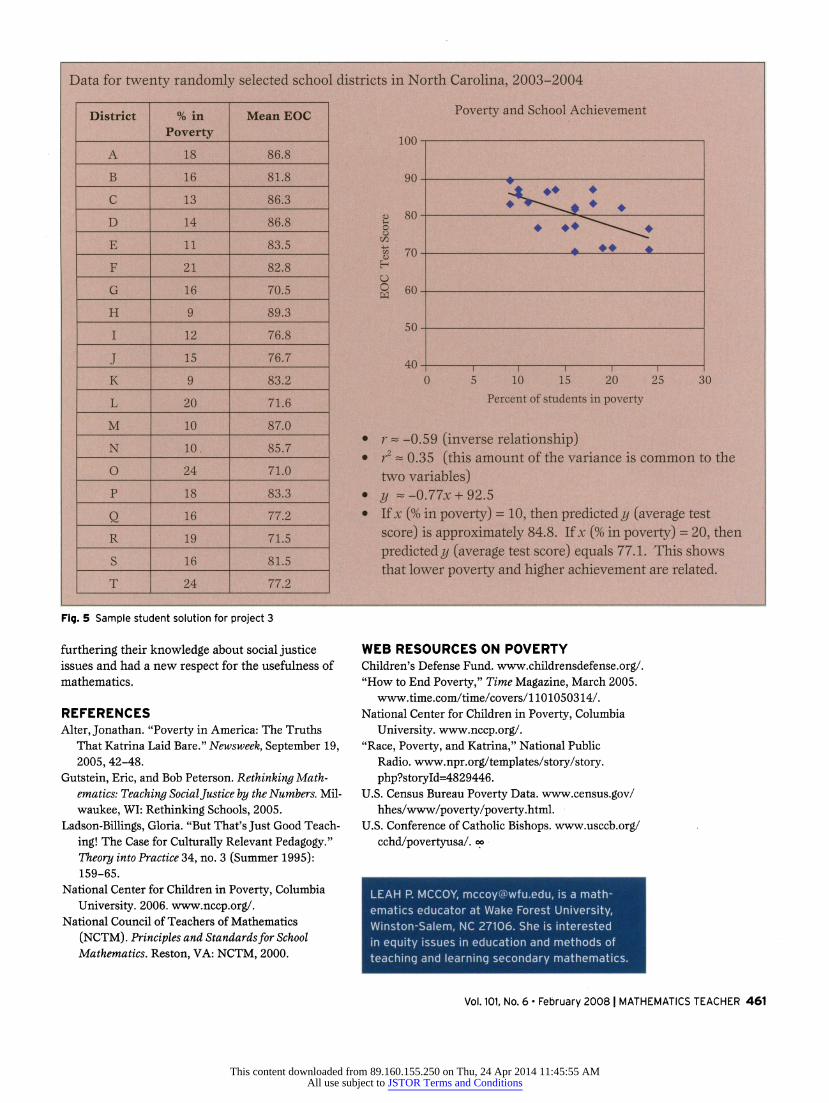
Data for twenty randomly selected school districts in North Carolina, 2003-2004
Poverty and School Achievement District
B
D
H
K
M
N
O
Q
R
7o in
Poverty
18
16
13
14
11
21
16
12
15
20
10
10.
24
18
16
19
16
24
Mean EOC
86.8
81.8
86.3
86.8
83.5
82.8
70.5
89.3
76.8
76.7
83.2
71.6
87.0
85.7
71.0
83.3
77.2
71.5
81.5
77.2
100
o o </) CO
H
O O w
Percent of students in poverty
r ? -0.59 (inverse relationship) r2? 0.35 (this amount of the variance is common to the
two variables) y ~-0.77jc + 92.5
If x (% in poverty) = 10, then predicted y (average test
score) is approximately 84.8. If x (% in poverty) = 20, then
predicted y (average test score) equals 77.1. This shows that lower poverty and higher achievement are related.
Fig. 5 Sample student solution for project 3
furthering their knowledge about social justice issues and had a new respect for the usefulness of
mathematics.
REFERENCES Alter, Jonathan. "Poverty in America: The Truths
That Katrina Laid Bare." Newsweek, September 19,
2005, 42-48.
Gutstein, Eric, and Bob Peterson. Rethinking Math ematics: Teaching Social Justice bg the Numbers. Mil
waukee, WI: Rethinking Schools, 2005.
Ladson-Billings, Gloria. "But That's Just Good Teach
ing! The Case for Culturally Relevant Pedagogy." Theory into Practice 34, no. 3 (Summer 1995): 159-65.
National Center for Children in Poverty, Columbia
University. 2006. www.nccp.org/.
National Council of Teachers of Mathematics
(NCTM). Principles and Standards for School Mathematics. Reston, VA: NCTM, 2000.
WEB RESOURCES ON POVERTY Children's Defense Fund, www.childrensdefense.org/.
"How to End Poverty," Time Magazine, March 2005. www.time.com/time/covers/1101050314/.
National Center for Children in Poverty, Columbia
University, www.nccp.org/.
"Race, Poverty, and Katrina," National Public
Radio, www.npr.org/templates/story/story.
php?storyId=4829446. U.S. Census Bureau Poverty Data, www.census.gov/
hhes/www/poverty/poverty .html.
U.S. Conference of Catholic Bishops, www.usccb.org/
cchd/povertyusa/. c?
LEAH P. MCCOY, [email protected], is a math ematics educator at Wake Forest University, Winston-Salem, NC 27106. She is interested in equity issues in education and methods of
teaching and learning secondary mathematics.
Vol. 101, No. 6 February 2008 | MATHEMATICS TEACHER 461
This content downloaded from 89.160.155.250 on Thu, 24 Apr 2014 11:45:55 AMAll use subject to JSTOR Terms and Conditions