poverty situation of ethnic minorities in hong kong situation of ethnic minorities in hong kong...
TRANSCRIPT

Poverty Situation of Ethnic Minorities in Hong Kong
March 2016
Economic Analysis Division Economic Analysis and Business
Facilitation Unit Financial Secretary’s Office
Census and Statistics Department
LegCo Subcommittee on Poverty LC Paper No. CB(2)1104/15-16(01)

Outline
2
I. Objectives, Analytical Framework and Major Sources of Data
II. Estimation of the Poverty Situation of Ethnic Minorities (EMs) in Hong Kong (HK)
III. Focusing on the Poverty Situation of South Asian (SA) Households with Children
(a) “Survey on Households with School Children of South Asian Ethnicities” (b) Poverty Situation of SA Households with Children and Effectiveness of Poverty Alleviation
IV. Six Observations V. Five Policy Implications

EMs / EM Households
SAs / SA Households
SA Households with Children
Poverty Situation of SA Households with Children: 2014 “Survey on Households with School Children of South Asian
Ethnicities” Focus on SA households with children to provide analyses on latest data Quantify the poverty situation according to the poverty line framework
and review policy effectiveness
Overview of EMs in HK: “2011 Population Census” Analyse and identify the more disadvantaged groups within EMs Crudely estimate the poverty rate of various ethnic groups and investigate
their forms of poverty Analyse and identify the household type with the highest poverty risk
3
Objectives:Analyse the characteristics of EMs and understand their poverty situation and forms of poverty in order to identify the more disadvantaged groups, thereby providing policy implications
EMs Non-Chinese
EM households Domestic households with at least one non-foreign domestic helper (FDH) EM member
Objectives, Analytical Framework and Major Sources of Data
Analytical framework and major sources of data:
• Having specific residential status and socio-economic characteristics, FDHs are excluded from the statistics in this analysis unless otherwise stated

4
In 2011, there were some 450 000 EMs in HK, with more than a half (57%) being FDHs; Excluding FDHs, there were 190 000 EMs, accounting for 2.9% of the whole population in HK (excluding FDHs); SAs, with around 60 000 persons, constituted the largest ethnic group, followed by Whites
• Having specific residential status and socio-economic characteristics, FDHs are excluded from the statistics in this analysis unless otherwise stated
Chinese6 444 000(93.5%)
EMs446 500(6.5%)
Hong Kong’s population* structure by selected ethnic group, 2011
Overall population in domestichouseholds in Hong Kong:
6 890 500
Non-FDHs 192 400(43.1%)
(a) By whether the person was a FDH and selected ethnic group of FDH
(b) By selected ethnic group
Filipinos15 200(7.9%)
Indonesians3 200(1.7%)
Thais8 400(4.4%)
Indians25 800(13.4%)
Pakistanis17 900(9.3%)
Nepalese16 100(8.4%)
Other SAs1 700
(0.9%)
Japanese 12 000(6.3%)
Koreans 5 000
(2.6%)
Whites 53 400(27.8%)
Mixed 28 000
(14.6%)
Others 5 600
(2.9%)
SAs61 400
(31.9%)
Population of EMs (excluding FDHs) :192 400
FDHs, 254 100 (56.9%)
Indonesians130 100(29.1%)
Filipinos117 500(26.3%)
Others6 500
(1.5%)
Note: (*) Population figures refer to overall population in land-based domestic households.Source: 2011 Population Census, Census and Statistics Department.

Major characteristics of EMs • Population growth: mainly driven by the growth of SAs (followed by Whites) 10-year average annual growth rate: SAs: 4.1%;Whites: 1.6% ;whole population: 0.4%
• Demographic structure: younger with no prominent signs of population ageing. Many were married, and early marriage was common 26% were children (SAs: 31%;whole population: 16%) For persons aged 25-34, 56% men and 72% women were married (SAs: 73%/91%; whole
population: 33%/44%)
• Educational attainment: notable variations among ethnic groups Fewer Pakistanis and Nepalese attained post-secondary education. The lacklustre proportions
of their youths’ attending post-secondary programmes warrant concern over the difficulties they faced (such as learning Chinese) in accessing higher education
• Geographical distribution: apparently concentrated in certain neighbourhoods
• Household size: SA households were apparently larger in size (with 3.3 persons on average) More than half of SA households had children, especially Pakistani households (72% had
children, while 35% had 3 or more children) • Degree of labour force participation: The labour force participation rate (LFPR) of males
was higher than the overall male average (even more for older persons) Pakistanis (especially females) exhibited lower LFPR; Nepalese’s LFPR was higher, with many youths even leaving school earlier to join the labour
force
5

II. Estimation of the Poverty Situation of EMs in HK

• Under the poverty line framework endorsed by the Commission on Poverty (CoP), the poverty line is set at 50% of the pre-policy intervention median monthly household income as estimated under the General Household Survey
• A crude estimation of major poverty statistics for EMs by applying the 2011 poverty lines to the 2011 Population Census data: Over-estimation of the poverty situation – the household income data of the 2011
Population Census only covered the major policy intervention items (i.e. social security payments)
Only reflecting the situation in 2011 – between 2011 and 2014, the overall poor population and poverty rate after recurrent cash intervention declined from 1.01 million and 15.2% to 0.96 million and 14.3% respectively
7
($, per month) Poverty line 2011 2014
1-person 3,400 3,500 2-person 7,500 8,500 3-person 10,500 13,000 4-person 13,000 16,400 5-person 13,500 17,000 6-person+ 14,500 18,800
Poverty line thresholds by household size, 2011 and 2014
Estimating the poverty situation of EMs and its major limitations
Source : Hong Kong Poverty Situation Report.

8
2011 Pre-intervention
Post-intervention*
Poverty alleviation impact (reduction)
EMs:
Poor households 11 200 9 800 1 400
Poor population 30 400 26 800 3 600
Poverty rate 15.8% 13.9% 1.9% points
Compared with: overall poverty rate 19.6% 15.2% 4.4% points
Estimates of poor EM households, poor EM population and poverty rates in 2011
(*) Policy intervention: Covering only the major recurrent cash policy intervention items (i.e. social security payments including Comprehensive Social Security Assistance (CSSA), Old Age Allowance (OAA) and Disability Allowance (DA) but not education cash allowance and other social benefits in cash
Note: Overall poverty rate refers to the poverty rate in 2011 after recurrent cash intervention estimated under the poverty line framework.
Sources: 2011 Population Census, Census and Statistics Department; Hong Kong Poverty Situation Report.

Filipinos2 000(7.6%) Indonesians
700(2.8%)Thais
1 800(6.7%)
Mixed 4 900
(18.1%)Indians 2 500(9.3%)
Pakistanis9 000
(33.4%)
Nepalese2 200(8.2%)
Other SAs200
(0.9%)
Japanese200
(0.9%)
Koreans200
(0.7%)
Whites 2 500(9.2%)
Others600
(2.3%)
(a) Estimated poor population
SAs13 900(51.8%)
Note: (^) Poverty rate of the whole population refers to the poverty rate after recurrent cash intervention estimated under the poverty line framework.Sources: 2011 Population Census, Census and Statistics Department; Hong Kong Poverty Situation Report.
15.2
13.9
4.6
2.5
13.3
23.0
21.4
13.6
50.2
9.7
22.6
0 10 20 30 40 50 60
Wholepopulation^
EMs
Whites
Japanese &Koreans
Filipinos
Indonesians
Thais
Nepalese
Pakistanis
Indians
SAs
(b) Estimated poverty rates
Among SAs:
Estimated poor EM population: 26 800
Estimated poor EM population and poverty rates by selected ethnic group, 2011
(%)
9
Poverty situation differed notably across ethnic groups, while the SAs’ poverty situation warrants concern • Among the 27 000 poor EMs, more than half were SAs, and about one-third were Pakistanis
• Poverty rates for Pakistanis, Indonesians and Thais were visibly higher
10
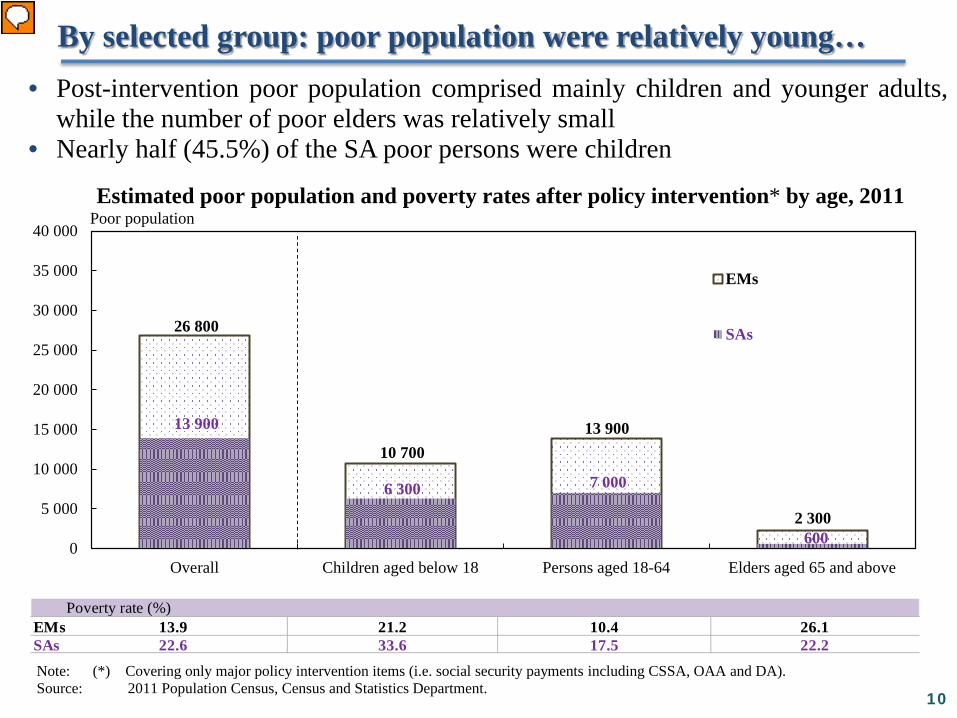
By selected group: poor population were relatively young… • Post-intervention poor population comprised mainly children and younger adults,
while the number of poor elders was relatively small • Nearly half (45.5%) of the SA poor persons were children
26 800
10 70013 900
2 300
13 900
6 300 7 000
600 0
5 000
10 000
15 000
20 000
25 000
30 000
35 000
40 000
Overall Children aged below 18 Persons aged 18-64 Elders aged 65 and above
EMs
SAs
Note: (*) Covering only major policy intervention items (i.e. social security payments including CSSA, OAA and DA).Source: 2011 Population Census, Census and Statistics Department.
Poor populationEstimated poor population and poverty rates after policy intervention* by age, 2011
EMs 13.9 21.2 10.4 26.1 SAs 22.6 33.6 17.5 22.2
Poverty rate (%)

26 800
20 500
6 400
1 000
15 000
10 800
16 300
8 900
13 900
6 200
13 90011 900
1 700200
5 7007 800
9 900
3 200
7 800
4 000
0
5 000
10 000
15 000
20 000
25 000
30 000
35 000
40 000
Overall Householdswith children
Householdswithoutchildren
1-personhouseholds
2- to 4-personhouseholds
5-person-and-abovehouseholds
Workinghouseholds
Economicallyinactive
households
Householdsin PRH
Tenanthouseholds in
private housing
EMs
SAs^
Notes: (*) Covering only major policy intervention items (i.e. social security payments including CSSA, OAA and DA).(^) Poor SA households refer to poor SA households of a single ethnicity, in which a majority of poor SAs reside. Nevertheless, there
were still few poor SAs living in households of multiple ethnicities.Source: 2011 Population Census, Census and Statistics Department.
Poor population
Estimates of poor population, poor households and poverty rates after policy intervention*by selected socio-economic characteristic, 2011
EMs 9 800 5 700 4 000 1 000 6 600 2 200 4 800 4 400 4 500 1 900SAs^ 3 300 2 600 700 200 1 800 1 400 2 100 1 000 1 600 1 100
EMs 13.9 18.5 7.8 4.8 11.7 25.1 9.4 52.8 41.5 6.5 SAs^ 22.6 29.0 9.5 5.2 17.2 34.2 18.8 65.3 49.1 13.3
Poor households
Poverty rate (%)
11
…poor population were mainly from households with children as well as large households
• Also commonly found in working households; as well as public rental housing (PRH) households • Poverty rate of households with children notably higher than households without children, and
increasing with household size
c

SAs faced higher poverty risk among the EMs, and poverty risk for households with children was even more visible
• SA population were the largest and fastest-growing ethnic group; many were settled in HK and even born and raised locally
• Much larger household size, with particularly heavy burden of child dependency
• Poverty situation varied a lot among ethnic groups:
Indians: more educated, mainly engaged in higher-skilled jobs with higher salaries
Pakistanis: larger in family size and number of children; relatively low educational attainment and LFPR; working population mostly engaged in lower-skilled jobs with less promising earnings; subject to the most severe poverty risk
Nepalese: though mostly engaged in lower-skilled jobs, their household incomes were higher as a result of a high LFPR, with 2.1 working members per working household on average
• Southeast Asians were much smaller in population size. However, Thais and Indonesians were at higher poverty risk due to their lower educational attainment and lacklustre salaries
• East Asians and Whites were subject to less prominent poverty risk
12

III. Focusing on the Poverty Situation of SA Households with Children
(a) “Survey on Households with School Children of South Asian Ethnicities”

“Survey on Households with School Children of South Asian Ethnicities”
EMs / EM Households
SAs / SA Households
SA Households with Children
“Survey on Households with School Children of South Asian Ethnicities” provides latest data, help quantify the poverty situation under the poverty line framework and evaluate the effectiveness of poverty alleviation
14
2011 estimates Poor households: 9 800 Poor population of EMs: 26 800 Poverty rate of EMs: 13.9%
Poor households: 3 300 Poor population of SAs: 13 900 Poverty rate of SAs: 22.6%
Poor households: 2 600 Poor population of SAs: 11 900 Poverty rate of SAs: 29.0%
Survey targets SA households with children attending public or Direct Subsidy Scheme (DSS) primary and secondary schools
Survey period May 2014 to June 2015
Sampling frame Student information of the Education Bureau (EDB)
Major limitations
Not all SA households with children were covered
As some SA households with lower poverty risk were not included, the overall poverty situation may be over-estimated
• The overall situation of SA households with children are analysed in detail in Chapter 3 of the Hong Kong Poverty Situation Report on Ethnic Minorities 2014

(b) Poverty Situation of SA Households with Children and Effectiveness of
Poverty Alleviation

2014 Pre-
intervention Post-
intervention* Poverty alleviation impact (reduction)
Poor households 2 200 1 500 700
Poor population 11 600 7 400 4 200
Poverty rate 48.1% 30.8% 17.3% points
Average poverty gap ($, per month)
9,200 4,000 5,200
Compared with: overall households with children
Poverty rate 21.2% 16.2% 5.0% points Average poverty gap ($, per
month) 5,900 3,600 2,300
16
Note: (*) Poverty figures after recurrent cash intervention. Sources: General Household Survey; and Survey on Households with School Children of South Asian Ethnicities,
Census and Statistics Department.
After policy intervention, there were 7 400 poor persons in SA households with children, down 4 200 from the pre-intervention figure. The poverty rate was 30.8%, down 17.3% points from the pre-intervention figure, but still markedly higher than that of the overall households with children in HK (16.2%)
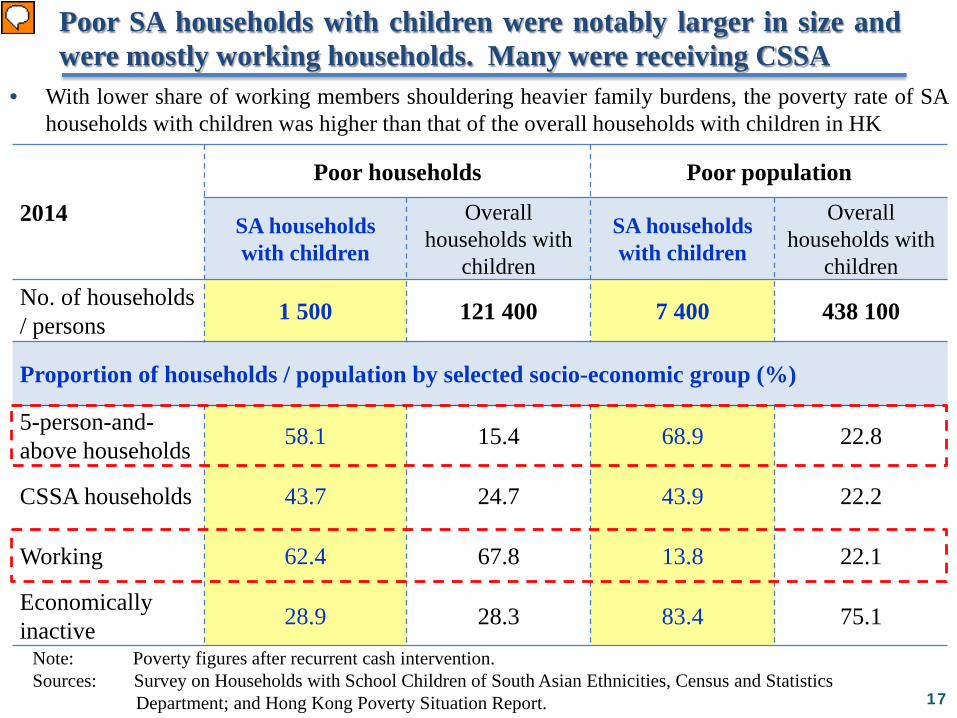
Poor SA households with children were notably larger in size and were mostly working households. Many were receiving CSSA
17
Note: Poverty figures after recurrent cash intervention. Sources: Survey on Households with School Children of South Asian Ethnicities, Census and Statistics
Department; and Hong Kong Poverty Situation Report.
2014
Poor households Poor population
SA households with children
Overall households with
children
SA households with children
Overall households with
children No. of households / persons 1 500 121 400 7 400 438 100
Proportion of households / population by selected socio-economic group (%)
5-person-and-above households 58.1 15.4 68.9 22.8
CSSA households 43.7 24.7 43.9 22.2
Working 62.4 67.8 13.8 22.1
Economically inactive 28.9 28.3 83.4 75.1
• With lower share of working members shouldering heavier family burdens, the poverty rate of SA households with children was higher than that of the overall households with children in HK

The labour-related characteristics also showed that the population in poor SA households with children had higher unemployment rate, lower educational attainment and skill level among employed persons, and limited earnings despite relatively low proportion of part-timers
18
Note: Poverty figures after recurrent cash intervention. Sources: General Household Survey; and Survey on Households with School Children of South Asian Ethnicities, Census and Statistics Department.
2014
SA households with children Poor population of
overall households
with children
Poor population
Of which:
Indians Pakistanis Nepalese
Selected statistics
LFPR (%) 30.5 35.0 27.6 36.9 36.9
Unemployment rate (%) 16.6 11.7 17.4 21.2 11.1
Characteristics of employed persons
Educational attainment at lower secondary or below (%)
45.2 28.9 52.7 40.9 49.2
Lower-skilled (%) 93.4 89.1 94.6 94.2 90.2
Part-time (%) 18.9 17.5 17.6 21.1 23.6
Median monthly employment earnings ($) 11,000 9,700 10,600 12,000 10,000

2014 Pre-
intervention
Post-intervention
Recurrent cash
Recurrent + Non-recurrent
cash
Recurrent cash + in-kind
Poor households 2 200 1 500 1 400 900
Poor population 11 600 7 400 6 600 4 100
Poverty rate 48.1% 30.8% 27.6% 17.2%
Effectiveness in poverty alleviation (as compared with pre-intervention statistics)
Poor households -700 -900 -1 400
Poor population -4 200 -4 900 -7 400
Poverty rate -17.3% point -20.5% point -30.9% point
19 Source: Survey on Households with School Children of South Asian Ethnicities, Census and Statistics Department.
The poverty indicators of SA households with children further improved after policy intervention with non-recurrent cash and in-kind (mainly PRH) items

Area Proficiency
Language (%) Aged 6-17 Aged 18 or above
Chinese English Mother tongue Chinese English Mother tongue
Listening
Fully comprehend 46.1 65.7 87.3 17.4 48.2 97.5 Comprehend 31.3 26.9 10.1 20.0 26.4 2.0 Can partially listen 19.8 6.9 2.4 40.6 16.7 § Cannot listen 2.8 § § 22.0 8.8 §
Speaking
Fluent 45.4 65.7 86.6 16.8 48.0 97.3 Conversational 32.0 27.1 10.4 20.1 26.1 1.9 Simple words only 19.7 6.6 2.4 40.3 16.9 § Cannot speak 2.9 0.6 0.6 22.8 9.1 §
Reading
Fully comprehend 33.1 61.9 24.5 4.7 43.6 81.7 Comprehend 25.8 26.6 6.0 3.8 22.3 3.1 Can partially read 31.7 10.5 9.7 10.2 16.9 3.7 Cannot read 9.3 0.9 59.9 81.3 17.2 11.5
Writing
Fluent 32.9 62.0 23.6 4.4 43.5 81.0 Write conventional letters 25.9 26.9 5.9 3.6 22.0 3.3 Simple words only 31.5 9.9 9.6 9.3 16.9 3.7 Cannot write 9.7 1.1 60.9 82.6 17.7 12.1
20
In general, poor persons fared better in English than in Chinese; ability in listening / speaking better than reading / writing; and children were more adept at English / Chinese than adults Share of poor persons aged 6 or above in SA households with children by language proficiency, 2014
Notes: Based on poverty statistics after recurrent cash intervention. (§) Not released due to large sampling errors. Source: Survey on Households with Children of South Asian Ethnicities, Census and Statistics Department.
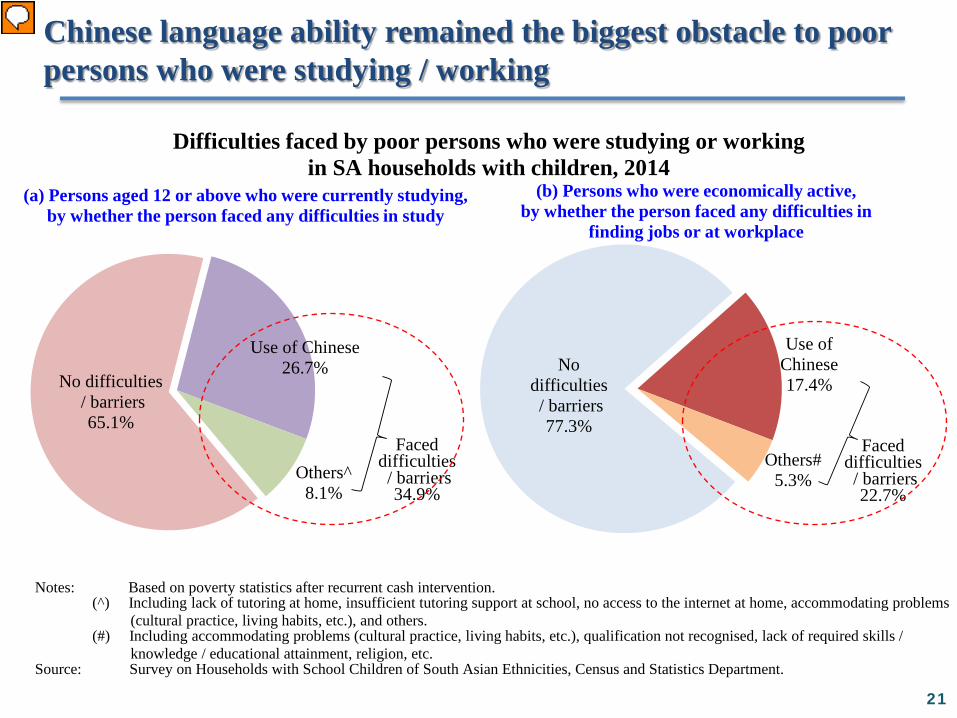
No difficulties/ barriers65.1%
Use of Chinese26.7%
Others^8.1%
(a) Persons aged 12 or above who were currently studying,by whether the person faced any difficulties in study
No difficulties/ barriers77.3%
Use of Chinese 17.4%
Others#5.3%
(b) Persons who were economically active, by whether the person faced any difficulties in
finding jobs or at workplace
Faced difficulties/ barriers22.7%
Difficulties faced by poor persons who were studying or workingin SA households with children, 2014
Notes: Based on poverty statistics after recurrent cash intervention.(^) Including lack of tutoring at home, insufficient tutoring support at school, no access to the internet at home, accommodating problems
(cultural practice, living habits, etc.), and others.(#) Including accommodating problems (cultural practice, living habits, etc.), qualification not recognised, lack of required skills /
knowledge / educational attainment, religion, etc.Source: Survey on Households with School Children of South Asian Ethnicities, Census and Statistics Department.
Faced difficulties/ barriers34.9%
21
Chinese language ability remained the biggest obstacle to poor persons who were studying / working

Never used / never faced difficulties
84.5% No EM language translation servicesin place of service
7.5%Difficulties in
communicatingwith staff
7.2%Others0.8%
(a) Situation of using various Government services
Situation of usage of public services and selected support services among poor population aged 12 or above in SA households with children, 2014
2.40.76.7 4.6
25.5
53.1
51.4
32.7
13.9 8.8
0
10
20
30
40
50
60
70
80
90
100
Services provided byGovernment support servicecentres and sub-centres for
EMs#
Free translation servicesprovided by NGOs/centres*
(b) Situation of using selectedsupport services
Usedbefore
No onetold me
No needto use
Notinterested
Others
(%)
Neverused
Faced difficulties15.5%
Notes: Based on poverty statistics after recurrent cash intervention.(#) Support service centres and sub-centres for EMs provide language classes and various activities promoting racial harmony to assist EMs in
integrating into the society.(*) Each Government department must ensure equal opportunity for EMs to use public services. As to the method or the choice of translation
service provider to help the EM service users, relevant departments will make decisions in view of the actual situation.Souce: Survey on Households with School Children of South Asian Ethnicities, Census and Statistics Department. 22
Language and communication were also the main obstacles while using public services; some expressed that they were not aware of some services dedicated to EMs
• Though the selected support services did not represent all public services, it also indirectly reflected that language issues might have affected their awareness towards certain existing support services

IV. Six Observations

24
Six Observations I. Poverty risk faced by EM groups varied distinctly, with SAs (especially
those in households with children) at more severe risk
II. SAs were mostly young with large household size in terms of demographic profile
III. Employment remains the best avenue to stay out of poverty, but a high dependency ratio makes it more difficult for working households to get out of poverty
IV. While the poverty rates of SAs were significantly lowered upon the Government’s policy intervention, it remained difficult for some SA large households to get out of poverty
V. SAs had lower educational attainment, and language proficiency was their major barrier to integration with the local community
VI. The degree of community involvement and usage of support services or financial assistance among SAs were relatively low, possibly due to language barriers

V. Five Policy Implications
1. Employment and training support
26
• Poverty risk is closely linked to employment. Economic growth, job creation and skill upgrading are conducive to poverty alleviation at source
• The Government would continue to provide employment-related support and training to EMs to facilitate their skill enhancement and income growth
Provide skill training and employment support services
Promote the employment of EMs among employers
Facilitate EM job seekers in accessing job referral services and employment information
Continue to promote relevant support services among EMs
• Examples of support services: Since September 2014, a pilot “Employment Services Ambassador Programme for EMs” has been launched by the Labour Department (LD) under which young trainees of the Youth Employment and Training Programme who are proficient in EM languages are employed as employment services ambassadors to work in job centres and job fairs organised by LD. Besides, LD has organised more than 20 inclusive job fairs since the end of 2013 to assist EMs in finding employment, and has strengthened the communication and collaboration with non-governmental organisations (NGOs) that are serving EMs.

2. Education support
27
• Education is crucial to alleviation of inter-generational poverty while proficiency in the Chinese language is the key to EMs’ integration into the community and admission to post-secondary programmes
• Given the relatively young EM population, more support should be provided to this new generation of HK for upgrading the quality of our overall future manpower
Closely monitor the effectiveness of Chinese language curriculum and remedial programmes / modes of intensive learning for non-Chinese speaking (NCS) students
Provide NCS students with additional channels to acquire recognised Chinese qualifications
Enhance support for schools and professional development for teachers
Facilitate NCS parents’ / students’ access to basic information of local education
Explore the feasibility of further relaxing the Chinese proficiency requirement in the Hong Kong Diploma of Secondary Education for admission to universities for NCS students, in addition to the acceptance of alternative Chinese qualifications
• Examples of support services: Starting from the 2014/15 school year, EDB has implemented the Chinese Language Curriculum Second Language Learning Framework in primary and secondary schools. Applied Learning Chinese (for NCS students) courses have also been introduced by phases

3. Welfare services
28
• The Labour and Welfare Bureau will step up its efforts to promote existing and upcoming policy support among EMs
• Examples of support services: the upcoming Low-income Working Family Allowance Scheme, to be launched in May 2016, would help encourage self-reliance and ease inter-generational poverty. Particularly taking care of families with children so as to promote upward mobility, it should be able to provide focused support to EM households in need According to the estimation based on the data of the dedicated survey in 2014, the
scheme is estimated to relieve the financial burden of 1 000 such households, benefitting 5 100 persons including 2 700 eligible children (aged below 15) and young people (aged 15-21 who are receiving full-time education other than post-secondary education)
It is also estimated that the number of poor persons and poverty rate of SA households with children would be reduced by 1 500 and 6.3 percentage points respectively

4. Community involvement and integration
29
• EMs settled in HK with many of them being locally born and raised. It is of utmost importance for them to integrate into the community and live and work happily
• The Government will continue to promote community cohesion among EMs and give them support while assisting them in using public services. Publicity to EMs (especially SAs) will be stepped up by the Home Affairs Bureau (HAB) for the implementation of more effective and fruitful support policies
• Examples of support measures: HAB facilitates the publicity of relevant departments’ public services to EMs (especially SAs) through a series of support services, including the Centre for Harmony and Enhancement of EM Residents, the Community Support Team, the District-based Integration Programme, the Ambassador Scheme, radio programmes broadcast and service guides compiled in EM languages
5. Continuous monitoring
30
• Given a faster growth in the SA population and their higher poverty risk, the Government has to monitor their poverty situation on a regular basis, via, e.g. population censuses / by-censuses
• Findings of the 2016 Population By-census will be released in 2017

31
Concluding remarks
• Study findings have already been presented to the CoP and its Special Needs Groups Task Force on 18 December 2015 and 6 November 2015 respectively
• The Chief Secretary has steered the Task Force to follow up on the issues
• The full version of the Hong Kong Poverty Situation Report on Ethnic Minorities 2014 is available at: http://www.povertyrelief.gov.hk/eng/pdf/2014_EM_Report_Eng.pdf