poverty, participation and choice: the legacy of … 2013 report poverty, participation and choice...
TRANSCRIPT

2013MAYWWW.JRF.ORG.UK
REPORT
POVERTY, PARTICIPATION AND CHOICETHE LEGACY OF PETER TOWNSENDEmanuele Ferragina, Mark Tomlinson and Robert Walker
This report revisits and extends Peter Townsend’s idea that poverty is less about shortage of income and more about the inability of people on low incomes to participate actively in society. The research draws on original analysis of three large-scale UK datasets: Understanding Society, the Family Spending Survey and the Millennium Cohort Study.
The analysis points to the existence of two social worlds divided by income. The poorest 30 per cent of the population have to choose between basic necessities and participation in social activities. For this group, additional income does not seem to improve living conditions or change lifestyle. In contrast, for the rest of the population, extra income translates into greater social participation and more evident consumption – the key to a ‘good life’.
The report illustrates:• that participation generally reduces as income falls, but stops doing so
among the poorest 30 per cent of the population; • that participation varies according to education, age, gender, employment
status, ethnicity and region of residence;• the ways in which lifestyles vary among the British population; • the impact of poverty on the level of participation of young children; and• the continuing importance of Townsend’s insights for the public
understanding of poverty.

CONTENTS
Executive summary 04
1 Introduction 06 2 Townsend’s ‘breakpoint’ 08 3 Mapping diversity in participation 16 4 Choice in participation 21 5 Children’s participation 26 6 Conclusion: informing public understanding of poverty 35
Notes 39 References 41 Appendix 1: Statistical methods 46 Appendix 2: Variables used in analysis compared with
those used by Townsend (1979) 48 Appendix 3: Dimensions of participation and their
socio-economic correlates 52 Appendix 4: The participation of ethnic groups:
regressions and beta coefficients 57 Appendix 5: Choice of participation: results from
heteroscedastic regression of ethnic groups; beta coefficients 60
Appendix 6: Dimensions of childhood participation 65 Acknowledgements and About the authors 68
List of figures 1 SEM model of participation 10 2a Effect of income on participation 13 2b Effect of income on deprivation 14 2c Effect of income on social participation 14 2d Effect of income on trust 15 3 Participation by ethnic minorities relative to white
respondents 18 4a Participation: mean and variance by income decile 23 4b Material deprivation: mean and variance by income decile 23

4c Social participation: mean and variance by income decile 23
4d Trust: mean and variance by income decile 23 5 Consumption and choice: mean and variance by income
decile 24 6 SEM of parents’ participation 30 7 SEM of child participation 31 8 SEM showing impact of certain activities on school
performance 33

04
EXECUTIVE SUMMARYPeter Townsend argued that poverty denies people the opportunity to participate fully in society and that a rapid decline in participation observed at lower incomes provides the basis for developing a scientific method of fixing a poverty line. Townsend was criticised on the grounds that his measures of participation related to matters of choice rather than to need, in which consumerism abounds and identity is often defined in terms of specific forms of more or less conspicuous consumption (see Chapter 1).
Townsend’s ideas are revisited in this study, employing modern, multidimensional measures of participation, large new datasets and some of the latest statistical techniques. Participation is defined as a combination of freedom from material deprivation, active social participation and trust, a formulation that accords well with data obtained from the first wave of Understanding Society (USoc, 2009), a study of nearly 40,000 households undertaken in 2009/10 (see Chapter 2). The analysis confirms that participation reduces as income falls but stops doing so among the poorest 30 per cent or so of individuals, creating a participation ‘floor’. For this 30 per cent, higher incomes do not lead to measurably increased living standards, greater social participation or higher levels of trust, while the floor for people reliant on social security benefits is noticeably lower than for others on the same incomes.
While levels of participation are closely related to income, they also vary with other factors such as education, family type, ethnicity and geographic region (see Chapter 3). The theoretical implication of participation being multidimensional is that low scores on one dimension might be offset by higher scores on another and there is the suggestion that this may happen in real life. The Understanding Society study includes large samples of certain minority ethnic groups. Analysis reveals that material deprivation is particularly prevalent among African, Bangladeshi, Pakistani and Caribbean respondents but that social participation also tends to be high, although to a lesser extent among Caribbean people. Further research is required to establish whether such social participation compensates for the worst consequences of material deprivation, let alone overcomes it. Regardless, within each group all forms of participation are closely related to income and are markedly higher among those with the greatest incomes.
The research specifically investigates the possibility that low income constrains choice and that a restriction in choice might provide a better measure of poverty than simply a decline in participation (see Chapter 4). Rather than variation in participation and consumption increasing with rising income, as one might expect, the variation in participation and consumption decreases with rising income. Whereas rich people can afford to have and do everything that surveys ask about, those on low incomes, at around current benefit levels or below, are forced to make hard choices between goods and activities that are widely perceived to be social necessities.

05Executive summary
Little research has hitherto been undertaken on the social participation of children and whether this is affected by family income. Using a different dataset, the Millennium Cohort Study (MCS, 2008) analysis demonstrates that children at age eight are not consciously affected by low family income in terms of their own friendships, participation in physical activities or engagement with school (see Chapter 5). However, the nature and extent of parents’ involvement with their children is negatively associated with income which in turn is reflected in children’s relative lack of educational success as assessed by their teachers. The evidence points to parents on low incomes protecting their children from an awareness of the direct effects of poverty and spending extra time helping their offspring with schoolwork to compensate for poor achievement. Neither, however, succeeds in fully mitigating the negative association of low household income with educational performance.
Townsend’s ideas are still very relevant to current debates on poverty. While it may never be possible to devise a scientific measure of poverty that is immune to ideological criticism, the analysis points to the possible existence, replicated across region and ethnic group, of two social worlds divided by income. People on the low participation floor have to choose between basic necessities and between fulfilling one social expectation or another. Additional income brings a slight easing of pressure, but little observable difference in living conditions or lifestyle. In contrast, above the floor, extra income translates into greater social participation and more evident consumption and is the key to a good life. It is at least possible that the existence of such different worlds helps to explain the gulf in understanding and the high level of mistrust, evidenced in other research, between those who are in poverty and those who are not.

06
1 INTRODUCTION
Peter Townsend, who died in 2010, contributed enormously to our understanding of poverty. His two most important insights were that poverty is best understood as being relative rather than absolute (Abel Smith and Townsend, 1965) and that poverty is less about shortage of income and more about the inability of people on low incomes to participate actively in society1 (Townsend, 1979). The aim of this project is to revisit and extend this second idea using new data and statistical techniques.
Townsend (1979) believed there to be a ‘breakpoint’ in the income distribution, below which participation declined disproportionally.2 However, Gordon and colleagues (Gordon and Townsend, 1990; Gordon et al., 2000), using more sophisticated techniques, did not confirm this hypothesis.3 One might explain Townsend’s failure to demonstrate convincingly the existence of a ‘breakpoint’ in terms of the choice of indicators used to measure deprivation and lack of social participation (Piachaud, 1981). Responses to whether or not respondents possessed items or engaged in particular activities were simply added together to measure participation, thereby cumulating measurement error and reducing the accuracy of the measurement. Moreover, the indicators were judged by some to be matters of taste rather than measures of either need or social participation. This latter criticism, of course, has even more salience in today’s society, in which consumption and participation patterns explicitly reflect lifestyle choices (Festenstein, 2005; Tomlinson, 2003; Warde and Tomlinson, 1995). Much more so than in the 1970s, it is a person’s ability to choose in the market place and to be integrated in social activities that is the touchstone of their capacity to participate in society and exhibit social preferences. A large body of work exists within the ‘reflexive sociology’ literature, suggesting that consumption is a crucial mechanism through which people establish and communicate their identity (Bauman, 1998; Giddens, 1991;

07
The concept of participation formulated by Townsend needs to be expanded to include non-material dimensions, notably social participation and the trust that underpins social engagement.
Introduction
Featherstone, 2007; Lash and Urry, 1994). Taste may well play a greater role in contemporary consumption, even for people on low incomes.
It follows that the concept of participation formulated by Townsend needs to be expanded to include non-material dimensions, notably social participation and the trust that underpins social engagement. This requires the application of statistical techniques that take into account the intrinsically multidimensional nature of participation. Furthermore, the proposition that a lack of income results in a diminution of choice is better investigated by examining whether the degree of variation in participation declines with income. This would suggest constraints on choice rather than simply the adoption of particular ‘ordinary living patterns, customs and activities’, as proposed by Townsend, which implies that everybody might be expected to do the same thing if they had a higher income.
The remainder of this report is set out as follows. Chapter 2 investigates whether a ‘breakpoint’ exists in the income distribution, below which the degree of participation declines disproportionally. Chapter 3 maps how participation varies according to income, education, age, gender, employment status, ethnicity and region of residence. Chapter 4 investigates the diversity of participation and, by implication, choice of lifestyle. Chapter 5 explores the impact of poverty on participation by young children. Chapter 6 reflects on the continuing importance of Townsend’s insights for the public understanding of poverty.
The research draws on original analysis of three large-scale UK datasets:4 the first wave of Understanding Society (USoc, 2009);5 the Family Spending Survey (FSS, 2010); and the Millennium Cohort Study (MCS, 2008). The statistical methods employed are described briefly in the appropriate sections and more thoroughly in Appendix 1.6

08
2 TOWNSEND’S ‘BREAKPOINT’
Peter Townsend argued that there is a ‘breakpoint’ in the income distribution, below which participation declines more than proportionally, a proposition explored in this chapter using the latest available data. The concept of participation is defined first, before introducing the method and the data employed; the results of the ensuing analysis are then discussed.
Going beyond Townsend’s notion of participation
Townsend (1979) argued that lack of income excludes people from full participation in society. He was pioneering in thinking of participation in broad terms including not only aspects of material deprivation to do with diet, clothing, housing conditions and material possessions but also health status, conditions at work and social activities such as eating at home or elsewhere with family or friends.7 In the years since Townsend’s original work, many scholars (including Putnam et al., 1993; Putnam, 1995, 2000; Giddens, 1998; and Rose, 2000) have emphasised the importance of the social dimension of participation, often termed ‘social capital’, as a determinant of well-being. Likewise, the concept of ‘social exclusion’ has also been added to the lexicon of poverty-related terms, describing the process by which people, especially those on low incomes, can become socially, politically and economically detached from mainstream society and its associated resources and opportunities (Room, 1995; Hills et al., 2002; Taket et al., 2009). More recently still, the strengthening of civil society through participation has progressively become a flagship goal for both the current Coalition Government in the UK and the Labour Party when last in power:
The ‘Big Society’ is about more than voluntary organisations; it is about unlocking all social capital. It [social capital] includes the links between neighbours; the strength of marriage and the extended

09Townsend’s ‘breakpoint’
family; the tendency to volunteer and give time to charity; the involvement in political parties and voting …– Montgomerie, 2011, p. 1
The basic premises of our faiths; solidarity; justice; peace and the dignity of the human person are what we need in the age of globalisation. Traditionally, these were religious values. But we now know, through several quite different disciplines, that they are universal values. Economists call them ‘social capital’.– Blair, 2000, p. 10
The centrality of the concept of participation in the current public debate constitutes an important motivation to revisit and expand Townsend’s work. More than 30 years after the publication of Poverty in the United Kingdom (Townsend, 1979), the current political and academic debate reflects concern in society that certain structural conditions can undermine full participation by individuals (Ferragina, 2010; 2012). As underlined by Gamarnikow and Green (1999, p. 4), the rediscovery of the importance of participation is becoming a common thread, a shared explanatory framework: ‘lack or loss of social capital explains unsuccessful outcomes and thus social capital building becomes an attractive strategy’.
Furthermore, at the empirical level, the fact (demonstrated below) that deprivation, social participation and trust emerge as a single (albeit complex) dimension gives further credence to Townsend’s view that lack of participation is perhaps the defining manifestation of poverty. Hence, this comprehensive concept and its three dimensions are employed below in order to revisit Townsend’s hypothesis and to explore its continuing relevance in understanding the nature and consequences of poverty in 21st century Britain.
Defining and measuring participation
Participation is conceptualised as being inherently multidimensional. Whereas Townsend was forced by the methodology and technology of the time to create a single measure, thereby losing the component dimensions that he identified theoretically, it is now possible to retain them. Three distinct dimensions are proposed: lack of deprivation, social participation and trust. The first two are themselves multidimensional, with distinct subdimensions or components, and each is measured using a number of specific variables. In the literature such dimensions are called ‘latent’, the idea being that the dimensions relate to complex phenomena that cannot be measured directly but only via combinations of simple measures or variables. The structure of participation is illustrated in Figure 1, which shows each of the dimensions, and how they relate to each other and to the variables used to measure them. The numbers included in the figure provide a measure of the degree to which the dimensions are associated. All the relationships shown are statistically significant and, therefore, likely to characterise participation in the UK accurately when the data was collected in 2009/10.
Data is drawn from the first wave of Understanding Society (USoc, 2009), a new national survey that is representative of households and individuals in the UK. Understanding Society has a large sample of approximately 40,000 households, which means that the robustness or accuracy of the statistics obtained is much enhanced and reliable information can be garnered for comparatively small subgroups in the population. Inevitably, though, such

10Poverty, participation and choice
a survey cannot ask questions about everything and, as with all secondary analysis, one is constrained by the data available. The variables included are given in Appendix 2.
Figure 1: SEM model of participation (all coefficients significant at 1% level)
0.61BILLS0.17 SAVINGS0.28 FINANCE
0.40 PC0.40 DVD0.38 CD0.29 WASH0.50 DRYER0.17 DISHWASH
0.04 FURNITURE0.38 HEATING REP.0.05 HOUSE
0.25 HOLIDAY0.60 FRIENDS
0.20 BELONG0.14 FRIENDS N.0.18 ADVICE0.32 BORROW0.42 WILLING0.29 REMAIN0.24 SIMILAR0.21 TALK
0.15 HAVE0.16 IMPORTANCE0.27 CHURCH
0.14 PARTY0.33 POLITICS0.14 SUPPORT
0.55 GENERAL0.14 STRANGER0.48 RISKS
MATERIAL
SITUATION
RECREATIONAL
ACTIVITY
NEIGHBOURING
FINANCIAL
SITUATION
HOUSING
RELIGION
POLITICAL
INTEREST
DEPRIVATION
SOCIAL
PARTICIPATION
TRUST
PARTICIPATION
CONTROLS
Income deciles
Gender
Age group
Employment status
Age group
Education
Household size
Ethnicity
Region
CFA fit statistics (N = 40,513)
Absolute predictive fit
Chi square 34504.162
424
0.960
0.956
0.045
Degrees of freedom
Comparative fit
Comparative fit index (CFI)
Tucker Lewis index (TLI)
Parsimony fit
Root mean square error of approximation (RMSEA)
0.83
0.72
0.600.60
0.62
0.710.50
0.83
0.960.62
0.95
0.75
0.40
0.80
0.86
0.82
0.68
0.58
0.71
0.76
0.79
0.850.84
0.73
0.860.67
0.86
0.470.86
0.52
0.36
0.55
0.36
0.40
0.48
0.54
0.91
0.95
0.43
0.98
0.39
Source: Understanding Society, Wave 1 (USoc, 2009)

11Townsend’s ‘breakpoint’
The first dimension of participation – lack of deprivation – captures four components identified by Townsend in his seminal work: financial, housing and living conditions, recreational, and material. The first component measures the extent to which a person feels they are in control of their financial circumstances. Are they able to pay their bills? Can they save? Do they generally feel they are comfortably well off rather than that life is financially difficult? The second component records whether a person can afford to keep their home up to standard, to replace furniture that wears out, to pay for repairs to their house or apartment and to keep it warm. The third component registers whether a person can afford to go on holiday and has the money to invite family or friends home for dinner or a drink. It is a measure of the extent to which recreation is constrained by lack of financial resources. The final component establishes whether respondents possess the durable goods that are useful for day-to-day living but which not everybody has: these include a washing machine, dryer, dishwasher, personal computer, DVD player and CD player. Three of the four components therefore directly capture respondents’ perceptions of resource constraints; the last does not because data relates only to whether or not a person has a possession and not why.
The second major dimension of participation – social participation – in turn comprises three components: neighbouring, religious adherence and political involvement. Social participation has long been studied by sociologists (Parker, 1983). Tönnies (1955 [1887]), Durkheim (1893), Simmel (1969 [1905]) and Weber (1946 [1920], 1961 [1922]) reflected on how social participation was being affected by modernisation and were concerned that modernity resulted in a reduction in strong bonding ties and in rising alienation and anomie in society (Durkheim, 1893; Ferragina, 2010). This theoretical analysis has received empirical support in the last 20 years (Putnam et al., 1993; Fukuyama, 1995) with the development of research on social capital theory (Ferragina, 2010). The three components selected to measure social participation reflect these empirical and theoretical advances (Paxton, 1999; Costa and Kahn, 2003; Hall, 1999; Rothstein, 2001; Knack and Keefer, 1997; Van Oorschot and Arts, 2005). Neighbouring and religious adherence both capture informal social participation, while participation in politics captures a more formal dimension of social engagement.
Neighbouring is measured with an eight-item version of Buckner’s Neighbourhood Cohesion Instrument (Buckner, 1988). Sample items include: feelings of belonging to the neighbourhood, a willingness to ask for advice from someone in the neighbourhood, and the preparedness to work with others to improve the neighbourhood. The other items are shown in Figure 1.
Religious adherence is used as a proxy for participation in associations because the first wave of Understanding Society excludes the most commonly used indicators of associative participation and membership, which are to be collected in the second wave.8 Although not ideal as a measure of association membership, this dimension is positively correlated with the other two components used to capture social participation. Religious adherence is captured with three latent variables: belonging to a religion, importance attributed to religion and frequency of attendance at religious services.
Political interest is a traditional variable used in the social capital literature to measure formal types of social participation. This concept is captured using three variables: support for a particular political party, level of interest in politics and closeness to one party rather than to others.
The third dimension of participation included in the analysis – trust – is a composite of three indicators relating to whether respondents feel that

12Poverty, participation and choice
Social participation reflects political interest, religious adherence and neighbouring in that order but the associations are less definitive than in the case of deprivation.
most people can be trusted, the extent to which respondents are prepared to trust strangers, and their willingness to take risks with them. The rationale underlying this component is that modern society functions best when it is underpinned by a conducive environment in which citizens have a high level of confidence in each other (Putnum, 2000; Barber, 1983). To mix metaphors, trust is the glue that holds society together and the lubricant that enables individuals to engage with each other. Trust among the British population has fallen over time (Hall, 1999) and is usually reported to be lower among those on lowest incomes (Li et al., 2005).
To summarise, Peter Townsend’s argument was that poverty necessarily constrains people’s active participation in society and can be identified as the point in the income distribution at which participation begins to fall disproportionately. Having established a measure of participation comprising lack of deprivation, social participation and trust, the task ahead is to establish whether participation falls with income and whether a ‘breakpoint’ such as that predicted by Townsend actually exists.
Poverty and participation
As already noted, Figure 1 shows how the various dimensions of participation are related to each other and may be combined to provide a participation score for each person in the sample. The numbers are standardised coefficients that indicate the relative strength of the associations. Larger numbers indicate stronger associations.9 They indicate, for example, that a person’s participation score is almost equally determined by deprivation and social participation (coefficients of 0.54 and 0.55, respectively), with trust playing a lesser though still significant role (0.36). The key finding here is that the data supports the contention that these three dimensions form part of a single descriptive trait that captures the degree of a person’s participation in society.
The component of participation reflecting deprivation is shaped strongly by whether respondents feel on top of their finances, can save and pay bills on time, are able to keep their house in good condition and can afford to take a holiday and entertain their friends. The range of consumer durables that respondents possess is less important in differentiating between high and low participation. This is probably because many of the consumer durables taken into account are widely considered to be essentials in modern society that people may have acquired before they fell on hard times. In some cases, though, people may have chosen to possess such items for reasons that are not financial. In addition, the fact that people possess an item does not mean that it will be new or in good condition, a factor that cannot be judged on the basis of the evidence available.
Social participation reflects political interest, religious adherence and neighbouring in that order but the associations, though statistically significant, are less definitive than in the case of deprivation. It will be recalled that these components were only proxies for three forms of social participation – informal, associational and formal – resulting from the absence of direct measures in the first wave of the Understanding Society study. It is therefore possible that this use of proxies explains why the component of social participation is not more tightly delineated in the data. The third dimension of participation, trust, is most strongly influenced by respondents’ willingness to trust strangers but takes account of people’s generic response to trusting other people.

13Townsend’s ‘breakpoint’
Townsend argued that participation was affected by income and Figure 2 explores the relationship between income participation and its three constituent dimensions. In Figure 2a, the sample of respondents is divided into 20 equally sized groups, called vigintiles, on the basis of the level of their net household income adjusted for household size. Participation in each income vigintile is compared with that in the top income vigintile, which has the highest participation level of all. As a consequence, all the participation scores in the graph are negative. Moreover, the broken line in Figure 2a reveals that, as Townsend might have predicted, participation declines steadily with falling income until about the fifth or sixth vigintile. Then, however, instead of diminishing dramatically, it rises slightly in lower vigintiles and increases markedly in the lowest vigintile. The soup spoon shape of the graph reveals that participation in the lowest vigintile is very similar to that in the seventh vigintile.
Figure 2a: Effect of income on participation (twentieths)
–0.250
–0.200
–0.150
–0.100
–0.050
0.000
1 2 3 4 5 6 7 8 9 10 11 12 13 14 15 16 17 18 19
Part
icip
atio
n sc
ore
Income vigintiles
No benefit + controls Benefit + controls
Income Income + controls
Note: The effect of income on participation is plotted excluding the top income vigintile and controlling for: employment status, education, family type, gender, ethnicity and region. For the six lowest vigintiles, people receiving welfare benefits are distinguished from those who are not.
Of course, the socio-demographic characteristics of people on the lowest incomes are markedly different from those at the top. The unbroken line in Figure 2a takes account of variations in employment status, educational attainment, family composition, gender, ethnicity and region of residence. It is consistently above the broken line indicating less variation in participation once account is taken of individual characteristics. Moreover, the soup spoon effect is much reduced, suggesting a minimum level participation or a floor below which participation does not fall. Rather than participation collapsing as Townsend anticipated, people necessarily have to maintain some level of basic consumption and engagement in modern society.
Even allowing for varying personal characteristics, participation appears to be unexpectedly high in the very lowest vigintile, equivalent to that in the seventh vigintile. However, many studies, including that conducted by Townsend, have pointed to a possible under-reporting of income in surveys that is most apparent at the bottom of the income distribution (Brewer et al., 2009). Certainly the lowest vigintile is very heterogeneous in composition,

14Poverty, participation and choice
Figure 2b: Effect of income on deprivation (twentieths)
–0.5
–0.6
–0.7
–0.4
–0.3
–0.2
–0.1
0
1 2 3 4 5 6 7 8 9 10 11 12 13 14 15 16 17 18 19
Dep
riva
tion
scor
e
Income vigintiles
No benefit
Note: The effect of income on deprivation is plotted excluding the top income vigintile and controlling for: employment status, education, family type, gender, ethnicity and region. For the six lowest vigintiles, people receiving welfare benefits are distinguished from those who are not.
Figure 2c: Effect of income on social participation (twentieths)
–0.05
–0.06
–0.07
–0.04
–0.03
–0.02
–0.01
0
–0.08
–0.09
–0.10
1 2 3 4 5 6 7 8 9 10 11 12 13 14 15 16 17 18 19
Soci
al p
artic
ipat
ion
Income vigintiles
No benefit
Note: The effect of income on social participation is plotted excluding the top income vigintile and controlling for: employment status, education, family type, gender, ethnicity and region. For the six lowest vigintiles people receiving welfare benefits are distinguished from those who are not.

15Townsend’s ‘breakpoint’
including the highest proportion of students (19 per cent) in any vigintile and over 8 per cent of self-employed workers, a proportion only exceeded among the richest 25 per cent. The proportion of people receiving welfare benefits10 is correspondingly lower than might have been anticipated, just 29 per cent, compared with 39 per cent for the second vigintile and above 45 for the next four vigintiles.
The downward-pointing bars in Figure 2a differentiate between individuals who receive benefits and those who do not. They show that participation is generally much lower for benefits recipients than for other people on similar incomes, and varies little, except that participation is again unusually high in the lowest vigintile. There is slightly more variation among people who are not on benefits, echoing the initial soup spoon but nevertheless reinforcing the impression of a floor. Moreover, Figures 2b and 2c reveal a similar pattern for two of the component dimensions, deprivation and social participation. It is important to recognise that household incomes vary markedly across the range of the participation floor; the average income in the sixth vigintile is more than twice that in the bottom one and two thirds greater than the average income in the second vigintile. Therefore, it is not that participation remains constant because incomes do not vary; rather, it is the case that rises or falls in income do not translate into measurable differences in participation.
Figure 2d: Effect of income on trust (twentieths)
–0.10
–0.12
–0.14
–0.08
–0.06
–0.04
–0.02
0
–0.161 2 3 4 5 6 7 8 9 10 11 12 13 14 15 16 17 18 19
Trus
t
Income vigintiles
No benefit
Note: The effect of income on trust is plotted excluding the top income vigintile and controlling for: employment status, education, family type, gender, ethnicity and region. For the six lowest vigintiles, people receiving welfare benefits are distinguished from those who are not.
To summarise, the analysis clearly indicates that participation – people’s engagement in society – as measured in this study is strongly associated with their level of income, as Townsend argued. However, there is a strong suggestion that there is a minimum level of participation, a floor, which is characteristic of people on low incomes. The floor would seem to apply to between 25 per cent and 30 per cent of the population but is noticeably lower for people reliant on the main income support and income replacement benefits.

16
3 MAPPING DIVERSITY IN PARTICIPATION
It has been established that participation declines with falling income until it reaches a floor and falls no further. However, levels of participation might well vary for other reasons. It will be recalled that Peter Townsend’s ideas were originally criticised on the grounds that the measures might merely reflect differences in taste. Given, especially, the multicultural nature of modern British society, it is imperative to consider other factors that might be associated with variations in participation.
A straightforward way to investigate differences in participation is to undertake a statistical procedure (regression analysis) that simultaneously relates a person’s participation (their participation score) to all their other characteristics. The analysis generates a number of coefficients, the sizes of which indicate how closely participation is related to each individual characteristic when all the other characteristics are taken into account. It is possible to repeat such an analysis for the various dimensions of participation, as well as for the overall score.
The importance of income
Strengthening the findings from the previous chapter, the analysis indicates that participation is closely associated with income even when account is also taken of educational attainment, gender, family type, employment status, ethnic origin and region of residence (Appendix 3). While this does not guarantee that the reduced participation is not a matter of taste, tastes directly linked to these other characteristics can be reasonably ruled out. The coefficients associated with income change comparatively little below the third decile, again pointing to a floor below which participation does not fall.

17
The relationship between income and trust is very similar to the association found between income and social participation.
Mapping diversity in participation
It is perhaps not surprising that income is related to all three dimensions of participation in a society with a strong individualistic tradition and an increasingly strong emphasis on consumption and consumerism as bases for social identity (Giddens, 1991; Slater, 1997; Featherstone, 2007). Certainly, many other studies tell a similar story (Auslander and Litwin, 1988; Menchik and Weisbrod, 1987; Walker 2008; Brewer et al., 2009). However, the patterning of the coefficients suggests (on the basis of analysis not reported in detail here) that the breakpoint below which a participation floor is evident occurs at a slightly higher level with respect to social participation and trust than for deprivation. This finding will need to be revisited as more and better data is generated by later waves of Understanding Society. However, an initial interpretation is that people may begin to withdraw from social participation before they experience real financial stress and deprivation, perhaps in a deliberate attempt to avoid material deprivation by cutting down on social spending. Another possible interpretation, informed by emergent research on the shame associated with poverty, is that people may retreat from social contact to avoid their precarious financial position becoming public knowledge and, furthermore, that they may be actively shunned by their more prosperous acquaintances and friends (Chase and Walker, 2013). This latter reading is supported by the fact that the relationship between income and trust is very similar to the association found between income and social participation.
As with the overall measure of participation, scores of social participation and trust recover slightly in the lowest decile. This is consistent with the dense neighbouring networks found in some low-income communities that, in turn, are associated with high levels of trust (Li et al., 2005). However, deprivation is also apparently less in the lowest vigintile, suggesting that this might again be a measurement issue to do with income (Brewer et al., 2009).
Variation across ethnic groups
Understanding Society is unique among multipurpose surveys in being sufficiently large to allow robust comparisons to be drawn between the various minority ethnic groups. Indeed, people who identify themselves as being Indian, Pakistani, Bangladeshi, Caribbean or African were oversampled to ensure sufficient numbers for statistical analysis. Including a measure of self-identified ethnicity in the regressions reported above reveals only small differences in overall participation between ethnic groups after taking account of differences in income and the comprehensive range of other socio-economic factors. Participation is greatest among Pakistani, Indian and Bangladeshi respondents (higher than for white respondents) and lowest among Caribbean ones. African respondents and those reporting mixed ethnicity did not differ significantly from the white majority.11
However, there are quite marked differences between ethnic groups with respect to the three individual components of participation (see Figure 3). Material deprivation is statistically higher among all minority ethnic groups than among their majority white counterparts, with the one exception of the Indian group. It is particularly high among Africans, respondents of Caribbean descent and the heterogeneous grouping comprising other minority ethnic groups. Trust is also generally lower among respondents from minority ethnic groups than among white respondents. The differences were generally too small to be statistically significant after taking account of all other factors, with the exception of Indian and

18Poverty, participation and choice
Caribbean respondents. However, while minority ethnic groups experience greater material deprivation than their white counterparts and are marginally less trusting, every group (except that comprising people who describe themselves as being of mixed ethnicity) averages higher scores on social participation than do white respondents. In the case of African, Indian and Bangladeshi respondents, it is social participation that turns their average overall participation score positive, relative to white respondents. African respondents characteristically had high scores on religious adherence and political interest. Pakistani and Bangladeshi respondents were similarly engaged in religious activity but, other things being equal, were more likely to be actively engaged in their local neighbourhood than in political activity as such. The statistical logic underpinning this finding is that one component of participation can substitute or compensate for another. The empirical logic that deserves further study is that social resources among certain ethnic minorities serve, from choice or necessity, as an alternative to or substitute for material resources. There is some empirical evidence, albeit circumstantial, to support this (Gilchrist and Kyprianou, 2011; Barnard and Turner, 2011).
Figure 3: Participation by ethnic minorities relative to white respondents
–0.10
–0.05
0
0.05
0.10
0.15
Stan
dard
ised
bet
a co
effici
ent;
rela
tive
to w
hite
Bri
tish
(= 0
)
Indian Pakistani Bangladeshi Caribbean African Mixed Other
Deprivation Social participation
Trust Participation
The size of the samples means that it is possible to run separate analyses of the factors associated with participation for each of the larger ethnic groups. Doing so confirms that participation is related to income among all groups although with notable differences (Appendix 4). The diverse income distributions characteristic of the various ethnic groups adds analytic difficulties since the imposition of national income quantiles means that the statistics derive from different sample sizes and vary in their robustness. This issue aside, the experience of the majority white community, not surprisingly on account of its size, directly reflects the national figures: participation generally falls with income until around the third decile. The same low participation point is evident for African and Caribbean respondents but occurs at the second decile both for Bangladeshis and for the composite group of other ethnic minorities. Participation among Pakistanis continues to fall with income right to the bottom decile, while for respondents of mixed ethnicity a low point is evident in the fourth decile, with participation being slightly higher among those in the lowest

19
The nature of the association between participation and education, once having taken account of income, varies across the different ethnic groups.
Mapping diversity in participation
three deciles. Turning to material deprivation and consistent with the findings reported above, scores tend to peak at a lower level of income than for overall participation, notably around the second decile for Indians, Pakistanis, Bangladeshis and Caribbeans.
While participation overall declines and deprivation increases as income falls within every ethnic group, the relationships are complex and not uniform. As such, it is difficult to conclude that a single participation floor appertains across all ethnic groups. Further analysis is required to establish whether different floors exist pitched relative to the income distributions of specific ethnic groups.
Other factors associated with participation
Participation is closely associated with income and, according to Townsend’s reasoning, largely driven by low income as a demarking characteristic of poverty. However, it is sensitive to other causes of social exclusion. Over and above the low incomes that characterise people who are unemployed, the fact of being unemployed is associated with additional deprivation and a further reduction in social participation. Similarly, people who are not employed because of disability or long-term health problems are also likely to have lower participation scores than their income alone would predict. They score high on deprivation, low on social participation and, unlike unemployed people, low on levels of trust. For reasons that require further investigation, unemployment or sickness did not seem to reduce the participation scores of Indian and Pakistani respondents.
People who are retired have lower levels of deprivation and higher levels of social participation than would be expected on the basis of their income. They may have more time to engage in social participation and will have had time during the course of their lives to acquire the material assets to protect them from experiencing material deprivation, although they may still be susceptible to the depreciation of those assets. Self-employed people were among the least deprived with high overall levels of participation. This finding is consistent with other studies (Brewer et al., 2009) but requires further investigation; it may reflect the disparate nature of self-employment.
Participation also varies with people’s educational attainment independently of the relationship between income and education. Participation is highest among graduates and lowest among those without qualifications, with people having A-levels or sub-degree level professional qualifications falling between graduates and people with GSCEs or their equivalent. This pattern is replicated for each dimension of participation such that one might speculate that there are three distinct modes of living demarcated first by possession of any qualifications and, second, by whether or not people have a degree. Trust and social participation are in fact both more strongly related to educational attainment than they are to level of household income.
The nature of the association between participation and education, once having taken account of income, varies across the different ethnic groups. It is quite similar for white, Bangladeshi and Caribbean respondents who all exhibit the same threefold pattern described above. However, it differs for Indians and Pakistanis, and differs again for Africans. The key distinction among the former two ethnic groups is between graduates and non-graduates, graduates exhibiting much higher participation scores with correspondingly low levels of deprivation. For Africans, there is a similar distinction but the divide is between persons with A-level qualifications

20Poverty, participation and choice
and those without. For groups other than Indians, Pakistani and Africans, however, material deprivation is noticeably higher among respondents with only basic qualifications or none at all.
The associations between participation, age, gender and family type are quite complex. Overall participation is highest for pensioner couples, lowest for lone parents and single-person households, and somewhat less than average for other families with children. This pattern is strongly driven by scores on material deprivation but is echoed in social participation though with single pensioners also having above average scores. A rather different profile is apparent with respect to trust, which is high among pensioner couples but also among single pensioners and single non-pensioners. Lone parents with Caribbean, Bangladeshi and African ethnicities did not generally have the low participation scores found in other groups.
Separate models were estimated, substituting age for family type.12 Participation is greatest among older people, those aged over 50 who are approaching the end of their working lives and those over retirement age. This pattern is reflected both in the deprivation scores and in terms of social participation and, since the analysis controls for other factors, appertains even when account is taken of differences in income and education. This phenomenon is very probably linked to the accumulation of assets and friendships over the life course, as is well documented elsewhere (Hills et al., 2013; McDonald and Mair, 2010) and increased participation in formal and informal associations made possible by the reduction in the demands of child rearing and career building experienced in later life (Lader et al., 2005).
Interestingly, people are equally trusting, irrespective of age, which suggests that the high scores on trust for pensioners reported above are not explicable in terms of age but reflect something special about being a pensioner. Women are more likely to score lower than men on the overall participation index because of their increased risk of deprivation and because they are less trusting. There are no differences between men and women in terms of social participation after account is taken of the lower household incomes experienced by women.
Finally, it is noteworthy that participation varies by country and geographic region. In overall terms, participation is highest in Northern Ireland and the South East and lowest in Wales, the North East Midlands and Greater London. Once controls are introduced covering regional differences in income, employment, education, family type and ethnicity, Northern Ireland retains pole position, a result that echoes the findings of Ferragina (2012) using the European Value Survey and the Eurobarometer. It is followed by Scotland and the North West.
Participation varies, therefore, according to region, ethnicity, family type and education, with higher scores on one dimension possibly substituting for lower ones on another. However, the relationship with income is persistent across all groups, with slight variation between ethnic groups in the level of income at which participation ceases to fall.

21
4 CHOICE IN PARTICIPATION
So far, the research has demonstrated that participation, in all its three forms, falls with household income until around the fifth vigintile, after which further falls are marginal. Moreover, it is apparent that for the most part these relationships are robust, remaining statistically significant even when a large number of other individual characteristics are taken into account. As might be expected, the degree of material deprivation, the most evident manifestation of poverty, is more closely related to income than to any other personal characteristic considered in the analysis.
As noted above, Townsend’s work has been criticised on the grounds that the measures of participation and deprivation used could be construed as matters of taste rather than manifestations of financial constraint. Be this as it may, it could be argued that the effect of reduced income would be to constrain choice such that those on minimal incomes have to spend money on the basics of survival and have little if any money left over for discretionary purchases and the exercise of choice. Indeed, they might not even have the resources to engage in activities or to acquire the goods and assets that most people would consider to be essential. To explore this hypothesis, a rarely used statistical technique, heteroscedastic regression, is employed; the technique was originally devised to test the validity of assumptions that underpin the interpretation of regression analysis (Appendix 4).
What heteroscedastic regression offers is the ability to answer two questions simultaneously: does the average level of participation decline as income falls and do differences or variation in the kinds of participation also diminish with decreased income or, indeed, increase? Two alternative hypotheses can be established. The first assumes a comprehensive index

22Poverty, participation and choice
Variation in participation decreases rather than increases with income but there is no evidence of any threshold.
of all consumption and participation possibilities and, given such an index, variance would serve as a measure of choice. If variance in participation is high, it provides evidence that people have the ability to choose positively how to participate. By contrast, limited variance associated with low income suggests that resource constraints severely restrict people’s ability to choose. The hypothesis would be that variance increases steadily with rising income or, akin to Townsend, that choice is severely restricted below an income threshold. However, the Understanding Society study necessarily collects information on only a comparatively small subset of all consumption possibilities and is restricted in part to items generally considered to be necessities. With the measures available, therefore, one might hypothesise that variance would decrease with rising income since people with greater resources could afford to acquire all the possessions listed and do everything inquired about in the survey.
Poverty and choice
The regression technique that is used results in two separate but interconnected models, one of which explores factors associated with the level of participation while the other focuses on the determinants of variation in participation. As one would have hoped, the first model, describing the relationship between average participation and income controlling for individual characteristics, is entirely consistent with the results presented above. The results are therefore shown in Appendix 5, Table A1. All three forms of participation decline with falling income and, as before, participation does not fall beyond a low point that occurs around the third decile. The same associations with, for example, education, gender and age are also apparent. Moreover, not only are these results consistent with those presented earlier, they are arguably more accurate since the statistical assumption of equal variance is now met because of use of the new technique.
More interestingly, the second interconnected model demonstrates conclusively that variance increases with falling rather than rising income (Figures 4a–4d and Appendix 5). This pattern is clearest with respect to deprivation where, with the exception of a slight inversion at the fourth and fifth decile, variance decreases consistently with rising income. In the case of social participation, the difference in variance only becomes statistically significant when variance in the top income decile is compared with that in the bottom three deciles. Again, variance is less when incomes are low rather than the reverse. What this finding therefore indicates is that people on low income really do have to make difficult choices between expenditures that the average person would consider essential. The vast majority of people in the top quarter of the income distribution who want the consumer durables included in the Understanding Society survey already have them. The uptake of consumer durables generally approaches a saturation threshold, the level of penetration varying by item, quite consistently at between the 70th and 75th percentile of household income. Likewise, above a certain income level almost everybody can afford to participate in social engagements. Despite talk of people on high incomes feeling the financial pinch, most do not confront the intense difficulty of making ends meet that is endemic among people experiencing poverty.
The evidence, therefore, is that variation in participation decreases rather than increases with income but there is no evidence of any threshold. Here, variance indexes a very constrained form of choice, namely the requirement

23Choice in participation
Figure 4a: Participation: mean and variance by income decile
–0.2
–0.1
0
0.1
0.2Re
gres
sion
coe
ffici
ent r
elat
ive
to to
p de
cile
+10
Income deciles
0 5 10
Mean participationVariance in participation
Figure 4b: Material deprivation: mean and variance by income decile
–1
–0.5
0
0.5
Regr
essi
on c
oeffi
cien
t rel
ativ
e to
top
deci
le +
10
Income deciles
0 2 4 6 8 10
Mean deprivationVariance in deprivation
Figure 4c: Social participation: mean and variance by income decile
–0.1
0
0.1
0.2
Regr
essi
on c
oeffi
cien
t rel
ativ
e to
top
deci
le +
10
Income deciles
0 5 10
Mean social participationVariance in social participation
Figure 4d: Trust: mean and variance by income decile
–0.2
–0.1
0
0.1
0.2
Regr
essi
on c
oeffi
cien
t rel
ativ
e to
top
deci
le +
10
Income deciles
0 2 4 86 10
Mean trustVariance in trust

24Poverty, participation and choice
to choose which needs to neglect and which things to do without because of lack of resources. Were it possible to examine a much wider range of possessions and activities, to measure positive choices directly, one would expect to find variance decreasing with falling income. This is attempted by employing a second survey, the Family Spending Survey (FSS, 2010), which provides much more detailed information on expenditure although it does not permit direct measurement of social participation and trust. Analyses, not reported here, examined expenditure on a range of different commodities and activities but again variance seemed frequently to decrease with income rather than to increase. Those with higher incomes had a greater tendency to make all manner of purchases during the study period, whereas those on the lowest incomes had to make hard choices, prioritising one item over another. It was only when total expenditure was analysed across all items for which expenditure was collected that the anticipated pattern emerged (Figure 5). In this case, total expenditure falls as expected with income. For the most part, the variance also falls, which suggests that constraints on choice become more severe the lower the income. The figures even hint at a breakpoint at around the third income decile with variance increasing above it but remaining relatively stable below it. This suggests that choice is equally constrained but the breakpoint is not so marked as that found to be associated with participation scores when using the Understanding Society dataset.
Figure 5: Consumption and choice: mean and variance by income decile
–5.0
–4.5
–4.0
–3.5
–3.0
Regr
essi
on c
oeffi
cien
t rel
ativ
e to
top
deci
le +
10
–2.5
–2.0
–1.5
–1.0
–0.5
0
Income deciles
0 2 4 86 10
Mean total consumptionVariance in consumption
This analysis has sought to investigate how lack of income constrains choices about the type and level of consumption and participation. Although the available data mostly relates to measures of deprivation rather than living standards as such, there is some evidence that positive choices are

25Choice in participation
constrained by falling income. There is even the suggestion of a threshold around the third income decile with the intimation that it is only above this income that people are able to make positive choices about what to buy and do. The data permits more definitive conclusions about negative choice; it is very clear that people on incomes in the lowest three deciles are forced by limited resources to choose between basic necessities.

26
5 CHILDREN’S PARTICIPATION
Townsend’s major contribution to poverty studies was to shift attention from lack of income itself to its manifestation in terms of people’s participation in society. His focus therefore was on the consequences of limited income in hindering people in their desire to lead engaged and fulfilling lives. Moreover, in turn, he sought to use the manifested lack of participation as a means of defining poverty by seeking a breakpoint in the relationship between income and participation. Townsend’s initial work, and the debate that it generated, focused exclusively on adults, with no immediate thought given to the effects of household incomes on children’s participation.
Of course, this is not to say that there has been no research on the implications of poverty for children or that no attention has been paid to child participation. As noted below, there has been much of both but the discussions have taken place in different quarters of the policy and academic worlds. Therefore, this chapter unites these discussions to consider the impact of poverty on children’s participation and to investigate how this may be mediated by other factors, particularly parent–child interactions.
The aim of this chapter is to investigate the impact of poverty on the participation of young children in the UK, using data collected from the children themselves and their main carers. The data is from the Millennium Cohort Study (MCS, 2008) fourth wave, which is a large database collected in 2008 in the UK and relating to children at the age of eight. Structural equation modelling (SEM) is used to identify and measure dimensions of participation, which are then regressed against a set of controls including income.

27Children’s participation
The impact of poverty on children
The impact of poverty on a child’s future life chances has been extensively researched (see, for example, HMT, 2008; LCPC, 2008; CDF, 2007; Such and Walker, 2002). The negative effects of low income on educational performance and attainment are well established (Horgan, 2007; Blanden and Gibbons, 2006; McCulloch and Joshi, 2001; Blanden and Gregg, 2004) and it has also been demonstrated that these effects can be moderated by the social mix of a child’s school (Blanden, 2006). Delinquent behaviour by adolescents is similarly known to have a greater negative impact on their education where they are in families living on low incomes (Monk-Turner, 1989; Tanner et al., 1999; Hannon, 2003).
Tomlinson and Walker (2010) demonstrated that several factors popularly thought to be associated with poverty during adolescence (such as limited parental involvement, poor educational orientation and risky behaviour) significantly reduced the chances of young people attaining high occupational status and good educational qualifications by the end of their 20s. Furthermore, family income during childhood remained a highly significant influence even after controlling for these other factors. Problems related to illness, obesity and the higher risk of accidents prevalent in poorer families also appear to persist into adulthood (DCSF, 2007; Dowling et al., 2004).
Studies have explored the role of parenting in a child’s development and how poverty can detrimentally affect desirable outcomes unless parents intervene in some way to protect the infant (Gerschoff et al., 2003; Masten, 2001; Flouri, 2004; Ross et al., 2009). Research on childhood well-being also indicates that parenting can be a mediating influence offsetting the impact of poverty (Land et al., 2006; Bradshaw and Mayhew, 2005).
All these processes combine to make it extremely difficult for children in poverty to reach their true potential. Social mobility is thus hampered by a lack of resources and by the associated stigma attached to being poor. As Breen and Goldthorpe (1999) write: ‘Children of disadvantaged class origins have to display far more merit than do children of more advantaged origins in order to attain similar class positions.’
Despite the intensive interest in the effects of poverty on child outcomes, its effect on childhood participation has been little researched. This is particularly surprising given that participation is one of the cornerstones of the UN Convention on the Rights of the Child:
1. States Parties recognise the right of the child to rest and leisure, to engage in play and recreational activities appropriate to the age of the child and to participate freely in cultural life and the arts.
2. States Parties shall respect and promote the right of the child to participate fully in cultural and artistic life and shall encourage the provision of appropriate and equal opportunities for cultural, artistic, recreational and leisure activity.
– UN Convention on the Rights of the Child, Article 31
In a campaigning context, the Joseph Rowntree Foundation recently coined the term ‘participation poverty’ to refer to children’s lack of participation, an idea taken up by the End Child Poverty Network Cymru, which also found its way into the Joint Agreement on Child Poverty (JRF, 2009; ECPNC, 2009; WAG, 2009).
Of course, participation relates to Townsend’s conception of the relative and the absolute. What it means ‘to participate fully’ changes as society
28Poverty, participation and choice
Participation is also likely to differ between adults and children and is likely to change as a child grows older.
develops and living standards alter. What constitutes participation is also likely to differ between adults and children and therefore is likely to change as a child grows older. So, for a child of a given age, it becomes legitimate to explore how that child’s participation changes across the income distribution, and how the child’s parents or guardians facilitate particular forms of social and cultural involvement. Cohort studies, such as the Millennium Cohort Study employed below, have the distinct advantage that they encompass a wide range of data from a large sample of respondents of the same age.
However, the study of participation among poor children has been somewhat limited and most studies of children and young people focus on social exclusion. Tomlinson and Walker demonstrated that teenage children experiencing poverty were not only more likely than their more affluent peers to live in deprived neighbourhoods but also more likely to suffer a poorer quality home life, to participate more often in risky behaviour and to be less engaged at school (Tomlinson and Walker, 2009). Research conducted in the Netherlands also suggests that poor children are less able to engage in informal social networks or formal social activities (Van der Hoek, 2005; see also Attree, 2004). Studies indicate too that children in poverty generally participate less in organised extracurricular activities than their more affluent classmates (see Daly and Leonard, 2002; Middleton et al., 1994; Sutton et al., 2007).
Adelman et al. (2003) report that impoverished children do not feel particularly disadvantaged in their relationships at school or their overall general happiness, but that they have lower self-worth and reduced self-esteem, and are less likely to receive pocket money. Although children often have incomes of their own and many teenagers work, Ridge (2007) has documented the importance of pocket money for children. Poverty studies have shown that children in poverty only receive such money at best intermittently and moreover are expected to utilise it for everyday activities that would typically be covered by the parents of their more affluent peers (Roker, 1998; Shropshire and Middleton, 1999).
The experience of a child as a consumer (and subject to various pressures from advertising, marketing and so forth) is now prominent in contemporary British society (Layard and Dunn, 2009). Peer pressure has been identified as a primary source of taste formation in children (Pilgrim and Lawrence, 2001; Schor, 2004) and the majority of parents often feel pressurised to conform to the child’s demands for the latest brands and accessories (Pilgrim and Lawrence, 2001; Children’s Society, 2008). Poor children are often excluded and stigmatised because they cannot compete with wealthier households in terms of acquiring the latest fashions and find it difficult to keep up (Daly and Leonard, 2002; Middleton et al., 1994; Morrow, 2001). A pioneering study of advertising in the USA found that children would rather play with another child who sported a well-advertised product than one who did not (Goldberg and Gorn, 1978).
Participation by children is likely not only to be a reflection of their own tastes and preferences but also of choices made by a child’s carers. Asking children what activities they take part in, and ascertaining from their parents what activities they engage in with their children, facilitates a more focused exploration of childhood and poverty than the more conventional focus on household-level deprivation or the social exclusion and civic participation of adults in the household. The resultant analysis of the social participation of children does not rely solely on income or the views of the adults in the family and so can be undertaken without subsuming the child into the realm of the household.

29Children’s participation
This section therefore seeks to identify how income affects such participation and whether there is any evidence of an identifiable breakpoint in the distribution of income akin to that evident for parents and predicted by Townsend.
Child participation and income
Information on children’s participation was obtained from the Millennium Cohort Study, which has been following a large sample of 14,000 children born in the year 2000 who were, therefore, eight years old for the fourth wave of the study in 2008. Data was collected through several face-to-face interviews with the main carer (in the vast majority of cases this is a woman), a self-completion questionnaire administered to the children, the child’s teacher and school administrative records. It is therefore possible to compare children’s own accounts of their social life with the child-centred activities reported by the parent or main carer.
The analytic approach adopted is analogous to that used in Chapter 3. Child participation and parental participation with children are both taken to be multidimensional concepts that are measured in terms of sets of activities and attitudes reported by the children and parents in the study sample. The extent to which participation is associated with income is then explored, controlling for a number of individual characteristics. Finally, it is possible to examine whether the participation of children is affected by their engagement with their parents or main carers.
In the analysis of the children’s responses, gender is included as a control so as to identify differences between boys and girls. It is excluded from the analysis of parents and adult carers since the vast majority of those answering the questionnaire as the principal carer were women. Account is taken of whether each child has one or two parents or carers living with them who potentially share in the task of childcare. Similarly, the presence or otherwise of siblings and the working hours of the principal carer are both controlled for since they might limit the time spent in direct contact with the child.The questions asked of adults in the Millennium Cohort Study enable one to think of adults’ participation with their children in terms of three dimensions:
• ‘paid-for activities’, including visits to concerts, galleries, zoos, theme parks, cinemas and sporting events in the last twelve months;
• ‘educational help’, which includes whether the child receives assistance with mathematics, reading and writing within the household (this excludes private tuition); and
• ‘play’, including reading, musical activity and artistic activity.
The analysis portrayed in Figure 6 shows that the three dimensions are only loosely associated with one another. Play and paid-for activities are more closely and significantly aligned, possibly because they both entail expenditure, directly or indirectly. The coefficients associated with the education and play dimensions are all similarly high, indicating that the variables contribute fairly evenly to the overall measure. The same is not quite true of the variables contributing to the paid-for activities since the coefficients associated with visits to theme parks and sporting events, though significant, are comparatively low perhaps because they take place less frequently.

30Poverty, participation and choice
Figure 6: SEM of parents’ participation (all coefficients significant at 1% level unless stated)
CONCERTS
GALLERIES
ZOO
THEME PARK
CINEMA
SPORTS EVENTS
READING
WRITING
MATHS
READ TO
MUSIC
ART
PAID
ACTIVITIES
Fit statistics (N = 13,024): Chi square 410.5 CFI 0.997 TLI 0.996 RMSEA 0.020
0.66
EDUCATION
HELP
PLAY
0.53
0.56
0.35
0.63
0.44
0.82
0.94
0.83
0.87
0.86
0.86
n.s.
n.s.
0.28
For children, three dimensions of participation emerge from data collected in the Millennium Cohort Study: ‘activity-based’ participation, relating to physical activities such as sport; ‘friendships’, concerned with social networks and relations with friends; and ‘educational engagement’, which relates to how the child feels about school and proactively participates in it (see Figure 7).
All three child dimensions are highly correlated, suggesting that a child enjoying life along one dimension is likely to have similarly high scores on the others and vice versa. Some variables have rather low coefficients, although they are all significant at the 1 per cent level. In some cases this may be because variables capture personal taste, as well as degree of engagement, for example, whether children like science or sport. In other instances the questions may have socially desirable answers or ones that children might consider to be shameful, such that comparatively few children are prepared to offer answers that differ from the norm. For example, few children admit to being ‘left out’ or to not having ‘best friends’. This may be true but suggests that those that do are exceptional, either in reality or because they are prepared to say that they lack friends. Overall, the highest coefficients relate to enjoyment of school activities and to generally liking school, both outscoring play with friends. This suggests, perhaps surprisingly, that for 8-year-old children school forms the nexus around which social and participatory networks are formed, with their friendships and activities (play, physical or educational) operating in tandem. This interpretation is supported by the high correlations existing between the three dimensions of participation.

31Children’s participation
Figure 7: SEM of child participation (all coefficients significant at 1% unless stated)
LIKE OUTDOOR SPORT
LIKE INDOOR SPORT
LIKE PE
FRIENDS
BEST FRIENDS
LIKE FRIENDS
LEFT OUT
LIKE SCHOOL
LIKE READING
LIKE MATHS
LIKE SCIENCE
LIKE ANSWERING
TRY BEST
TEACHER CLEVER
BEHAVE
SCHOOL INTEREST
Fit statistics: Chi square 2119.2 CFI 0.946 TLI 0.996 RMSEA 0.039
0.54
FRIENDS
EDUCATIONAL
0.32
0.65
0.59
0.36
0.72
–0.29
0.77
0.55
0.61
0.45
0.54
0.53
0.47.
0.57
ACTIVE
0.56
0.42
0.44
0.74
Factors associated with parental involvement
Existing research suggests that at least part of the impact of poverty and child well-being may be accounted for by financial constraints on parents that limit the extent to which they can fulfil their caring responsibilities (Tomlinson and Walker, 2009, 2010). This contention is supported by the analysis of the Millennium Cohort Study but with important subtle qualifications.
Prior evidence suggests that parents’ engagement with their children is associated with their educational attainment which, in turn, is affected by household income. Therefore, in focusing on the effect of income on parental involvement, it is necessary to control for educational attainment (Land et al., 2006; Ross et al., 2009). Having done this, analysis of the Millennium Cohort Study reveals that adult engagement with their children is still closely tied to household income.
Perhaps, not surprisingly, that association is strongest with respect to paid-for activities and participation falls very markedly as income declines. Moreover, there is even the suggestion of a Townsendian-like breakpoint that occurs between the second and third income deciles at which point engagement does not collapse but ceases to fall.

32Poverty, participation and choice
Parents in the lower income deciles are statistically more likely to help their child with reading, writing and mathematics than other parents.
The extent to which parents (or principal carers) play with their children is also related to income, if less strongly than with paid-for activities, and the effect is again most evident around the second and third deciles. Of course, income is not the only influence that matters. Play declines with parents’ educational attainment and is particularly sensitive to the number of carers. Principal carers in two-parent families spend notably more time playing with their children than when there is just one parent or adult, presumably because two parents collectively have more time to spend than one. Mothers who work tend to play with their children a little more frequently than those who do not, spend an equal amount of time helping their children with their education and actually spend a little more time attending paid-for activities. Somehow, therefore, working mothers appear to be able to juggle their time so that their children do not miss out. However, time is finite and has to be carefully apportioned. When children have siblings they necessarily get less of their parents’ undivided time than when they do not, a phenomenon that applies to all three forms of parental involvement captured in the Millennium Cohurt Study.
While income constrains parents’ engagement in paid-for activities with their children and is even associated with the time spent playing with children, the modelling reveals that parents in the lower income deciles are statistically more likely to help their child with reading, writing and mathematics than other parents. Over two-thirds of parents assist their children with reading and writing and over half with mathematics but the poorest parents do so even more. At first sight this finding might seem counterintuitive. However, further models not reported here indicate that there is also a strong statistical relationship between school performance and increased assistance. Children that are struggling at school (according to their teachers’ assessment) are more likely to receive help from their parents or carers and these children are concentrated within the lower income brackets. Moreover, the relationship between household income and time spent helping children with educational activities becomes insignificant if account is taken (by including an interaction term in the model) of the statistical association indicating that a child’s performance at school is generally worse if their household income is low. It would appear, then, that parents with low incomes are spending additional time helping their offspring with schoolwork in order to compensate for their children’s poor educational performance.
Children’s social participation
From the child’s perspective, family income seems to have very little effect on play, friendships or educational orientation. The modelling suggests that the extent to which a child participates in sporting activities or engages proactively with school is unrelated to family income and, while there is a statistical association with friendships, it is only marginally significant. Much more important is the child’s gender: girls are much more likely than boys to have a strong educational orientation and to have developed friendship networks, while boys are somewhat more likely to participate in physical activities.
It appears that, for an 8-year-old, any deleterious impacts of low income are hidden from view or yet to manifest themselves. The aforementioned association between household income and children’s friendships, which is apparent at the lower end of the distribution, is weak. Nevertheless, it could be the first sign of the process through which older children are excluded
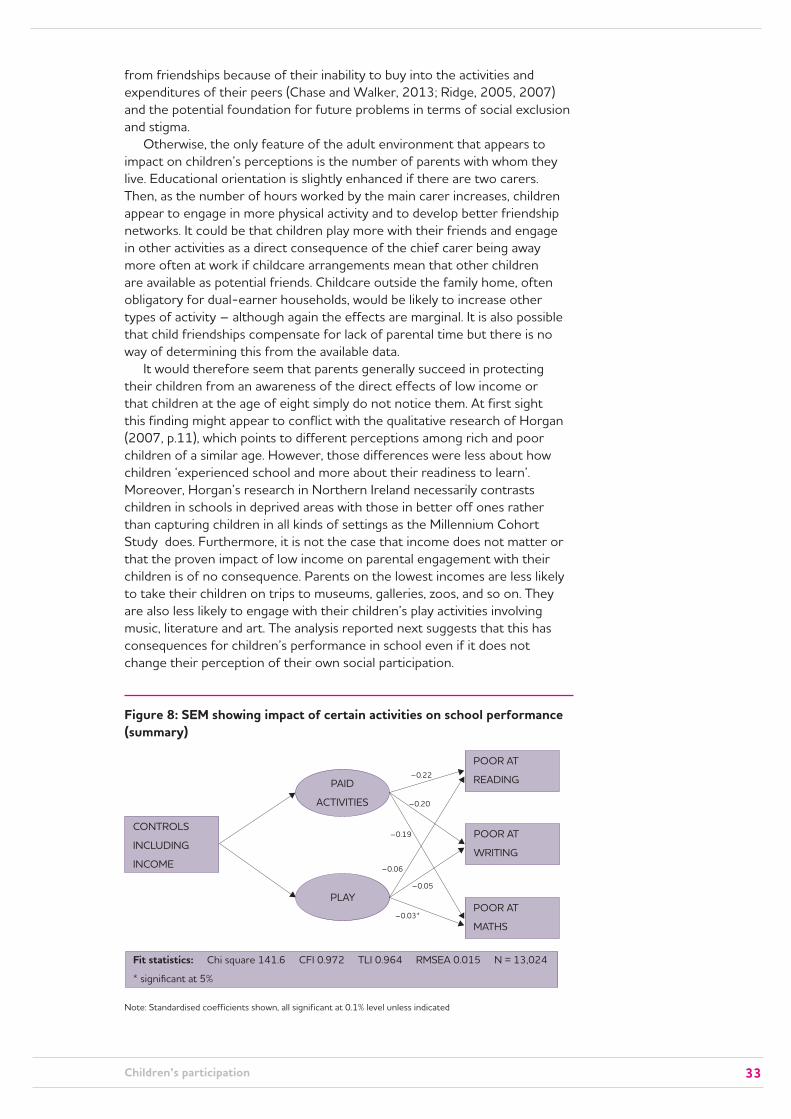
33Children’s participation
from friendships because of their inability to buy into the activities and expenditures of their peers (Chase and Walker, 2013; Ridge, 2005, 2007) and the potential foundation for future problems in terms of social exclusion and stigma.
Otherwise, the only feature of the adult environment that appears to impact on children’s perceptions is the number of parents with whom they live. Educational orientation is slightly enhanced if there are two carers. Then, as the number of hours worked by the main carer increases, children appear to engage in more physical activity and to develop better friendship networks. It could be that children play more with their friends and engage in other activities as a direct consequence of the chief carer being away more often at work if childcare arrangements mean that other children are available as potential friends. Childcare outside the family home, often obligatory for dual-earner households, would be likely to increase other types of activity – although again the effects are marginal. It is also possible that child friendships compensate for lack of parental time but there is no way of determining this from the available data.
It would therefore seem that parents generally succeed in protecting their children from an awareness of the direct effects of low income or that children at the age of eight simply do not notice them. At first sight this finding might appear to conflict with the qualitative research of Horgan (2007, p.11), which points to different perceptions among rich and poor children of a similar age. However, those differences were less about how children ‘experienced school and more about their readiness to learn’. Moreover, Horgan’s research in Northern Ireland necessarily contrasts children in schools in deprived areas with those in better off ones rather than capturing children in all kinds of settings as the Millennium Cohort Study does. Furthermore, it is not the case that income does not matter or that the proven impact of low income on parental engagement with their children is of no consequence. Parents on the lowest incomes are less likely to take their children on trips to museums, galleries, zoos, and so on. They are also less likely to engage with their children’s play activities involving music, literature and art. The analysis reported next suggests that this has consequences for children’s performance in school even if it does not change their perception of their own social participation.
Figure 8: SEM showing impact of certain activities on school performance (summary)
CONTROLS
INCLUDING
INCOME
Fit statistics: Chi square 141.6 CFI 0.972 TLI 0.964 RMSEA 0.015 N = 13,024
* significant at 5%
0.54
PLAY
EDUCATIONAL
0.32
0.65
0.59
0.36
0.72
–0.29
0.77
0.55
0.61
0.45
0.54
–0.22
0.47.
0.57
PAID
ACTIVITIES
0.56
0.42
0.44
0.74
POOR AT
WRITING
POOR AT
READING
POOR AT
MATHS
–0.20
–0.19
–0.06
–0.05
–0.03*
Note: Standardised coefficients shown, all significant at 0.1% level unless indicated

34Poverty, participation and choice
The analysis is summarised in Figure 8. It reports on an exploration of the factors associated with children’s performance in reading, writing and maths according to teachers’ assessments, focusing on parental engagement in play and paid-for activities after controlling for all the variables included in previous models including income.
What is evident is that parental engagement with their children through play, and particularly in taking children to places such as zoos and museums that are likely to charge or to entail spending on transport, has a significant affect on school attainment, enhancing performance across the range of subjects. The implication is that low family income has an indirect effect on school performance that is mediated by parents’ ability to engage with their children in play and trips out, possibly due to the expense associated with such activities or to limited time left over after attempts to make ends meet. There is no evidence that the association between participation and income that fascinated Townsend is directly replicated for children, changing the nature of their social participation. However, lack of income does appear implicated in shaping the kinds of involvement that parents have with their children which, in turn, affects their performance at school and potentially, therefore, their life chances.

35
6 CONCLUSION: INFORMING PUBLIC UNDERSTANDING OF POVERTY
The arrival of large new datasets and the availability of novel analytic techniques has permitted Peter Townsend’s seminal work of the 20th century to be updated for the twenty-first. His ideas have stood the test of time. He argued that the practical consequence of poverty was to prevent people from fully engaging in the society in which they lived, and that participation fell as income declined to a point when financial constraints were so severe that participation collapsed. The reality in the 21st century is that participation generally still declines with falling income but reaches a floor below which it ceases to reduce.
This observation is underpinned by a broader definition of participation than that originally used by Townsend. It embraces more than material manifestations of deprivation, including social participation and the socio-psychological dimension of trust that is so important in people’s sense of well-being, reflecting insights from social capital theorists such as Robert Putnam (2000). The interpretation of the participation floor is that people have to continue to operate in society even if their income falls below some critical level; they have to keep going and make do by borrowing, cutting back and ensuring a little goes a long way. They are bound by social obligations and expectations to continue to try to participate, not that trying is without cost in terms of effort and self-esteem (Chase and Walker, 2013).

36Poverty, participation and choice
Townsend believed that the break in the relationship between income and participation could be used as an empirical, scientific method of gauging poverty.
The empirical evidence points to a breakpoint in the relationship between income and participation, a low floor, at around the lowest third of the income distribution (equivalised to take account of household size). This suggests that almost a third of the population share characteristics that are typically associated with the experience of poverty: difficulty making ends meet, limited possessions, constrained social activities and limited trust of other people. Peter Townsend believed that the break in the relationship between income and participation could be used as an empirical, scientific method of gauging the poverty threshold, the income level below which people can be considered to be poor. However, it is too early in the life of the Understanding Society study to arrive at a definitive empirical definition of poverty. The income variable currently available, net household income, does not fully equate to the measure used in Britain’s official income distribution statistics based on the British Household Panel Survey (Levy and Jenkins, 2012). Moreover, literature over the past four decades has suggested that simple cross-sectional counts of poverty can be misleading. Poverty is more of a process than a state, with rapid and sometimes large fluctuations in incomes and needs adding an often unpredictable dynamic that causes most spells of poverty to be brief but others long (Jenkins, 2011). However, it is already apparent from the analysis of Understanding Society that people’s ability to sustain their lifestyle and to participate socially comes under threat at around the level that the benefit system begins to contribute substantially to people’s incomes.
The analysis has contributed to an understanding of the nature of this threat by uniquely exploring the variation in participation observed at different income levels. While one might expect people with higher incomes to have more choice about what to spend their money on, since they can easily afford the essentials, this turns out to be difficult to prove. What is clear, however, is that the 30 per cent of people with the lowest incomes find it difficult to afford all the basic necessities and are forced to make hard choices between them. Whereas people with incomes just above this level may have to hold on to possessions such as a washing machine or freezer for longer than the norm or go out socially less frequently than they would like, people with lesser incomes may simply have to go without, perhaps not acquiring replacements when items break down. In effect, they have to choose which needs to neglect.
Townsend’s original work was criticised on the grounds that the measures of deprivation reflected decisions of choice rather than ones of necessity, which accounted for the attempt to investigate variation. Moreover, such criticisms are potentially even more pertinent given the development of a more multicultural society in the decades since Townsend was writing. Separate analyses for the larger minority ethnic groups have revealed that, while material deprivation is more prevalent in each of the minority groups than within the white majority (Indian people excepted), participation overall is generally higher owing to greater levels of social participation. As Townsend would have predicted, participation is strongly associated with income across all ethnic groups but the associations are not necessarily uniform.
Townsend said little about the effects of income on children’s participation, not least because of an absence of data. However, research subsequently conducted under the ‘childhood studies’ umbrella term has demonstrated that children are strongly active in shaping their own lives and those of their families. The opportunity was therefore taken to analyse data from the Millennium Cohort Study that asked 8-year-old children about sporting activities, social relationships and engagement with school.

37
That there is a relationship between income and participation should not be neglected in public debates concerning appropriate measures of poverty.
Conclusion: informing public understanding of poverty
This demonstrated that the level and type of social participation reported by these children was unrelated to objective measures of their family resources. However, this was not true of the children’s involvement with their parents since activities requiring expenditure and even playing time seemed to be curtailed by household income. Moreover, analysis revealed that time spent by parents or carers with their children was associated with enhanced performance at school (as reported by the children’s teachers). This suggests that household income may have an indirect effect on children’s well-being, and possibly therefore on their life chances, through the limitations it imposes on the activities that parents can undertake with their offspring.
The study shows, too, that parents of children who are performing less well at school spend additional time working with them at home, seeking to boost their performance in the basic ‘3Rs’. It so happens that children who are not doing well at school disproportionately live in low-income households. Consequently, the time spent by low-income parents with their children often involves remedial education rather than the expansive, developmental activities enjoyed by their more affluent, educationally more successful, peers.
The perceptiveness of Townsend’s insight that there is a relationship between income and participation should not be neglected in public debates concerning appropriate measures of poverty and the salience or otherwise of low income. The participation floor demarcates, as perhaps it did over 30 years ago, a major fault line in British society. Unlike 30 years ago, it is necessary to recognise that the fault line is likely to find subtly different expressions across the various minority ethnic communities – perhaps it will be pitched at slightly different levels or maybe social participation is relatively more important than material resources for some groups than for others. Irrespective of these subtleties, however, participation is underpinned by level of income.
For those on the low floor, participation is severely constrained, with people negotiating a zero-sum world in which spending on one area means reduction in another. For those above the floor, additional income translates into more evident consumption and greater social participation; however, for those on the floor it means a slight easing of pressure, but no major change in lifestyle sufficient to be identified in survey evidence.
Of course, this social reality is partially a reflection of the success of the benefit system in providing an income platform or safety net through which comparatively few people fall. For some people on the participation floor, those receiving means-tested benefits, a rise in gross income will in the short term have only a marginal effect on disposable income, the so-called poverty trap. However, this is far from the full story. The income progression (that is the absolute difference in median incomes from one vigintile to the next) is very uniform throughout most of the income distribution and, indeed, is greatest at the two extremes. In proportional terms this means that increments of income for those on the participation floor are greater than for others and yet participation remains largely constant whatever the increase in income. The impact of a similar rise in income on consumption, social participation and trust is clearly very different depending on whether people are on the participation floor or above it. Above the floor, a change in income is associated with a substantial difference in participation; on the floor, the returns from additional income are much less clear.
Maybe the language of ‘us’ and ‘them’ that is echoed in political discourse (Lister, 2004; Baumberg et al., 2012; Chase and Walker, 2013) reflects the social reality created by the participation floor. The ‘them’ – be they the

38Poverty, participation and choice
‘haves’ or the ‘have nots’ – are each thought by the other to be different, uncomprehending, irrational or perverse in their behaviour, and certainly not empathetic. The political discourse is shaped largely by people looking down on the low participation floor from higher up the income distribution, from a position where gains from additional income are much clearer in making for a better material life and facilitating greater social participation than they are for people located on the low participation floor. Perhaps critics of the so-called ‘something for nothing society’ might reflect on the implications of living in the ‘nothing for something’, limited reward society that is experienced by people situated on the low participation floor.

39
NOTES1 Rowntree, in 1901, had distinguished between primary and secondary poverty and altered
his poverty thresholds in 1931 and 1951 to accommodate changing social expectations and technology (Rowntree and Lavers, 1951; Veit-Wilson, 1986).
2 He defined participation as involvement in ‘ordinary living patterns, customs and activities’.
3 Despite the failure to demonstrate Townsend’s idea definitively and quantitatively, there is considerable qualitative evidence (much of it established through research supported by the Joseph Rowntree Foundation) that people often feel the consequences of poverty manifested in the frustration that follows the inability to participate fully in society (Horgan, 2007; Sutton et al., 2007; Hooper et al., 2007; Kempson, 1996).
4 In an earlier unpublished interim report we approached the same research questions using the British Household Panel survey. Our final results confirm the preliminary work undertaken using this different dataset.
5 Understanding Society is the successor to the highly successful British Household Panel survey and incorporates and extends its sample. Understanding Society has a sample size of 40,000 households, comprising approximately 100,000 individuals, and will include augmented samples of ethnic minorities which will enable the investigation of cultural differences in consumption, participation and lifestyle. Permission was obtained to exploit the first wave of data, which comprises around half of the full sample.
6 Structural equation modelling regressions (SEM) and heteroscedastic regressions are used in order to overcome previous methodological shortcomings (Townsend, 1979; Gordon and Townsend, 1990; Gordon et al., 2000). SEM allows for combining a range of individual variables into multidimensional indicators, handling the complex measurement of participation. The dimensions differ depending on the dataset used. For example, individual measures of socialisation can be developed by combining items in the British Household Panel survey such as frequency of eating out, going to bars or attending live sports events. However, these are not available in the Understanding Society (USoc, 2009) data. Once these dimensions are estimated, and scores generated for each individual in the various datasets, they are regressed against income and other variables to ascertain how the various dimensions of participation vary over the income distribution after controlling for various factors. Heteroscedastic regression techniques are then employed simultaneously to model how the level and range of participation vary with income.
7 Townsend’s 1979 study used twelve components to measure deprivation (including deficiencies in diet, clothing, energy, household facilities, housing conditions, employment conditions, health, education, environment, child facilities, recreational activities and social contact). Those measures were reduced into five ‘major aspects’ of deprivation and subsequently combined into a single scale. Scholarship has since expanded relevant dimensions to include psychological health and happiness, financial pressure and strain (Townsend treated ‘subjective deprivation’ separately), civic participation, social trust and diversity of social contacts (Nummela et al., 2008; Larivière, 2008; Tomlinson and Walker, 2009).
8 These two items will be included in the next wave.
9 The coefficients generally lie between 0 and 1 although larger coefficients can be valid in certain prescribed circumstances (Jöreskog, 1999).
10 The main income support and replacement benefits were considered, including JSA Income Support, disability benefits, tax credits and Housing Benefit.

40Poverty, participation and choice
11 White respondents include ‘white British’, Irish others with a ‘white background’ and the 18 respondents who self-identified themselves as Gypsy or Irish travellers. Separate analysis determined that participation of the first three groups was not statistically different with respect to any of the three dimensions, while there were too few respondents in the fourth category for separate analysis.
12 Age and family type are inevitably highly correlated and, as such, cannot be included together in the same statistical model.
13 The CFI is 0.960 and the TLI is 0.956, well above the minimum threshold of 0.9 (Brown, 2006, p. 84).
14 The RMSEA is 0.045, below the threshold of 0.05 that indicates excellent fit (Brown, 2006, p. 83).
15 Second, it allows us to investigate whether one of the standard assumptions of conventional regression analysis has been met: that is, that the variance of the dependent variable is constant across the distribution of independent variables. This is assumed to be the case in most studies that use deprivation indicators as dependent variables in regression equations but the assumption is seldom tested.

41
REFERENCESAbel Smith, B. and Townsend, P. (1965) The poor and the poorest. London: G. Bell and Sons
Adelman, L., Middleton, S. and Ashworth, K. (2003) Britain’s poorest children: severe and persistent poverty and social exclusion. London: Save the Children
Attree, P. (2004) ‘Growing up in disadvantage: a systematic review of the qualitative evidence’. Child Care, Health and Development, 30(6), pp. 679–89
Auslander, G. and Litwin, H. (1988) ‘Sociability and patterns of participation: implications for social service policy’. Nonprofit and Voluntary Sector Quarterly, 17(2), pp. 25–37
Barber, B. (1983) The logic and limits of trust. New Brunswick: Rutgers University Press
Barnard, H. and Turner, C. (2011) Poverty and ethnicity: a review of evidence. Round-up: Reviewing the evidence. York: Joseph Rowntree Foundation,
Bauman, Z. (1998) Globalization: the human consequences. New York: Columbia University Press
Baumberg, B., Bell, K. and Gaffney, D. (2012) Benefits stigma in Britain. London: Turn2Us
Blair, A. (2000) Speech to the Global Ethics Foundation, 30 June 2000, Tübigen University Germany pp. 1–11
Blanden, J. (2006) ‘“Bucking the trend”: what enables those who are disadvantaged in childhood to succeed later in life?’ Working Paper no. 31. London: Department for Work and Pensions
Blanden, J. and Gibbons, S. (2006) The persistence of poverty across generations: a view from two British cohorts. Bristol: Policy Press
Blanden, J. and Gregg, P. (2004): ‘Family income and educational attainment: a review of approaches and evidence from Britain’. Oxford Review of Economic Policy, 20(2), pp. 245–63
Bradshaw, J. and Mayhew, E. (2005) The well-being of children in the UK, (2nd ed). London: Save the Children
Breen, R. and Goldthorpe, J. (1999) ‘Class inequality and meritocracy: a critique of Saunders and an alternative analysis’. British Journal of Sociology, 50(1), pp. 1–27
Brewer, M., O’Dea, C., Paull, G. and Sibieta, L. (2009) The living standards of families with children reporting low incomes. Department for Work and Pensions Research Report no. 577. London: Department for Work and Pensions
Brown, T. (2006) Confirmatory factor analysis for applied research. New York, London: The Guilford Press
Buckner, J. (1988) ‘The development of an instrument to measure neighborhood cohesion’. American Journal of Community Psychology, 16(6), p. 771
Childrens Defense Fund (2007) Child poverty in America. Washington, DC: Children’s Defense Fund
Chase, E. and Walker, R. (2013) ‘The co-construction of shame in the context of poverty: beyond a threat to social bonds’. Sociology. [in press]
Children’s Society (2008) Reflections on childhood. Available at: www.childrenssociety.org.uk [Accessed 11 December 2012]

42Poverty, participation and choice
Costa, D. and Kahn, M. (2003) ‘Understanding the American decline in social capital, 1952–1998’. Kylos, 56(1), pp. 17–46
Daly, M. and Leonard, M. (2002) Against all odds: family life on a low income in Ireland. Dublin: Combat Poverty Agency
Department for Children, Schools and Families (2007) Children and young people today: evidence to support the development of the Children’s Plan. London: Department for Children, Schools and Families
Dowling, H., Joughin, C., Logan, S., Laing, G. and Roberts, H. (2004) Financial benefits and child health. London: Barnardo’s
Durkheim, E. (1893) De la division du travail social, Vol. I, Ii, Iii. Paris: Les Classiques de Science Sociale
End Child Poverty Network Cymru (2009) Child poverty and social exclusion in rural Wales. Cardiff: End Child Poverty Network Cymru
Featherstone, M. (2007) Consumer culture and postmodernism. London: Sage.
Ferragina, E. (2010) ‘Social capital and equality: Tocqueville’s legacy’. The Tocqueville Review, 31(1)
Ferragina, E. (2012) Social capital in Europe: a comparative regional analysis. Cheltenham: Edward Elgar
Ferragina, E., Tomlinson, M. and Walker, R. (2011) Determinants of participation in the United Kingdom. Essex: ISER/ESRC
Festenstein, M. (2005) Negotiating diversity: liberalism, democracy and cultural difference. Cambridge: Polity Press
Flouri, E. (2004) ‘Subjective well-being in midlife: the role of involvement of and closeness to parents in childhood’. Journal of Happiness Studies, 5(4), pp. 335–58
FSS, Family Spending Survey (2010) Office for National Statistics. Available at: www.ons.gov.uk/ons/rel/family-spending/family-spending/2010-edition/index.html
Fukuyama, F. (1995) Trust: the social virtues and the creation of prosperity. New York: Free Press
Gamarnikow, E. and Green, A. (1999) ‘The third way and social capital: Education Action Zones and a new agenda for education, parents and community?’ International Studies in Sociology of Education, 9, pp. 3–22
Gershoff, E., Aber, J. and Raver, C. (2003) ‘Child poverty in the United States: an evidence-based conceptual framework for programs and policies’. Chapter 2, pp. 81–136 in Jacobs, F., Wertlieb, D. and Lerner, L. (eds) Handbook of applied developmental science: promoting positive child, adolescent, and family development through research, policies, and programs. Thousand Oaks, USA: Sage
Giddens, A. (1991) Modernity and self-identity: self and society in the late modern age. Cambridge: Polity Press
Giddens, A. (1998) The third way: the renewal of social democracy. Cambridge: Polity Press
Gilchrist, A. and Kyprianou, P. (2011) Social networks, poverty and ethnicity. Programme paper: poverty and ethnicity. York: Joseph Rowntree Foundation
Goldberg, M. and Gorn, G. (1978) ‘Some unintended consequences of TV advertising to children’. Journal of Consumer Research, 5, pp. 22–29
Gordon, D., Adelman, L., Ashworth, K., Bradshaw, J., Levitas, R., Middleton, S., Pantazis, C., Patsios, D., Payne, S., Townsend, P., (2000) Poverty and social exclusion in Britain. York: Joseph Rowntree Foundation
Gordon, D. and Townsend, P. (1990) ‘Measuring the poverty line’. Radical Statistics, 47, pp. 5–12
Hall, P. (1999) ‘Social capital in Britain’. British Journal of Political Science, 29, pp. 417–61
Hannon, L. (2003) ‘Poverty, delinquency, and educational attainment: cumulative disadvantage or disadvantage saturation?’ Sociological Inquiry, 73(4), pp. 575–95
43References
Hills, J., Bastagli, F., Cowell, F. and Glennerster, H. (2013) Wealth in the UK: distribution, accumulation, and policy. Oxford: Oxford University Press
Hills, J., Le Grand, J. and Piachaud, D. (eds) (2002) Understanding social exclusion. Oxford: Oxford University Press
HM Treasury (2008) Ending child poverty: everybody’s business. London, HMSO
Hooper, C-A., Gorin, S., Cabral, C. and Dyson. C. (2007) Living with hardship 24/7: the diverse experiences of families in poverty in England. London: The Frank Buttle Trust
Horgan, G. (2007) The impact of poverty on young children’s experience of school. York: Joseph Rowntree Foundation
Jenkins, S. (2011) Changing fortunes: income mobility and poverty dynamics in Britain. Oxford: Oxford University Press
Jöreskog, K. (1999) How large can a standardized coefficient be? Available at: www.ssicentral.com/lisrel/techdocs/HowLargeCanaStandardizedCoefficientbe.pdf
Jöreskog, K. and Goldberger, A. (1975) ‘Estimation of a model with multiple indicators and multiple causes of a single latent variable’. Journal of the American Statistical Association, 70 (351), pp. 631–39
Joseph Rowntree Foundation (2009) What is needed to end child poverty in Wales. York: Joseph Rowntree Foundation
Kempson, E. (1996) Life on a low income. York: Joseph Rowntree Foundation
Knack, S. and Keefer, P. (1997) ‘Does social capital have an economic pay-off? A cross country investigation’. Quarterly Journal of Economics, 112(4), pp. 1251–88
Lader, D., Short, S. and Gershuny, J. (2006) The time use survey, 2005. London: Office for National Statistics
Land, K., Lamb, V., Meadows, S. and Taylor, A. (2006) ‘Measuring trends in child well-being: an evidence-based approach’. Social Indicators Research, 80(1), pp. 105–32
Larivière, N. (2008) ‘Analysis of the concept of social participation: definitions, illustration, dimensions of activity and indicators’. Canadian Journal of Occupational Therapy, 75(2), pp. 114–27
Lash, S. and Urry, J. (1994) Economies of signs and space. Thousand Oaks USA: Sage
Layard, R. and Dunn, J. (2009) A good childhood: searching for values in a competitive age. London: Penguin
LCPC (2008) Capital gains: London Child Poverty Commission Final Report. London: Child Poverty Commission
Levy, H. and Jenkins, S. (2012) Documentation for derived current and annual net household income variables, BHPS waves 1–18. UK Data Archive Study No 3909. Colchester: Institute of Social and Economic Research
Li, Y., Pickles, A. and Savage, M. (2005) ‘Social capital and social trust in Britain’. European Sociological Review, 21(2), pp. 109–23
Lister, R. (2004) Poverty. Cambridge: Polity
Masten, A. (2001) ‘Ordinary magic: resilience processes in development’. American Psychologist, 56(3), pp. 227–38
McCulloch, A. and Joshi, H. (2001) ‘Neighbourhood and family influences on the cognitive ability of children in the British National Child Development Study’. Social Science and Medicine, 53(5), pp. 579–91
McDonald, S. and Mair, C. (2010) ‘Social capital across the life course: age and gendered patterns of network resources’. Sociological Forum, 25(2), pp. 335–59
MCS Millennium Cohort Study (2008). Available at: www.cls.ioe.ac.uk/page.aspx?&sitesectionid=851&sitesectiontitle=Welcome+to+the+Millennium+Cohort+Study

44Poverty, participation and choice
Menchik, P. and Weisbrod, B. (1987) ‘Volunteer labor supply’. Journal of Public Economics, 32(2), pp. 159–83
Middleton, S., Ashworth, K. and Walker, R., (eds.)(1994) Family fortunes: pressures on parents and children in the 1990s, London: Child Poverty Action Group
Monk-Turner, E. (1989) ‘Effects of high school delinquency on educational attainment and adult occupational status’. Sociological Perspectives, 32(3), pp. 413–8
Montgomerie, T. (2011) Ten observations about the Big Society. 14 February 2011. Available at: http://conservativehome.blogs.com/thetorydiary/2011/02/ten-observations-about-the-bigsociety.html [Accessed 30 March 2011]
Morrow, V. (2001) Networks and neighbourhoods: children and young people’s perspectives. London: Health Development Agency
Muthén, B. (1989) ‘Latent variable modeling in heterogeneous populations’. Psychometrika, 54(4), pp. 557–85
Nummela, O., Sulander, T., Rahkonen, O., Karisto, A. and Uutela, A. (2008) ‘Social participation, trust and self-rated health: a study among ageing people in urban, semi-urban and rural settings’. Health & Place, 14(2), pp. 243–53
Parker, R. (1983) ‘Measuring social participation’. American Sociological Review, 48(6), pp. 864–73
Paxton, P. (1999) ‘Is social capital declining in the United States? A multiple indicator assessment’. American Journal of Sociology, 105(1), pp. 88–127
Piachaud, D. (1981) ‘Peter Townsend and the Holy Grail’. New Society, 10 September, pp. 419–21
Pilgrim, L. and Lawrence, D. (2001) ‘Pester power is a destructive concept’. International Journal of Advertising and Marketing to Children, 3(1), pp. 11–22
Putnam, R. (1995) ‘Tuning in, tuning out: the strange disappearance of social capital in America’. Political Science and Politics, 28(4), pp. 664–83
Putnam, R. (2000) Bowling alone. New York: Simon & Schuster
Putnam, R., Leonardi, R. and Nanetti, R. (1993) Making democracy work: civic traditions in modern Italy. Princeton, New Jersey and Chichester: Princeton University Press
Ridge, T. (2005) ‘Feeling under pressure: low-income girls negotiating school life’. pp. 23–36 in Lloyd, G. (ed.) Problem girls: understanding and supporting troubled and troublesome girls and young women. London: Routledge
Ridge, T. (2007) ‘Negotiating child poverty: children’s subjective experiences of life on a low income’. In Wintersberger, H., Alanen, L., Olk, T. and Qvortrup, J. (eds) Childhood, generational order and the welfare state: exploring children’s social and economic welfare. Odense: University Press of Southern Denmark
Roker, D. (1998) Worth more than this: young people growing up in family poverty Brighton: Trust for the Study of Adolescence
Room, G. (ed.) (1995) Beyond the threshold: the measurement and analysis of social exclusion. Bristol: The Policy Press
Rose, N. (2000) ‘Community, citizenship, and the third way’. American Behavioral Scientist, 43(9), pp. 1395–411
Ross, A., Schoon, I., Martin, P. and Sacker, A. (2009) ‘Family and nonfamily role configurations in two British cohorts’. Journal of Marriage and Family, 71(1), pp. 1–14
Rothstein, B. (2001) ‘Social capital in the social democratic welfare state’. Politics and Society, 29(2), pp. 206–40
Rowntree, B. and Lavers, G. (1951) Poverty and the welfare state. London: Longmans Green
Schor, J. (2004) Born to buy: the commercialized child and the new consumer culture. New York: Scribner
Shropshire, J. and Middleton, S. (1999) Small expectations: learning to be poor. York: Joseph Rowntree Foundation

45References
Simmel, G. (1969) ‘The metropolis and mental life’. In Sennett, R. (ed.) Classic essays on the culture of cities. New York: Appleton-Century-Crofts [1903]
Slater, D. (1997) Consumer culture and modernity. Cambridge: Polity Press
Such, E. and Walker, R. (2002) ‘Falling behind? Research on transmitted deprivation’. Benefits, 10(3), pp. 185–92
Sutton, L., Smith, N., Dearden, C. and Middleton, S. (2007) A child’s-eye view of social difference. York: Joseph Rowntree Foundation
Taket, A., Crisp, B., Nevill, A., Lamaro, G., Graham, M. and Barter-Godfrey, S. (eds) (2009) Theorising social exclusion. London: Routledge
Tanner, J., Davies, S. and O’Grady, B. (1999) ‘What ever happened to yesterday’s rebels? Longitudinal effects of youth delinquency on education and employment’. Social Problems, 46(2), pp. 250–74
Tomlinson, M. (2003) ‘Lifestyle and social class’. European Sociological Review, 19(1), pp. 97–111
Tomlinson, M. and Walker, R. (2009) Coping with complexity: child and adult poverty. London: Child Poverty Action Group
Tomlinson, M. and Walker, R. (2010) ‘Poverty, adolescent well-being and outcomes later in life’. Journal of International Development, 22(8), pp. 1162–82
Tomlinson, M., Walker, R. and Williams, G. (2008) ‘Measuring poverty in Britain as a multi-dimensional concept, 1991–2003’. Journal of Social Policy, 37(4), pp. 597–620
Tönnies, F. (1955) Community and association. Translated and supplemented by C. Loomis. London: Routledge and Kegan Paul [1887]
Townsend, P. (1979) Poverty in the United Kingdom. Harmondsworth: Penguin
Understanding Society (2009) Understanding Society. Available at: www.understandingsociety. org.uk
Van der Hoek, T. (2005) Through children’s eyes: an initial study of children’s personal experiences and coping strategies growing up poor in an affluent Netherlands. Florence: Innocenti Research Centre
Van Oorschot, W. and Arts, W. (2005) ‘The social capital of European welfare states: the crowding out hypothesis revisited’. Journal of European Social Policy, 15(5), pp. 5–26
Veit-Wilson, J. (1986) ‘Paradigms of poverty: a rehabilitation of B. S. Rowntree’. Journal of Social Policy, 15(1), pp. 69–99
Welsh Assembly Government (2009) The Joint Agreement on Child Poverty. Cardiff: Welsh Assembly Government
Warde, A. and Tomlinson, M. (1995) ‘Taste among the middle classes, 1968–88’. In Butler, D. and Savage, M. (eds) Social change and the middle classes. London: UCL Press
Weber, M. (1946) ‘The Protestant sects and the spirit of capitalism’, pp. 301–22 in Gerth, H. and Wright Mills, C. From Max Weber. New York: Oxford University Press [1920]
Weber, M. (1961) ‘Types of social organisation: foundations of modern sociological theory’, pp. 218–29 in Parsons, T., Shils, E., Naegele, K. and Pitts, J. (eds) Theories of society. New York: The Free Press of Glencoe [1922]

46
APPENDIX 1: STATISTICAL METHODSStructural equation modelling
Structural equation modelling (SEM) is a form of analysis that is ideally suited to measuring and investigating complex and multidimensional phenomena such as participation. SEM comprises a family of techniques that treat such phenomena as latent or underlying concepts that are measured indirectly by means of related variables that can be directly observed. One such technique is confirmatory factor analysis (CFA), which is used to measure or test the validity of latent concepts such as participation. A concept such as participation cannot be directly observed in reality. Hence, we use the CFA to measure the level of participation of each individual, starting from 30 items that capture different aspects of this social phenomenon (see Table A1). Our model is a third order CFA (see Figure 1).
A simple first order CFA (see Figures 1 and 5) attempts to measure the underlying concepts of financial situation, material and housing situation, recreational activity, neighbouring, religion and political interest. Financial situation is measured by the observed variables (up to date with bills, regular savings, financial status) using direct answers to survey questions. The latent variables determined by the first order CFA are used to measure the underlying concepts of lack of deprivation, social participation and trust. The third order CFA proposes the comprehensive measurement of participation on the bases of these three dimensions. The participation scores of each individual are subsequently used to test whether there is a breakpoint in the income distribution below which participation declines more than proportionally (see Figure 2a).
In the CFA, the single-headed arrows in the figure represent coefficients or loadings in the model and are usually shown in standardised form so that their relative size can be compared, much like beta coefficients in regression analysis (see Figure 1). There are associated error terms, which are shown as the circles and estimate errors in measurement. The coefficients and covariances are estimated using statistical techniques such as maximum likelihood, and a variety of fit statistics is available to assess the validity of the models constructed (see Figure 1; Jöreskog and Goldberger, 1975; Muthén, 1989; Brown, 2006).
The model fits the data as confirmed by the comparative fit (CFI) and the Tucker-Lewis indices (TLI) that measure the comparative fit in relation to a more restricted model,13 and the root mean square error approximation

47Appendix 1: Statistical methods
(RMSEA) that shows the model has low error approximation (Brown, 2006).14 Furthermore, the three dimensions selected to measure participation co-vary such that a high score on one is likely to be associated with a high score on another (see Figure 1).They also load significantly into the comprehensive dimension of participation This suggests that lack of deprivation impacts positively on social participation and trust, that social participation impacts positively on lack of deprivation and trust, and so forth.
Heteroscedastic regression
Like ordinary least squares regression, heteroscedastic regression generates coefficients that indicate the relative strength and statistical significance of the independent variables in predicting the expected value of the dependents. However, its fundamental benefit is that another equation is simultaneously estimated that explains how the variance of the dependent variable changes with respect to the independent variables. This allows us to explore whether the diversity of participation varies across the income distribution by estimating the variance of the indicators of participation at different income levels.15 Thus, in Chapter 4 we report two equations for each dependent variable: one predicting the expected value and one predicting the variance (see Appendix 5). The fact that the two equations are statistically linked in this analysis means that any bias due to variance varying with income is removed.
To the analysis based on Understanding Society (USoc, 2009), we add an additional regression model based on the Family Spending Survey dataset (FSS, 2010). By using this dataset, we calculate whether people belonging to different income brackets display a different variance in their consumption pattern. Thanks to Understanding Society, we have the possibility of testing empirically whether a family is able to afford a holiday or, for example, possesses a personal computer or a DVD player. However, to investigate in more detail whether a lower income reduces the possibility of making choices, one needs also to look at the quality of the goods and services purchased. In this sense, the dependent variable total consumption included in the Family Spending Survey helps to investigate how much the total consumption varies across British families placed in different income deciles. Despite this important attribute, the Family Spending Survey is limited to material dimensions and does not allow investigation of indicators of social participation and trust, as with Understanding Society. Therefore, by combining these two analyses, we provide a comprehensive evaluation of the variation of participation and consumption of British families belonging to different income brackets.
The current Family Spending Survey is the result of amalgamating the Family Expenditure Survey (FES) and National Food Survey (NFS). Both surveys were well established and important sources of information for government charting changes and patterns in Britons’ spending and food consumption since the 1950s. The survey is primarily used to provide information for the Retail Price Index; National Accounts estimates of household expenditure; the analysis of the effect of taxes and benefits, and trends in nutrition.

48
APPENDIX 2: VARIABLES USED IN ANALYSIS COMPARED WITH THOSE USED BY TOWNSEND (1979)
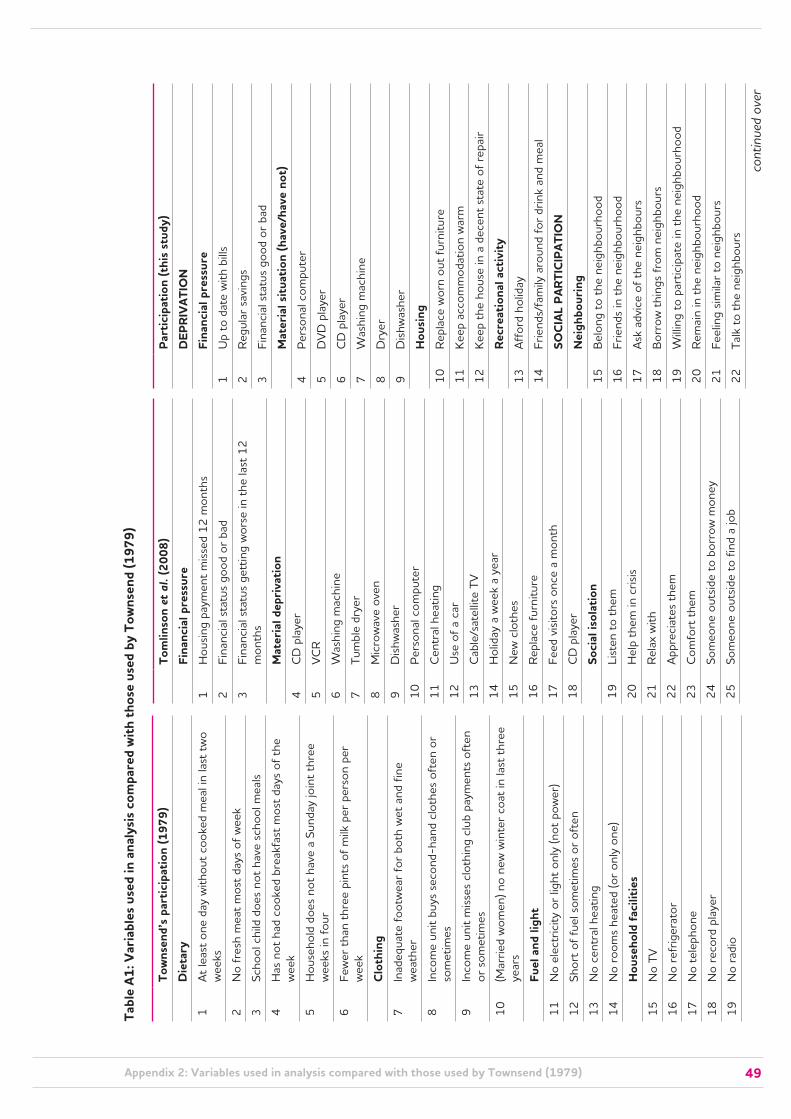
49Appendix 2: Variables used in analysis compared with those used by Townsend (1979)
Tabl
e A1
: Var
iabl
es u
sed
in a
naly
sis
com
pare
d w
ith th
ose
used
by
Tow
nsen
d (1
979)
To
wns
end’
s pa
rtic
ipat
ion
(197
9)
Die
tary
1A
t le
ast
one
day
with
out
cook
ed m
eal i
n la
st t
wo
wee
ks
2N
o fr
esh
mea
t m
ost
days
of
wee
k
3Sc
hool
chi
ld d
oes
not
have
sch
ool m
eals
4H
as n
ot h
ad c
ooke
d br
eakf
ast
mos
t da
ys o
f th
e w
eek
5H
ouse
hold
doe
s no
t ha
ve a
Sun
day
join
t th
ree
wee
ks in
fou
r
6Fe
wer
tha
n th
ree
pint
s of
milk
per
per
son
per
wee
k
Cl
othi
ng7
Inad
equa
te f
ootw
ear
for
both
wet
and
fin
e w
eath
er
8In
com
e un
it bu
ys s
econ
d-ha
nd c
loth
es o
ften
or
som
etim
es
9In
com
e un
it m
isse
s cl
othi
ng c
lub
paym
ents
oft
en
or s
omet
imes
10(M
arrie
d w
omen
) no
new
win
ter
coat
in la
st t
hree
ye
ars
Fu
el a
nd li
ght
11N
o el
ectr
icity
or
light
onl
y (n
ot p
ower
)
12Sh
ort
of f
uel s
omet
imes
or
ofte
n
13N
o ce
ntra
l hea
ting
14N
o ro
oms
heat
ed (o
r on
ly o
ne)
H
ouse
hold
faci
litie
s 15
No
TV
16N
o re
frig
erat
or
17N
o te
leph
one
18N
o re
cord
pla
yer
19N
o ra
dio
Tom
linso
n et
al.
(200
8)Fi
nanc
ial p
ress
ure
1H
ousi
ng p
aym
ent
mis
sed
12 m
onth
s
2Fi
nanc
ial s
tatu
s go
od o
r ba
d
3Fi
nanc
ial s
tatu
s ge
ttin
g w
orse
in t
he la
st 1
2 m
onth
s
Mat
eria
l dep
riva
tion
4C
D p
laye
r
5V
CR
6W
ashi
ng m
achi
ne
7Tu
mbl
e dr
yer
8M
icro
wav
e ov
en
9D
ishw
ashe
r
10P
erso
nal c
ompu
ter
11C
entr
al h
eatin
g
12U
se o
f a
car
13C
able
/sat
ellit
e TV
14H
olid
ay a
wee
k a
year
15N
ew c
loth
es
16R
epla
ce f
urni
ture
17Fe
ed v
isito
rs o
nce
a m
onth
18C
D p
laye
r
Soci
al is
olat
ion
19Li
sten
to
them
20H
elp
them
in c
risis
21R
elax
with
22A
ppre
ciat
es t
hem
23C
omfo
rt t
hem
24So
meo
ne o
utsi
de t
o bo
rrow
mon
ey
25So
meo
ne o
utsi
de t
o fin
d a
job
Part
icip
atio
n (t
his
stud
y)D
EPRI
VAT
ION
Fina
ncia
l pre
ssur
e1
Up
to d
ate
with
bill
s
2R
egul
ar s
avin
gs
3Fi
nanc
ial s
tatu
s go
od o
r ba
d
Mat
eria
l situ
atio
n (h
ave/
have
not
)4
Per
sona
l com
pute
r
5D
VD
pla
yer
6C
D p
laye
r
7 W
ashi
ng m
achi
ne
8D
ryer
9D
ishw
ashe
r
Hou
sing
10R
epla
ce w
orn
out
furn
iture
11Ke
ep a
ccom
mod
atio
n w
arm
12Ke
ep t
he h
ouse
in a
dec
ent
stat
e of
rep
air
Recr
eatio
nal a
ctiv
ity13
Aff
ord
holid
ay
14Fr
iend
s/fa
mily
aro
und
for
drin
k an
d m
eal
SOCI
AL P
ARTI
CIPA
TIO
NN
eigh
bour
ing
15B
elon
g to
the
nei
ghbo
urho
od
16Fr
iend
s in
the
nei
ghbo
urho
od
17A
sk a
dvic
e of
the
nei
ghbo
urs
18B
orro
w t
hing
s fr
om n
eigh
bour
s
19W
illin
g to
par
ticip
ate
in t
he n
eigh
bour
hood
20R
emai
n in
the
nei
ghbo
urho
od
21Fe
elin
g si
mila
r to
nei
ghbo
urs
22Ta
lk t
o th
e ne
ighb
ours
cont
inue
d ov
er

50Poverty, participation and choice
20N
o w
ashi
ng m
achi
ne
21N
o va
cuum
cle
aner
22N
o ca
rpet
23N
o ar
mch
air
H
ousi
ng c
ondi
tions
and
am
eniti
es
24N
o so
le u
se o
f fo
ur a
men
ities
(ind
oor
WC
, sin
k or
w
ashb
asin
, bat
h or
sho
wer
, and
coo
ker)
25St
ruct
ural
def
ects
26St
ruct
ural
def
ects
bel
ieve
d da
nger
ous
to h
ealth
27O
verc
row
ded
(in t
erm
s of
num
ber
of b
edro
oms)
Co
nditi
ons
at w
ork
(sev
erity
, sec
urity
, am
eniti
es
and
wel
fare
ben
efits
)28
Wor
ks m
ainl
y or
ent
irely
out
door
s
29St
ands
or
wal
ks a
t w
ork
all t
he t
ime
30W
orki
ng 5
0 or
mor
e ho
urs
last
wee
k
31A
t w
ork
befo
re 8
am o
r w
orki
ng a
t ni
ght
32P
oor
outd
oor
amen
ities
of
wor
k
33P
oor
indo
or a
men
ities
of
wor
k
34U
nem
ploy
ed f
or 2
wee
ks o
r m
ore
durin
g pr
evio
us
12 m
onth
s
35Su
bjec
t to
1 w
eek’
s en
title
men
t to
not
ice
or le
ss
36N
o w
ages
or
sala
ry d
urin
g si
ckne
ss
37P
aid
holid
ays
of t
wo
wee
ks o
r le
ss
38N
o m
eals
pai
d or
sub
sidi
sed
by e
mpl
oyer
39N
o en
title
men
t to
occ
upat
iona
l pen
sion
H
ealth
40H
ealth
poo
r or
fai
r
41Si
ck f
rom
wor
k 5
or m
ore
wee
ks la
st y
ear
42Ill
in b
ed 1
4 da
ys o
r m
ore
last
yea
r
43H
as d
isab
ility
con
ditio
n
44H
as s
ome
or s
ever
e di
sabi
lity
Tabl
e A1
: con
tinue
d
26So
meo
ne o
utsi
de t
o he
lp w
ith d
epre
ssio
n
Civi
c27
Mem
bers
hip
in a
ssoc
iatio
ns
28P
artic
ipat
ion
in a
ssoc
iatio
ns
Psyc
holo
gica
l str
ain
(GH
Q)
a. L
ow c
onfid
ence
29Lo
sing
con
fiden
ce
30B
elie
ve in
sel
f-w
orth
b. S
ocia
l dys
func
tion
31C
once
ntra
tion
32P
layi
ng a
use
ful r
ole
33C
apab
le o
f m
akin
g de
cisi
ons
34En
joy
day
to d
ay a
ctiv
ities
35A
bilit
y to
fac
e pr
oble
ms
c. A
nxie
ty d
epre
ssio
n36
Loss
of
slee
p
37C
onst
antly
und
er s
trai
n
38P
robl
em o
verc
omin
g di
ffic
ultie
s
39U
nhap
py o
r de
pres
sed
Envi
ronm
ent
40H
ouse
– b
ad li
ght
41H
ouse
bad
– h
eatin
g
42H
ouse
– le
aks
43H
ouse
– r
ottin
g w
ood
44H
ouse
– d
ump
45N
oise
fro
m n
eigh
bour
s
46N
oise
fro
m t
he s
tree
t
47C
rime
leve
ls
48La
ck o
f sp
ace
49Li
ke t
he a
rea
Relig
ion
23W
heth
er b
elon
g to
a r
elig
ion
24Im
port
ance
of
relig
ion
25A
tten
danc
e at
rel
igio
us s
ervi
ces
Polit
ical
inte
rest
26H
ave
a pa
rty
27In
tere
st in
pol
itics
28St
reng
th o
f su
ppor
t fo
r a
part
y
TRU
ST29
Gen
eral
tru
st
30Tr
ust
stra
nger
31Ta
ke r
isks
with
str
ange
rs
cont
inue
d ov
er

51Appendix 2: Variables used in analysis compared with those used by Townsend (1979)
Ed
ucat
iona
l 45
Few
er t
han
10 y
ears
En
viro
nmen
tal
46N
o ga
rden
or
yard
, or
shar
ed
47If
gard
en, t
oo s
mal
l to
sit
in
48A
ir di
rty
or f
oul s
mel
ling
49N
o sa
fe p
lace
for
chi
ld (1
–4)
to
play
50N
o sa
fe p
lace
for
chi
ld (5
–10
) to
play
Fa
mily
51D
iffic
ultie
s in
door
s fo
r ch
ild t
o pl
ay
52C
hild
not
had
frie
nd in
to
play
in la
st 4
wee
ks
53H
ouse
hold
spe
nt le
ss t
han
addi
tiona
l £10
last
C
hris
tmas
Re
crea
tiona
l 54
No
afte
rnoo
ns o
r ev
enin
gs o
ut in
last
2 w
eeks
55N
o ho
liday
in la
st t
wel
ve m
onth
s aw
ay f
rom
hom
e
So
cial
56
No
emer
genc
y he
lp a
vaila
ble,
e.g
. illn
ess
57N
o on
e co
min
g to
mea
l or
snac
k in
last
4 w
eeks
58N
ot b
een
out
to m
eal o
r sn
ack
with
rel
ativ
es o
r fr
iend
s in
last
4 w
eeks
59M
oved
hou
se a
t le
ast
twic
e in
last
2 y
ears
Tabl
e A1
: con
tinue
d
50W
ould
like
to
mov
e aw
ay

52
APPENDIX 3: DIMENSIONS OF PARTICIPATION AND THEIR SOCIO-ECONOMIC CORRELATES

53Appendix 3: Dimensions of participation and their socio-economic correlates
Tabl
e A2
: Dim
ensi
ons
of p
artic
ipat
ion
and
thei
r so
cio-
econ
omic
cor
rela
tes:
reg
ress
ion
coef
ficie
nts
Soci
o-ec
onom
ic
char
acte
rist
ics
Dep
riva
tion
Soci
al p
artic
ipat
ion
Trus
tPa
rtic
ipat
ion
BSi
g.SE
TB
Sig.
SET
BSi
g.SE
TB
Sig
SET
Cons
tant
.416
***p
<0.0
1.0
1139
.487
.057
***p
<0.0
1–
.004
14.3
05.1
63**
*p<0
.01
.010
15.8
42.1
33**
*p<0
.01
.004
33.6
85
Net
inco
me
(top
dec
ile o
mitt
ed)
Inco
me
1–
.379
***p
<0.0
1.0
09–
40.3
21–
.058
***p
<0.0
1.0
04–
16.3
91–
.077
***p
<0.0
1.0
09–
8.41
7–
.114
***p
<0.0
1.0
04–
32.2
89
Inco
me
2–
.440
***p
<0.0
1.0
09–
48.2
40–
.068
***p
<0.0
1.0
03–
19.6
52–
.083
***p
<0.0
1.0
09–
9.35
7–
.131
***p
<0.0
1.0
03–
38.3
83
Inco
me
3–
.441
***p
<0.0
1.0
09–
49.1
68–
.076
***p
<0.0
1.0
03–
22.4
02–
.093
***p
<0.0
1.0
09–
10.6
66–
.136
***p
<0.0
1.0
03–
40.6
08
Inco
me
4–
.408
***p
<0.0
1.0
09–
46.4
62–
.065
***p
<0.0
1.0
03–
19.4
76–
.085
***p
<0.0
1.0
09–
9.88
3–
.123
***p
<0.0
1.0
03–
37.5
41
Inco
me
5–
.363
***p
<0.0
1.0
09–
41.9
01–
.061
***p
<0.0
1.0
03–
18.6
63–
.075
***p
<0.0
1.0
08–
8.89
1–
.111
***p
<0.0
1.0
03–
34.3
38
Inco
me
6–
.299
***p
<0.0
1.0
09–
35.0
48–
.053
***p
<0.0
1.0
03–
16.5
33–
.067
***p
<0.0
1.0
08–
8.02
0–
.094
***p
<0.0
1.0
03–
29.3
57
Inco
me
7–
.256
***p
<0.0
1.0
08–
30.2
10–
.048
***p
<0.0
1.0
03–
15.1
52–
.056
***p
<0.0
1.0
08–
6.80
4–
.081
***p
<0.0
1.0
03–
25.6
66
Inco
me
8–
.182
***p
<0.0
1.0
08–
21.8
77–
.038
***p
<0.0
1.0
03–
12.1
57–
.057
***p
<0.0
1.0
08–
7.03
6–
.062
***p
<0.0
1.0
03–
19.9
08
Inco
me
9–
.120
***p
<0.0
1.0
08–
14.5
34–
.021
***p
<0.0
1.0
03–
6.87
0–
.020
**p<
0.05
.008
–2.
515
–.0
37**
*p<0
.01
.003
–11
.877
Empl
oym
ent
stat
us (f
ull t
ime
omitt
ed)
Self-
empl
oyed
.026
***p
<0.0
1.0
083.
381
.035
***p
<0.0
1.0
0311
.854
.076
***p
<0.0
1.0
089.
997
.032
***p
<0.0
1.0
0310
.886
Une
mpl
oyed
–.2
67**
*p<0
.01
.008
–31
.824
–.0
50**
*p<0
.01
.003
–15
.700
–.0
05ns
.008
–.6
56–
.077
***p
<0.0
1.0
03–
24.4
81
Ret
ired
.069
***p
<0.0
1.0
088.
822
.062
***p
<0.0
1.0
0320
.965
–.0
50**
*p<0
.01
.008
–6.
573
.034
***p
<0.0
1.0
0311
.704
Fam
ily–
.087
***p
<0.0
1.0
08–
10.4
34–
.004
ns.0
03–
1.28
9–
.032
***p
<0.0
1.0
08–
3.89
9–
.024
***p
<0.0
1.0
03–
7.67
5
Stud
ent
–.0
09ns
.008
–1.
130
–.0
34**
*p<0
.01
.003
–11
.202
.066
***p
<0.0
1.0
088.
275
–.0
08**
p<0.
05.0
03–
2.53
5
Sick
–.2
97**
*p<0
.01
.011
–27
.445
–.0
23**
*p<0
.01
.004
–5.
553
–.1
30**
*p<0
.01
.011
–12
.303
–.0
89**
*p<0
.01
.004
–21
.929
Oth
er s
tatu
s–
.103
***p
<0.0
1.0
15–
6.91
0–
.027
***p
<0.0
1.0
06–
4.75
6–
.019
ns.0
15–
1.28
7–
.036
***p
<0.0
1.0
06–
6.35
1
Educ
atio
n (p
ostg
radu
ate
omitt
ed)
Low
er e
duca
tion
–.2
17**
*p<0
.01
.008
–27
.007
–.0
70**
*p<0
.01
.003
–23
.085
–.2
25**
*p<0
.01
.008
–28
.636
–.1
07**
*p<0
.01
.003
–35
.670
GC
SE a
nd e
quiv
alen
ts–
.148
***p
<0.0
1.0
08–
19.2
98–
.058
***p
<0.0
1.0
03–
20.0
56–
.157
***p
<0.0
1.0
08–
20.8
97–
.078
***p
<0.0
1.0
03–
27.2
47
A-l
evel
and
equ
ival
ents
–.1
04**
*p<0
.01
.008
–12
.289
–.0
36**
*p<0
.01
.003
–11
.391
–.1
04**
*p<0
.01
.008
–12
.542
–.0
52**
*p<0
.01
.003
–16
.446
Nur
sing
, tea
chin
g qu
alifi
catio
n–
.101
***p
<0.0
1.0
09–
11.3
72–
.018
***p
<0.0
1.0
03–
5.25
6–
.086
***p
<0.0
1.0
09–
9.84
7–
.041
***p
<0.0
1.0
03–
12.1
91
Firs
t de
gree
leve
l–
.032
***p
<0.0
1.0
08–
3.82
8–
.001
ns.0
03–
.447
–.0
18**
p<0
.05
.008
–2.
273
–.0
10**
*p<0
.01
.003
–3.
119
Fam
ily t
ype
(cou
ple
with
out
child
ren
omitt
ed)
Sing
le p
ensi
oner
–.0
51**
*p<0
.01
.011
–4.
646
.058
***p
<0.0
1.0
0414
.186
.046
***p
<0.0
1.0
114.
317
.022
***p
<0.0
1.0
045.
467
Cou
ple
pens
ione
r.1
21**
*p<0
.01
.009
13.5
49.0
80**
*p<0
.01
.003
23.6
00.0
29**
*p<0
.01
.009
3.28
5.0
64**
*p<0
.01
.003
19.1
31
cont
inue
d ov
er

54Poverty, participation and choice
Sing
le n
o pe
nsio
n–
.160
***p
<0.0
1.0
08–
19.2
04–
.015
***p
<0.0
1.0
03–
4.72
2.0
38**
*p<0
.01
.008
4.66
5–
.034
***p
<0.0
1.0
03–
10.7
46
Lone
par
ent
–.2
77**
*p<0
.01
.010
–27
.895
–.0
33**
*p<0
.01
.004
–8.
864
–.0
08ns
.010
–.8
69–
.072
***p
<0.0
1.0
04–
19.3
68
Cou
ple
child
ren
–.0
44**
*p<0
.01
.007
–6.
664
.011
***p
<0.0
1.0
024.
636
–.0
05ns
.006
–.8
44–
.005
*p<0
.1.0
02–
1.83
9
Oth
er c
hild
ren
–.0
68**
*p<0
.01
.008
–8.
443
.003
ns.0
031.
121
.017
**p<
0.05
.008
2.12
6–
.010
***p
<0.0
1.0
03–
3.25
9
Oth
er n
o ch
ildre
n–
.037
***p
<0.0
1.0
07–
5.33
8.0
03ns
.003
1.24
5.0
25**
*p<0
.01
.007
3.63
2–
.003
ns.0
03–
.963
Mal
e (fe
mal
e om
itted
).0
00ns
.004
–.0
69.0
01ns
.002
.583
.049
***p
<0.0
1.0
0412
.400
.007
***p
<0.0
1.0
024.
869
Ethn
icity
(whi
te o
mitt
ed)
Mix
ed r
ace
–.0
92**
*p<0
.01
.015
–6.
136
.012
**p<
0.05
.006
2.15
9.0
28*p
<0.1
.015
1.93
0–
.009
ns.0
06–
1.62
1
Indi
an–
.003
ns.0
11–
.315
.070
***p
<0.0
1.0
0417
.277
–.0
76**
*p<0
.01
.011
–7.
172
.020
***p
<0.0
1.0
044.
889
Pak
ista
ni–
.075
***p
<0.0
1.0
13–
5.76
1.1
11**
*p<0
.01
.005
22.6
09–
.029
**p<
0.05
.013
–2.
258
.030
***p
<0.0
1.0
056.
177
Ban
glad
eshi
–.1
33**
*p<0
.01
.016
–8.
341
.112
***p
<0.0
1.0
0618
.703
–.0
37**
p<0.
05.0
16–
2.37
0.0
18**
*p<0
.01
.006
2.99
7
Bla
ck C
arib
bean
–.1
58**
*p<0
.01
.014
–11
.646
.039
***p
<0.0
1.0
057.
551
–.0
48**
*p<0
.01
.013
–3.
645
–.0
22**
*p<0
.01
.005
–4.
275
Bla
ck A
fric
an–
.252
***p
<0.0
1.0
13–
19.2
38.1
02**
*p<0
.01
.005
20.6
40–
.020
ns.0
13–
1.60
3–
.008
*p<0
.1.0
05–
1.73
5
Oth
ers
–.1
18**
*p<0
.01
.011
–10
.678
.020
***p
<0.0
1.0
044.
901
.005
ns.0
11.5
05–
.014
***p
<0.0
1.0
04–
3.38
4
Regi
on (G
reat
er L
ondo
n om
itted
)
Nor
th E
ast
.018
ns.0
111.
645
-.01
5**
*p<0
.01
.004
-3.6
59–
.018
*p<0
.1.0
11-1
.677
–.0
06ns
.004
–1.
378
Nor
th W
est
.035
***p
<0.0
1.0
084.
240
.009
***p
<0.0
1.0
033.
005
.007
ns.0
08.9
33.0
12**
*p<0
.01
.003
3.98
9
York
shire
and
the
Hum
ber
.033
***p
<0.0
1.0
093.
708
.002
ns.0
03.6
23–
.005
ns.0
09–
.542
.007
**p<
0.05
.003
2.07
7
East
Mid
land
s.0
34**
*p<0
.01
.009
3.81
1–
.009
***p
<0.0
1.0
03–
2.73
3–
.007
ns.0
09–
.746
.002
ns.0
03.5
56
Wes
t M
idla
nds
.026
***p
<0.0
1.0
092.
965
–.0
04ns
.003
–1.
169
–.0
07ns
.008
–.8
65.0
02ns
.003
.753
East
of
Engl
and
.047
***p
<0.0
1.0
095.
430
–.0
01ns
.003
–.2
69.0
09ns
.008
1.12
3.0
10**
*p<0
.01
.003
3.23
2
Sout
h Ea
st.0
22**
*p<0
.01
.008
2.79
4.0
01ns
.003
.284
.017
**p<
0.05
.008
2.19
9.0
07**
p<0.
05.0
032.
461
Sout
h W
est
.022
**p<
0.05
.009
2.43
0–
.001
ns.0
03–
.401
.023
***p
<0.0
1.0
092.
594
.007
**p<
0.05
.003
2.10
3
Wal
es.0
09ns
.011
.855
–.0
01ns
.004
–.1
42–
.014
ns.0
10–
1.33
2.0
00ns
.004
–.1
01
Scot
land
.048
***p
<0.0
1.0
095.
221
.006
ns.0
031.
624
.008
ns.0
09.9
32.0
13**
*p<0
.01
.003
3.90
1
Nor
ther
n Ire
land
.116
***p
<0.0
1.0
1110
.428
.059
***p
<0.0
1.0
0414
.032
.006
ns.0
11.5
41.0
51**
*p<0
.01
.004
12.1
27
Con
stan
t.4
16**
*p<0
.01
.011
39.4
87.0
57**
*p<0
.01
.004
14.3
05.0
163
***p
<0.0
1.0
1015
.842
.133
***p
<0.0
1.0
0433
.685
Num
ber
of o
bser
vatio
ns40
,407
40,4
0740
,407
40,4
07
R20.
323
0.19
50.
083
0.27
3
Tabl
e A2
: con
tinue
d

55Appendix 3: Dimensions of participation and their socio-economic correlates
Table A3: Dimensions of participation and their socio-economic correlates: standardised coefficients
Socio-economic characteristics
Deprivation Social part. Trust ParticipationBeta Sig. Beta Sig. Beta Sig. Beta Sig.
Net income (top decile omitted) Income 1 –.226 ***p<0.01 –.100 ***p<0.01 –.055 ***p<0.01 –.188 ***p<0.01
Income 2 –.277 ***p<0.01 –.123 ***p<0.01 –.063 ***p<0.01 –.228 ***p<0.01
Income 3 –.283 ***p<0.01 –.141 ***p<0.01 –.071 ***p<0.01 –.242 ***p<0.01
Income 4 –.265 ***p<0.01 –.121 ***p<0.01 –.065 ***p<0.01 –.222 ***p<0.01
Income 5 –.237 ***p<0.01 –.115 ***p<0.01 –.059 ***p<0.01 –.201 ***p<0.01
Income 6 –.197 ***p<0.01 –.102 ***p<0.01 –.053 ***p<0.01 –.171 ***p<0.01
Income 7 –.168 ***p<0.01 –.092 ***p<0.01 –.044 ***p<0.01 –.148 ***p<0.01
Income 8 –.121 ***p<0.01 –.074 ***p<0.01 –.045 ***p<0.01 –.115 ***p<0.01
Income 9 –.080 ***p<0.01 –.041 ***p<0.01 –.016 **p<0.05 –.068 ***p<0.01
Employment status (full time omitted)Self-employed .014 ***p<0.01 .055 ***p<0.01 .050 ***p<0.01 .048 ***p<0.01
Unemployed –.142 ***p<0.01 –.077 ***p<0.01 –.003 ns –.113 ***p<0.01
Retired .060 ***p<0.01 .157 ***p<0.01 –.052 ***p<0.01 .083 ***p<0.01
Family –.048 ***p<0.01 –.006 ns –.021 ***p<0.01 –.036 ***p<0.01
Student –.005 ns –.056 ***p<0.01 .044 ***p<0.01 –.012 **p<0.05
Sick –.119 ***p<0.01 –.026 ***p<0.01 –.062 ***p<0.01 –.098 ***p<0.01
Other status –.029 ***p<0.01 –.022 ***p<0.01 –.006 ns –.027 ***p<0.01
Education (postgraduate omitted)Lower education –.206 ***p<0.01 –.192 ***p<0.01 –.255 ***p<0.01 –.282 ***p<0.01
GCSE and equivalents -.144 ***p<0.01 –.163 ***p<0.01 –.181 ***p<0.01 –.211 ***p<0.01
A-level and equivalents –.077 ***p<0.01 –.078 ***p<0.01 –.092 ***p<0.01 –.107 ***p<0.01
Nursing, teaching qualification –.066 ***p<0.01 –.033 ***p<0.01 –.066 ***p<0.01 –.073 ***p<0.01
First degree level –.023 ***p<0.01 –.003 ns –.016 **p<0.05 –.020 ***p<0.01
Family type (couple without children omitted)Single pensioner –.028 ***p<0.01 .093 ***p<0.01 .030 ***p<0.01 .034 ***p<0.01
Couple pensioner .092 ***p<0.01 .175 ***p<0.01 .026 ***p<0.01 .135 ***p<0.01
Single no pension –096 ***p<0.01 –.026 ***p<0.01 .027 ***p<0.01 –.056 ***p<0.01
Lone parent –.138 ***p<0.01 –.048 ***p<0.01 –.005 ns –.099 ***p<0.01
Couple children –.040 ***p<0.01 .030 ***p<0.01 –.006 ns –.011 *p<0.1
Other children –.045 ***p<0.01 .007 ns .013 **p<0.05 –.018 ***p<0.01
Other no children –.030 ***p<0.01 .008 ns .024 ***p<0.01 –.006 ns
Men (women omitted) .000 ns .003 ns .062 ***p<0.01 .022 ***p<0.01
Ethnicity (white omitted)Mixed race –.026 ***p<0.01 .010 **p<0.05 .009 *p<0.1 –.007 ns
Indian –.001 ns .081 ***p<0.01 –.036 ***p<0.01 .022 ***p<0.01
Pakistani –.025 ***p<0.01 .105 ***p<0.01 –.011 **p<0.05 .027 ***p<0.01
Bangladeshi –.036 ***p<0.01 .088 ***p<0.01 –.012 **p<0.05 .013 ***p<0.01
Black Caribbean –.050 ***p<0.01 .035 ***p<0.01 –.018 **p<0.01 –.019 ***p<0.01
Black African –.083 ***p<0.01 .098 ***p<0.01 –.008 ns –.008 *p<0.1
Others –.046 ***p<0.01 .023 ***p<0.01 .003 ns –.015 ***p<0.01
Region (Greater London omitted) North East .008 ns –.019 ***p<0.01 –.009 *p<0.1 –.007 ns
continued over

56Poverty, participation and choice
North West .024 ***p<0.01 .018 ***p<0.01 .006 ns .023 ***p<0.01
Yorkshire and the Humber .020 ***p<0.01 .004 ns –.003 ns .011 **p<0.05
East Midlands .020 ***p<0.01 –.016 ***p<0.01 –.005 ns .003 ns
West Midlands .016 ***p<0.01 –.007 ns –.005 ns .004 ns
East of England .029 ***p<0.01 –.002 ns .007 ns .018 ***p<0.01
South East .016 ***p<0.01 .002 ns .015 **p<0.05 .015 **p<0.05
South West .013 **p<0.05 –.002 ns .016 ***p<0.01 .012 **p<0.05
Wales .004 ns –.001 ns –.008 ns –.001 ns
Scotland .028 ***p<0.01 .009 ns .006 ns .021 ***p<0.01
Northern Ireland .050 ***p<0.01 .074 ***p<0.01 .003 ns .061 ***p<0.01
Number of observations 40,407 40,407 40,407 40,407
R2 0.323 0.195 0.083 0.273
Table A3: continued

57
APPENDIX 4: THE PARTICIPATION OF ETHNIC GROUPS: REGRESSIONS AND BETA COEFFICIENTS

58Poverty, participation and choice
Soci
o-ec
onom
ic
char
acte
rist
ics
Whi
teM
ixed
Indi
anPa
kist
ani
Bang
lade
shi
Cari
bbea
nAf
rica
nO
ther
Beta
Sig.
Beta
Sig.
Beta
Sig.
Beta
Sig.
Beta
Sig.
Beta
Sig.
Beta
Sig.
Beta
Sig.
Net
inco
me
(top
dec
ile o
mitt
ed)
Inco
me
1–
.166
***p
<0.0
1–
176
***p
<0.0
1–
.261
***p
<0.0
1–
.330
***p
<0.0
1–
.276
***p
<0.0
1–
.127
***p
<0.0
1–
.233
***p
<0.0
1–
.297
***p
<0.0
1
Inco
me
2–
.219
***p
<0.0
1–
196
***p
<0.0
1–
.249
***p
<0.0
1–
.301
***p
<0.0
1–
.319
***p
<0.0
1–
.227
***p
<0.0
1–
.164
***p
<0.0
1–
.278
***p
<0.0
1
Inco
me
3–
.235
***p
<0.0
1–
.201
***p
<0.0
1–
.179
***p
<0.0
1–
.249
***p
<0.0
1–
.250
***p
<0.0
1–
.248
***p
<0.0
1–
.287
***p
<0.0
1–
.281
***p
<0.0
1
Inco
me
4–
.221
***p
<0.0
1–
.249
***p
<0.0
1–
.201
***p
<0.0
1–
.204
***p
<0.0
1–
.148
ns–
.187
***p
<0.0
1–
.151
***p
<0.0
1–
.210
***p
<0.0
1
Inco
me
5–
.203
***p
<0.0
1–
.178
***p
<0.0
1–
.165
***p
<0.0
1–
.187
***p
<0.0
1–
.199
**p<
0.05
–.1
41**
*p<0
.01
–.1
15**
p<0.
05–
.194
ns
Inco
me
6–
.171
***p
<0.0
1–
.112
**p<
0.05
–.1
22**
*p<0
.01
–.0
83*p
<0.1
–.2
60**
*p<0
.01
–.1
47**
*p<0
.01
–.1
90**
*p<0
.01
–.1
77**
*p<0
.01
Inco
me
7–
.153
***p
<0.0
1–
.072
ns–
.113
***p
<0.0
1.0
00ns
–.1
37*p
<0.1
–.0
71ns
–.0
68*p
<0.1
–.1
70*p
<0.1
Inco
me
8–
.117
***p
<0.0
1–
.092
**p<
0.05
–.0
83**
p<0.
5–
.064
ns–
.164
***p
<0.0
1–
.064
ns–
.028
ns–
.140
ns
Inco
me
9–
.068
***p
<0.0
1–
.002
ns–
.095
***p
<0.0
1–
.033
ns–
.161
***p
<0.0
1–
.049
ns–
.014
ns–
.101
***p
<0.0
1
Empl
oym
ent
stat
us (f
ull t
ime
omitt
ed)
Self-
empl
oyed
.049
***p
<0.0
1.0
52ns
.028
ns.0
74**
p<0.
05.0
49ns
.083
**p<
0.05
.009
ns.0
05ns
Une
mpl
oyed
–.1
20**
*p<0
.01
–.1
35**
*p<0
.01
–.0
41ns
–.0
79**
p<0.
05–
.028
ns–
.136
***p
<0.0
1–
.084
**p<
0.05
–.1
32ns
Ret
ired
.085
***p
<0.0
1–
.018
ns.0
44ns
.008
ns.0
08ns
.105
*p<0
.1–
.018
ns.0
90ns
Fam
ily–
.032
***p
<0.0
1–
.047
ns–
.005
ns–
.073
*p<0
.1–
.043
ns–
.005
ns–
.127
***p
<0.0
1–
.055
ns
Stud
ent
–.0
14**
*p<0
.01
.007
ns.0
25ns
–.0
71**
p<0.
05.0
83*p
<0.1
.043
ns–
.005
ns–
.044
*p<0
.1
Sick
–.1
01**
*p<0
.01
–.1
14**
*p<0
.01
–.0
36ns
–.1
46**
*p<0
.01
–.0
02ns
–.1
58**
*p<0
.01
–.0
68**
p<0.
05–
.048
*p<0
.1
Oth
er s
tatu
s–
.027
***p
<0.0
1–
.022
ns–
.032
ns–
.060
*p<0
.1.0
51ns
–.0
57*p
<0.1
–.0
22ns
–.0
46ns
Educ
atio
n (p
ostg
radu
ate
omitt
ed)
Low
er e
duca
tion
–.3
03**
*p<0
.01
–.2
39**
*p<0
.01
–.1
22**
*p<0
.01
–.1
25**
*p<0
.01
–.2
26**
*p<0
.01
–.3
08**
*p<0
.01
–.1
79**
*p<0
.01
–.2
41**
*p<0
.01
GC
SE a
nd e
quiv
alen
ts–
.226
***p
<0.0
1–
.296
***p
<0.0
1–
.108
***p
<0.0
1–
.097
**p<
0.05
–.1
58**
p<0.
05–
.241
***p
<0.0
1–
.182
***p
<0.0
1–
.142
ns
A-l
evel
and
equ
ival
ents
–.1
12**
*p<0
.01
–.1
16**
p<0.
05–
.110
***p
<0.0
1–
.143
***p
<0.0
1–
.115
*p<0
.1–
.141
***p
<0.0
1–
.181
***p
<0.0
1–
.085
***p
<0.0
1
Nur
sing
, tea
chin
g qu
alifi
catio
n–
.078
***p
<0.0
1–
.133
***p
<0.0
1–
.099
***p
<0.0
1–
.103
***p
<0.0
1–
.046
ns–
.149
***p
<0.0
1–
.115
***p
<0.0
1–
.008
***p
<0.0
1
Firs
t de
gree
leve
l–
.022
***p
<0.0
1–
.054
ns–
.009
ns–
.111
***p
<0.0
1.0
07ns
–.0
30ns
–.0
71*p
<0.1
–.0
32ns
Fam
ily t
ype
(cou
ple
with
chi
ldre
n om
itted
)
Sing
le p
ensi
oner
.037
***p
<0.0
1.0
54ns
.009
ns–
.047
ns.0
41ns
–.0
26ns
–.0
02ns
.019
*p<0
.1
Cou
ple
pens
ione
r.1
43**
*p<0
.01
.105
**p<
0.05
.055
ns.0
25ns
.073
ns–
.028
ns.0
26ns
.042
ns
Sing
le n
o pe
nsio
n–
.055
***p
<0.0
1–
.082
*p<0
.1–
.068
**p<
0.05
–.0
95**
p<0.
05–
.053
ns–
.074
ns–
.047
ns.0
01ns
Tabl
e A4
: The
par
ticip
atio
n of
eth
nic
grou
ps: r
egre
ssio
ns a
nd b
eta
coef
ficie
nts
cont
inue
d ov
er

59Appendix 4: The participation of ethnic groups: regressions and beta coefficients
Lone
par
ent
–.0
98**
*p<0
.01
–.1
98**
*p<0
.01
–.0
77**
*p<0
.01
–.2
14**
*p<0
.01
–.0
64ns
–.0
97*p
<0.1
–.1
04**
p<0.
05–
.040
ns
Cou
ple
child
ren
–.0
11ns
.037
ns.0
12ns
–.2
30**
*p<0
.01
–.0
83ns
–.0
14ns
.085
ns.0
78ns
Oth
er c
hild
ren
–.0
29**
*p<0
.01
–.0
60ns
.001
ns.0
29ns
.068
ns–
.056
ns–
.042
ns.0
54*p
<0.1
Oth
er n
o ch
ildre
n–
.008
ns–
.082
*p<0
.1.0
04ns
.014
ns.1
71**
p<0.
05–
.062
ns.0
64ns
.066
***p
<0.0
1
Mal
e (f
emal
e om
itted
).0
18**
*p<0
.01
.004
ns.0
72**
*p<0
.01
.054
ns.0
99**
p<0.
05.0
63*p
<0.1
.072
**p<
0.05
.049
***p
<0.0
1
Regi
on (G
reat
er L
ondo
n om
itted
)
Nor
th E
ast
–.0
01ns
–.0
17ns
–.0
11ns
–.0
66**
p<0.
05.0
59ns
.031
ns–
.010
ns.0
09*p
<0.1
Nor
th W
est
.033
***p
<0.0
1.0
05ns
.010
ns–
.006
ns.0
39ns
.018
ns–
.054
*p<0
.1.0
02ns
York
shire
and
the
Hum
ber
.021
***p
<0.0
1–
.010
ns.0
03ns
–.0
06ns
.030
ns.0
01ns
.001
ns–
.032
*p<0
.1
East
Mid
land
s.0
10ns
.004
ns–
.048
*p<0
.1.0
47ns
.078
**p<
0.05
.036
ns.0
15ns
–.0
36*p
<0.1
Wes
t M
idla
nds
.015
**p<
0.05
–.0
67*p
<0.1
–.0
84**
*p<0
.01
.006
ns–
.003
ns–
.046
ns–
.051
*p<0
.1.0
06**
*p<0
.01
East
of
Engl
and
.026
***p
<0.0
1–
.012
ns.0
41ns
.043
ns–
.014
ns–
.036
ns.0
43ns
.019
***p
<0.0
1
Sout
h Ea
st.0
21**
*p<0
.01
–.0
11ns
.013
ns.0
23ns
.018
ns.0
12ns
.018
ns.0
43ns
Sout
h W
est
.019
***p
<0.0
1–
.017
ns.0
13ns
.036
ns.0
57ns
.013
ns–
.007
ns.0
08ns
Wal
es.0
04ns
–.0
40ns
.025
ns–
.013
ns.0
30ns
.004
ns.0
67**
p<0.
05.0
14**
p<0.
05
Scot
land
.030
***p
<0.0
1.0
06ns
–.0
13ns
.032
ns–
.048
*p<0
.1.0
48ns
Nor
ther
n Ire
land
.071
***p
<0.0
1.0
00ns
–.0
12ns
–.0
20ns
.076
***p
<0.0
1.0
46**
p<0.
05
Num
ber
of o
bser
vatio
ns33
,555
636
1,36
390
360
684
393
41,
291
R20.
308
0.36
70.
222
0.21
50.
207
0.25
60.
248
0.33
6
Tabl
e A4
: con
tinue
d
Sour
ce: U
nder
stan
ding
Soc
iety
, Wav
e 1
(USo
c, 2
009)

60
APPENDIX 5: CHOICE OF PARTICIPATION: RESULTS FROM HETEROSCEDASTIC REGRESSION OF ETHNIC GROUPS; BETA COEFFICIENTS

61Appendix 5: Choice of participation: results from heteroscedastic regression of ethnic groups; beta coefficients
Tabl
e A5
: Het
eros
ceda
stic
reg
ress
ion,
dim
ensi
ons
of p
artic
ipat
ion
from
soc
io-e
cono
mic
cha
ract
eris
tics
(mea
n)
Soci
o-ec
onom
ic
char
acte
rist
ics
Dep
riva
tion
T R
Soci
al p
art.
TR
Trus
tT
RPa
rtic
ipat
ion
TR
Mea
n (S
D)
Net
inco
me
(top
dec
ile
omitt
ed) )
14
31
4.67
9 (2
.835
)
Inco
me
1–
0.42
5***
(0.0
09)
–45
.27
–0.
046*
** (0
.003
) –
13.2
5–
0.07
8***
(0.0
09)
–8.
63–
0.11
9***
(0.0
03)
–34
.42
Inco
me
2–
0.48
6***
(0.0
09)
–55
.74
–0.
055*
** (0
.003
)–
16.2
9–
0.08
7***
(0.0
09)
–10
.02
–0.
137*
** (0
.003
)–
41.3
5
Inco
me
3–
0.47
5***
(0.0
09)
–55
.23
–0.
067*
** (0
.003
)–
20.1
9–
0.09
9***
(0.0
09)
–11
.51
–0.
141*
** (0
.003
)–
43.5
2
Inco
me
4–
0.43
7***
(0.0
08)
–52
/08
–0.
057*
** (0
.003
)–
17.8
5–
0.08
8***
(0.0
08)
–10
.49
–0.
127*
** (0
.003
)–
40.2
5
Inco
me
5–
0.38
6***
(0.0
08)
–46
.35
–0.
054*
** (0
.003
)–
17.1
0–
0.07
9***
(0.0
08)
–9.
69–
0.11
4***
(0.0
03)
–36
.81
Inco
me
6–
0.31
7***
(0.0
08)
–38
.80
–0.
048*
** (0
.003
)–
15.4
3–
0.06
7***
(0.0
08)
–8.
37–
0.09
6***
(0.0
03)
–31
.34
Inco
me
7–
0.27
0***
(0.0
08)
–33
.70
–0.
045*
** (0
.003
)–
14.7
3–
0.05
7***
(0.0
08)
–7.
22–
0.08
4***
(0.0
03)
–27
.86
Inco
me
8–
0.18
7***
(0.0
08)
–24
.05
–0.
035*
** (0
.003
)–
11.6
7–
0.05
9***
(0.0
08)
–7.
64–
0.06
2***
(0.0
03)
–21
.28
Inco
me
9–
0.12
1***
(0.0
08)
–16
.03
–0.
020*
** (0
.003
)–
6.84
–0.
019*
* (0
.008
)–
2.52
–0.
037*
** (0
.003
)–
12.7
3
Educ
atio
n (p
ostg
radu
ate
omitt
ed)
32
12
1.82
8 (1
.648
)
Low
er e
duca
tion
–0.
214*
** (0
.008
)–
27.5
5–
0.09
0***
(0.0
03)
–30
.38
–0.
221*
** (0
.008
)–
28.6
8–
0.11
5***
(0.0
03)
–39
.63
GC
SE a
nd e
quiv
alen
ts–
0.12
6***
(0.0
07)
–17
.23
–0.
068*
** (0
.003
)–
24.6
4–
0.15
3***
(0.0
07)
–21
.43
–0.
078*
** (0
.003
)–
28.6
8
A-l
evel
and
equ
ival
ents
–0.
089*
** (0
.008
)–
10.8
6–
0.03
8***
(0.0
03)
–12
.38
–0.
099*
** (0
.008
)–
12.2
8–
0.04
9***
(0.0
03)
–16
.16
Nur
sing
, tea
chin
g qu
alifi
catio
n (e
xcep
t P
GC
E)–
0.09
8***
(0.0
08)
–11
.39
–0.
027*
** (0
.003
)–
8.43
–0.
082*
** (0
.008
)–
9.73
–0.
044*
** (0
.003
)–
13.8
3
Firs
t de
gree
leve
l–
0.02
0***
(0.0
08)
–2.
61–
0.00
5* (0
.003
)–
1.68
–0.
016*
* (0
.008
)–
2.08
–0.
008*
** (0
.003
)–
3.08
Age
grou
ps (a
bove
65
omitt
ed)
41
53
1.43
84
(0.9
06)
Age
16–
22–
0.19
9***
(0.0
11)
-17.
34–
0.18
6***
(0.0
04)
–42
.11
0.00
3 (0
.011
)0.
26–
0.12
1***
(0.0
04)
–28
.02
Age
23–
59–
0.18
9***
(0.0
09)
–20
.53
–0.
126*
** (0
.003
)–
35.4
9–
0.02
6***
(0.0
09)
–2.
82–
0.09
8***
(0.0
03)
–27
.99
Age
50–
64–
0.01
2 (0
.008
)–
1.55
–0.
047*
** (0
.003
)–
15.3
1–
0.00
6 (0
.008
)–
0.75
–0.
024*
** (0
.003
)–
8.02
Mal
e (f
emal
e om
itted
)0.
009*
* (0
.003
)2.
426
0.00
2 (0
.001
)1.
52M
0.04
7***
(0.0
03)
12.3
42
0.00
9***
(0.0
01)
6.48
60.
438
(0.4
96)
Hou
seho
ld s
ize
0.02
1***
(0.0
01)
14.1
15
0.01
5***
(0.0
00)
27.6
83
–0.
003*
** (0
.001
)–
2.63
60.
010*
** (0
.000
)19
.19
52.
85
(1.4
62)
cont
inue
d ov
er

62Poverty, participation and choice
Empl
oym
ent
stat
us (f
ull
time
omitt
ed)
25
44
2.17
7 (1
.682
)
Self-
empl
oyed
0.00
7 (0
.008
)0.
900.
023*
** (0
.003
)8.
020.
078*
** (0
.007
)10
.39
0.02
3***
(0.0
03)
8.27
Une
mpl
oyed
–0.
289*
** (0
.008
)–
32.5
4–
0.03
4***
(0.0
03)
–10
.30
–0.
009
(0.0
08)
–1.
10–
0.07
4***
(0.0
03)
–22
.69
Ret
ired
0.06
45**
* (0
.008
)7.
810.
033*
** (0
.003
)10
.83
–0.
044*
** (0
.009
)–
5.41
0.02
1***
(0.0
03)
7.06
Fam
ily–
0.12
2***
(0.0
09)
–13
.18
–0.
003
(0.0
03)
-0.9
8–
0.03
8***
(0.0
08)
–4.
80–
0.03
1***
(0.0
03)
–9.
63
Stud
ent
–0.
025*
** (0
.010
)–
2.58
–0.
020*
** (0
.004
)5.
760.
046*
** (0
.009
)5.
110.
010*
** (0
.003
)2.
87
Sick
–0.
337*
** (0
.011
)–
28.9
0–
0.03
7***
(0.0
04)
-8.7
2–
0.12
3***
(0.0
08)
–10
.93
–0.
101*
** (0
.004
)–
23.8
5
Oth
er s
tatu
s–
0.10
8***
(0.0
15)
–6.
83–
0.01
5***
(0.0
05)
-2.8
2–
0.02
5* (0
.014
)–
1.77
–0.
031*
** (0
.005
)–
5.85
Con
stan
t–
0.46
1***
(0.0
11)
39.2
50.
142*
** (0
.004
)30
.96
0.20
2***
(0.0
12)
16.8
20.
186*
** (0
.004
)41
.51
Num
ber
of o
bser
vatio
ns40
,481
40,4
8140
,481
40,4
81 N
ote:
uns
tand
ardi
sed
coef
ficie
nts
(sta
ndar
d er
rors
); **
* p<
.01;
**
p<.0
5; *
p<0
.10;
R =
ran
king
Sour
ce: U
nder
stan
ding
Soc
iety
, Wav
e 1
(USo
c, 2
009)
Tabl
e A5
: con
tinue
d

63Appendix 5: Choice of participation: results from heteroscedastic regression of ethnic groups; beta coefficients
Tabl
e A6
: Het
eros
ceda
stic
reg
ress
ion
pred
ictin
g pa
rtic
ipat
ion
and
its d
imen
sion
s fr
om s
ocio
-eco
nom
ic c
hara
cter
istic
s (v
aria
nce)
Soci
o-ec
onom
ic c
hara
cter
istic
sD
epri
vatio
nT
Soci
al p
art.
TTr
ust
TPa
rtic
ipat
ion
TM
ean
(SD
)N
et in
com
e (t
op d
ecile
om
itted
) )4.
679
(2.8
35)
Inco
me
10.
398*
** (0
.030
)11
.60
0.05
2 (0
.034
)1.
540.
102*
** (0
.030
)3.
000.
159*
** (0
.034
)4.
65
Inco
me
20.
275*
** (0
.030
)8.
240.
099*
** (0
.033
)2.
970.
059*
(0.0
30)
1.78
0.10
9***
(0.0
33)
3.28
Inco
me
30.
286*
** (0
.030
)8.
700.
054*
(0.0
32)
1.66
0.06
3* (0
.030
)1.
920.
104*
** (0
.033
)3.
16
Inco
me
40.
278*
** (0
.030
)8.
620.
017(
0.03
2)0.
530.
033
(0.0
30)
1.03
0.09
6***
(0.0
32)
2.99
Inco
me
50.
319*
** (0
.030
)10
.04
0.03
8 (0
.032
)1.
210.
026
(0.0
30)
0.84
0.09
4***
(0.0
32)
2.97
Inco
me
60.
293*
** (0
.030
)9.
320.
009
(0.0
32)
0.30
0.02
1 (0
.030
)0.
670.
101*
** (0
.031
)3.
22
Inco
me
70.
238*
** (0
.030
)7.
63–
0.00
5 (0
.031
)–
0.16
–0.
011
(0.0
30)
–0.
380.
053*
(0.0
31)
1.72
Inco
me
80.
204*
** (0
.030
)6.
66–
0.01
0 (0
.031
)–
0.33
–0.
008
(0.0
30)
–0.
270.
047
(0.0
30)
1.53
Inco
me
90.
131*
** (0
.030
)4.
30–
0.03
5 (0
.031
)–
1.17
0.01
6 (0
.030
)0.
520.
022
(0.0
30)
0.72
Educ
atio
n (p
ostg
radu
ate
omitt
ed)
1.82
8 (1
.648
)
Low
er e
duca
tion
0.11
8***
(0.0
30)
3.99
0.05
6* (0
.029
)1.
900.
107*
** (0
.030
)3.
630.
113*
** (0
.029
)3.
83
GC
SE a
nd e
quiv
alen
ts0.
104*
** (0
.030
)3.
730.
014
(0.0
28)
0.51
–0.
005
(0.0
30)
–0.
210.
084*
** (0
.028
)3.
01
A-l
evel
and
equ
ival
ents
0.09
1***
(0.0
30)
2.91
0.00
9 (0
.031
)0.
300.
041
(0.0
30)
1.31
0.06
2**
(0.0
31)
1.98
Nur
sing
, tea
chin
g qu
alifi
catio
n (e
xcep
t P
GC
E)0.
069*
* (0
.030
)2.
100.
023
(0.0
32)
0.72
–0.
045
(0.0
30)
1.39
0.04
9 (0
.032
)1.
49
Firs
t de
gree
leve
l0.
040(
0.03
0)1.
32–
0.04
6 (0
.030
)–
1.50
–0.
006
(0.3
0)–
0.21
–0.
002
(0.0
30)
–0.
08
Age
grou
ps (a
bove
65
omitt
ed)
1.43
4 (0
.906
)
Age
16–
22–
0.00
6 (0
.043
)–
0.16
–0.
090*
* (0
.043
)–
2.09
–0.
152*
** (0
.043
)–
3.51
–0.
099*
(0.0
43)
–2.
29
Age
23–
590.
169*
** (0
.035
)4.
85–
0.10
7***
(0.0
35)
–3.
07–
0.12
4***
(0.0
35)
–3.
57–
0.03
2 (0
.034
)–
0.92
Age
50–
640.
213*
** (0
.030
)7.
06–
0.04
7 (0
.030
)–
1.55
–0.
104*
** (0
.030
)–
3.44
0.03
5 (0
.030
)1.
18
Mal
e (f
emal
e om
itted
)–
0.09
5***
(0.0
14)
–6.
460.
005
(0.0
14)
0.38
0.02
9* (0
.014
)1.
97–
0.07
7***
(0.0
14)
–5.
270.
438
(0.4
96)
Hou
seho
ld s
ize
0.01
4**
(0.0
05)
2.56
0.01
8***
(0.0
05)
3.33
0.00
1 (0
.005
)0.
220.
014*
** (0
.005
)2.
672.
85 (1
.462
)
Empl
oym
ent
stat
us (f
ull t
ime
omitt
ed)
2.17
7 (1
.682
)
Self-
empl
oyed
0.03
6 (0
.028
)1.
250.
023
(0.0
28)
0.81
0.03
8 (0
.028
)1.
360.
043
(0.0
28)
1.52
Une
mpl
oyed
0.05
6* (0
.031
)1.
820.
156
***
(0.0
31)
5.02
0.10
7***
(0.0
31)
3.43
0.12
3***
(0.0
31)
3.97
Ret
ired
–0.
082*
** (0
.030
)–
3.01
–0.
030
(0.0
30)
-0.9
90.
037
(0.0
30)
1.20
–0.
038
(0.0
30)
–1.
25
Fam
ily0.
134*
** (0
.030
)4.
380.
051*
(0.0
30)
1.68
0.04
3 (0
.030
)1.
420.
105*
** (0
.030
)3.
41
Stud
ent
0.11
0***
(0.0
36)
3.07
–0.
015
(0.0
36)
–0.
44–
0.01
0 (0
.036
)–
0.30
–0.
018
(0.0
36)
–0.
51
cont
inue
d ov
er

64Poverty, participation and choice
Sick
0.05
6 (0
.040
)1.
400.
143*
** (0
.040
)3.
560.
170*
** (0
.040
)4.
260.
104*
** (0
.040
)2.
60
Oth
er s
tatu
s0.
079
(0.0
55)
1.43
–0.
036
(0.0
55)
–0.
650.
038
(0.0
55)
0.69
–0.
030
(0.0
55)
–0.
54
Con
stan
t–
2.36
5***
(0.0
45)
–51
.80
–3.
922*
** (0
.045
)–
85.9
0–
1.98
6***
(0.0
45)
–43
.50
–4.
051*
** (0
.045
)–
88.7
3
Num
ber
of o
bser
vatio
ns40
,481
40,4
8140
,481
40,4
81
Num
ber
of o
bser
vatio
ns40
,481
40,4
8140
,481
40,4
81
Not
e: u
nsta
ndar
dise
d co
effic
ient
s (s
tand
ard
erro
rs);
***
p<.0
1; *
* p<
.05;
* p
<0.1
0; R
= r
anki
ngSo
urce
: Und
erst
andi
ng S
ocie
ty, W
ave
1 (U
Soc,
200
9)
Tabl
e A6
: con
tinue
d
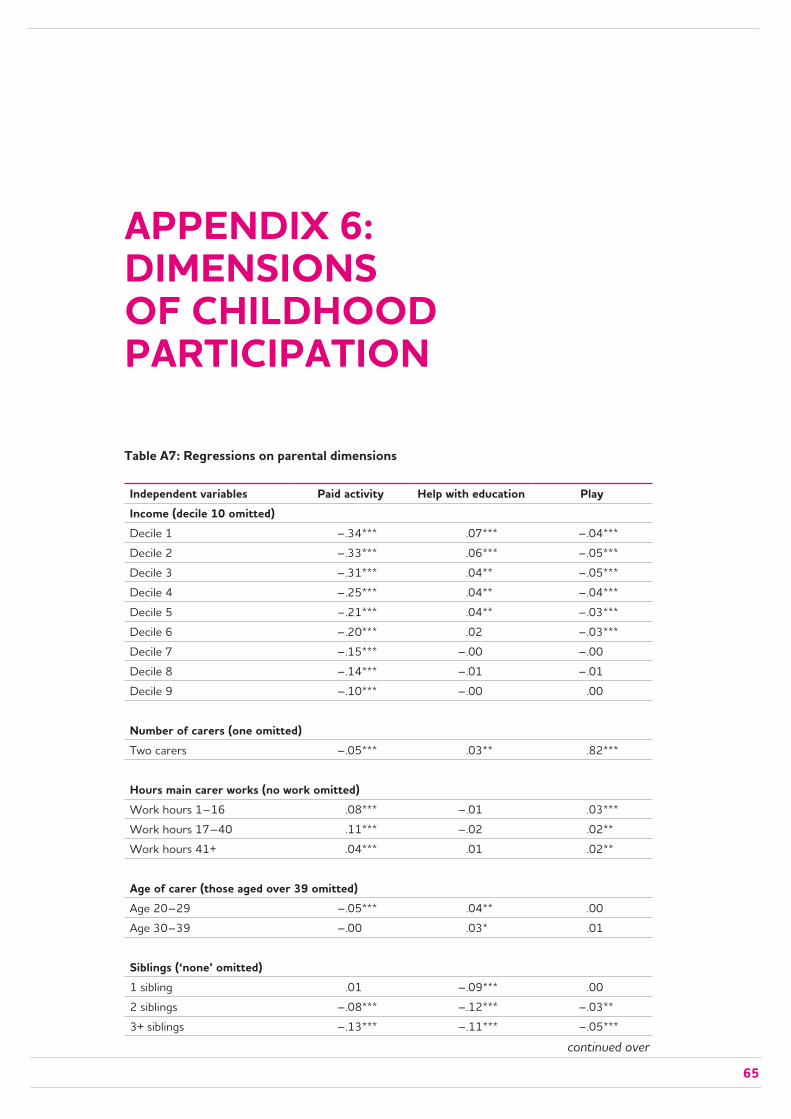
65
APPENDIX 6: DIMENSIONS OF CHILDHOOD PARTICIPATION
Table A7: Regressions on parental dimensions
Independent variables Paid activity Help with education PlayIncome (decile 10 omitted)Decile 1 –.34*** .07*** –.04***
Decile 2 –.33*** .06*** –.05***
Decile 3 –.31*** .04** –.05***
Decile 4 –.25*** .04** –.04***
Decile 5 –.21*** .04** –.03***
Decile 6 –.20*** .02 –.03***
Decile 7 –.15*** –.00 –.00
Decile 8 –.14*** –.01 –.01
Decile 9 –.10*** –.00 .00
Number of carers (one omitted)Two carers –.05*** .03** .82***
Hours main carer works (no work omitted)Work hours 1–16 .08*** –.01 .03***
Work hours 17–40 .11*** –.02 .02**
Work hours 41+ .04*** .01 .02**
Age of carer (those aged over 39 omitted)Age 20–29 –.05*** .04** .00
Age 30–39 –.00 .03* .01
Siblings (‘none’ omitted)1 sibling .01 –.09*** .00
2 siblings –.08*** –.12*** –.03**
3+ siblings –.13*** –.11*** –.05***
continued over

66Poverty, participation and choice
Education of carer (higher education or NVQ5 omitted)No/minimal education NVQ1 –.33*** .02 –.05***
Low education NVQ2 –.12*** –.03 –.03**
Medium education NVQ3 –.04* –.00 –.02
Higher education NVQ4 .02 –.01 –.00
Number of observations 13,024 13,024 13,024
Fit: Chi sqr 988.8; CFI 0.981; TLI 0.975; RMSEA 0.015; *** significant at 0.1%; ** significant at 1%; * significant at 5%
Table A8: Regressions on child dimensions
Independent variables Active Friendship EducationalIncome (decile 10 omitted)Decile 1 .00 –.06* .02
Decile 2 –.02 –.06* –.00
Decile 3 .00 –.07*** .03
Decile 4 –.02 –.03 –.01
Decile 5 –.02 –.05* –.02
Decile 6 –.02 –.05* –.01
Decile 7 –.02 –.04 –.01
Decile 8 –.02 .00 –.02
Decile 9 –.03 –.02 –.02
Gender of childGirl –.06*** .09*** .25***
Number of carers (one omitted)Two carers .02 .01 .06***
Hours main carer works (‘no work’ omitted)Work hours 1–16 .03 .04* –.00
Work hours 17–40 .05** .06** –.00
Work hours 41+ .05** .02 .02*
Age of carer (those aged over 39 omitted)Age 20–29 .01 .00 .01
Age 30–39 .01 .01 .03**
Siblings (‘none’ omitted)1 sibling .02 –.01 –.03
2 siblings .01 –.02 –.04**
3+ siblings .01 –.02 –.03*
Table A7: continued

67Appendix 6: Dimensions of childhood participation
Education of carer (higher education or NVQ5 omitted)No/minimal education NVQ1 –.02 .02 .01
Low education NVQ2 –.01 .04 .00
Medium education NVQ3 .01 .06* .02
High education NVQ4 –.01 .02 .00
Number of observations 13,007 13,007 13,007
Fit: Chi sqr 2551.8; CFI 0.922; TLI 0.905; RMSEA 0.020; *** significant at 0.1%; ** significant at 1%; * significant at 5%
Table A8: continued

68Poverty, participation and choice
ACKNOWLEDGEMENTSThe authors gratefully acknowledge funding from the Joseph Rowntree Foundation and the support received from Professor Nick Buck and colleagues at the University of Essex in responding to questions concerning the Understanding Society study, which is largely funded by the Economic and Social Research Council.
ABOUT THE AUTHORSEmanuele Ferragina is a Departmental Lecturer in the Department of Social Policy and Intervention, University of Oxford, and a Fellow at Green Templeton College.
Mark Tomlinson is a Senior Lecturer in Sociology and Social Policy in the Department of Sociological Studies at the University of Sheffield.
Robert Walker is Professor of Social Policy and a Fellow of Green Templeton College at the University of Oxford.

Joseph Rowntree FoundationThe Homestead40 Water EndYork YO30 6WPwww.jrf.org.uk
© University of Oxford 2013First published 2013 by the Joseph Rowntree FoundationISBN: 978 1 85935 976 1 (pdf)Project managed and typeset by Cambridge Publishing Management Limited
The Joseph Rowntree Foundation has supported this project as part of its programme of research and innovative development projects, which it hopes will be of value to policy-makers, practitioners and service users. The facts presented and views expressed in this report are, however, those of the authors and not necessarily those of JRF.
A pdf version of this publication is available from the JRF website (www.jrf.org.uk). Further copies of this report, or any other JRF publication, can be obtained from the JRF website (www.jrf.org.uk/publications) or by emailing [email protected]
A CIP catalogue record for this report is available from the British Library.
All rights reserved. Reproduction of this report by photocopying or electronic means for non-commercial purposes is permitted. Otherwise, no part of this report may be reproduced, adapted, stored in a retrieval system or transmitted by any means, electronic, mechanical, photocopying, or otherwise without the prior written permission of the Joseph Rowntree Foundation.