poverty in the united states in 2019 - congress
TRANSCRIPT

Poverty in the United States in 2019
April 13, 2021
Congressional Research Service
https://crsreports.congress.gov
R46759
Congressional Research Service
SUMMARY
Poverty in the United States in 2019 Calendar year 2019 was the last full year before the start of the Coronavirus Disease 2019
(COVID-19) pandemic, and the last year of the economic expansion since the Great Recession. The strength of the U.S. economy in 2019 was reflected in low poverty rates—the percentage of the population living in poverty (economic hardship characterized by low income)—for the
nation and by demographic group.
While the 2019 poverty estimates do not reflect people’s incomes during the pandemic, the pandemic affected survey data collection for that year, which took place February-April 2020. Instead of a combination of in-
person interviews and telephone interviews, only telephone interviews were conducted due to social distancing restrictions. That affected the estimates because some respondents were harder to reach by phone than in person, less likely to respond to
a telephone interview than an in-person interview, or less likely to respond for other reasons. The increased rate of nonresponse affected persons with low incomes to a greater degree than persons with high incomes. That means that while poverty in 2019 was at or close to a historic low, it was likely not as low as the official estimates suggest.
Bearing the above caveats in mind, the poverty rate in the United States was estimated to be 10.5% in 2019, down from 11.8% in 2018. This was the fifth year in a row that the poverty rate declined. The decline in poverty was broad based, affecting many demographic groups and occurring in every region of the country. The estimated poverty rate fell
both for women (11.5% in 2019, from 12.9% in 2018) and men (9.4%, from 10.6%);
among families with a female householder and no spouse present (22.2% in 2019, from 24.8% in 2018), the latest of a series of historic or near-historic lows for this group;
among Hispanics (15.7% in 2019, from 17.6% in 2018), Whites not of Hispanic origin (7.3%, from 8.1%), Blacks (18.8%, from 20.8%), and Asians (7.3%, from 10.1%);
for both full-time workers (2.0% in 2019, from 2.3% in 2018) and nonworkers (26.4%, from 29.7%); and
in 23 states and the District of Columbia.
Work reduces the estimated likelihood of being in poverty but does not eliminate it entirely: 39.2% of poor 18 to 64-year-
olds had jobs in 2019. Furthermore, poverty is measured using the needs and resources from the entire family, meaning that nonworkers in poverty may be living with working family members. Among 18- to 64-year-olds without jobs estimated to be living in poverty, 19.2% lived in families where someone else worked.
Criticisms of the official poverty measure have inspired poverty measurement research and eventually led to the development of the Supplemental Poverty Measure (SPM). The SPM uses different definitions of needs and resources than the official measure.
The SPM includes adjustments to reflect geographic variations in housing costs, and the estimated effects of taxes and in-kind benefits (such as housing, energy, and food assistance) on poverty, while the official measure does not. Because some types of tax credits and noncash benefits are used to assist the poor, the
SPM may be of interest to policymakers.
The estimated poverty rate under the SPM (11.7%) was about 1.3 percentage points (after rounding) higher in 2019 than the official poverty rate (10.5%).
Under the SPM, the profile of the poverty population is slightly different than under the official measure. Compared with the official measure, estimated poverty rates under the SPM in 2019 were lower for children (12.5%, compared with 14.4%) and higher for working-age adults (11.2%, compared with 9.4%)
and the 65-and-older population (12.8%, compared with 8.9%).
While the SPM reflects more current measurement methods, the official measure provides a comparison of the poor population over a longer period, including some years before many current antipoverty assistance
programs had been developed. In developing poverty-related legislation and conducting oversight on programs that aid the low-income population, policymakers may be interested in these historical trends.
R46759
April 13, 2021
Joseph Dalaker Analyst in Social Policy

Poverty in the United States in 2019
Congressional Research Service
Contents
Introduction ................................................................................................................... 1
How the Official Poverty Measure is Computed ............................................................. 3
Historical Perspective ...................................................................................................... 4
Poverty by Demographic Group ........................................................................................ 5
Family Structure........................................................................................................ 5 Age ......................................................................................................................... 6 Race and Hispanic Origin ........................................................................................... 7 Work Status .............................................................................................................. 8
Poverty Rates by State ..................................................................................................... 9
Supplemental Poverty Measure ....................................................................................... 10
How the Official Poverty Measure Was Developed ....................................................... 10 Motivation for a Supplemental Measure ...................................................................... 11 Official and Supplemental Poverty Findings for 2019.................................................... 13
Figures
Figure 1. Number of Persons in Poverty and Poverty Rate: 1959 to 2019 ................................. 5
Figure 2. Poverty Rates of Families by Family Structure: 2019 .............................................. 6
Figure 3. Poverty Rates by Age: 1959 to 2019 ..................................................................... 7
Figure 4. Poverty Rates by Race and Hispanic Origin: 2019 .................................................. 8
Figure 5. Percentage of People in Poverty in the Past 12 Months by State and for the
District of Columbia and Puerto Rico: 2019 ................................................................... 10
Figure 6. Poverty Rates Under Official Measure and Supplemental Poverty Measure for
the United States, by Age and by Region: 2019 ............................................................... 14
Tables
Table 1. Differences Between the Official and Supplemental Poverty Measures ...................... 12
Contacts
Author Information ....................................................................................................... 14

Poverty in the United States in 2019
Congressional Research Service 1
Introduction Calendar year 2019 was the last full year before the start of the Coronavirus Disease 2019
(COVID-19) pandemic, and the last year of the economic expansion since the Great Recession. The strength of the U.S. economy in 2019 was reflected in low poverty rates—the percentage of
the population living in poverty (economic hardship characterized by low income)—for the
nation and by demographic group. This report presents poverty data for the United States over
time, as well as by demographic group (family structure, age, race and Hispanic origin, and work
status) and state for 2019. The numbers presented in the report are estimates, based on a survey (discussed below).
The official, annual data on income and poverty are measured retrospectively by a Census Bureau
survey conducted in February, March, and April of the following year.1 Most of the survey data collection for 2019 took place in March 2020, after the COVID-19 pandemic had begun and
when social distancing measures were beginning to be implemented. As a result, any interviews
that would have been conducted in person, by a field representative visiting respondents at their
homes, were conducted by telephone only.2 The switch to telephone-only interviewing
contributed to a lower response rate, which affected the estimates.3 Further, the persons who did
not respond were more likely to have had low incomes than high incomes.4 This drop in survey response tempers the conclusions that may be drawn from the data.
The estimated official poverty rate in 2019 was measured at a seemingly record-low 10.5%. After taking account of survey bias—in this case, the artificially lower poverty rates caused by higher
nonresponse among those with low incomes than those with high incomes—the U.S. poverty rate
was estimated to have been 11.1% in 2019 (tying the previous low of 11.1% in 1973).5 That is,
1 The Current Population Survey (CPS), the source of most of the data in this report, asks an extra set of questions (the
Annual Social and Economic Supplement, or ASEC) in February, March, and April, with most of the data collection
taking place in March, in order to obtain detailed information about the previous year’s income. According to the U.S.
Census Bureau, “It was thought that since March is the month before the deadline for filing federal income tax returns,
respondents were likely to have recently prepared tax returns or be in the midst of preparing such returns and could
report income more accurately than at any other time of the year.” U.S. Census Bureau, Current Population Survey:
Design and Methodology, Technical Paper 66, October 2006, Chapter 11, “Current Population Survey Supplemental
Inquiries,” p. 11-5, https://www.census.gov/prod/2006pubs/tp-66.pdf. 2 The CPS is usually conducted using both telephone interviewing and in-person interviewing. For details, see U.S.
Census Bureau, Current Population Survey: Design and Methodology, Technical Paper 66, October 2006,
https://www.census.gov/prod/2006pubs/tp-66.pdf.
3 Response rates to the survey were approximately 9 to 10 percentage points lower than they had been in previous years
(73.0% in 2020 compared with 81.5% in 2019 and 83.7% in 2018). This decreased response rate could have many
contributing causes, such as a respondent’s lack of a telephone, difficulties in finding a telephone number associated
with a household selected for the survey, some respondents’ lower willingness to respond to a telephone call than to an
in-person visit , or other reasons. 4 Every year, when processing the CPS ASEC data, the Census Bureau applies weighting procedures that attempt to
correct for nonresponse, so that totals by age, sex, race, and Hispanic origin match independently computed totals
based on administrative data. These procedures reduced but did not eliminate nonresponse bias. In a research paper
(i.e., separate from the official reports), Census Bureau analysts estimated the likely effects of nonresponse bias on the
2019 income and poverty estimates. For a detailed analysis of the lower response to the CPS ASEC conducted in 2020,
see Jonathan Rothbaum and Adam Bee, Coronavirus Infects Surveys Too: Nonresponse Bias During the Pandemic in
the CPS ASEC, U.S. Census Bureau, working paper number SEHSD WP2020-10, September 2020, at
https://www.census.gov/library/working-papers/2020/demo/SEHSD-WP2020-10.html. A succinct and less technical
explanation by Jonathan Rothbaum is available on the Census Bureau’s “Research Matters” blog at
https://www.census.gov/newsroom/blogs/research-matters/2020/09/pandemic-affect-survey-response.html. 5 Jonathan Rothbaum and Adam Bee, Coronavirus Infects Surveys Too: Nonresponse Bias During the Pandemic in the

Poverty in the United States in 2019
Congressional Research Service 2
while poverty was indeed low in 2019, it was likely not as low as the official estimates suggest,
due to nonresponse bias. The information in this report necessarily uses the official estimates.
Detailed experimental estimates that adjust for nonresponse bias specific to the pandemic are not available for the characteristics discussed in the report.
Bearing the above caveats in mind, in 2019 approximately 34 million people had incomes below
the official definition of poverty in the United States, which was a decline from 38 million people
in 2018. The poverty rate fell to 10.5% from 11.8%. This was the fifth consecutive year that the
poverty rate fell. The decline in poverty was broad based, affecting many demographic groups and occurring in every region of the country (discussed below).
The numbers and percentages of those in poverty presented in this report are based on the Census
Bureau’s estimates.6 While this official measure is often regarded as a statistical yardstick rather than a complete description of what people and families need to live,7 it does offer a measure of
economic hardship faced by the low-income population: the poverty measure compares family
income against a dollar amount called a poverty threshold, a level below which the family is
considered to be poor. The Census Bureau releases these poverty estimates every September for
the prior calendar year. Most of the comparisons discussed in this report are year-to-year. The report only considers a number or percentage to have changed from the previous year, or to be
different from another number or percentage, if the difference has been tested to be statistically significant at the 90% confidence level.8
Over the past several decades, criticisms of the official poverty measure have led to the
development of an alternative research measure called the Supplemental Poverty Measure (SPM),
CPS ASEC, U.S. Census Bureau, working paper number SEHSD WP2020-10, September 2020, at
https://www.census.gov/library/working-papers/2020/demo/SEHSD-WP2020-10.html. 6 The national-level data in this report were obtained from the report by Jessica Semega, Melissa Kollar, Emily A.
Shrider, and John Creamer, Income and Poverty in the United States: 2019, U.S. Census Bureau, Current Population
Reports number P60-270, September 15, 2020, at https://www.census.gov/library/publications/2020/demo/p60-
270.html, and the detailed tabulations and the CPS ASEC public use file that accompanied the release of that report.
Details on the Supplemental Poverty Measure, also based primarily on the CPS ASEC, were obtained from Liana Fox,
The Supplemental Poverty Measure: 2019, U.S. Census Bureau, Current Population Reports number P60-272,
September 15, 2020, at https://www.census.gov/library/publications/2020/demo/p60-272.html. State-level data in this
report were obtained from the 2019 American Community Survey (ACS), also conducted by the U.S. Census Bureau.
Details are available in Craig Benson, Poverty: 2018 and 2019, U.S. Census Bureau, ACS Brief number ACSBR/20-
04, September 17, 2020, at https://www.census.gov/library/publications/2020/acs/acsbr20-04.html.
7 Jessica Semega, Melissa Kollar, Emily A. Shrider, and John Creamer, Income and Poverty in the United States: 2019, U.S. Census Bureau, Current Population Reports number P60-270, September 15, 2020, Appendix B,
https://www.census.gov/library/publications/2020/demo/p60-270.html. The characterization of the poverty measure as a
statistical yardstick goes back decades. See, for example, “U.S. Changes Yardstick on Who Is Poor,” Chicago Tribune,
May 3, 1965, section 1B, p. 4.
8 Not every apparent difference in point estimates is a real difference. The official poverty measure uses information
from the CPS ASEC, which surveys about 95,000 addresses nationwide. All poverty data discussed here are t herefore
estimates, which have margins of error. Error in this case refers to a difference from the true data that is caused by
using a sample instead of the entire population, not mistakes in computation or biases from imperfect data collection or
processing. Even if a survey were implemented perfectly and had collected complete and accurate information from all
respondents in the sample, surveying a different sample would likely yield slightly different estimates of the poverty
population or the poverty rate. Thus, even if the true poverty rate were exactly the same in two different years, it is
possible to get survey estimates that appear different. In order to report that a change has occurred in the poverty rate —that is, that the difference between the estimates is likely not caused by sampling variability—the difference has to be
large enough that fewer than 10% of all possible survey samples would produce a difference that large (and,
conversely, 90% of the samples would not). Such a difference is said to be statistically significant at the 90%
confidence level. Point estimates whose differences are not statistically significant are described as such in this report .

Poverty in the United States in 2019
Congressional Research Service 3
which the Census Bureau also computes and releases. Statistics comparing the official measure with the SPM are provided at the conclusion of this report.
The SPM includes adjustments to reflect geographic variations in housing costs, and the estimated effects of taxes and in-kind benefits (such as housing, energy, and food assistance) on
poverty, while the official measure does not. Because some types of tax credits and noncash
benefits provide financial help to families and individuals in poverty, the SPM may be of interest
to policymakers. However, the official measure provides a comparison of the poor population
over a longer period, including some years before many current antipoverty assistance programs had been developed. In developing poverty-related legislation and conducting oversight on
programs that aid the low-income population, policymakers may be interested in these historical trends.
How the Official Poverty Measure is Computed
The Census Bureau determines a person’s poverty status by comparing his or her resources
against a measure of need. For the official measure, resources is defined as total family income
before taxes, and the measure of need is a dollar amount called a poverty threshold. There are 48 poverty thresholds that vary by family size and composition. If a person lives with other people to
whom he or she is related by birth, marriage, or adoption, the money income from all family
members is used to determine his or her poverty status. If a person does not live with any family
members, his or her own income is used. Only money income before taxes is used in calculating
the official poverty measure, meaning this measure does not treat in-kind benefits such as the
Supplemental Nutrition Assistance Program (SNAP, formerly known as food stamps), housing subsidies, or employer-provided benefits as income.
The poverty threshold dollar amounts vary by the size of the family (from one person not living in a family, to nine or more family members living together) and the ages of the family members
(how many of the members are children under 18 and whether or not the family head is 65 or
older). Collectively, these poverty thresholds are often referred to as the poverty line. As a rough
guide, the poverty line in 2019 can be thought of as $26,172 for a family of four, $20,335 for a
family of three, $16,521 for a family of two, or $13,011 for an individual not living in a family, though the official measure is actually much more detailed.9
The threshold dollar amounts are updated annually for inflation using the Consumer Price Index.
Notably, the same thresholds are applied throughout the country: no adjustment is made for geographic variations in living expenses.10
The official poverty measure used in this report is the federal government’s definition of poverty
for statistical purposes, such as comparing the number or percentage in poverty over time. A related definition of poverty, the poverty guidelines published by the Department of Health and
9 To provide a general sense of the poverty line, the Census Bureau computes weighted averages of the thresholds
within each family size. For example, a family of three may consist of any of the following combinations: three adults,
two adults and one child, or one adult and two children. Each combination has its own distinct threshold. The $20,335
figure cited represents an average of those family combinations, adjusted to reflect that some types of three-person
families are more common than others. The averages are a convenience for the reader, but are not actually used to
compute poverty status for statistical reports. In actual computations, 48 thresholds are used in the official measure.
10 Unlike the poverty thresholds that are used to compute official poverty statistics, the Health and Human Services
(HHS) poverty guidelines used for administrative purposes do include separate amounts for Alaska and Hawaii.

Poverty in the United States in 2019
Congressional Research Service 4
Human Services (HHS), is used for administrative purposes such as eligibility criteria for assistance programs and will not be discussed in this report.11
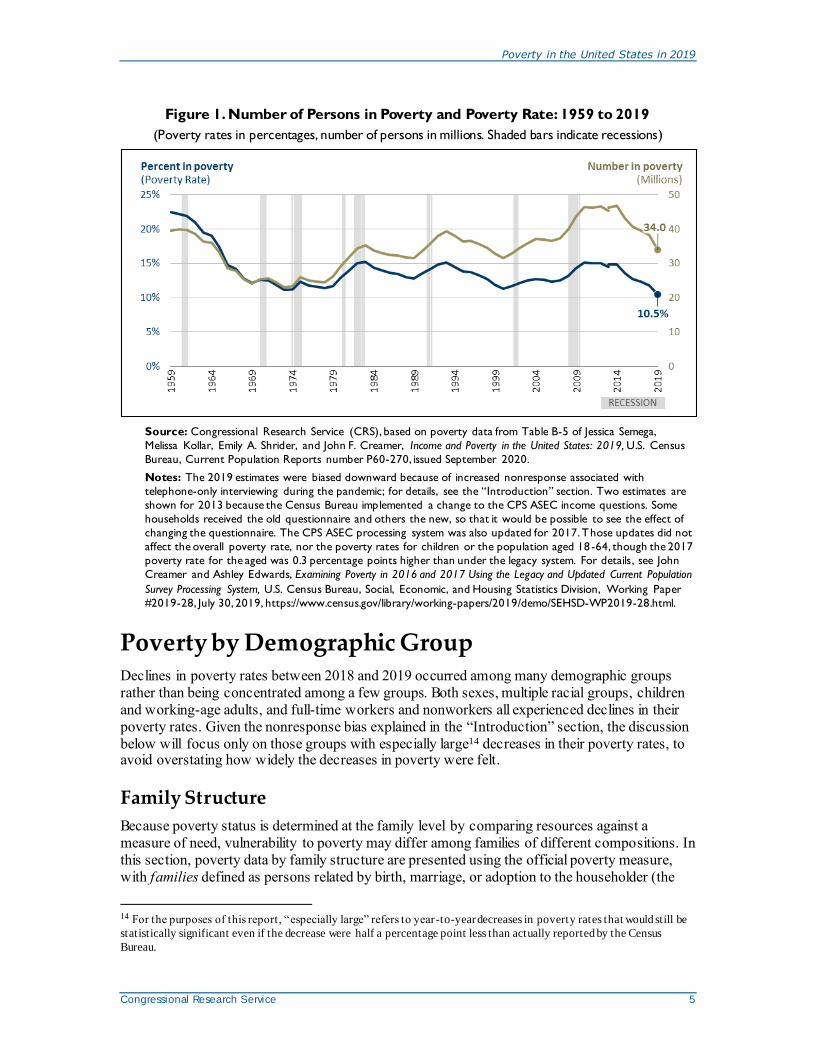
Historical Perspective Figure 1 shows a historical perspective of the number and percentage of the population below the
poverty line. The number in poverty and the poverty rates are shown from the earliest year
available (1959) through the most recent year available (2019). Because the total U.S. population has grown over time, poverty rates are useful for historical comparisons because they control for population growth.
Poverty rates fell through the 1960s. Since then, they have generally risen and fallen according to the economic cycle, though during the two most recent expansions poverty rates did not fall
measurably until four to six years into the expansion. Historically notable lows occurred in 1973
(11.1%), 2000 (11.3%), and 2019 (10.5%).12 Poverty rate peaks occurred in 1983 (15.2%), 1993 (15.1%), and 2010 (15.1%).13
Poverty rates tend to rise during and after recessions, as opposed to leading economic indicators
such as new housing construction, whose changes often precede changes in the performance of
the overall economy. The poverty rate’s lag is explainable in part by the way it is measured: it uses income from the entire calendar year.
11 The official poverty measure described in this report was established in the Office of Management and Budget’s Statistical Policy Directive 14, May 1978, reproduced on the Census Bureau’s website at https://www.census.gov/
topics/income-poverty/poverty/about/history-of-the-poverty-measure/omb-stat-policy-14.html. It states that the official
measure is to be used for statistical purposes, but should not be construed as required for administrative purposes.
Though the poverty guidelines published by HHS use the official thresholds as part of their computation, the HHS
poverty guidelines are collectively a distinct poverty definition and are often used as a criterion in federal assistance
programs. T he HHS poverty guidelines are often referred to as the federal poverty level or FPL. See CRS Report
R44780, An Introduction to Poverty Measurement, for further discussion.
12 The rate in 2019 is the lowest numerically, but suffered from nonresponse bias, as was described in the
“ Introduction” section. Before 2019, the poverty rates in 1973 and 2000 had been considered to be tied for the lowest
measured poverty rate because they are not statistically different from each other. 13 These poverty rates may not necessarily be distinguishable from the poverty rates in their adjacent years. See
footnote 8 for an explanation of statistical significance.
Poverty in the United States in 2019
Congressional Research Service 5
Figure 1. Number of Persons in Poverty and Poverty Rate: 1959 to 2019
(Poverty rates in percentages, number of persons in millions. Shaded bars indicate recessions)
Source: Congressional Research Service (CRS), based on poverty data from Table B-5 of Jessica Semega,
Melissa Kollar, Emily A. Shrider, and John F. Creamer, Income and Poverty in the United States: 2019, U.S. Census
Bureau, Current Population Reports number P60-270, issued September 2020.
Notes: The 2019 estimates were biased downward because of increased nonresponse associated with
telephone-only interviewing during the pandemic; for details, see the “Introduction” section. Two estimates are
shown for 2013 because the Census Bureau implemented a change to the CPS ASEC income questions. Some
households received the old questionnaire and others the new, so that it would be possible to see the effect of
changing the questionnaire. The CPS ASEC processing system was also updated for 2017. Those updates did not
affect the overall poverty rate, nor the poverty rates for children or the population aged 18 -64, though the 2017
poverty rate for the aged was 0.3 percentage points higher than under the legacy system. For details, see John
Creamer and Ashley Edwards, Examining Poverty in 2016 and 2017 Using the Legacy and Updated Current Population
Survey Processing System, U.S. Census Bureau, Social, Economic, and Housing Statistics Division, Working Paper
#2019-28, July 30, 2019, https://www.census.gov/library/working-papers/2019/demo/SEHSD-WP2019-28.html.
Poverty by Demographic Group Declines in poverty rates between 2018 and 2019 occurred among many demographic groups
rather than being concentrated among a few groups. Both sexes, multiple racial groups, children
and working-age adults, and full-time workers and nonworkers all experienced declines in their
poverty rates. Given the nonresponse bias explained in the “Introduction” section, the discussion
below will focus only on those groups with especially large14 decreases in their poverty rates, to avoid overstating how widely the decreases in poverty were felt.
Family Structure
Because poverty status is determined at the family level by comparing resources against a
measure of need, vulnerability to poverty may differ among families of different compositions. In
this section, poverty data by family structure are presented using the official poverty measure,
with families defined as persons related by birth, marriage, or adoption to the householder (the
14 For the purposes of this report, “especially large” refers to year-to-year decreases in poverty rates that would still be
statistically significant even if the decrease were half a percentage point less than actually reported by the Census
Bureau.

Poverty in the United States in 2019
Congressional Research Service 6
person in whose name the home is owned or rented). In the “Supplemental Poverty Measure” section of this report, a different definition will be used.
In general, women have higher poverty rates than men: 11.5% compared with 9.4% in 2019. Both sexes experienced poverty rate declines from 2018 (from 12.9% for women and 10.6% for men).
Historically, families with a female householder and no spouse present (female-householder
families) have had higher poverty rates than both married-couple families and families with a
male householder and no spouse present (male-householder families). This remained true in
2019: the poverty rate among female-householder families was 22.2%, compared with 11.5% for male-householder families and 4.0% for married-couple families (Figure 2).
Female-householder families, unlike male-householder families, experienced a decline of 2.6
percentage points in their poverty rate from 2018. The 2019 poverty rate for female-householder families was the lowest reported for that group. Even though nonresponse affected low-income
families more than high-income families, and female-householder families are more likely to be
low income than the other family types, the 2019 poverty rate is the latest in a series of low poverty rates for this group, compared with previous decades.
Persons not living in families experienced a poverty rate decline as well, from 20.2% in 2018 to 18.8% in 2019.
Figure 2. Poverty Rates of Families by Family Structure: 2019
(Poverty rates in percentages)
Source: Congressional Research Service (CRS), based on poverty data from Table B-2 of Jessica Semega,
Melissa Kollar, Emily A. Shrider, and John F. Creamer, Income and Poverty in the United States: 2019, U.S. Census
Bureau, Current Population Reports number P60-270, issued September 2020.
Notes: The poverty rates above include only families with a householder (the survey ’s reference person for the
household; typically the person in whose name the home is owned or rented). The Census Bureau defines a
family as those living together related by birth, marriage, or adoption.
Age
When examining poverty by age, the three main groups (under 18, 18 to 64, and 65 and older) are
noteworthy for distinct reasons. People under age 18 are typically dependent on other family members for income, particularly young children below their state’s legal working age. People
aged 18 to 64 are generally thought of as the working-age population and typically have wages
and salaries as their greatest source of income. People aged 65 and older, referred to as the aged
population, are often eligible for retirement, and those who do retire typically experience a change in their primary source of income.
As shown in Figure 3, children and the working-age population experienced decreases in poverty.
Among children, 10.5 million, or 14.4%, were poor, down from 11.9 million, or 16.2%, in 2018.

Poverty in the United States in 2019
Congressional Research Service 7
Among the working-age population, 18.9 million, or 9.4%, were in poverty, down from 21.1 million, or 10.7%, in 2018.
In earlier years, the poverty rate for those aged 65 and over was the highest of the three age groups. In 1966, people aged 65 and over had a poverty rate of 28.5%, compared with 17.6% for
those under 18 and 10.5% for working-age adults. By 1974, the poverty rate for people aged 65
and over had fallen to 14.6%, compared with 15.4% for people under 18 and 8.3% for working-
age adults. Since then, people under 18 have had the highest poverty rate of the three groups, while the poverty rate among the 65-and-older population had fallen to 8.9% by 2019.
Figure 3. Poverty Rates by Age: 1959 to 2019
(Poverty rates in percentages. Shaded bars indicate recessions)
Source: Congressional Research Service (CRS), based on poverty data from Table B-6 of Jessica Semega,
Melissa Kollar, Emily A. Shrider, and John F. Creamer, Income and Poverty in the United States: 2019, U.S. Census
Bureau, Current Population Reports number P60-270, issued September 2020.
Notes: The 2019 estimates were biased downward because of increased nonresponse associated with
telephone-only interviewing during the pandemic; for details, see the “Introduction” section. Data are not
available from 1960 to 1965 for persons aged 65 and older and for persons aged 18 to 64. Two estimates are
shown for 2013 for each age group because the Census Bureau implemented a change to the CPS ASEC income
questions. Some households received the old questionnaire and others the new, so that it would be possible to
see the effect of changing the questionnaire. The CPS ASEC processing system was also updated for 2017 . Those
updates did not affect the overall poverty rate, nor the poverty rates for children or the population aged 18 -64,
though the 2017 poverty rate for the aged was 0.3 percentage points higher than under the legacy system. For
details, see John Creamer and Ashley Edwards, Examining Poverty in 2016 and 2017 Using the Legacy and Updated
Current Population Survey Processing System, U.S. Census Bureau, Social, Economic, and Housing Statistics Division,
Working Paper #2019-28, July 30, 2019, https://www.census.gov/library/working-papers/2019/demo/SEHSD-
WP2019-28.html.
Race and Hispanic Origin15
Poverty rates vary by race and Hispanic origin, as shown in Figure 4. In surveys, Hispanic origin
is asked about separately from race; accordingly, people identifying as Hispanic may be of any
15 Since 2002, federal surveys have asked respondents to identify with one or more races; previously, they could choose
only one. The groups in this section represent those who identified with one race alone. Another approach is to include
those who selected each race group either alone or in combination with one or more other races. Those data are also

Poverty in the United States in 2019
Congressional Research Service 8
race. Among the racial and Hispanic origin groups with populations large enough to estimate
given the sample size of the CPS ASEC, every one experienced a statistically significant decline
in its poverty rates from 2018 to 2019. Among the White non-Hispanic population, the poverty
rate fell from 8.1% to 7.3%; among the Black population,16 from 20.8% to 18.8%; among the
Asian population,17 from 10.1% to 7.3%; and among the Hispanic population, from 17.6% to 15.7%.
Figure 4. Poverty Rates by Race and Hispanic Origin: 2019
(Poverty rates in percentages)
Source: Congressional Research Service (CRS), based on poverty data from Table B-1 of Jessica Semega,
Melissa Kollar, Emily A. Shrider, and John F. Creamer, Income and Poverty in the United States: 2019, U.S. Census
Bureau, Current Population Reports number P60-270, issued September 2020.
Notes: People of Hispanic origin may be of any race. Additionally, respondents may identify with one or more
racial groups. Except for “All persons” and “Hispanic,” the remaining groups shown include those who identified
with one race only. The “non-Hispanic White alone” group includes only the White non-Hispanic population, the
“Black alone” group includes Blacks of Hispanic origin, and the “Asian alone” group includes Asians of Hispanic
origin. Data for Native Hawaiians and Other Pacific Islanders, American Indians and Alaska Natives, and the
population of two or more races are not shown separately.
Work Status
While having a job reduced the likelihood of being in poverty, it did not guarantee that a person
or his or her family would avoid poverty. Among the population aged 18 to 64 living in poverty,
39.2% had jobs in 2019. Poverty rates among workers in this age group were 4.7% for all
workers, 2.0% for full-time year-round workers (down from 2.3% in 2018), and 12.0% for part-time or part-year workers. Among those who did not work at least one week in 2019, 26.4% were poor (down from 29.7% in 2018).
Because poverty is a family-based measure, a change in one member’s work status can affect the
poverty status of his or her entire family. Among all 18- to 64-year-olds who did not have jobs in
2019, 61.4% lived in families in which someone else did have a job.18 Among 18- to 64-year-olds
available on the Census Bureau’s website at https://www.census.gov/library/publications/2020/demo/p60-270.html,
where they are published in Appendix B of Jessica Semega, Melissa Kollar, Emily A. Shrider, and John F. Creamer,
Income and Poverty in the United States: 2019, U.S. Census Bureau, Current Population Reports number P60-270,
issued September 2020; and in accompanying historical data tables. 16 Includes Blacks of Hispanic origin.
17 Includes Asians of Hispanic origin.
18 Author’s tabulation using 2020 CPS ASEC public use file.
Poverty in the United States in 2019
Congressional Research Service 9
with income below the poverty line and without jobs, 19.2% lived in families where someone else worked.19
Poverty Rates by State20 Poverty is not equally prevalent in all parts of the country. Figure 5 shows states with relatively
high poverty rates across parts of the Appalachians, the Southwest, and the Deep South.
Mississippi’s poverty rate (19.6%), seemingly the highest, was not statistically different from Louisiana’s (19.0%). The poverty rate in New Hampshire (7.3%) was the lowest. When
comparing poverty rates geographically, the official poverty thresholds are not adjusted for
geographic variations in the cost of living—the same thresholds are used nationwide. As such, an
area with a lower cost of living accompanied by lower wages will appear to have a higher poverty
rate than an area with a higher cost of living and higher wages, even if individuals’ purchasing power were exactly the same in both areas.
Twenty-three states and the District of Columbia experienced statistically significant declines in
their poverty rates compared to 2018: three in the Northeast (Massachusetts, New York, and Rhode Island), seven in the Midwest (Illinois, Indiana, Michigan, Minnesota, Nebraska, Ohio,
and Wisconsin), nine states (Alabama, Arkansas, Florida, Georgia, South Carolina, Tennessee,
Texas, Virginia, West Virginia) plus the District of Columbia in the South, and four in the West (California, New Mexico, Oregon, and Washington).
19 Ibid.
20 These state estimates are based on the ACS instead of the CPS ASEC, because the Census Bureau recommends the
ACS when comparing states and smaller geographic areas. Because the CPS ASEC surveys 90,000 to 100,000
addresses nationwide, it is sometimes difficult to obtain reliable estimates for small populations or small geographic
areas—the sample may not have selected enough people from that group or area to provide a meaningful estimate. The
ACS samples about 3.5 million addresses per year and therefore affords greater statistical precision for comparing
states and smaller geographic areas. However, unlike the CPS ASEC, which uses trained interviewers and detailed
income questions, the ACS is filled out by the respondent on his or her own. Furthermore, the ACS is conducted
continuously, and asks the respondents about their income in the previous 12 months, not necessarily the previous
calendar year as in the CPS ASEC. For these reasons, poverty estimates from the ACS are often different from CPS ASEC estimates: the ACS reported a poverty rate of 12.3% for the United States in 2019, compared with 10.5% in the
CPS ASEC (11.1% after adjusting for nonresponse bias resulting from telephone-only interviewing). Poverty estimates
from the ACS and the CPS ASEC do not include Puerto Rico in the U.S. total. Puerto Rico’s poverty rate was 43.5% in
2019. The ACS is not conducted in the other U.S. territories.

Poverty in the United States in 2019
Congressional Research Service 10
Figure 5. Percentage of People in Poverty in the Past 12 Months by State and for the
District of Columbia and Puerto Rico: 2019
(Poverty rates in percentages)
Source: Congressional Research Service, based on data from Craig Benson, Poverty: 2018 and 2019, U.S. Census
Bureau, American Community Survey Brief ACSBR/20-04, Table 1, issued September 2020, at
https://www.census.gov/library/publications/2020/acs/acsbr20-04.html.
Notes: Data by state are based on the ACS while national-level data presented elsewhere in this report are
based on the CPS ASEC. The ACS reported a poverty rate of 12.3% for the United States in 2019, compared
with 10.5% in the CPS ASEC. See footnote 20 for further details.
Supplemental Poverty Measure Criticisms of the official poverty measure led to the development of the SPM. Described below
are the development of the official measure, its limitations, attempts to remedy those limitations,
the research efforts that eventually led to the SPM’s first release in November 2011, and a comparison of poverty rates in 2019 based on the SPM and the official measure.21
How the Official Poverty Measure Was Developed
The poverty thresholds were originally developed in the early 1960s by Mollie Orshansky of the
Social Security Administration. Rather than attempt to compute a family budget by using prices for all essential items that low-income families need to live, Orshansky focused on food costs.22
21 For a more thorough discussion of the SPM’s development and methodology, see CRS Report R45031, The
Supplemental Poverty Measure: Its Core Concepts, Development, and Use .
22 While Orshansky did not attempt to compute a complete basket of goods and services, her focus on food costs was already a more detailed empirical approach to poverty measurement than were the dollar amounts used in the 1964
Economic Report of the President , issued by the Council of Economic Advisers (chapter 2, “The Problem of Poverty in
America”). In that report, a flat figure of $3,000 was used for all families and $1,500 for unrelated individuals. See also
Poverty in the United States in 2019
Congressional Research Service 11
Unlike other goods and services such as housing or transportation, which did not have a generally
agreed-upon level of adequacy, minimum standards for nutrition were known and widely
accepted. According to a 1955 U.S. Department of Agriculture (USDA) food consumption survey,
the average amount of their income that families spent on food was roughly one-third. Therefore,
using the cost of a minimum food budget and multiplying that figure by three yielded a figure for
total family income. That computation was possible because USDA had already published recommended food budgets as a way to address the nutritional needs of families experiencing
economic stress. Some additional adjustments were made to derive poverty thresholds for two-
person families and individuals not living in families to reflect the relatively higher fixed costs of smaller households.
Motivation for a Supplemental Measure
While the official poverty measure has been used for over 50 years as the source of official
statistics on poverty in the United States, it has received criticism over the years for several reasons. First, it does not take into account benefits from most of the largest programs that aid the
low-income population. For instance, it uses money income before taxes—meaning that it does
not necessarily measure the income available for individuals to spend, which for most people is
after-tax income. Therefore, any effects of tax credits designed to assist persons with low income
are not captured by the official measure. The focus on money income also does not account for in-kind benefit programs designed to help the poor, such as SNAP or housing assistance.
The official measure has also been criticized for the way it characterizes families’ and
individuals’ needs in the poverty thresholds. That is, the method used to compute the dollar amounts used in the thresholds, which were originally based on food expenditures in the 1950s
and food costs in the 1960s, does not accurately reflect current needs and available goods and
services.23 The official measure also does not take account of the sharing of expenses and income
among household members not related by birth, marriage, or adoption. And, as mentioned earlier, the official thresholds do not take account of geographic variations in the cost of living.
In 1995, a panel from the National Academy of Sciences issued a report, Measuring Poverty: A
New Approach, which recommended improvements to the poverty measure.24 Among the
suggested improvements were to have the poverty thresholds reflect the costs of food, clothing, shelter, utilities, and a little bit extra to allow for miscellaneous needs; to broaden the definition of
family; to include geographic adjustments as part of the measure’s computation; to include the
out-of-pocket costs of medical expenses in the measure’s computation; and to subtract work-
Economic Report of the President (1964), https://fraser.stlouisfed.org/tit le/45#8135. For a thorough history of the
official poverty measure, see Gordon Fisher, The Development of the Orshansky Thresholds and Their Subsequent
History as the Official U.S. Poverty Measure, 1992, rev. 1997, reproduced on the Census Bureau’s website at
https://www.census.gov/library/working-papers/1997/demo/fisher-02.html. 23 Criticisms have been discussed in the mainstream press as well as academia. A 1988 article (Spencer Rich, “Drawing
the Line Between Rich, Poor,” The Washington Post, September 23, 1988, https://www.washingtonpost.com/archive/
politics/1988/09/23/drawing-the-line-between-rich-poor/60f5dbeb-dab3-4a42-819a-2dea34e7854e/) documented
dissatisfaction about the official measure. This came from both those claiming it was too high, citing its failure to
capture the effects of in-kind benefits for the poor and its overstatement of inflation, and those claiming it was too low,
based on the fact that if the thresholds were derived using more recent household consumption data, they would be
based on roughly five times the cost of food, not three times as Orshansky had computed in the early 1960s.
24 Constance F. Citro and Robert T . Michael, eds., Measuring Poverty: A New Approach, Panel on Poverty and Family
Assistance: Concepts, Information Needs, and Measurement Methods, Committee on National Statistics, National
Research Council (Washington, DC: National Academies Press, 1995), available at https://www.nap.edu/read/4759/
chapter/1.

Poverty in the United States in 2019
Congressional Research Service 12
related expenses from income. An overarching goal of the recommendations was to make the
poverty measure more closely aligned with the real-life needs and available resources of the low-
income population, as well as the changes that have taken place over time in their circumstances, owing to changes in the nation’s economy, society, and public policies (see Table 1).
After over a decade and a half of research to implement and refine the methodology suggested by
the panel, conducted both from within the Census Bureau as well as by other federal agencies and
the academic community, the Census Bureau issued the first report using the SPM in November 2011.25
Table 1. Differences Between the Official and Supplemental Poverty Measures
Official Poverty Measure Supplemental Poverty Measure
Resource
units
(families)
People related by birth, marriage, or adoption
(official Census Bureau definition of family).
People aged 15 and older not related to anyone
else in the household are considered as their
own economic units.
People related by birth, marriage, adoption, plus
unrelated and foster children, and cohabiting partners
and their children or other relatives (if any) are
considered as “SPM resource units” (sharing resources
and expenses together).
Needs
(thresholds)
Vary according to family size and ages of
family members.
Dollar amounts based on the cost of a food
plan for families in economic stress in the
early 1960s, times three (with adjustments
for two-person families and individuals).
Updated for inflation using the Consumer
Price Index.
No geographic cost adjustments.
Vary according to the size and composition of the
resource unit (see above).
Dollar amounts based on consumer expenditure
data for food, clothing, shelter, and utilities, with
adjustments by homeownership and mortgage or
rental status.
Based on the most recent five years of consumer
expenditure data (not fixed at one point and trended
forward).
Housing costs geographically adjusted for individual
metropolitan areas and the entire nonmetropolitan
area within states.
Resources Money income before taxes (includes 18 private
and government sources of income, including
Social Security, cash assistance, and other
sources of cash income).
Money income (both private and government sources)
after taxes ...
Minus: work expenses, child care expenses, child
support paid, out-of-pocket medical expenses.
Plus: tax credits (such as the Child Tax Credit and
the Earned Income Tax Credit) and the value of in-
kind benefits (such as food and housing subsidies).
25 The effort to consolidate the previous research and create the SPM was done under the auspices of an Interagency
Technical Working Group (ITWG) led by the Office of Management and Budget (OMB) and received public
commentary via a Federal Register notice (Federal Register, vol. 75 no. 101, Wednesday, May 26, 2010, pp. 29513-
29514, https://www.federalregister.gov/documents/2010/05/26/2010-12628/developing-a-supplemental-poverty-
measure). The Federal Register notice referenced a report by the ITWG ("Observations from the Interagency Technical
Working Group on Developing a Supplemental Poverty Measure”), which has since been moved to a new URL at
https://www.census.gov/content/dam/Census/topics/income/supplemental-poverty-measure/spm-twgobservations.pdf.
The comments that the Census Bureau received on that report are available on the Census Bureau’s website at
https://www.census.gov/content/dam/Census/topics/income/supplemental-poverty-measure/redactedcomments.pdf.
These and additional methodological documents on the SPM are available at https://www.census.gov/topics/income-
poverty/supplemental-poverty-measure/guidance/methodology.html.
Poverty in the United States in 2019
Congressional Research Service 13
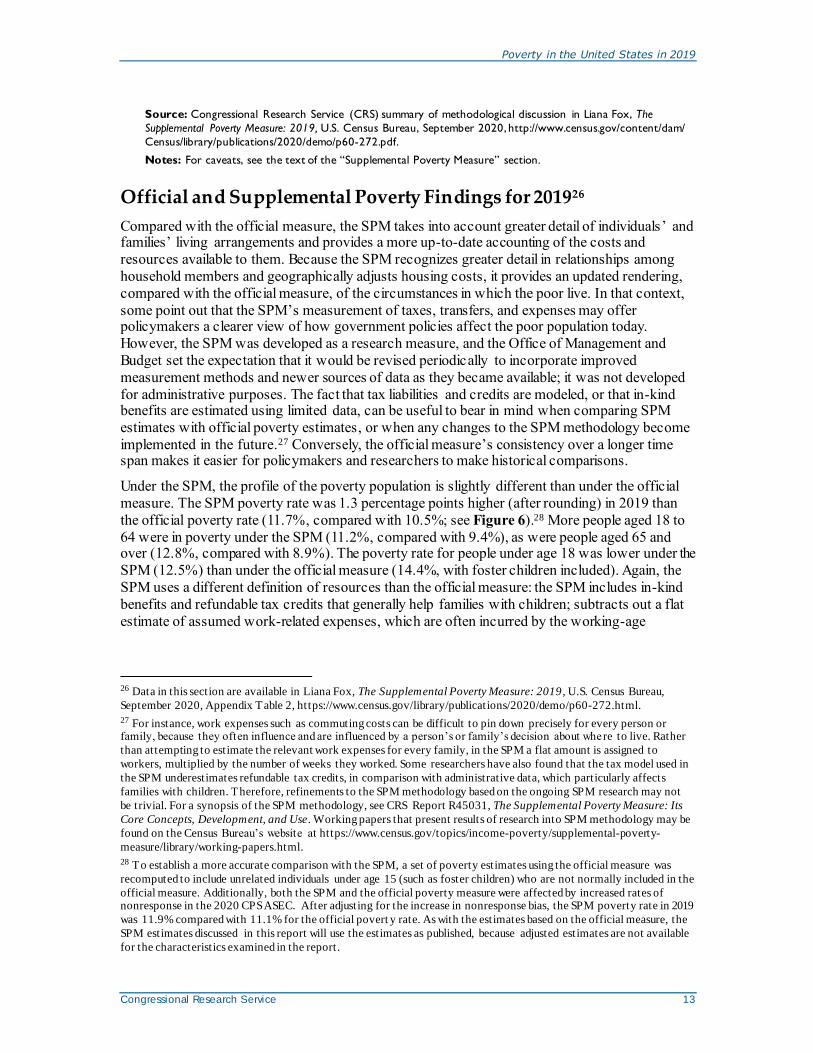
Source: Congressional Research Service (CRS) summary of methodological discussion in Liana Fox, The
Supplemental Poverty Measure: 2019, U.S. Census Bureau, September 2020, http://www.census.gov/content/dam/
Census/library/publications/2020/demo/p60-272.pdf.
Notes: For caveats, see the text of the “Supplemental Poverty Measure” section.
Official and Supplemental Poverty Findings for 201926
Compared with the official measure, the SPM takes into account greater detail of individuals’ and families’ living arrangements and provides a more up-to-date accounting of the costs and
resources available to them. Because the SPM recognizes greater detail in relationships among
household members and geographically adjusts housing costs, it provides an updated rendering,
compared with the official measure, of the circumstances in which the poor live. In that context,
some point out that the SPM’s measurement of taxes, transfers, and expenses may offer policymakers a clearer view of how government policies affect the poor population today.
However, the SPM was developed as a research measure, and the Office of Management and
Budget set the expectation that it would be revised periodically to incorporate improved
measurement methods and newer sources of data as they became available; it was not developed
for administrative purposes. The fact that tax liabilities and credits are modeled, or that in-kind benefits are estimated using limited data, can be useful to bear in mind when comparing SPM
estimates with official poverty estimates, or when any changes to the SPM methodology become
implemented in the future.27 Conversely, the official measure’s consistency over a longer time span makes it easier for policymakers and researchers to make historical comparisons.
Under the SPM, the profile of the poverty population is slightly different than under the official
measure. The SPM poverty rate was 1.3 percentage points higher (after rounding) in 2019 than
the official poverty rate (11.7%, compared with 10.5%; see Figure 6).28 More people aged 18 to
64 were in poverty under the SPM (11.2%, compared with 9.4%), as were people aged 65 and over (12.8%, compared with 8.9%). The poverty rate for people under age 18 was lower under the
SPM (12.5%) than under the official measure (14.4%, with foster children included). Again, the
SPM uses a different definition of resources than the official measure: the SPM includes in-kind
benefits and refundable tax credits that generally help families with children; subtracts out a flat
estimate of assumed work-related expenses, which are often incurred by the working-age
26 Data in this section are available in Liana Fox, The Supplemental Poverty Measure: 2019 , U.S. Census Bureau,
September 2020, Appendix Table 2, https://www.census.gov/library/publications/2020/demo/p60-272.html.
27 For instance, work expenses such as commuting costs can be difficult to pin down precisely for every person or family, because they often influence and are influenced by a person’s or family’s decision about whe re to live. Rather
than attempting to estimate the relevant work expenses for every family, in the SPM a flat amount is assigned to
workers, multiplied by the number of weeks they worked. Some researchers have also found that the tax model used in
the SPM underestimates refundable tax credits, in comparison with administrative data, which particularly affects
families with children. Therefore, refinements to the SPM methodology based on the ongoing SPM research may not
be trivial. For a synopsis of the SPM methodology, see CRS Report R45031, The Supplemental Poverty Measure: Its
Core Concepts, Development, and Use. Working papers that present results of research into SPM methodology may be
found on the Census Bureau’s website at https://www.census.gov/topics/income-poverty/supplemental-poverty-
measure/library/working-papers.html.
28 To establish a more accurate comparison with the SPM, a set of poverty estimates using the official measure was
recomputed to include unrelated individuals under age 15 (such as foster children) who are not normally included in the
official measure. Additionally, both the SPM and the official poverty measure were affected by increased rates of nonresponse in the 2020 CPS ASEC. After adjusting for the increase in nonresponse bias, the SPM poverty rate in 2019
was 11.9% compared with 11.1% for the official povert y rate. As with the estimates based on the official measure, the
SPM estimates discussed in this report will use the estimates as published, because adjusted estimates are not available
for the characteristics examined in the report.

Poverty in the United States in 2019
Congressional Research Service 14
population; and subtracts medical out-of-pocket expenses, which are incurred frequently by people aged 65 and older.
With the geographically adjusted thresholds, the poverty rate in 2019 was lower under the SPM than under the official measure for the Midwest (8.8% compared with 9.7%), while it was higher
than the official measure for the Northeast (11.7% compared with 9.4%), the West (13.2% compared with 9.6%), and the South (12.4% compared with 12.0%).
Figure 6. Poverty Rates Under Official Measure and Supplemental Poverty Measure for the United States, by Age and by Region: 2019
(Poverty rates in percentages)
Source: Congressional Research Service, based on data from Liana Fox, The Supplemental Poverty Measure: 2019,
U.S. Census Bureau, September 2020, Appendix Table 2, https://www.census.gov/library/publications/2020/demo/
p60-272.html.
Notes: Figures include unrelated individuals under age 15 (such as foster children), who are not usually included
in official poverty estimates.
Author Information
Joseph Dalaker Analyst in Social Policy

Poverty in the United States in 2019
Congressional Research Service R46759 · VERSION 1 · NEW 15
Disclaimer
This document was prepared by the Congressional Research Service (CRS). CRS serves as nonpartisan shared staff to congressional committees and Members of Congress. It operates solely at the behest of and
under the direction of Congress. Information in a CRS Report should not be relied upon for purposes other than public understanding of information that has been provided by CRS to Members of Congress in
connection with CRS’s institutional role. CRS Reports, as a work of the United States Government, are not subject to copyright protection in the United States. Any CRS Report may be reproduced and distributed in its entirety without permission from CRS. However, as a CRS Report may include copyrighted images or
material from a third party, you may need to obtain the permission of the copyright holder if you wish to copy or otherwise use copyrighted material.