poverty and social exclusion - johns hopkins...
TRANSCRIPT
Poverty and Social Exclusion
May 8, 2012 Social Determinants of Health Conference
Johns Hopkins University

Debra Furr-Holden Stefanie DeLuca Marsha Schachtel
Racial Segregation, Neighborhoods and Health Inequity
May 8, 2012 Debra Furr-Holden, PhD
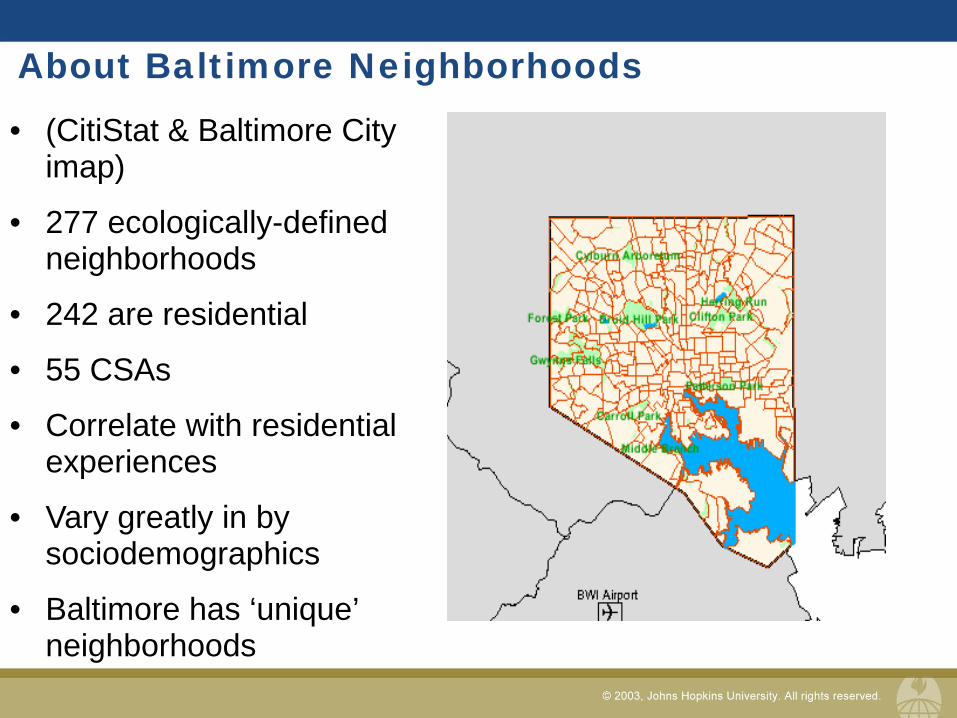
About Baltimore Neighborhoods
• (CitiStat & Baltimore City imap)
• 277 ecologically-defined neighborhoods
• 242 are residential
• 55 CSAs
• Correlate with residential experiences
• Vary greatly in by sociodemographics
• Baltimore has ‘unique’ neighborhoods
Why Study Environment/Neighborhoods?
Context matters • Social Cognitive Behavioral Model • Socially toxic environments
Environmental support for individual/group behavior
• Opportunity Theory
Disorder breeds disorder • Disorder Theory and theories of neighborhood decay and
decline (e.g. Broken Window Theory)
Unique Preventive Intervention Opportunities Passion!

55.0
60.0
65.0
70.0
75.0
80.0
85.0
Estim
ated
Life
Exp
ecta
ncy
at B
irth
(yea
rs)
Estimated Life Expectancy at Birth by Neighborhood, Baltimore City, 2011

Racial Segregation in Baltimore
National Place Matters Health Equity Learning Community at the Health Policy Institute of the Joint Center for Political and Economic Studies, and Equity Matters:
• Baltimore is the 13 most segregated City in America 85% of Baltimore communities are racially homogeneous Redlined communities map onto persistent poverty, lack of
home ownership, poor educational outcomes, and poorest health outcomes
• Tools for Change are available, but current efforts are mostly within a health disparities/downstream framework

Health Disparities or Health Equity
Health Disparities Differences Individual and group differences are highlighted, controlling for, holding constant or removing the social context. Downstream
Health Equity Equality/Inequality Unfairness Groups and individuals embedded within a social context. Focus is on the social determinants, systems, and structures. Upstream

Upstream and Downstream Fruits versus roots
Downstream Examples Legal Needs
Legal services
Physical Inactivity due to unsafe neighborhoods
Gym memberships
Hypertension Insurance Individual/group education
Upstream Examples Racist police/legal practices or policies
Research, evaluation, advocacy
Concentrated poverty, racial & economic segregation
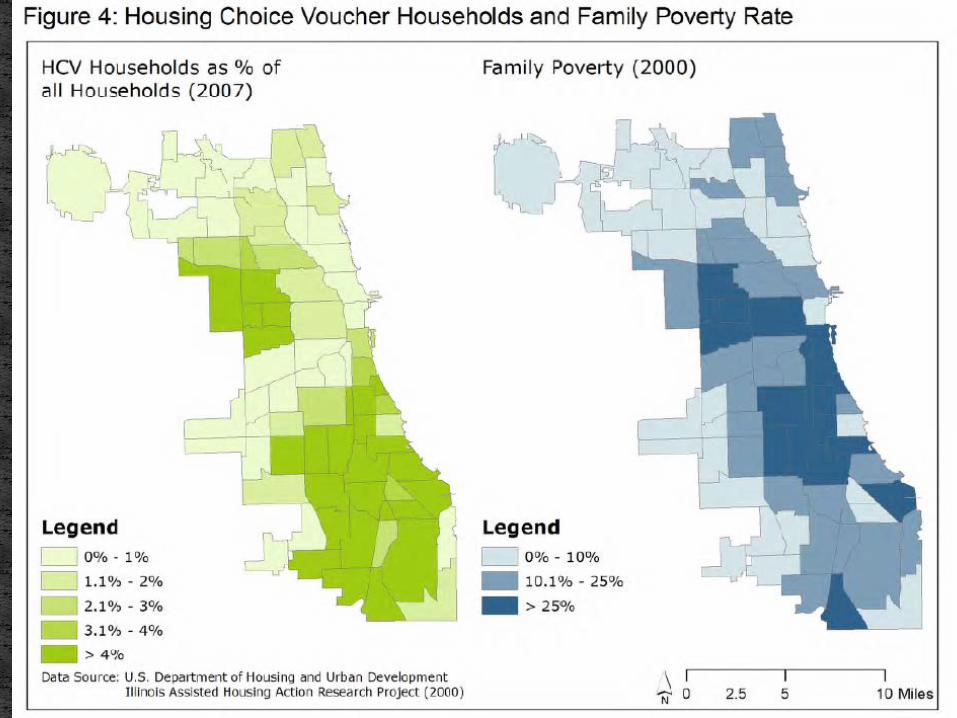
Housing policies (housing choice vouchers vs housing projects)
Zoning policies and enforcement that impact health
Alcohol outlet density Mixed land use Food deserts

Tools for Change
Research
Evidence
Policy
Practice
Tools for Change
1. Common Ground
2. Health in all Policy
1. Health Impact Assessments
- Housing
- Education
- Economic Development/Employment


Cost and Fair Market Rent Limits Some low poverty areas are off limits
Discrimination Mobility is reactive and redundant
Families move in response to forces out of their control Aspects of Section 8 (inspections, time limits, wait lists) Very little information or experience in other kinds of neighborhoods
leads families to believe they can survive anything Prioritize unit quality over neighborhood quality


GAUTREAUX MTO THOMPSON
Site Chicago, 1970s-1980s Chicago, NY, Boston, LA, Baltimore, 1990s
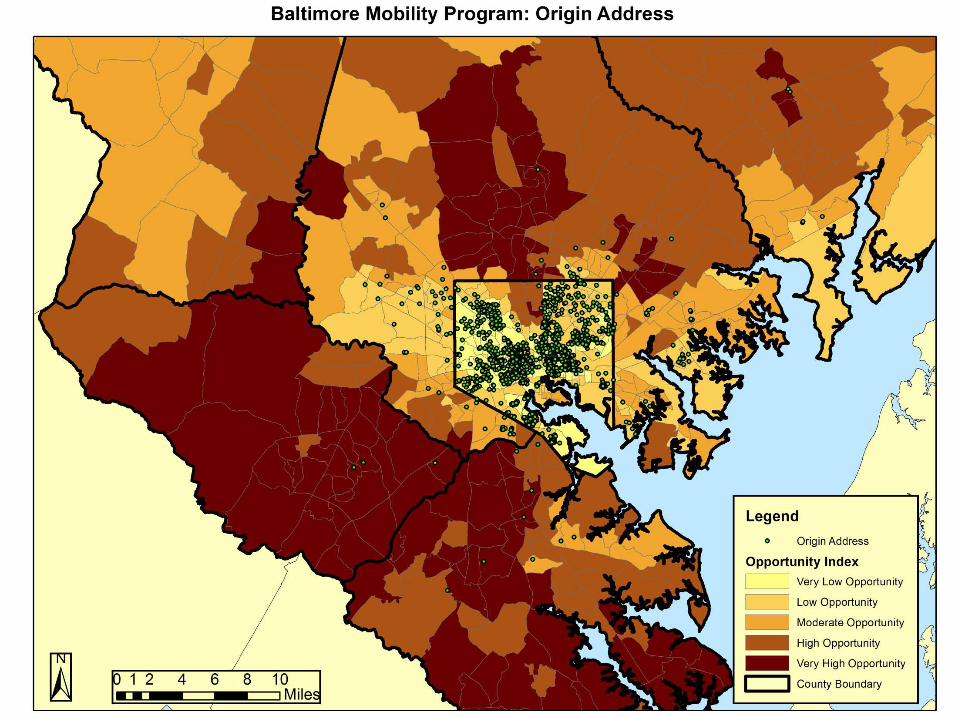
Baltimore, 2000s
Origin Lawsuit Federally funded demonstration
Lawsuit
Number 7000 1729 Exp 1209 Sect 8 1310 Controls=4248
2000 vouchers 24000 applicants 1800 moves to date
Criteria and Moves <=30% African American residents ASSIGNED UNIT
<=10% poverty rate CHOICE WITHIN TRACT
<=10% Poverty <=30% Af-Am <=5% sub hous. CHOICE WITHIN TRACT
Distance from origin suburb movers=25 miles city movers=7 miles
5-10 miles
Up to 20 miles away
Follow Up Up to 15 years 4-7 Years, 10 year follow up in the field
Up to 7 years

Figure 1. Gautreaux Mothers' Neighborhoods: Percent Poor, Percent Black, and Crime Rate in Origin, Placement, and Current Neighborhoods
42
83
23
17
28
16 16
48
20
0
10
20
30
40
50
60
70
80
90
100
% Poor % Black Crime Rate
Origin Address Placement Address Current Address

That was the worst experience that I ever experienced, living in an environment which made you feel trapped, caged, and worthless, just stuck into the atmosphere of absolutely no progress. It was a whole little community of pure dissatisfaction in everything. No one encouraged no one.—Tammy
There is a lot of hurt, a lot of bleeding, a lot of everything [for people living around here]. People just don’t know, don't know.—Edith
[But] that’s one of the things that allowed me to continue to use drugs, ‘cause I was always looking at people that was worse than me, instead of looking at people that were better, that were doing better than me.—Rachel
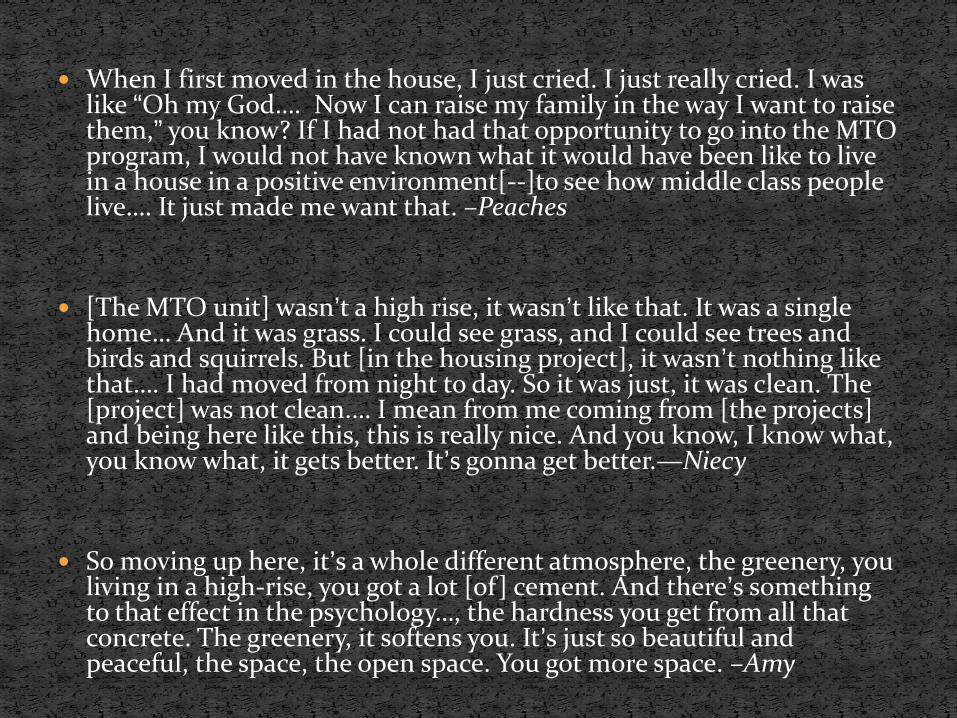
When I first moved in the house, I just cried. I just really cried. I was like “Oh my God…. Now I can raise my family in the way I want to raise them,” you know? If I had not had that opportunity to go into the MTO program, I would not have known what it would have been like to live in a house in a positive environment[--]to see how middle class people live…. It just made me want that. –Peaches
[The MTO unit] wasn’t a high rise, it wasn’t like that. It was a single
home… And it was grass. I could see grass, and I could see trees and birds and squirrels. But [in the housing project], it wasn’t nothing like that…. I had moved from night to day. So it was just, it was clean. The [project] was not clean.… I mean from me coming from [the projects] and being here like this, this is really nice. And you know, I know what, you know what, it gets better. It’s gonna get better.—Niecy
So moving up here, it’s a whole different atmosphere, the greenery, you living in a high-rise, you got a lot [of] cement. And there’s something to that effect in the psychology…, the hardness you get from all that concrete. The greenery, it softens you. It’s just so beautiful and peaceful, the space, the open space. You got more space. –Amy

Pre-Move Counseling Credit counseling Move readiness preparation for private rental market Suburban neighborhood tours
Landlord Outreach in Suburban Neighborhoods
Post-Placement Counseling Multiple visits in first year to ensure families are adjusting
Second Move Counseling
Counseling on School Choices in New Neighborhoods Parents shown how schools compare across areas Staff work with parents to negotiate new school settings


0 1 1
22
76
23
37
10
22
8 0
10
20
30
40
50
60
70
80
Below 10% 10 - 30% 30 - 50% 50 - 80% More than 80%
Origin School First Move School

Improvements for women mental health and happiness Lower levels of obesity decreased levels of diabetes
Increased housing quality and satisfaction
Reduction in neighborhood poverty
Reduction in racial segregation (across generations)
Increased access to better schools
Delinquent behaviors of boys and girls are affected differently by moves to better
neighborhoods
Harder to significantly improve economic and educational outcomes, but this
differs by program

Mobility programs show promise, but community development programs are also needed
It’s not free choice if preferences are constrained because of a legacy of discrimination and racism
Social programs often met with resistance (e.g., busing /MTO) Whites often ‘prefer’ not to live next to blacks But how many whites have ever lived with black neighbors or
attended schools with black peers?
The irony is that very forces that cause white flight can certainly never be attenuated if people continue to be separated
We can’t ever know each other if we give up working to provide opportunities to integrate by race and class

Urban Economic Development and Public Health:
Vicious or Virtuous Circles?
Marsha R. B. Schachtel Senior Fellow
Johns Hopkins Institute for Policy Studies Bloomberg School of Public Health
Provost’s Symposium on the Social Determinants of Health
May 8, 2012

~40 Years of Economic Development: What Have I Learned So Far?
Both the keys to and outcomes of Baltimore City’s
1) economic health (widely shared prosperity) and its 2) fiscal health are:
• The physical and mental health of its residents, and • Opportunities afforded them by their connections to
each other and others around the world.
Poverty and racism drive these relationships Credit to sources of insight and continuing learning:
Diane Bell McKoy and Adar Ayira, Associated Black Charities Hathaway Ferebee, Safe and Sound Campaign Margaret Williams, Maryland Family Network

IND
IVID
UA
LS
High stress Poor mental &
physical health, incl. substance abuse
POVERTY Weak connections to
opportunities Low incomes
• Limited ability to build wealth: Property, savings,
business ownership • Limited residential
mobility
NEXT GENERATION: Social, emotional, physical, cognitive
development
School readiness Success
in School
Low educational attainment and/or
H.S. dropout
Reinforced by institutionalized structural racism
Limited employment
prospects
Weak connections to labor market

Workers’ Knowledge &
Skills Business Growth
Healthy Communities Anti-blight
Public safety Preferred housing types
Affordable housing Homeownership & rental opportunities
Neighborhood retail and amenities
Innovation Family literacy Commercialization of discoveries Pre-conception health Connections to markets, strategic partners 0-3 child development Economic inclusion commitments for M/W/LBE Pre-K – 12 education Management assistance Substance abuse treatment Entrepreneurship support Ex-offender re-entry Risk capital Higher education Networks Skills training Asset building
CITY ECONOMIC
HEALTH
ECO
NO
MY:
T
he N
ew E
cono
mic
Dev
elop
men
t
CITY
FIS
CAL
HEA
LTH
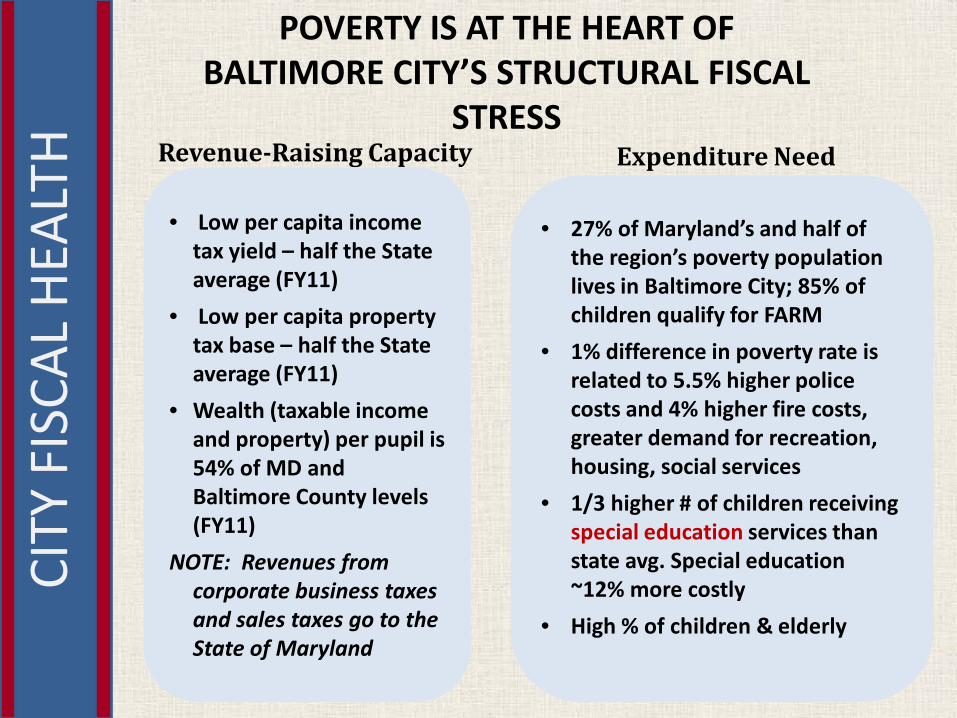
POVERTY IS AT THE HEART OF
BALTIMORE CITY’S STRUCTURAL FISCAL STRESS
Revenue-Raising Capacity Expenditure Need
• Low per capita income tax yield – half the State average (FY11)
• Low per capita property tax base – half the State average (FY11)
• Wealth (taxable income and property) per pupil is 54% of MD and Baltimore County levels (FY11)
NOTE: Revenues from corporate business taxes and sales taxes go to the State of Maryland
• 27% of Maryland’s and half of the region’s poverty population lives in Baltimore City; 85% of children qualify for FARM
• 1% difference in poverty rate is related to 5.5% higher police costs and 4% higher fire costs, greater demand for recreation, housing, social services
• 1/3 higher # of children receiving special education services than state avg. Special education ~12% more costly
• High % of children & elderly