poverty and social exclusion in urban and rural areas of scotland nick bailey 1, kirsten besemer 2,...
TRANSCRIPT

Poverty and social exclusion in urban and rural areas of Scotland
Nick Bailey1, Kirsten Besemer2, Glen Bramley2 and Maria Gannon1
1 University of Glasgow2 Heriot-Watt University
Third Peter Townsend Memorial Conference Poverty and Social Exclusion in the UK

Poverty and social exclusion in urban and rural areas of Scotland
Persistent urban bias?• measuring rural poverty (undercounting)• different nature/characteristics of rural
povertyScotland•Rural & remote areas

Urban-rural classification for Scotland
Category Share of population
% of sample
1 Large Urban Areas 39% 27%
2 Other Urban Areas 30% 26%
3 Accessible Small Towns 9% 13%
4 Accessible Rural 12% 4%
5 Remote Small Towns 3% 18%
6 Remote Rural 7% 12%
N 5,299,900 2,047

1 Rural poverty – do we have an accurate picture?
1. Do low income measures undercount rural poverty due to hidden costs of living?
2. Do measures based on benefit /tax credit claiming undercount rural poverty
1. Low income BHC vs. AHC2. Low income vs. deprivation
Low income and deprivation measures vs. SIMD Income deprivation score

Low income poverty and deprivation rates by urban-rural location
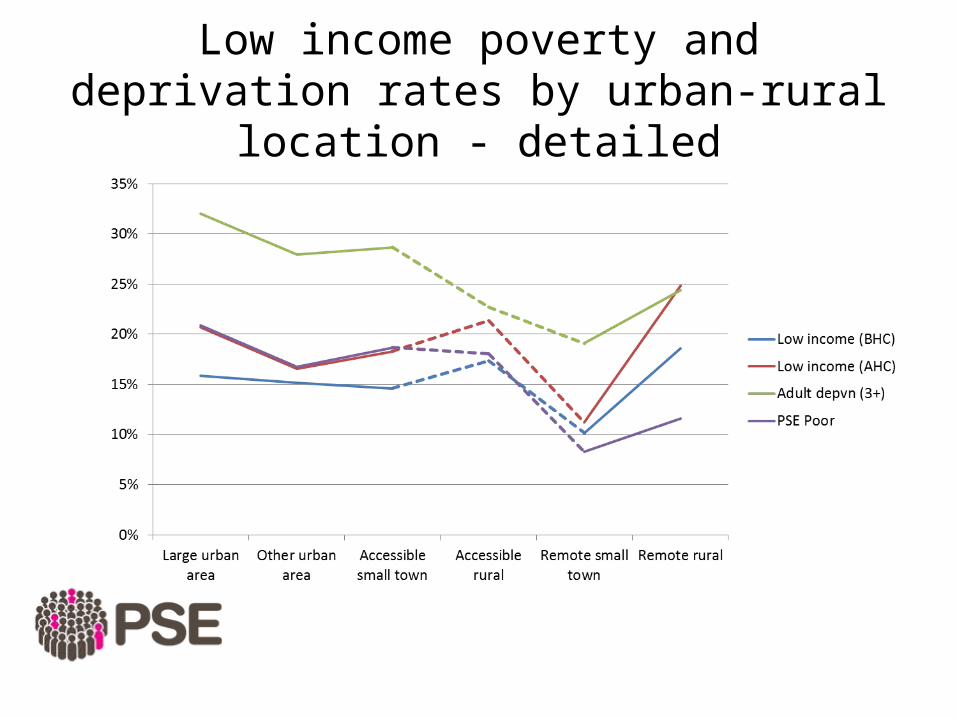
Low income poverty and deprivation rates by urban-rural location - detailed

Summary
1. Do low income measures undercount rural poverty due to hidden costs of living?
2. Do measures based on benefit /tax credit claiming undercount rural poverty
Data do not support the idea that low income poverty measures lead to under-counting
Data shows no undercounting

Copyright © University of Bristol
Exclusion in rural areas
Family and social resources, social participation• greater stability, and stronger social connections and sense of community• culture of ‘self-reliance’
PSE measures:•Perceived levels of social support (7 questions)•Contact with family (2 questions)•Contact with friends (2 questions)•Social activities (13 activities)
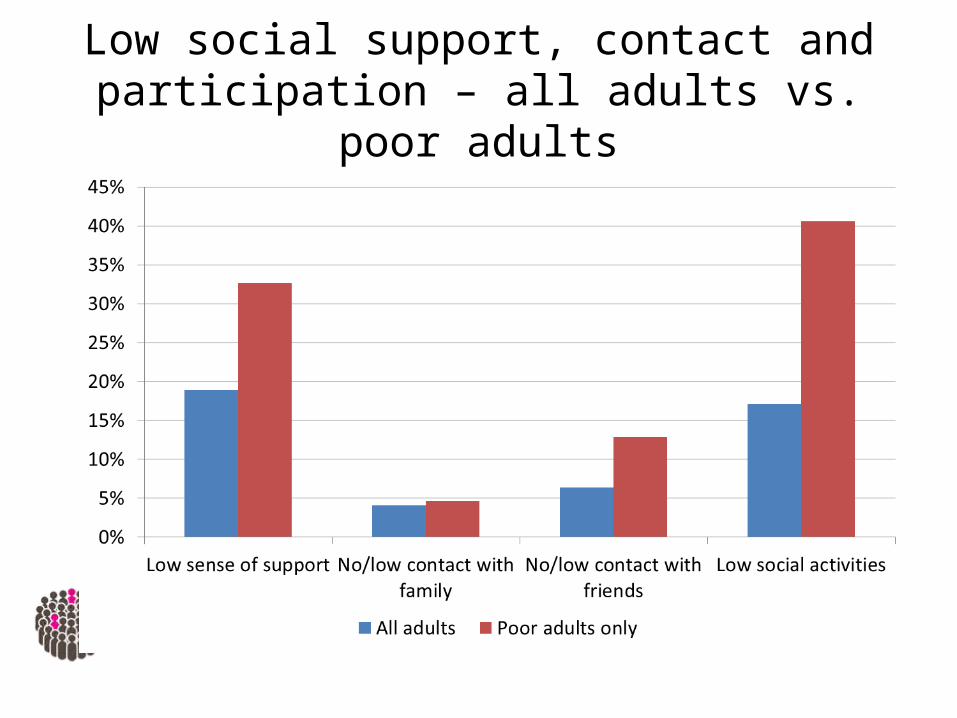
Low social support, contact and participation – all adults vs. poor adults

Low social support, contact and participation – all adults vs. poor adults
Exclusion in rural areas
Access to services and transport•Public transport not fit for purpose•Access services
PSE data on seventeen general services used by the whole population, public and private, and including transport services •Combined results for ‘use but inadequate’ with ‘don’t use – inadequate or inaccessible’
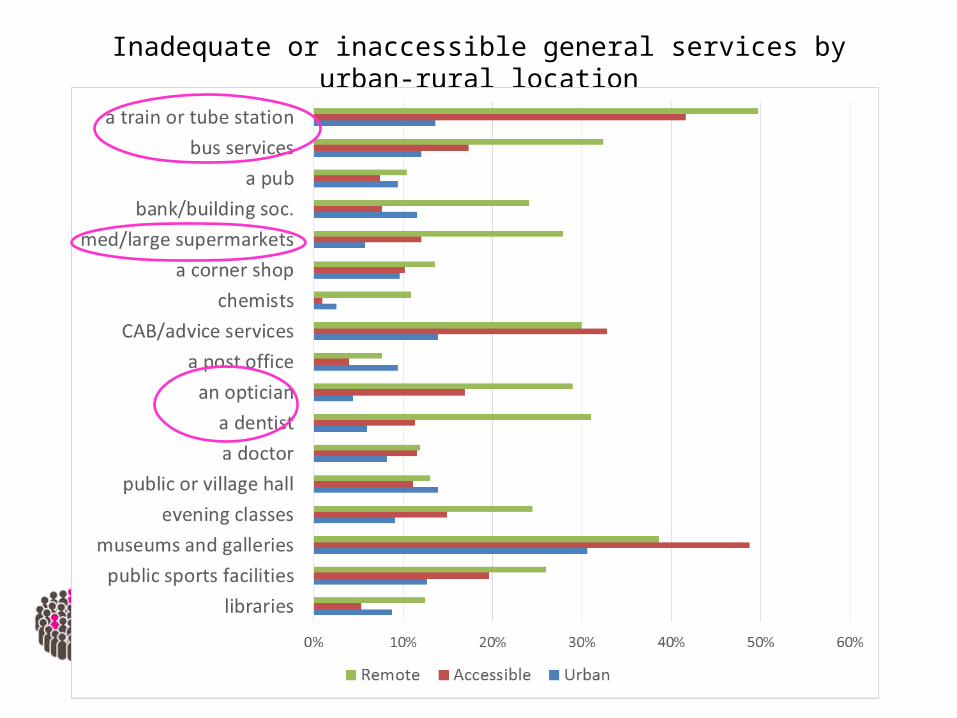
Inadequate or inaccessible general services by urban-rural location

Inadequate or inaccessible general services by urban-rural location

Exclusion in rural areas
Living environment• housing (affordability, supply and quality)• neighbourhood environment
PSE data:•Satisfaction with housing (1 question)•Housing quality (score out of 8)•Neighbourhood environment

Housing and neighbourhood ratings by urban-rural category

Exclusion in rural areas
Health and well-being• greater sense of community and support vs. isolation• environmental benefits (green space)
PSE measures:•General health•Limiting health problem or disability•Subjective well-being

Measure of health and well-being by urban-rural classification

ConclusionsHouseholds in poverty across the urban-rural spectrum in Scotland
No clear bias in low income measures
Exclusion in rural areas similarities greater than differences• Employment, social support & participation (no differences)• Health and well-being, nhd environment (better in rural areas)• Access to (certain) services, public transport (worse in urban areas)