poverty and social exclusion in britain - joseph rowntree · pdf file ·...
TRANSCRIPT

Poverty and social exclusion in Britain
David Gordon, Ruth Levitas, Christina Pantazis, Demi Patsios, Sarah Payne, Peter TownsendTownsend Centre for International Poverty Research, University of Bristol
Laura Adelman, Karl Ashworth, Sue MiddletonCentre for Research in Social Policy, Loughborough University
Jonathan Bradshaw, Julie WilliamsSocial Policy Research Unit, University of York
R O W N T R E E
F O U N D AT I O N
J O S E P H
JR

The Joseph Rowntree Foundation has supported this
project as part of its programme of research and
development projects, which it hopes will be of value
to policy makers, practitioners and service users. The
facts presented and views expressed in this report,
however, are those of the authors and not necessarily
those of the Foundation.
© Joseph Rowntree Foundation 2000
All rights reserved
Published by
Joseph Rowntree Foundation
The Homestead
40 Water End
York YO30 6WP
www.jrf.org.uk
ISBN 1 85935 059 3
Price £15.95
Designed by Adkins Design
Printed by Colorworks Ltd
Printed on recycled paper

Acknowledgements 4
Foreword 4
1 Introduction 7
2 Adult poverty in Britain 13
3 Child poverty in Britain 32
4 The growth of poverty in Britain 43
5 Social exclusion in Britain 54
6 Conclusions 68
Appendix 1: Measures of poverty 72
Appendix 2: Defining the objective scientific poverty line 76
Appendix 3: Creation of the child deprivation index 80
Appendix 4: The 1999 Poverty and Social Exclusion Survey of Britain: Technical report 85
Appendix 5: List of Poverty and Social Exclusion Survey of Britain working papers 92
Appendix 6: Contact details for the lead researchers 94
Glossary 95
Bibliography 96
Contents

The Poverty and Social Exclusion Survey of Britain
(PSE) was undertaken by the Office for National
Statistics in 1999 as a follow-up survey of a sample of
respondents to the 1998/99 General Household
Survey. The questionnaire was derived from a review
of the best social surveys from around the world. It
builds on over one hundred years of experience in
the social sciences in Britain in the scientific study of
poverty. The authors acknowledge the contribution
made to this research from the following sources and
surveys:
Breadline Britain in the 1990s, British Crime
Survey, British Household Panel Survey,
British Social Attitudes, Canadian General
Social Survey, Disability Discrimination Act
Baseline Survey, Eurobarometer, European
Community Household Panel Survey,
EuroQol 5D, General Household Survey,
GHQ12, Harmonised Question Set, Health
Survey of England, Living in Ireland Survey,
Living in Britain Survey, Lorraine Panel
Survey, MORI Omnibus, Poor Wales, Poverty
in the United Kingdom, Small Fortunes:
National Survey of the Lifestyles and Living
Standards of Children, Survey of English
Housing and the Swedish Living Conditions
Survey.
The survey, Breadline Britain in the 1990s, was
funded by London Weekend Television (LWT) with
additional funding from the Joseph Rowntree
Foundation and was carried out by Marketing and
Opinion Research International (MORI). It was
conceived and designed by Joanna Mack and Stewart
Lansley for Domino Films, with the help of Brian
Gosschalk of MORI.
We would like to thank Björn Halleröd of the
University of Umeå, Tony Manners, Dave Elliot,
Linda Murgatroyd, Jo Maher, Ann Bridgwood, Olwen
Rowlands and June Bowman at the Office for
National Statistics, Richard Berthoud and Jonathan
Gershuny at the University of Essex, Rick Davies of
Swansea University and Michael Bitman at the
University of New South Wales for their helpful
advice. We would also like to thank Brian Gosschalk,
Mark Speed and Sarah Birtles from MORI for their
helpful comments and their work on the preparatory
stages of this research. We would like to thank Roger
Bullock for making the facilities of the Dartington
Social Research Unit available.
Helen Anderson edited, typed and formatted the
original manuscript.
We would like to thank Barbara Ballard and Dominic
Hurley from the Joseph Rowntree Foundation for
their advice, encouragement and support throughout
this project and Donald Hirsch for his editing work.
Finally, we would like to thank the members of the
Advisory Committee for their helpful support.
The following authors contributed to this report:
Chapter 1 - Peter Townsend and David Gordon;
Chapter 2 - Jonathan Bradshaw and Julie Williams;
Chapter 3 - Laura Adelman, Karl Ashworth and Sue
Middleton;
Chapter 4 - David Gordon;
Chapter 5 - Ruth Levitas, Christina Pantanzis, Demi
Patsios and Peter Townsend.
4
Acknowledgements

5
This report presents the initial findings from the
most comprehensive survey of poverty and social
exclusion ever undertaken in Britain. The study
was undertaken by researchers at four universities
and the fieldwork was conducted during 1999 by
the Office for National Statistics. The main part of
the fieldwork, conducted during September/October
1999, was a follow-up survey of a sub-sample of
respondents to the 1998/99 General Household
Survey.
It is particularly important at this time to create a
base line understanding of the nature of poverty and
social exclusion. On any measure, poverty at the
turn of the new millennium remains one of the
greatest social problems challenging Britain, and
reducing social exclusion is at the heart of
Government policy. The current Government has
declared its determination to eradicate child poverty,
and the UK has an international commitment
substantially to reduce poverty over the coming
years. We very much hope that the Office for
National Statistics will be able to use the approach of
this project in future surveys to measure progress in
these areas.
The method used in this survey echoes, but extends,
the approach used in the Breadline Britain Surveys of
1983 and 1990. This survey measures poverty in
terms of deprivation from goods, services and
activities which the majority of the population
defines as being the necessities of modern life.
Income and employment data are incomplete proxies
for measuring poverty and inclusion and policy-
makers will need to be cautious in their
interpretation.
The data in this study will add immeasurably to our
understanding of the nature of poverty and social
exclusion in Britain. We hope that measuring
deprivation in this way will also get us beyond the
sterile arguments about whether we should be
concerned with absolute or relative poverty. This is
an absolute measure in the sense that it is concerned
with the possession or otherwise of particular goods
and services, but it is relative in the sense that the
goods and services included reflect the population’s
judgement on what it is essential to have in Britain
today.
Clearly we need to get beyond arguments about
definitions and into understandings of the nature of
poverty and deprivation that can contribute to better
policies. This study begins this process. It shows
that the proportion of households living in poverty
in terms of both low income and multiple
deprivation of necessities has increased from 14 per
cent in 1983 to 21 per cent in 1990 to over 24 per
cent in 1999. Thus about a quarter of people in
Britain are deprived on this measure, despite the
huge increase in affluence seen over the last two
decades.
There is a great deal of data to be mined from this
survey, including, but going beyond that contained
in this report. This data can inform policies aimed at
reducing the extent of poverty and social exclusion.
Further working papers and a book will be produced
by the project team over the coming months and we
hope that others will also use the rich information
that is available.
Sir Peter Barclay
Chair, Joseph Rowntree Foundation
Foreword


7
The present British Government is committed to
tackling poverty, and to abolishing child poverty in
20 years.1 If they are to succeed in these objectives
then good and up-to-date research on poverty and
social exclusion, as well as more exact measures of
trends and causes, is required. Unfortunately, in the
last 20 years there has been very little such research.
The research that forms the basis of this report is
intended to serve three purposes:
• to re-establish the long national tradition of
investigating and measuring the scale and
severity of poverty;
• to extend this tradition to the modern
investigation of social exclusion so that for the
first time the relationship between poverty and
social exclusion can be examined in depth;
• to contribute to the cross-national investigation
of these phenomena, as Britain agreed to do at
the World Summit for Social Development in
1995 (UN, 1995).
In 1998 and 1999, a team from four universities
joined with the Office for National Statistics to
undertake a survey of poverty and social exclusion,
using data from the government’s General
Household Survey (GHS) and from its Omnibus
Survey, and interviewing in more detail a sub-sample
of the GHS. This major investigation originated as a
follow-up of two earlier surveys of Breadline Britain,2
which measured the number of people who were
poor in terms of being unable to afford items that
the majority of the general public considered to be
basic necessities of life. The new survey used a
similar method to measure poverty in terms of
socially perceived necessities and added questions
relating to other measures of poverty and also to
social exclusion. The new survey is called the
Poverty and Social Exclusion Survey of Britain (PSE).
Its results show how both the perception of
necessities and the level of poverty have evolved in
the last 20 years. It starts to develop ways of
measuring social exclusion, and also includes
measures that are compatible with international
standards for measuring poverty.
This introductory chapter discusses the context of
the PSE survey: the current levels of poverty in
Britain, the ways in which poverty is defined, and
the ways it can be measured. It then gives an
overview of the approach taken in this survey. The
following chapters look at four principal features of
the results:
• the number of adults who are living in poverty,
and some of their characteristics (Chapter 2);
• the number of children who are living in
poverty, their characteristics and those of their
households (Chapter 3);
• trends over time in poverty among children and
adults (Chapter 4);
• the number of people who are socially excluded
according to various measures (Chapter 5).
Chapter 6 summarises and draws conclusions from
these findings.
The PSE survey has provided a wealth of new data
and many working papers have been written and are
still being prepared. This report is an initial analysis
to put the main headline results and conclusions
from the work into the public domain. A full list of
working papers is in Appendix 5.
1 Introduction

Current poverty levels accordingto published government data
The levels of both adult and childhood poverty in
relative terms in the UK grew during the 1980s and
1990s, reflecting the growth of inequality of income
which was "exceptional compared with international
trends" (Hills, 1998, p5). The latest figures show that
there were 14.3 million people in the UK living in
households with less than half average household
income in 1998-9 (see Figure 1). This represented a
threefold increase in both the number and the
proportion of people in relative poverty between
1979 and 1998-9 (DSS, 2000). The number of
children in households at below half average income
had grown from 1.4m to 4.4m and, by the mid-
1990s, the UK’s child poverty rate was the third
highest of the 25 nations for whom information was
available (see, for example, Bradshaw, 1999; Bradbury
and Jantii, 1999; Piachaud and Sutherland, 2000;
UNICEF, 2000).
The change, relative to average household income,
has been pronounced at the top as well as at the
bottom of the income scale. Between 1979 and
1994-5, the incomes of the richest tenth of the
population grew by 68 per cent, while those of the
poorest grew only 10 per cent, before housing costs,
and fell 8 per cent after housing costs (Hills, 1998,
p5; see also Hills, 1995 and 1996).
In the first two years of the new Government (1997-
8 and 1998-9), the disposable incomes of the
poorest and richest decile groups were still edging
apart (CSO and ONS, 1996-7, 1997-8 and 1998-9,
Table 8.3 and see also similar data for quintiles in
ONS 1998, 1999 and 2000). Neither the total
number of people nor the number of children
living in households with below half average
incomes changed significantly between 1996-7 and
1997-8 (Howarth et al., 1999, pp12, 26). However,
the number of children increased slightly from
4.4 to 4.5 million between 1997-8 and 1998-9 (DSS,
2000, p199). Evidence of the arrest or reversal of
the divergent trend, while eagerly awaited, is not
yet showing up in published survey data.
How poverty is defined andmeasured
Definitions of povertyThe picture of poverty presented above is based only
on one possible definition: the number of people
with incomes below an arbitrary percentage of the
average. The definition is convenient to
governments and international agencies because it is
fairly easy to estimate in several countries. However,
as explained below, it is not scientifically based: that
is, it is not based on independent criteria of
deprivation or disadvantage; it does not relate to the
needs of individuals, or to any agreed definition of
P O V E R T Y A N D S O C I A L E X C L U S I O N I N B R I T A I N
8
Per cent and number of individuals in households, including self-employed 1998/9,with below half average income after housing costs (Britain 1979 to 1998/9)
Figure 1:
30
25
20
15
10
5
01979 1981 1987 1988/9 1990/1 1991/2 1992/3 1993/4 1994/5 1995/6 1996/7 1997/8 1998/9
Source: DSS, 1999a, p172; DSS, 2000, p205, as kindly amended by DSS statisticians, at our request, so that the data apply throughout theseries only to the population of Britain. The FRS covers a larger representative sample of the population. It will be seen that during the twooverlapping yearsof the two surveys FRS estimated numbers were slightly larger in the first year but smaller in the second year.
Per
cen
t
30
25
20
15
10
5
0
Millio
ns
Percentage
Millions

what it is to be poor. As in the cases of radiation,
different forms of pollution and global warming,
there is a real need to develop acceptable thresholds
that lead to significant increases in risk or harm.
The income threshold for different types of
household that marks the ‘poverty line’ thus needs
to identify income levels, below which there is a
statistically enhanced risk of incurring multiple
forms of deprivation. The PSE survey attempts to do
this. It also asked questions relating to the
internationally agreed UN definitions of poverty as
shown in the box below.
9
International definitions ofpoverty
Many research studies of poverty throughout the
twentieth century illustrate an ongoing struggle to
extricate the concept of poverty from political ideology
and to widen scientific perspectives from narrow
concern with the physical and nutritional needs of
human beings to include their complex social needs.
Part of that struggle has been to find measures by
which to compare conditions in different countries, and
especially conditions in rich and poor countries, so that
priorities might be more securely established.
At the political level, there is some movement towards
agreed definitions of poverty across countries. The
United Kingdom has no official definition, and Ministers
often define poverty in terms of "knowing it when they
see it". But the Government has signed treaties and
agreements at the European level that define poverty in
terms of having insufficient resources to participate in a
"minimum acceptable way of life" (EEC, 1981, 1985),
even though the EU has reverted on occasions to the
relative income standard – that is, the number and
percentage of population with less than half, or a smaller
or larger fraction of, average household income.3
An international agreement at the Copenhagen World
Summit on Social Development in 1995 was something
of a breakthrough. By recommending a two-tier
measure of ‘absolute’ and ‘overall’ poverty to be applied
to every country, a means was found of bringing all
governments together in common purpose. An
opportunity was created of exploring the severity of
poverty according to standards that seemed to be
acceptable everywhere. Even countries where it was
assumed absolute poverty no longer existed found it
easier to accept an international two-tier approach that
self-evidently included their own conditions.
After the Copenhagen summit in 1995, 117 countries
including the UK committed themselves to eradicating
‘absolute’ and reducing ‘overall’ poverty and to drawing
up national poverty-alleviation plans (UN, 1995).
Absolute poverty is defined in terms of severe
deprivation of basic human needs. Overall poverty is a
wider measure, including not just lack of access to
basics but also lack of participation in decision-making
and in civil and to social and cultural life:
Absolute poverty:
"a condition characterised by severe deprivation of
basic human needs, including food, safe drinking
water, sanitation facilities, health, shelter,
education and information. It depends not only on
income but also on access to services." (UN,
1995, p57)
Overall poverty can take various forms including:
"lack of income and productive resources to ensure
sustainable livelihoods; hunger and malnutrition; ill
health; limited or lack of access to education and
other basic services; increased morbidity and
mortality from illness; homelessness and
inadequate housing; unsafe environments and
social discrimination and exclusion. It is also
characterised by lack of participation in decision-
making and in civil, social and cultural life. It
occurs in all countries: as mass poverty in many
developing countries, pockets of poverty amid
wealth in developed countries, loss of livelihoods as
a result of economic recession, sudden poverty as
a result of disaster or conflict, the poverty of low-
wage workers, and the utter destitution of people
who fall outside family support systems, social
institutions and safety nets." (ibid., p57)
I N T R O D U C T I O N

Operationalising the definitions: measuring povertyThere are a variety of approaches to measuring
poverty, outlined in Appendix 1. Simple measures of
poverty look only at relative income, but agreed
international definitions of poverty described in the
box on page 9 relate not just to how much money
people have, but to whether it is enough for them to
maintain a minimum acceptable way of life. Cash
income is a key factor, but is not the only indicator
of people’s access to goods and services. For
example, possession of certain kinds of assets is
equivalent to additional income; by adding to
people’s resources, it raises their living standards and
their access to goods and services. Budget standards,
defining the income needed to buy a basket of basic
goods, have a closer relationship to the ability of
people to purchase basic items. However, they do
not encompass all elements that comprise a standard
of living. Two ways of measuring low standards of
living are by looking at consumption expenditure or
using deprivation indices, based on items that people
are deprived of because they cannot afford them.
The latter are more accurate, since they give a
broader picture than simply what is being spent on
consumer goods at a moment in time, and it is this
approach that the PSE survey takes.
The PSE survey (described in the following section)
makes major use of income data from the GHS but
measures poverty in terms of both deprivation and
income level: whether people lack items that the
majority of the population perceive to be necessities,
and whether they have incomes too low to afford
them. As well as measuring poverty in these two
ways, the survey collected data relating to the UN
definitions of poverty as described in the box on
page 9 and data that can help assess whether
individuals are socially excluded. The report thus
brings together information using a variety of
poverty measures, but its main data are derived from
the investigation of socially perceived necessities.
The 1999 Poverty and SocialExclusion Survey of Britain (PSEsurvey)
The research was designed initially to replicate two
previous national surveys - known as the Breadline
Britain surveys – which had been carried out in 1983
and 1990 (Mack and Lansley, 1985; Gordon and
Pantazis, 1997). The 1999 PSE survey uses
comparable methods based on identifying the items
that a majority of the population perceive as
necessary, so that the trends spanning nearly two
decades can be described and analysed. How the
survey approached the measurement of poverty on
this basis is outlined in the box below.
P O V E R T Y A N D S O C I A L E X C L U S I O N I N B R I T A I N
10
The PSE survey approach tomeasuring poverty
The survey’s main task was to produce a measure of
poverty based on socially perceived necessities and a
scientific definition of deprivation.
This was achieved in three steps, which combined
social consensus in determining what should be
considered as necessities with scientific methods of
using this information to define poverty.
First, a representative sample of the public were
asked to indicate which items in a long list of
ordinary household goods and activities they thought
were necessities that no household or family should
be without in British society.
Second, a representative sample were asked which
items they already had and which they wanted but
could not afford. Items defined as necessities by
more than 50 per cent of the population but which
were lacked because of a shortage of money were
then used to determine deprivation.
Third, a poverty threshold was calculated. The
theoretical approach is summarised in Figure 2. Here,
individuals are scattered on the chart according to
their levels of income and living standard (which can
be thought of as the converse to the level of
deprivation). This is illustrated in Figure 2 by a cluster
of individuals with high levels of both and a cluster
with low levels of both. Fewer individuals have a high
standard of living and a low income (i.e. top left of
Figure 2) and few have a high income and low
standard of living (i.e. bottom right of Figure 2). The
optimum poverty threshold is set where statistically

In addition to this, the survey did two other things.
It used a measure of subjectively assessed poverty to
estimate how much money would be needed to
avoid absolute and overall poverty as defined at the
Copenhagen summit (see above). This involved
asking people what they considered to be the
minimum income enabling them to rise above these
two poverty levels and whether their own incomes
exceeded these levels.
The survey also made an attempt to measure social
exclusion. An extensive programme of development
work was supported by the Joseph Rowntree
Foundation that included reviews of the available
literature and instruments for measuring both
poverty and social exclusion. In addition, a series of
group discussions were held to:
• explore how people defined poverty and social
exclusion;
• develop and test new indicators of poverty and
social exclusion.
As discussed in Chapter 5, social exclusion was
looked at in four dimensions – impoverishment,
labour market exclusion, service exclusion, and
exclusion from social relations. By putting
considerable emphasis on social relations and social
I N T R O D U C T I O N
11
it maximises the differences between ‘poor’ and ‘not
poor’, and minimises the differences within these
groups. This involved looking at people’s incomes as
well as their deprivation levels. Figure 2 thus illustrates
how this approach aims to identify poverty as a
scientific phenomenon rather than just drawing an
arbitrary line.
The methodology thus combines a representative
popular basis for agreeing what are necessities, with a
scientific basis for establishing a level of poverty.
Appendix 2 sets out precisely how information on
whether people can afford socially perceived
necessities, together with information about their
incomes, was used to calculate a poverty threshold.
This is a particularly powerful approach because:
• it incorporates the views of members of the public,
rather than judgements by social scientists, about
necessary items; and
• the level of deprivation that constitutes poverty is
based on a scientific calculation, not an arbitrary
decision.
Setting a poverty thresholdFigure 2:
High
LowLow income High income
Sta
nd
ard
of
livin
g
Not poor
Poor
Poverty thresholdset too low
Optimal position ofthe poverty threshold
Poverty thresholdset too high
participation, the survey differs from most analysis,
which has focused on low income, lack of work and
area deprivation. This has largely been necessitated
by a lack of data on social relations. The PSE survey
provides an unprecedented opportunity to look at
social isolation and lack of participation, which may
correlate with or be caused by low income, non-
engagement in the labour market and service
exclusion, but is not defined by these. The
preliminary analysis presented in this report looks
separately at each of the four dimensions of social
exclusion; future analysis will look at the correlation
between different dimensions.
Notes
1 See, for example, the Prime Minister’s Beveridge Lecture on
18 March 1999 (Blair, 1999). In the 1999 pre-budget report,
the Chancellor of the Exchequer announced the Government’s
aim to halve child poverty "by the end of the next decade".
2 The first of these surveys was called "Poor Britain" and the
second "Breadline Britain" but their similarity has led to them
being referred to collectively as the Breadline Britain surveys.
3 In 1975, the Council of Europe adopted a relative definition of
poverty as: "individuals or families whose resources are so small
as to exclude them from the minimum acceptable way of life of
the Member State in which they live” (EEC, 1981). The
concept of ‘resources’ was defined as: "goods, cash income, plus
services from public and private resources" (EEC, 1981). On
19 December 1984, the European Commission extended the
definition: "the poor shall be taken to mean persons, families
and groups of persons whose resources (material, cultural and
social) are so limited as to exclude them from the minimum
acceptable way of life in the Member State in which they live"
(EEC, 1985). According to UNICEF, this definition “is today the
most commonly used definition in the industrialised world”
though “for practical purposes” it is usually interpreted as
“those whose incomes fall below half of average income”
(UNICEF, 2000, p6).
P O V E R T Y A N D S O C I A L E X C L U S I O N I N B R I T A I N
12
Data collection
The research was carried out jointly by a group of
researchers from four universities (York, Bristol,
Loughborough and Heriot-Watt) and the Office for
National Statistics (ONS). It used three sets of data:
1 The General Household Survey (GHS) of 1998-9
provided income and socio-demographic data
and the basis for selecting participants in (3)
below.
2 The ONS Omnibus Survey of June 1999 included
questions designed as part of this survey, asking
members of the public about items they
considered to be necessities.
3 A follow-up sub-sample survey of the GHS in
September/October 1999 looked at how many
people cannot afford the items identified as
necessities and also looked at both poverty and
social exclusion in greater depth.
In developing the survey, some of the new and
revised questions were also piloted in a regular
omnibus survey carried out by MORI in July 1998. A
full report of the development work can be found in
Bradshaw et al., 1998.
Appendix 4 gives further details of the data collection
methodology. This combination of sources brought
together an unprecedented level of information on a
nationally representative population in a single data set.
How many adults in Britain are poor and what are
their characteristics? This chapter answers this
question mainly by assessing who can be defined as
poor based on whether they can afford socially
perceived necessities. In the final section, it also
looks at how many people define themselves as poor.
The analysis starts off, in the following section, by
looking at how many adults cannot afford things
that are considered by the majority of the general
public to be necessary items. Second, it calculates
how many can be considered poor on the basis of
being deprived of these items. The chapter’s third
section examines a wide range of social and
economic characteristics of people who are classified
as poor in these terms. The fourth section goes on to
look at their attitudes and experiences – including
the extent to which those defined by society as poor
(or not) actually feel poor themselves. The final
section looks separately and in more detail at this
‘subjective’ poverty, by measuring people’s incomes
against what they think is necessary to escape
poverty according to three alternative definitions.
What items constitute thenecessities of modern life?
What does a representative sample of the population
believe to be the basic necessities of modern life?
And how many people say they are unable to afford
them?
Table 1 (page 14) ranks the percentage of
respondents identifying different adult items as
‘necessary’ in 1999. Over 90 per cent of the
population in each case perceive ‘beds and bedding
for everyone’, ‘heating to warm living areas of the
home’, a ‘damp-free home’, ‘visiting friends or family
in hospital’ and ‘medicines prescribed by doctor’ as
items which adults should have in Britain. By
contrast, less than 10 per cent of the population sees
a dishwasher, a mobile phone, Internet access or
satellite television as necessary. Because goods
introduced into the market often start as luxuries
and, in later years, become necessities, we were
anxious to test opinion about certain items that
today are still only accessed by a minority.
As in the previous Breadline Britain surveys, items
attracting 50 per cent or more support from the
population, a ‘democratic’ majority, were considered
as socially perceived necessities for the purposes of
further analysis. In 1999, 35 of the 54 items in the
adult list (Table 1) satisfied this criterion. This is
important evidence that can help resolve public
debate about what are and what are not the
necessities of modern life. It also opens the way to
searching investigation of the circumstances of those
who lack a number or many of these necessities and
particularly of those who identify them as
necessities but do not have them and/or say they
cannot afford them.
2 Adult poverty in Britain
13
The method used to define thenecessities of life and how manypeople lack them
The first stage of the research was to ask members
of the general public about what items and activities
they consider to define the living standards that
everyone in Britain ought to be able to reach. The
Office for National Statistics Omnibus Survey, in June
1999, asked a representative sample of people aged
16 and over to classify various items and activities.
They had to sort cards containing 39 items and 15
activities relating to households, and 23 items and
seven activities relating to children, into one of two
categories. They were asked:
"I would like you to indicate the living standards
you feel all adults (and children) should have in

P O V E R T Y A N D S O C I A L E X C L U S I O N I N B R I T A I N
14
Britain today. Box A is for items which you think
are necessary, which all adults should be able to
afford and which they should not have to do
without. Box B is for items which may be
desirable but are not necessary."
This approach extended the methodology of the 1983
and 1990 Breadline Britain studies by adding items to
the list of indicators of necessities – prompted partly by
intervening research into social conditions, consumer
behaviour and household interaction. The additional
questions are to do mainly with goods and activities
that are particularly relevant to children (see the next
chapter) but also with social activities (which were
relatively few in number in the first two surveys).
Having established, from the Omnibus Survey, which
items more than 50 per cent of the population
considered necessary, the main PSE survey, carried out
later in 1999, sought to establish which sections of the
population have these necessities and which sections
cannot afford them. Respondents were asked:
"Now I’d like to show you a list of items and
activities that relate to our standard of living.
Please tell me which item you have or do not have
by placing the cards on: Pile A for the items you
have; Pile B for items you don’t have but don’t
want; and Pile C for items you do not have and
can’t afford."
Table 1: Perception of adult necessities and how many people lackthem (all figures show % of adult population)
Omnibus Survey: Main stage survey:
items considered items that respondents
Necessary Not necessary Don’t have, Don’t have,
don’t want can’t afford
(%) (%) (%) (%)
Beds and bedding for everyone 95 4 0.2 1
Heating to warm living areas of the home 94 5 0.4 1
Damp-free home 93 6 3 6
Visiting friends or family in hospital 92 7 8 3
Two meals a day 91 9 3 1
Medicines prescribed by doctor 90 9 5 1
Refrigerator 89 11 1 0.1
Fresh fruit and vegetables daily 86 13 7 4
Warm, waterproof coat 85 14 2 4
Replace or repair broken electrical goods 85 14 6 12
Visits to friends or family 84 15 3 2
Celebrations on special occasions such
as Christmas 83 16 2 2
Money to keep home in a decent state
of decoration 82 17 2 14
Visits to school, e.g. sports day 81 17 33 2
Attending weddings, funerals 80 19 3 3
Meat, fish or vegetarian equivalent
every other day 79 19 4 3
Insurance of contents of dwelling 79 20 5 8
Hobby or leisure activity 78 20 12 7
Washing machine 76 22 3 1
Collect children from school 75 23 36 2

A D U L T P O V E R T Y I N B R I T A I N
15
Table 1 Continued
Omnibus Survey: Main stage survey:
items considered items that respondents
Necessary Not necessary Don’t have, Don’t have,
don’t want can’t afford
(%) (%) (%) (%)
Telephone 71 28 1 1
Appropriate clothes for job interviews 69 28 13 4
Deep freezer/fridge freezer 68 30 3 2
Carpets in living rooms and bedrooms 67 31 2 3
Regular savings (of £10 per month)
for rainy days or retirement 66 32 7 25
Two pairs of all-weather shoes 64 34 4 5
Friends or family round for a meal 64 34 10 6
A small amount of money to spend
on self weekly not on family 59 39 3 13
Television 56 43 1 1
Roast joint/vegetarian equivalent once a week 56 41 11 3
Presents for friends/family once a year 56 42 1 3
Holiday away from home once a year
not with relatives 55 43 14 18
Replace worn out furniture 54 43 6 12
Dictionary 53 44 6 5
An outfit for social occasions 51 46 4 4
New, not second-hand, clothes 48 49 4 5
Attending place of worship 42 55 65 1
Car 38 59 12 10
Coach/train fares to visit friends/family quarterly 38 58 49 16
An evening out once a fortnight 37 56 22 15
Dressing gown 34 63 12 6
Having a daily newspaper 30 66 37 4
A meal in a restaurant/pub monthly 26 71 20 18
Microwave oven 23 73 16 3
Tumble dryer 20 75 33 7
Going to the pub once a fortnight 20 76 42 10
Video cassette recorder 19 78 7 2
Holidays abroad once a year 19 77 25 27
CD player 12 84 19 7
Home computer 11 85 42 15
Dishwasher 7 88 57 11
Mobile phone 7 88 48 7
Access to the Internet 6 89 54 16
Satellite television 5 90 56 7
Note: Percentage of people answering ‘Don’t know’ not shown in table.
It is clear from the results in Table 1 that the general
public holds ideas about the necessities of life that
are more wide-ranging, or multidimensional, than is
ordinarily represented in expert or political
assessments. People of all ages and walks of life do
not restrict their interpretation of ‘necessities’ to the
basic material needs of a subsistence diet, shelter,
clothing and fuel. There are social customs,
obligations and activities that substantial majorities of
the population also identify as among the top
necessities of life.
Among the customs are ‘celebrations on special
occasions such as Christmas’ (83 per cent) and
‘attending weddings and funerals’ (80 per cent). There
are ‘presents for friends/family once a year’ (56 per
cent). There are regular events to do with food, like a
‘roast joint or the vegetarian equivalent once a week’
(56 per cent), which extend our ideas of dietary needs
well beyond the provision of the minimal calories
required for physiological efficiency. The views on
clothing needs extend ideas about basic cover to
include ‘a warm, waterproof coat’ (85 per cent) and
‘two pairs of all-weather shoes’ (64 per cent).
Among the obligations and activities described as
necessary are not just those which seem on the face
of it to satisfy individual physiological survival and
individual occupation – like a ‘hobby or leisure
activity’ (78 per cent). They also include joint
activities with friends and within families such as
‘visits to friends or family’ (84 per cent), especially
those in hospital (92 per cent). They involve
reciprocation and care of, or service for, others.
People recognise the need to have friends or family
round for a meal (64 per cent), for example.
What is striking is the strength of public
acknowledgement that such social activities take
their place among the ‘necessities’ of life. Analysis of
the survey results showed that slightly more people
specified one or more social activities among the
necessities of life (95 per cent) than those specifying
one or more items to do with housing, food, clothing
and consumer durables, for example.
The Breadline Britain surveys of 1983 and 1990,
forerunners of the present survey, had already
confirmed that perceptions of ‘necessities’ were more
broadly based than the corresponding assessments
made by many economists and by governments in
their policies and legislation. However, the evidence
they had unearthed was treated with scepticism in
some quarters. Perhaps because indicators of social
deprivation were relatively few, compared with those
of material deprivation, the implications of the
conclusions may not have been fully grasped.
Another related interpretation of these results is that
the public’s perception of necessities reflects the
conditions and dependencies of contemporary life –
whether these are created by what is available in the
market or by developments in social structure and
interaction. Necessities are perceived relative to
contemporary conditions. The evidence for this
conclusion comes primarily from the comparative
analysis of the successive surveys of 1983, 1990 and
1999 (see Chapter 4).
The ‘consensual’ approach to poverty assumes that
there are few differences across different sections of
the population over what they perceive as the
necessities of life. We examined the extent to which
this assumption held true in 1999 by examining how
judgements varied amongst different groups.
Although some important differences were
highlighted, there was a remarkable homogeneity of
views found between people of different age and
gender, and among different socio-economic groups.
Despite the differences, we can still talk of a social
‘consensus’ about necessary items for three reasons:
• the differences were relatively small - there was
greater consensus about national living standards
than there was common experience of those
standards;
• much of the difference between groups was due
to a smaller percentage of one group rating each
item as necessary, rather than ranking the items
in a different order;
• in very few cases did these differences affect
whether or not 50 per cent of the groups
classified an item as ‘necessary’.
P O V E R T Y A N D S O C I A L E X C L U S I O N I N B R I T A I N
16

For those items that the majority of the population
thought were necessities, the PSE survey identified
how many people have them and how many cannot
afford them. The results are summarised in the
third and fourth columns of Table 1. It is to be
expected that those items the population are less
likely to nominate as necessities are those that
respondents to the PSE survey were most likely to
say that they ‘don’t have, don’t want’ and ‘don’t
have, can’t afford’. However, four items were each
owned by at least 80 per cent of respondents even
though they were not considered necessities by the
majority: ‘new, not second-hand clothes’, a video
cassette recorder, a dressing gown and a microwave
oven. Clearly, even though these are not considered
necessary, most people want and possess them.
Conversely, there were some items which at least
three-quarters of people consider necessary, but
significant numbers are unable to afford: 6 per cent
cannot afford a damp-free home, 12 per cent cannot
afford to replace or repair broken electrical goods,
14 per cent do not have money to keep their home
in a decent state of decoration, and 8 per cent
cannot afford home contents insurance. However,
of all the items considered a necessity by the
majority of the population, the greatest number of
people, 25 per cent, cannot afford regular savings (of
£10 per month) for a rainy day or retirement,
followed by 18 per cent who cannot afford a holiday
away from home.
How many people are poor?
From the list of items in Table 1, we selected the 35
items considered by 50 per cent or more of
respondents to be necessary for an acceptable
standard of living in Britain at the end of the
twentieth century. For each respondent, we then
calculated the number of items that they did not
have and could not afford. It can be seen, in Table 2,
that 58 per cent were lacking no items because they
could not afford them. A further 14 per cent were
lacking only one of the items. The greatest number
of items lacking was 21, by one respondent.
17
Differences in views of whatconstitute the necessities of life
The main conclusion from the survey was a
remarkable similarity of views between different
groups. However, some differences are worth
noting.
Poorer groups were sometimes more likely than the
better-off groups to consider certain items to be
necessities: there was a marked difference, for
example, in the case of carpets in living rooms and
bedrooms and a television. Such differences seem to
be partly explained by circumstances – more of the
rich than of the poor live in centrally heated rooms,
and fewer may consider carpets to be a necessity, for
example.
Men were generally more likely than women to
specify some items and activities as essential,
particularly those relating to personal consumption.
Examples were ‘having a small amount of money to
spend each week on yourself, not on your family’,
‘new, not second-hand clothes’ and ‘going to the pub
once a fortnight’. This confirms previous research
showing that women and men can have different
priorities (Nyman, 1996; Payne and Pantazis, 1997;
Goode et al., 1998).
Unsurprisingly, people aged over 30 considered, on
average, more goods and activities as necessary than
younger people (16 to 30 years). They were
significantly more likely, for example, to consider a
‘roast joint or its vegetarian equivalent’ and a dressing
gown as essential. Whilst there may exist important
factors that account for individual differences, strong
cultural shifts from one generation to the next may
explain why younger people were generally inclined
to choose fewer items as necessities of life. Chapter
4 examines in greater detail the finding that younger
people seem to be making a more restricted choice
of necessities than in the past.
A D U L T P O V E R T Y I N B R I T A I N

P O V E R T Y A N D S O C I A L E X C L U S I O N I N B R I T A I N
18
Table 2: Number of itemsrespondents ‘don’t have, can’tafford’
Items Number (%) Cumulative
lacking %
0 891 58.1 58.1
1 218 14.2 72.3
2 87 5.7 78.0
3 73 4.8 82.8
4 50 3.2 86.0
5 34 2.2 88.3
6 32 2.1 90.4
7 22 1.4 91.8
8 19 1.3 93.0
9 22 1.4 94.5
10 18 1.2 95.7
11 13 0.8 96.5
12 11 0.7 97.2
13 17 1.1 98.3
14 10 0.6 99.0
15 7 0.5 99.4
16 2 0.1 99.6
17 2 0.2 99.7
18 2 0.1 99.8
19 1 0.1 99.9
21 1 0.0 100.0
Total 1534 100.0 100.0
The approach used todetermine how many peopleare poor
A statistical analysis indicated that six of the items did
not add to the reliability or validity of the definition
of deprivation of necessities in terms of distinguishing
between rich and poor. These items – a television, a
fridge, beds and bedding for everyone, a washing
machine, medicines prescribed by a doctor, and a
deep freezer/fridge freezer – were therefore dropped
from the analysis. The statistical approach outlined in
the introduction to establish an optimal poverty
threshold then showed that an enforced lack of two
necessities and a low income best discriminated
between being ‘poor’ and ‘not poor’ (see Appendix 2
for details).
On this basis, people could be considered to be
‘poor’ if there were at least two socially defined
necessities that they were unable to afford; otherwise
they could be classified as ‘not poor’. However, two
further considerations are necessary, based on
relationships between deprivation of necessities and
incomes:
• Some people were unable to afford two
necessities, but had relatively high incomes.
These people could be classified as having risen
out of poverty recently – for example, they had
got a job but had not yet been able to buy all the
basics.
• Some people did not lack two or more
necessities, but had relatively low incomes.
These could be classified as being vulnerable to
poverty – for example, they may have recently
seen their incomes fall through losing a job, but
have not yet lost some of the items perceived to
be necessities of life.
Therefore four groups can actually be defined –
‘poor’, ‘those vulnerable to poverty’, ‘those who
have recently risen out of poverty’ and ‘those who
are not poor’.
Table 3: PSE survey povertyclassifications
Number %
Poor 393 25.6
Vulnerable to poverty 158 10.3
Risen out of poverty 28 1.8
Not poor 955 62.2
Total 1534 100.0

On the basis of possession of necessities only, Table 2
shows that just over 72 per cent of people would be
classified as not poor and just under 28 per cent as
poor, with a poverty threshold set at being unable to
afford two or more necessities (see box on page 18).
However, 10 per cent had low enough incomes to
make them vulnerable to poverty. Included in the
28 per cent who would have been classified as poor, on
the basis of lacking two or more necessities, are around
2 per cent who had high enough incomes to suggest
they had risen out of poverty, so that deprivation of
these necessities did not seem likely to persist. This
produces the four categories shown in Table 3.
The rest of this chapter concentrates on the 26 per
cent whom this analysis has identified as poor.
19
Table 4: Who are the poor?
Poverty rate Poverty proportion Number Significance
(% in poverty) (% of all in poverty) (see key p22)
All 25.6 100 1534
Gender of respondent **
Male 22 42 740
Female 29 58 794
Number of adults in the household ***
1 38 32 332
2 22 50 919
3+ 25 18 282
Number of children
in the household ***
0 22 56 994
1 29 16 210
2 29 16 217
3+ 46 13 113
Age of the youngest child ***
0-4 41 48 206
5-11 35 35 175
12-15 20 11 94
16+ 18 7 67
Age of respondent ***
16-24 34 11 126
25-34 38 27 284
35-44 20 14 262
45-54 25 16 253
55-64 20 14 262
65-74 21 10 195
75+ 21 8 154
A D U L T P O V E R T Y I N B R I T A I N

P O V E R T Y A N D S O C I A L E X C L U S I O N I N B R I T A I N
20
Table 4 Continued
Poverty rate Poverty proportion Number Significance
(% in poverty) (% of all in poverty) (see key p22)
Age respondent completed education ***
<16 30 30 344
16 33 31 311
17 27 9 120
18 24 8 111
19+ 17 22 426
Region **
North East 20 5 92
North West 19 5 105
Merseyside 29 3 41
Yorks and Humberside 27 9 124
East Midlands 23 7 124
West Midlands 38 15 154
Eastern 18 6 132
London 30 12 155
South East 22 11 205
South West 24 9 147
Wales 35 10 116
Scotland 22 8 137
Longstanding illness/disability in the household **
No 23 57 963
Yes 30 44 571
Ethnicity ***
White 24 89 1466
Black (71) (3) (17)
Indian (37) (2) (19)
Bangladeshi (92) (3) (13)
Other (50) (3) (20)
Employment status of household ***
1 worker 28 26 361
2 workers 14 19 520
3 workers 23 8 141
No workers – retired 23 21 354
No workers - sick/disabled 61 10 62
No workers – unemployed 77 10 48
No workers – other 76 8 38
21
Table 4 Continued
Poverty rate Poverty proportion Number Significance
(% in poverty) (% of all in poverty) (see key p22)
Marital status of respondent ***
Single 31 19 236
Married 20 45 894
Cohabiting 31 11 139
Separated/divorced 46 16 135
Widowed 30 10 131
Household composition ***
Single adult 32 22 274
Lone parent +1 child 66 5 29
Lone parent +2 children 62 3 21
Lone parent +3+ children (89) (2) (9)
Couple 15 18 485
Couple +1 child 24 7 108
Couple +2 children 26 11 172
Couple +3 children 39 6 57
Couple +4+ children 29 2 21
2 or more adults no children 34 6 71
2 or more adults with children 52 4 33
Couple with one or
more adults no children 21 9 159
Couple with one or
more adults and 1 child 13 2 56
Couple with one or
more adults and 2+ children 37 4 41
Tenure ***
Outright owner 15 17 464
Owner with mortgage 19 35 704
Private tenant/other 33 9 110
Housing association tenant 57 10 71
Local authority tenant 61 29 185
Receiving Income Support and Jobseeker’s Allowance ***
No 21 73 1382
Yes 70 27 152
Household income ***
Below 60% PSE
equivalent income 53 57 373
Below 50% PSE
equivalent income 53 44 279
Below 40% PSE
equivalent income 59 31 180
A D U L T P O V E R T Y I N B R I T A I N

P O V E R T Y A N D S O C I A L E X C L U S I O N I N B R I T A I N
22
Table 4 Continued
Poverty rate Poverty proportion Number Significance
(% in poverty) (% of all in poverty) (see key below)
Quintile of PSE equivalent income ***
5 (highest) 0.6 0.6 197
4 17 15 266
3 24 19 266
2 40 31 301
1 (lowest) 59 34 309
How far do you think you are
above or below the level
of income that is necessary
to keep a household such as the
one you live in out of poverty? ***
A lot above that level 5 6 470
A little above that level 17 17 412
About the same 38 19 189
A little below that level 52 17 126
A lot below that level 85 29 134
Don’t know 24 12 196
How far above or below the level
of absolute poverty would you say
your household is? ***
A lot above that level 8 15 702
A little above that level 25 20 307
About the same 43 12 108
A little below that level 74 19 102
A lot below that level 79 23 115
Don’t know 22 11 192
How far above or below the level
of overall poverty would you say
your household is? ***
A lot above that level 4 5 525
A little above that level 16 14 339
About the same 27 7 107
A little below that level 54 19 138
A lot below that level 80 40 196
Don’t know 25 14 221
Key to significance levels: * < 0.05; **< 0.01; ***< 0.001
Note: Figures in brackets are based on twenty cases or fewer and are not reliable. All data in table are weighted

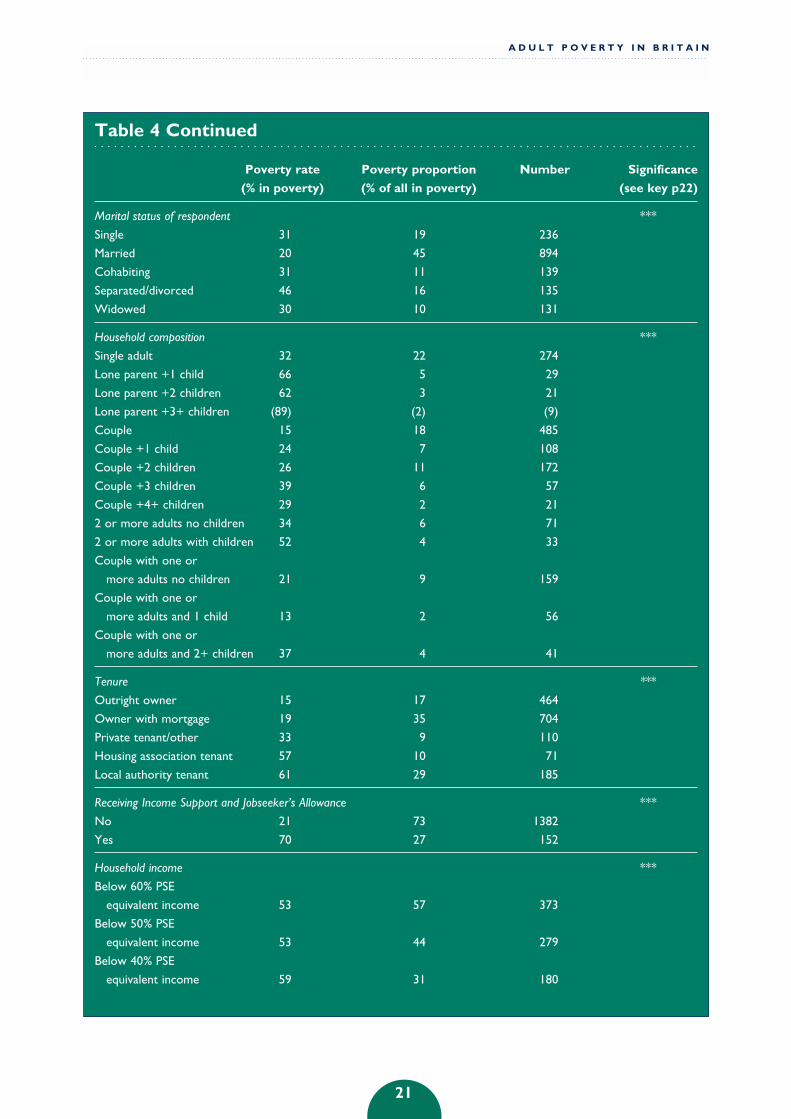
Who is poor?
Table 4 shows how the poverty rate (the percentage
who are poor) varies according to the characteristics
of the individual and the household they are living
in. Thus, for example, in the second column, 22 per
cent of male respondents were poor compared with
29 per cent of female respondents - confirming that
poverty is more common for women. The third
column shows the poverty proportion - what
proportion of all the poor is made up of
individuals/households with a given characteristic.
So, for example, married people make up 45 per cent
of all the poor, although the chances of a married
person being poor is lower than average, at 20 per
cent. The fourth column gives the number of people
in the survey who were in the group; where this was
below 20, the figures are in brackets to emphasise
that the sample is too small to make reliable
predictions for the whole population. For example,
the poverty rates for the non-white ethnic groups are
not reliable. The final column gives the level of the
significance of the difference between the poverty
rates observed.
For all respondents the average proportion of people
who are poor is 25.6 per cent. There are some groups
where the proportion is more than double this
average rate:
• non-retired people who are not working because
they are unemployed (77 per cent) or
sick/disabled (61 per cent);
• those on income support (70 per cent);
• lone parents (62 per cent);
• Local authority tenants (61 per cent) and housing
association tenants (57 per cent).
Although the number of respondents in the non-
white ethnic groups is very small, the results indicate
a much higher poverty rate for non-white ethnic
groups especially among the Bangladeshi and Black
ethnic groups.
Divorced or separated people are more likely to be poor
(46 per cent) and there are also higher proportions of
poor people in households of certain types:
• those with 3+ children (46 per cent);
• those with youngest child aged 0-4 (41 per cent) or
aged 5-11 (35 per cent);
• households with one adult (38 per cent).
Younger people are also more likely to be poor:
• 16- to 24-year-olds (34 per cent);
• 25- to 34-year-olds (38 per cent).
Slightly greater proportions of those finishing
education below age 16 are poor (30 per cent) and
those staying on to age 19 or above are much less
likely to be poor (17 per cent).
In many ways, the data confirm other research in
identifying the poorer groups. The survey also
contained some questions on health perceptions that
confirm an association between poverty and poor
health. General Health Questionnaire (GHQ 12)
scores are a measure of subjective well-being - the
higher the score, the worse the well-being. Poor
people scored 25.7 on average, compared with 22.0
on average for non-poor people. This difference is
statistically significant at the 99.9 per cent level.
Of course, these socio-economic and demographic
characteristics are not independent of each other: for
example, being in receipt of Income Support is
associated with being a lone parent or unemployed.
The odds of living in poverty, independent of the
other variables, can be calculated using multivariate
analysis. This requires some of the categories to be
somewhat differently defined to ensure sample sizes
large enough to make the analysis valid. The results
of this analysis are listed in Table 5.
The results show the effect of certain factors on the
odds of being poor. In the first column (‘bivariate’
results), these relative odds are compared without
taking account of any of the other variables. Relative
odds in this case compare the chance of being poor
with the odds of not being poor. So, for example,
men have a 22 per cent chance of being poor and a
78 per cent of not, or relative odds of about 1:3.5.
For women it is 29 per cent to 71 per cent, or 1:2.4.
So women’s relative odds of being poor are just over
40 per cent worse than those for men.
23
A D U L T P O V E R T Y I N B R I T A I N

These differences are not large enough to be
statistically significant in all cases – i.e. to be able to
predict from the sample that there will be such a
difference in the whole population. Where there is
a significant difference, asterisks show the level of
significance. For example, households with ‘no
worker – unemployed, sick or other’ are more than
12 times more likely to be poor than households
with two workers.
The second and third columns in Table 5 show the
‘multivariate’ results – the relative odds independent
of the differences produced by interaction with other
variables using two different models. The
multivariate analysis requires there to be one
measure of income only. There are two proxy
measures for income in the analysis – income
quintile and Income Support. The model in the
second column therefore controls for all variables
except Income Support and that in the third column
controls for all variables except for income quintile
and age completed education. In the former, the
number of children, number of adults, marital status,
household structure, region, age leaving full-time
education and ethnicity no longer make a significant
difference to the number in poverty. In the latter,
some of these – marital status, household structure,
region and ethnicity – once again have an impact.
These results suggest that many of the demographic
characteristics that appear to be associated with
poverty in Table 4 have this association mainly
because they are associated with relatively low
income. They therefore cease to have a significant
P O V E R T Y A N D S O C I A L E X C L U S I O N I N B R I T A I N
24
The problems of measuring lowincome
There are some interesting results in terms of the
relationship of income to poverty that show what
reservations have to be made about the
comprehensiveness of narrow income measures on their
own for identifying poor people and housholds. As
would be expected, those in the lower two-fifths of the
income distribution have a greater probability of being
poor (59 per cent for the lowest fifth and 40 per cent
for the second lowest). However, this means that over
40 per cent of the poorest fifth are not poor in terms of
not suffering from multiple deprivation and that nearly a
quarter of those in the middle fifth of the income
distribution are poor in these terms. This finding
highlights the difficulties that can arise when trying to
measure poverty using just a single measure of income,
taken at one point in time. A household’s income levels
may change rapidly from one week to the next but it is a
household’s command of financial resources over time
that will determine if it becomes ‘poor’ or not.
There was a closer relationship between subjective
assessments of the adequacy of income in relation to
definitions of poverty lines and actually being poor.
Eighty-five per cent of those who felt their income was
a lot below what was necessary to keep households
like theirs out of poverty were actually poor in terms
of having both a low income and suffering from multiple
deprivation of necessities. Eighty per cent of those
who felt their income level was a lot below what would
be necessary to keep households like theirs above the
UN’s definition of overall poverty were actually poor.
Nearly four-fifths of those who thought their income
level was a lot or a little below what would be
necessary to pass above the UN’s narrower definition
of absolute poverty were also poor in these terms.
This suggests that simple measurements of subjective
poverty may be valuable in helping to understand the
prevalence of poverty.
This partially reflects the fact that on average the
income of those who are poor is below that of those
who are not poor. Using a variety of scales for
equivalent income the data show that the average
income of the poor who lack necessities is about half
that of people who are not poor in this sense:
Poor Not poor
Equivalent weekly income
(PSE scale) £183 £382
Equivalent weekly income
(HBAI scale) £205 £409
Equivalent weekly income
(modified OECD scale) £133 £267
(These differences are all statistically significant at the
0.001 per cent level.)

25
Table 5: The relative odds of being poor
Bivariate: not taking Multivariate: controlling Multivariate: controlling
account of other for other variables for other variables
variables (except whether on (except income quintile
Income Support) and education)
Gender of respondent
Male 1.00 1.00 1.00
Female 1.42** 1.38* 1.37*
Number of children in the household
0 1.00
1 1.45*
2 1.43*
3+ 3.02***
Number of adults in the household
1 2.23***
2 1.00
3+ 1.17
Age of respondent
16-24 2.04** 4.81*** 4.00**
25-34 2.44*** 8.91*** 4.57***
35-44 1.00 2.64* 1.51
45-54 1.35 6.26*** 2.47**
55-64 1.02 3.31** 1.81
65-74 1.08 2.42** 1.54
75+ 1.00 1.00 1.00
Employment status of household
1 worker 2.05*** 1.84** 2.27***
2+ workers 1.00 1.00 1.00
No workers - retired 1.58** 1.57 3.81**
No workers - unemployed,
sick or other 12.92*** 3.68*** 6.49***
Marital status of respondent
Single 1.90*** 1.00
Married 1.00 2.73**
Cohabiting 1.85** 3.07**
Separated/divorced 3.52*** 1.84
Widowed 1.73** 1.26
Household composition
Single 2.67*** 3.17**
Couple 1.00 1.00
Couple with children 2.16*** 2.55***
Lone parent with children 11.66*** 5.55***
Other 2.13*** 2.88***
A D U L T P O V E R T Y I N B R I T A I N
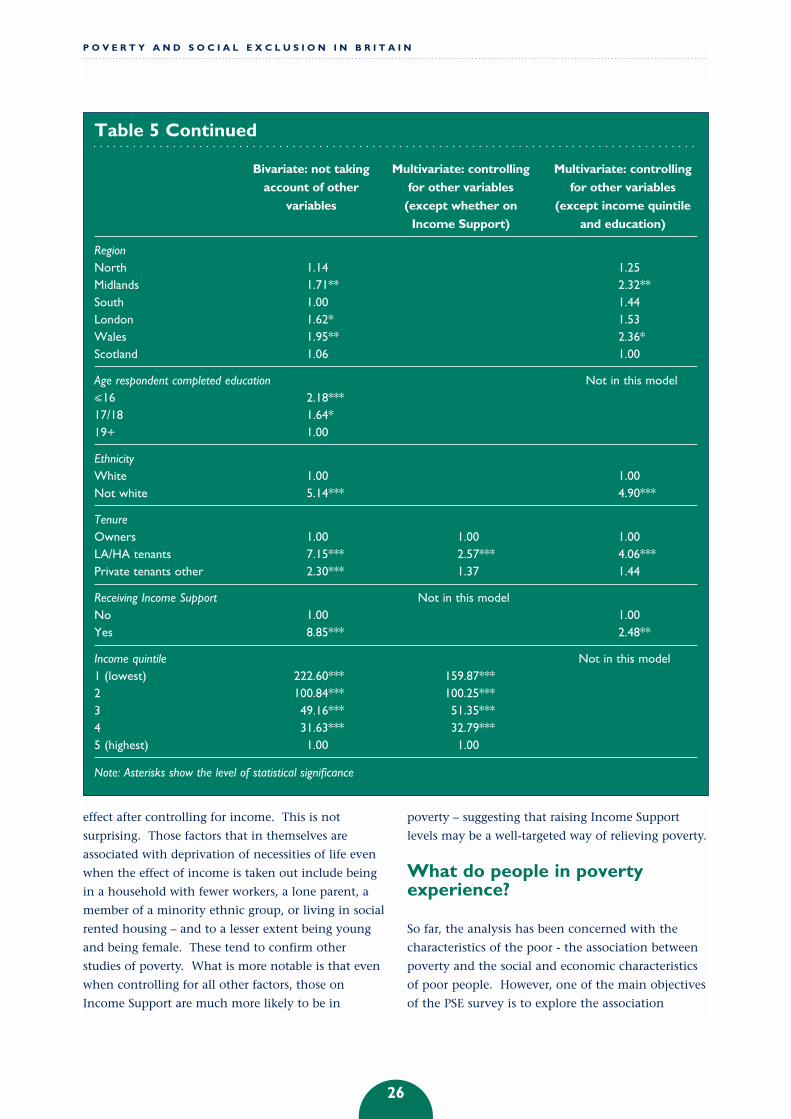
effect after controlling for income. This is not
surprising. Those factors that in themselves are
associated with deprivation of necessities of life even
when the effect of income is taken out include being
in a household with fewer workers, a lone parent, a
member of a minority ethnic group, or living in social
rented housing – and to a lesser extent being young
and being female. These tend to confirm other
studies of poverty. What is more notable is that even
when controlling for all other factors, those on
Income Support are much more likely to be in
poverty – suggesting that raising Income Support
levels may be a well-targeted way of relieving poverty.
What do people in povertyexperience?
So far, the analysis has been concerned with the
characteristics of the poor - the association between
poverty and the social and economic characteristics
of poor people. However, one of the main objectives
of the PSE survey is to explore the association
P O V E R T Y A N D S O C I A L E X C L U S I O N I N B R I T A I N
26
Table 5 Continued
Bivariate: not taking Multivariate: controlling Multivariate: controlling
account of other for other variables for other variables
variables (except whether on (except income quintile
Income Support) and education)
RegionNorth 1.14 1.25Midlands 1.71** 2.32**South 1.00 1.44London 1.62* 1.53Wales 1.95** 2.36*Scotland 1.06 1.00
Age respondent completed education Not in this model<16 2.18***17/18 1.64*19+ 1.00
EthnicityWhite 1.00 1.00Not white 5.14*** 4.90***
TenureOwners 1.00 1.00 1.00LA/HA tenants 7.15*** 2.57*** 4.06***Private tenants other 2.30*** 1.37 1.44
Receiving Income Support Not in this modelNo 1.00 1.00Yes 8.85*** 2.48**
Income quintile Not in this model1 (lowest) 222.60*** 159.87***2 100.84*** 100.25***3 49.16*** 51.35***4 31.63*** 32.79***5 (highest) 1.00 1.00
Note: Asterisks show the level of statistical significance

between poverty and other experiences, including
social exclusion. Social exclusion is analysed more
fully in Chapter 5. In this section, selected data
collected in the PSE survey are used to explore the
relationship between being poor and other
experiences. They are summarised in Table 6.
The first two questions are concerned with
perceptions of the experience of poverty now and in
the past. (Subjective perceptions of poverty using
several definitions are also explored further in the
next section: these questions simply asked people
about whether they felt poor without defining what
poor means.) It is not surprising that most of those
who say that they are ‘poor all the time’ (86 per
cent) were found in the survey to be poor. However,
it is more surprising that, of those who say they are
‘never poor’, 11 per cent were found to be poor in
terms of lacking necessities and they constitute
nearly a third of poor people. These results indicate
27
A D U L T P O V E R T Y I N B R I T A I N
Table 6: Experiences and attitudes of people in poverty
Table 6a: Subjective personal experience and expectations ofpoverty
Proportion of those Proportion of poor Number of Significance
answering this way people who answer people answering (see key
who are poor this way this way p29)
Do you think that you can genuinely say you are poor
All the time? 86 23 102 ***
Sometimes? 58 45 302
Never? 11 32 1120
Looking back over your life, how often have there been times in your life
when you think you have lived in poverty by the standards of that time?
Never 14 33 906 ***
Rarely 30 15 200
Occasionally 44 33 291
Often 56 15 105
Most of the time 59 4 29
Has anything happened recently (in the last two years) in your life which has
Improved your standard of living? 17 12 272
Reduced your standard of living? 54 21 152
Increased your income? 19 17 366
Reduced your income? 41 24 235
None of these? 24 48 791
Is there anything that you expect to happen in the near future (in the next two years) in your life which will
Improve your standard of living? 32 19 232
Reduce your standard of living? 39 10 95
Increase your income? 28 24 338
Reduce your income? 26 9 128
None of these? 23 55 920
Note: Proportions add to more than 100 because multiple responses possible
Table 6 continues overleaf

28
Table 6b: Perception of poverty and its causes in Britain in general
Proportion of those Proportion of poor Number of people Significance
answering this way people who answer answering this way (see key p29)
who are poor this way
Over the last ten years, do you think poverty has been
Increasing? 30 52 670 ***
Decreasing? 16 13 301
Staying about the same? 22 26 462
Don’t know 29 7 100
Over the next ten years, do you think poverty will
Increase? 30 46 610 ***
Decrease? 18 16 353
Stay at the same level? 24 28 435
Don’t know 29 7 100
Why, in your opinion, are there people who live in need?
Because they have been unlucky 24 12 192 NS
Because of laziness and
lack of willpower 21 23 409
Because there is much
injustice in our society 28 35 476
It’s an inevitable part
of modern progress 25 24 362
None of these 27 6 78
Table 6c: Security and satisfaction with area you live in
Proportion of those Proportion of poor Number of people Significance
answering this way people who answer answering this way (see key p29)
who are poor this way
How satisfied are you with this area as a place to live?
Very satisfied 19 41 843 ***
Fairly satisfied 29 35 472
Neither satisfied nor dissatisfied 48 7 61
Slightly dissatisfied 41 11 104
Very dissatisfied 48 6 52
How safe do you feel walking alone in this area after dark?
Very safe 17 18 397 ***
Fairly safe 26 45 676
A bit unsafe 30 27 349
Very unsafe 38 10 105
How safe do you feel when you are alone in your home at night?
Very safe 21 44 812 ***
Fairly safe 27 39 561
A bit unsafe 44 14 124
Very unsafe 45 4 31
P O V E R T Y A N D S O C I A L E X C L U S I O N I N B R I T A I N
that some people have relatively low expectations in
that they do not consider themselves poor even
though they lack necessities of life.
There is also a strong relationship between poverty in
the present and people’s experiences of lifetime
poverty. The more often they believe that they have
been poor in the past, the more likely they are to be
found to be poor at present.
Half of people who had experienced a reduction in
their standard of living in the last two years were now
poor. Those who expected a change in their standard
of living were more likely to be poor – whether the
change was expected to be upwards or downwards.
The other questions reviewed in Table 6 show that:
• Poor people are more likely than others to blame
injustice, and less likely to blame laziness and a
lack of will-power, for the fact that people live in
need. Nevertheless, most poor people do not
blame injustice. Nearly a quarter do blame laziness
and lack of will-power and a further quarter think
it is an inevitable result of modern progress.
• People whose satisfaction with their local
environment is low are more likely to be poor.
Those who are dissatisfied with their area, or
who feel unsafe walking about their
neighbourhood or being alone in their homes,
are more likely than average to live in poverty.
Note, however, that this does not mean that
most poor people are dissatisfied in these ways:
although, for example, nearly half of the people
A D U L T P O V E R T Y I N B R I T A I N
29
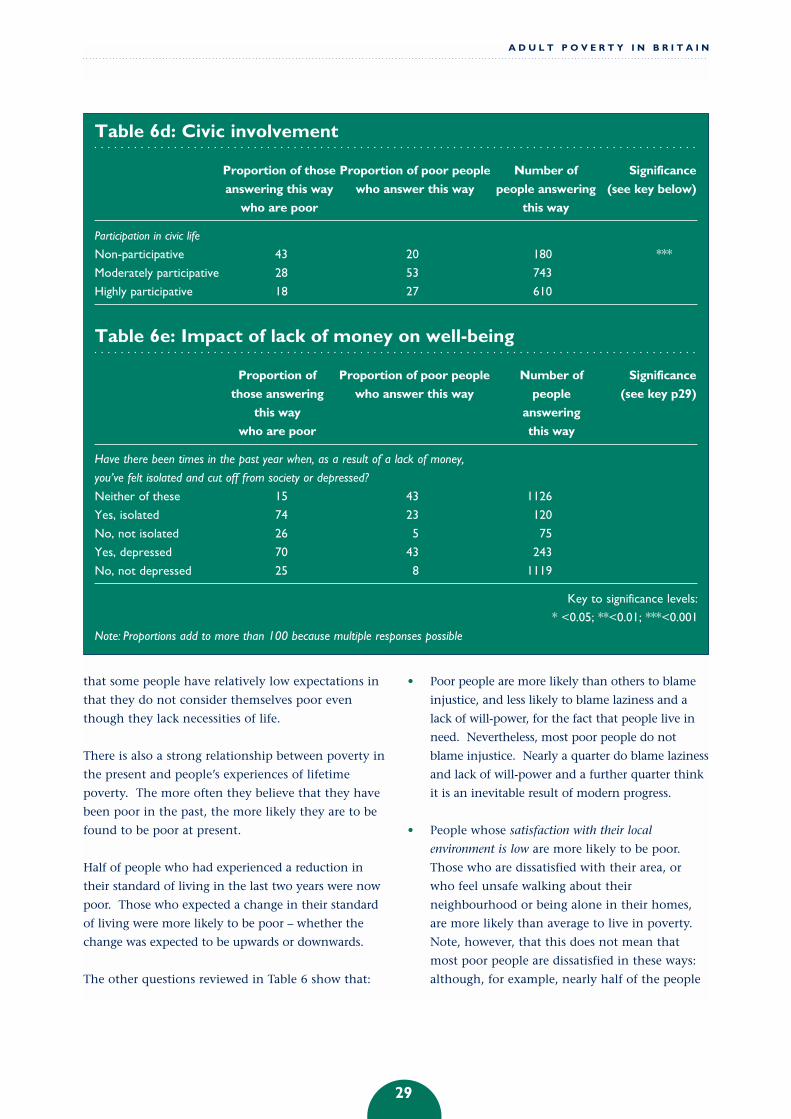
Table 6d: Civic involvement
Proportion of those Proportion of poor people Number of Significance
answering this way who answer this way people answering (see key below)
who are poor this way
Participation in civic life
Non-participative 43 20 180 ***
Moderately participative 28 53 743
Highly participative 18 27 610
Table 6e: Impact of lack of money on well-being
Proportion of Proportion of poor people Number of Significance
those answering who answer this way people (see key p29)
this way answering
who are poor this way
Have there been times in the past year when, as a result of a lack of money,
you’ve felt isolated and cut off from society or depressed?
Neither of these 15 43 1126
Yes, isolated 74 23 120
No, not isolated 26 5 75
Yes, depressed 70 43 243
No, not depressed 25 8 1119
Key to significance levels:
* <0.05; **<0.01; ***<0.001
Note: Proportions add to more than 100 because multiple responses possible

very dissatisfied with their area are poor, this
represents only 6 per cent of all poor people.
• Poor people are much less likely to be active in
their local communities than people who are not
poor. This finding is based on two questions -
membership of organisations and participation
in civic affairs - used to create a classification of
civic participation.
• Nearly three-quarters of people who feel isolated
and/or depressed as a result of lack of money
during the last year are currently poor. Chapter
5 considers further the theme of isolation with
respect to social exclusion.
Subjective assessments of poverty
Finally this chapter presents some results using three
subjective measures of poverty.
As outlined in Chapter 1, the World Summit for
Social Development in 1995 proposed a distinction
between absolute and overall poverty. In the PSE
survey, these ideas were adapted to conditions in
Britain. In addition, respondents were asked to
determine whether their income was ‘below the level
of income you think is necessary to keep a
household such as yours out of poverty’ – in the
tables below we describe this as ‘general’ poverty.
It can be seen in Table 7 that as many as 17 per cent
of the sample said they had less income than the
level they identified as being enough to keep a
household like theirs out of ‘absolute’ poverty. The
income, after tax, said to be needed each week to
escape ‘absolute’ poverty averaged £178 for all
households. Some informants gave estimates widely
different from this average but the great majority,
allowing for type of household, were within 20 per
cent of this figure.
Perceptions of the ‘poverty line’ varied by type of
household, as would be expected. More lone parents
than any other type of household (54 per cent with
two children) said they had an income below that
needed to keep out of absolute poverty (Table 8).
Next were single pensioners (24 per cent) and single
adults (20 per cent). The average for all households
was 14 per cent.
A larger proportion (26 per cent) ranked themselves in
‘overall’ poverty (Table 7). Again, lone parents and
single pensioners were more likely to claim that they
had incomes below this level. It is interesting that the
assessment of the mean income needed to keep a
household out of ‘general’ poverty (see above) fell
between the absolute and overall standard, which
indicates that respondents are capable of making a
distinction between these various subjective thresholds.
30
Table 7: Income needed each week to keep a household of your typeout of absolute, overall and general poverty (Britain 1999)
Absolute poverty Overall poverty General poverty
Mean income needed £178 £239 £219
Don’t know 18% 21% 17%
(%) (%) (%)
Actual income a lot above 52 34 34
A little above 24 26 31
About the same 8 8 14
A little below 8 11 10
A lot below 9 15 10
Total (excluding don’t knows) 100 100 100
Number 1252 1213 1273
P O V E R T Y A N D S O C I A L E X C L U S I O N I N B R I T A I N

It is striking that 1 in 6 people in a rich industrial
society perceive that their incomes are insufficient to
meet the very basic needs defined by an absolute
poverty threshold, and that over a quarter consider
themselves in overall poverty. These levels are much
higher than is generally assumed in national and
international discourse.
A D U L T P O V E R T Y I N B R I T A I N
31
Table 8: Percentage of each type of household reporting their actualincome as lower than the amount they needed to keep out ofabsolute, overall and general poverty (Britain 1999)
Absolute poverty Overall poverty General poverty
(%) (%) (%)
Single pensioner 24 37 27
Couple pensioner 18 26 22
Single adult 20 29 24
Couple 11 14 13
Couple 1 child 15 28 29
Couple 2 children 9 23 13
Couple 3+ children 10 25 25
Lone parent 1 child 41 56 54
Lone parent 2+ children 54 71 62
Other 19 27 14
All households 17 26 20

32
Introduction
In March 1999, the Prime Minister declared that the
Labour Government was on a "twenty-year mission" to
"end child poverty forever" (Blair, 1999). This
commitment was made against the backdrop of a
threefold increase in child poverty (measured in terms
of relative income) between 1979 and the 1990s (see
Chapter 1). By 1998/9, over a third of British children
were living in households with incomes below 50 per
cent of the average – the measure of childhood
poverty most commonly used (DSS, 2000).
There are a number of limitations on using
household income to measure poverty among
children. First, income measures assume that
children share the living standards of their family – if
the household as a whole is poor, then children in
that household must also be poor. In other words, it
is assumed that household income is distributed
evenly among household members. Yet there is
some evidence to suggest that spending on children
is relatively similar in all families. This therefore
means that in poorer families spending on children
is, as a proportion of income, disproportionately
higher than the average (Middleton et al., 1997).
Other evidence demonstrates that women’s share of
family income is disproportionately small (Goode et
al., 1998; Middleton et al., 1997). Second, household
income measures of childhood poverty are difficult
to explain in simple terms and tell us little or
nothing about how poverty impacts on children’s
lives. Direct measures of children’s individual living
standards can identify not simply how many
children are poor, but how poverty affects children.
What should children in Britain have and experience
if they are to avoid poverty, and what do poor
children go without that non-poor children do not?
The approach to defining and measuring poverty
used for the present survey, based on socially
perceived necessities, is particularly well suited to
measuring childhood poverty. It allows the
definition of childhood poverty to be democratically
decided and can produce a poverty line specifically
related to children, rather than to adults or
households. The meaning of poverty in children’s
lives can, therefore, be better understood. The
approach used is described in the box below.
The method used to define thenecessities of life and howmany children lack them
A ‘democratic poverty measure’ specifically related to
children was originally developed for the Small
Fortunes Survey of the lifestyles and living standards
of British children (Middleton et al., 1997). In this
survey, a list of children’s items and activities built
upon the six items specifically relating to children in
the original Breadline Britain studies, and was drawn
up following extensive research with 200 mothers
from a range of social groups and income levels
about the basic needs of children in Britain
(Middleton et al., 1994). The list was subjected to
further scrutiny in another series of focus groups
held as part of the development work for the
Poverty and Social Exclusion Survey (Bradshaw et al.,
1998). The final list included 30 items and activities
for children.
This list was included as part of the Office for
National Statistics’ Omnibus Survey in June of 1999
(see Appendix 4) to establish what are socially
perceived necessities for children. In this chapter,
parents’ judgements of what are necessities for
children are used, rather than those of the adult
population as a whole. The differences between the
judgements of parents and all adults were very small
(see Table 14, page 49). Furthermore, since the unit
of analysis throughout this chapter is the child and
3 Child poverty in Britain
This chapter presents the results of the survey for
children. As with the adult chapter, it begins by
considering which of the various items and activities
members of the public regard as necessities for
children and then the proportion of children that
live in households unable to afford items that the
majority of people regard as necessary. The analysis
goes on to define a poverty threshold, and then
investigates the characteristics of children who fall
below it. Next, the chapter identifies the
independent effect of various characteristics to
suggest some of the reasons behind childhood
poverty. A final section draws some important
conclusions for public policy.
What items are considered to benecessities for children?
Of the 30 children’s items and activities in the
survey, all but three were thought to be necessities by
more than 50 per cent of parents. The exceptions,
shown in italics in Table 9, were ‘at least 50p a week
for sweets’, ‘computer suitable for schoolwork’, and
‘computer games’.
Most of the remaining items were believed to be
necessities by well over 50 per cent of parents; and
over half (16 out of 30) of the items were believed to
be necessities by at least 75 per cent. This contrasts
with the adult measure, for which 35 out of 54 items
crossed the 50 per cent threshold (65 per cent of
items) and just 20 items were endorsed by 75 per
cent or more of adults (37 per cent of items).
In general, those items that might be regarded as
essential for the physical well-being of the child –
food, clothing and household items such as beds and
bedding – were believed to be necessities by larger
percentages of parents than were items for the child’s
social or educational development. However, there
are some interesting exceptions to this. Having
‘meat, fish or a vegetarian equivalent at least twice a
day’ was thought to be necessary by fewer
respondents than, for example, ‘educational games’, a
‘hobby or leisure activity’ and attending ‘play group
at least once a week for pre-school age children’.
Which necessities do children lack?
For each of these socially perceived necessities, only a
small proportion of children have parents who
cannot afford them (the relevant percentages are
shown in the second column of Table 9). They are
least likely to go without items that the largest
percentages of parents thought to be necessary -
food, environmental and developmental items - and
most likely to lack participation items and activities.
Nearly all parents think that ‘new, properly fitted,
shoes’, ‘a warm waterproof coat’ and ‘fresh fruit or
vegetables at least once a day’ are necessities, yet
1 in 50 children do not have these because of lack of
money. One in 25 go without each of the following
33
C H I L D P O V E R T Y I N B R I T A I N
since it is parents who decide what children will have,
it is more appropriate to use the judgements of
parents. This is also consistent with the method
used for the Small Fortunes study.
In the PSE survey, parents were asked to distinguish
whether their children (considered together in each
family rather than individually) had each item or
activity, did not have it because the parent did not
want it, or did not have it because they could not
afford it. As in the analysis in Chapter 2, this chapter
focuses on children’s lack of items and/or activities
that parents could not afford, rather than chose not
to buy.
In addition to using the views of parents rather than
all adults to determine what are considered
necessities, there are two other major differences
between the analysis of adult poverty and child
poverty in this report. The first is that because the
overall sample was smaller, it was not possible to do
the statistical analysis that, in the adult work, led to
the elimination of items that did not add to the
definition of poverty, so all items that more than
50 per cent of parents defined as necessary are used
throughout. The second is that it was considered
inappropriate to remove children in households that
were potentially rising out of poverty from the
definition of poor because it was not known whether
higher levels of income would be transferred into
extra spending on children.

P O V E R T Y A N D S O C I A L E X C L U S I O N I N B R I T A I N
34
Table 9: Necessities and ‘necessities deprivation’
Percentage of Percentage of children who lack itemparents regarding because their parents cannot afford ititem as ‘necessary’
All children Children who Children wholack at least lack at least
one of the 27 two of the 27necessary items necessary items
FoodFresh fruit or vegetables at least
once a day 93 1.8 5 9Three meals a day 91 (0.9) (3) (5)Meat, fish or vegetarian
equivalent at least twice a day 76 3.7 11 21
ClothesNew, properly fitted, shoes 96 2.3 7 12Warm, waterproof coat 95 1.9 6 11All required school uniform* 88 2.0 6 12At least 7 pairs of new underpants 84 1.9 6 11At least 4 pairs of trousers 74 3.1 9 18At least 4 jumpers/cardigans/sweatshirts 71 2.8 8 16Some new, not second-hand, clothes 67 3.1 9 18
Participation and activitiesCelebrations on special occasions 92 3.6 10 20Hobby or leisure activity* 88 3.2 9 18School trip at least once a term* 73 1.8 5 (10)Swimming at least once a month 71 7.1 21 34Holiday away from home at least
one week a year 63 21.8 64 68Leisure equipment* 57 3.1 9 17Friends round for tea/snack fortnightly* 53 3.7 11 21
DevelopmentalBooks of own 90 (0.1) 0 (1)Play group at least once a week
(pre-school age children)* 89 (1.3) (4) (7)Educational games 84 4.2 12 21Toys (e.g. dolls, teddies)* 85 (0.5) (1) (3)Construction toys 66 3.3 10 19Bike: new/second-hand* 60 3.4 10 18At least 50p a week for sweets 45 1.6 - -Computer suitable for schoolwork 38 35.7 - -Computer games 13 13.2 - -
EnvironmentalA bed and bedding for self 96 (0.6) (2) (3)Bedroom for every child of different sex over 10 years* 76 3.3 10 10Carpet in bedroom 75 (1.4) (4) (5)Garden to play in 68 3.5 10 8
Base 560 792 273 139
Notes: Figures in brackets indicate less than 20 unweighted casesItems in italics were thought to be necessities by less than 50% of parents* age-related items

highly endorsed necessities: ‘celebrations on special
occasions such as birthdays’, ‘educational games’,
‘meat, fish or vegetarian equivalent at least twice a
day’, and a ‘garden to play in’. The necessity that
the largest proportion of children goes without is a
‘holiday away from home once a year’, lacked by
over one-fifth of children. The second highest is
‘swimming at least once a month’, which more than
1 in 15 children go without.
How many children fall below thechild poverty threshold?
A similar range of statistical techniques to those used
for adults (Appendix 3) have been used to determine
a threshold for childhood necessities deprivation.
This statistical analysis suggests that a child should be
considered to be deprived if lacking any one or more
of the items in the list because their parents cannot
afford them. A third of children – 34 per cent – are
poor, or ‘necessity-deprived’, by this definition.
However, since a large proportion of children lacked
one item in particular (a ‘holiday away from home
once a year’), it seems sensible also to use a more
restrictive deprivation threshold of two or more
items. Eighteen per cent of children are poor by this
definition.
The last two columns of Table 9 show that a child
defined as poor has a much greater than average risk
of being deprived of each of the items listed. If a
child lacks at least one item, their chance of lacking
any specific item is in most cases at least three times
the average. If the deprivation threshold is set at two
items rather than one, the chance of a deprived child
lacking any specific necessity doubles once again in
most cases.
Which children are poor?
Once necessities deprivation thresholds have been
set, it is possible to explore whether particular groups
of children are more likely to be deprived than
others (Table 10). A range of family, economic and
demographic characteristics significantly increase the
risk of a child being necessities deprived.
Employment statusThe employment status of the household has a large
impact on levels of childhood necessities
deprivation. The proportions of deprived children in
households where there are no workers are double
those for children as a whole. Nearly two-thirds of
children in jobless households lack one or more item
and two-fifths are deprived of at least two.
Children with two (or more) adults in the household
in paid work are the least likely to be deprived.
However, having working parents in paid
employment does not necessarily protect children
from deprivation, particularly when the paid work is
part-time. Over half of children with one or more
parents working part-time go without at least one
item and three in ten lack two or more.
35
C H I L D P O V E R T Y I N B R I T A I N
Child poverty and lowhousehold income
As was found in the adult analysis there is not a
complete correlation between income and child
poverty in terms of necessity deprivation (Figure 3).
For a poverty threshold set at lacking one or more
socially perceived necessity, almost one half of
children (45 per cent) who live in households that
are ‘income poor’* are not ‘necessities deprived’. At
the higher threshold of going without two or more
necessities, almost two-thirds of children (65 per
cent) are income poor but not necessities deprived.
The explanation may lie in the evidence, referred to
above, that poverty is not always shared evenly among
household members. These data suggest that parents
in many income poor households are able to protect
their children from necessities deprivation, presumably
by ensuring that children take priority in the allocation
of available income. An alternative explanation might
lie in the length of time for which households have
been below the income poverty line. Households that
have only recently fallen below the income poverty
line and/or who have incomes close to it may be able
to continue to protect their children from necessities
deprivation for some time after this fall.
* defined as below 60 per cent of median equivalised household
income
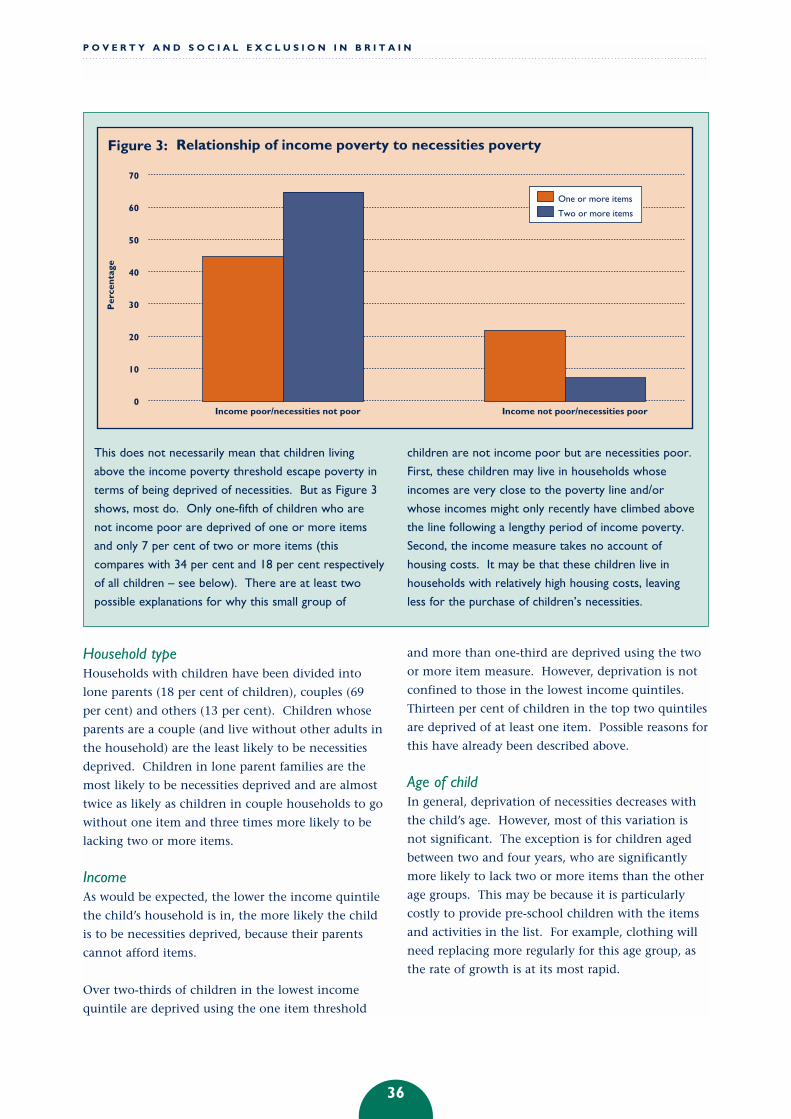
Household typeHouseholds with children have been divided into
lone parents (18 per cent of children), couples (69
per cent) and others (13 per cent). Children whose
parents are a couple (and live without other adults in
the household) are the least likely to be necessities
deprived. Children in lone parent families are the
most likely to be necessities deprived and are almost
twice as likely as children in couple households to go
without one item and three times more likely to be
lacking two or more items.
IncomeAs would be expected, the lower the income quintile
the child’s household is in, the more likely the child
is to be necessities deprived, because their parents
cannot afford items.
Over two-thirds of children in the lowest income
quintile are deprived using the one item threshold
and more than one-third are deprived using the two
or more item measure. However, deprivation is not
confined to those in the lowest income quintiles.
Thirteen per cent of children in the top two quintiles
are deprived of at least one item. Possible reasons for
this have already been described above.
Age of childIn general, deprivation of necessities decreases with
the child’s age. However, most of this variation is
not significant. The exception is for children aged
between two and four years, who are significantly
more likely to lack two or more items than the other
age groups. This may be because it is particularly
costly to provide pre-school children with the items
and activities in the list. For example, clothing will
need replacing more regularly for this age group, as
the rate of growth is at its most rapid.
P O V E R T Y A N D S O C I A L E X C L U S I O N I N B R I T A I N
36
This does not necessarily mean that children living
above the income poverty threshold escape poverty in
terms of being deprived of necessities. But as Figure 3
shows, most do. Only one-fifth of children who are
not income poor are deprived of one or more items
and only 7 per cent of two or more items (this
compares with 34 per cent and 18 per cent respectively
of all children – see below). There are at least two
possible explanations for why this small group of
children are not income poor but are necessities poor.
First, these children may live in households whose
incomes are very close to the poverty line and/or
whose incomes might only recently have climbed above
the line following a lengthy period of income poverty.
Second, the income measure takes no account of
housing costs. It may be that these children live in
households with relatively high housing costs, leaving
less for the purchase of children’s necessities.
Relationship of income poverty to necessities povertyFigure 3:
70
60
50
40
30
20
10
0Income poor/necessities not poor Income not poor/necessities poor
Per
cen
tage
One or more items
Two or more items

37
C H I L D P O V E R T Y I N B R I T A I N
Table 10: Characteristics of ‘necessities deprived’ children
Percentage of children Percentage of children
lacking one or more item lacking two or more items
Employment status of household*
2 full-time/more than 2 workers 32 (15)
1 full-time, 1 part-time 19 (6)
1 full-time 37 19
1 or more part-time 52 30
No workers 63 42
Household type*
Couple 29 11
Lone parent 52 33
Other 39 13
Income quintile*
4 and 5 (highest) (13) (4)
3 28 (7)
2 27 14
1 (lowest) 67 37
Age of child
0 to 1 36 (16)
2 to 4‡ 37 23
5 to 10 37 17
11 to 16 29 15
Number of children in household*
1 29 13
2 25 11
3 42 25
4+ 68 39
Child has long-standing illness
No 36 19
Yes 34 13
Respondent has long-standing illness*
No 32 16
Yes 41 24
Ethnicity*
White 30 14
Non-white 54 35
Tenure*
Own 24 11
Local authority rented 69 41
Other rented 57 34

Number of childrenThere is no significant difference between the
proportion of children with no siblings and with one
sibling being deprived using either the one or two
item threshold. However, the deprivation levels of
children in households with three or more children
increase dramatically.
Illness and disabilityThe differences between the deprivation of children
with and without a long-standing illness are not
significant. This suggests that, despite the extra cost
of bringing up a child with a disability and the
pressures this places on parents’ ability to work, they
are still largely protected from going without
(Dobson and Middleton, 1998).
However, parents who themselves have a long-
standing illness find it more difficult to protect their
children from deprivation. Children who have at
least one parent or household member with a long-
standing illness are approximately a third more likely
to be deprived than children as a whole, using either
measure.
EthnicityAlthough there was widespread agreement between
white and non-white parents as to what are
necessities for children, the parents of non-white
children are more likely to be unable to afford them.
Over one-half of non-white children are deprived of
at least one item and over one-third of at least two.
Further analysis confirms the findings of other
studies and suggests a number of possible reasons for
this (HM Treasury, 1999). First, non-white children
are more likely to be in larger families, in terms of
the numbers of adults and children. Second, they
are more likely to be in households with incomes in
the lowest quintile. Finally, non-white children are
more likely to live in jobless households. All of these
characteristics have been shown above to be
associated with high levels of deprivation.
TenureChildren living in owner-occupied housing (that is,
owned outright or with a mortgage) are far less likely
to be necessities deprived than children in the rented
sector. Children in local authority housing are the
most likely to be deprived, with over two-thirds of
this group lacking one or more item and two in five
going without two or more. Again, there are
connections with other findings. Children in local
authority accommodation are more likely than
average to be in lone parent families, non-working
families, and in the lowest income quintile (ibid.).
Benefit receipt Children in households that receive Income
Support and/or Jobseeker’s Allowance are far more
likely to be necessities deprived than those children
whose household members do not. They are nearly
21/2 times more likely to be deprived of one
necessity and over 31/2 times more likely to be
deprived of two or more.
P O V E R T Y A N D S O C I A L E X C L U S I O N I N B R I T A I N
38
Table 10 Continued
Percentage of children Percentage of children
lacking one or more item lacking two or more items
Member of household in receipt of IS or JSA*
No 28 12
Yes 66 43
Total 34 18
Note: Figures in brackets indicate less than 20 unweighted cases
* significant differences between all groups on both deprivation measures (p < 0.05)
‡ significant difference between this age group and others on two or more item deprivation (p < 0.05)
IS - Income Support; JSA - Jobseeker’s Allowance

Why are children poor?
The analysis so far has shown that certain subgroups
of children with particular family, economic and
demographic characteristics are significantly more
likely to be necessities deprived than others. These
characteristics need to be disentangled in order to
separate out those that are most likely to place
children at an increased risk of necessities
deprivation when all other characteristics are taken
into account.
A similar statistical analysis was carried out as for
adults, to establish the independent effect of each
factor found to increase the risk of deprivation.1 Table
11 shows for each factor the relative odds of being
deprived, in each instance setting a ‘base case’ of 1.00.
Necessities deprived – one item thresholdFor children deprived of one or more items,
employment status is not significantly associated
with an increased risk of necessity deprivation when
all other characteristics (including income) are taken
into account. However, other characteristics are
significant:
• children in households with additional adults
(i.e. other than parents) are half as likely to be
deprived as those in couple households;
• children in households in the lowest income
quintile are over 41/2 times as likely to be
deprived than those in the two highest quintiles;
• the number of children in the family is
significantly associated with deprivation. Every
additional child in the family increases the risk
that each child will be necessities deprived by
11/2 times;
• children in local authority housing are over
4 times, and those in the ‘other’ rented sector
over 21/2 times, as likely to be deprived than
children in owner-occupied households;
• children in households where the respondent to
the survey has a long-standing illness are over
11/2 times as likely to be deprived;
• children in households where one or more adults
receive Income Support or Jobseeker’s Allowance
are over 3 times as likely to be deprived;
• children in lone parent households are not
significantly more likely to be deprived than
those in a couple household when other
characteristics are taken into account. Therefore,
although a child in a lone parent family has a
significantly higher risk of being deprived of
necessities (as shown above), this is nothing to
do with lone parenthood in itself. Rather it is
because lone parents are more likely to be living
in local authority rented housing and in receipt
of Income Support.
Necessities deprived – two items or moreFor children deprived of two or more items, by
contrast, employment status of the household is
highly significant in predicting deprivation.
Compared with children in households where two
adults are in full-time work, or more than two adults
are in employment, children:
• in households with one full-time and one part-
time paid worker are 5 times as likely to be
deprived;
• in households with one full-time paid worker are
8 times as likely to be deprived;
• in households with one or more part-time paid
workers are 11 times as likely to be deprived;
• in households with no paid workers are 9 times
as likely to be deprived.
The only other significant characteristic in this
model is tenure. Children in local authority housing
are three times and those in the ‘other’ rented sector
over twice, as likely to be deprived than children in
owner-occupied households.
The very different results produced by the two
thresholds reflect differences between the household
employment profiles of those children who are
deprived of none, one, and two or more necessities.
39
C H I L D P O V E R T Y I N B R I T A I N

P O V E R T Y A N D S O C I A L E X C L U S I O N I N B R I T A I N
40
Table 11: Logistic regression model predicting necessitiesdeprivation
Odds of child lacking Odds of child lacking
one or more item two or more items
Employment status of household
2 full-time/more than 2 workers 1.00 1.00
1 full-time, 1 part-time 0.72 5.19*
1 full-time 1.11 8.32*
1 or more part-time 1.24 11.09**
No workers 0.60 8.87*
Household type
Couple 1.00 1.00
Lone parent 0.54 0.82
Other 0.45* 0.89
Income quintile
4 and 5 (highest) 1.00 1.00
3 2.58** 1.22
2 1.37 1.40
1 (lowest) 4.65*** 2.31
Number of children in household
One 1.00 1.00
For every increase in child 1.55*** 1.14
Ethnicity
White 1.00 1.00
Non-white 1.62 1.49
Tenure
Own 1.00 1.00
LA rent 4.15*** 2.94**
Other rent 2.64*** 2.10*
Respondent had long-standing illness
No 1.00 1.00
Yes 1.58* 1.55
Member of household in receipt of IS or JSA
No 1.00 1.00
Yes 3.10* 2.15
Note: Significance * < 0.05; **< 0.01; ***< 0.001
IS – Income Support; JSA – Jobseeker’s Allowance

Almost half of children who lack one or more item
are, in fact, deprived of only one necessity. These
children are approximately evenly distributed among
the various household employment statuses. In
other words, going without just one item varies very
little according to employment status of parents.
Once the deprivation threshold is raised to two or
more items, almost all of the children in two-worker
households are removed from deprivation, because
they lack only one item. Far higher proportions of
children from part-time working households and
those in jobless households remain in deprivation (as
they lack two or more items). This seems to suggest
that the two-item threshold is probably more
valuable as a deprivation measure (see above).
The finding that children in a jobless household are
less likely to be in deprivation than children in
households with one or more part-time worker is
probably the result of other variables impacting upon
this, in particular benefit receipt and tenure.
As with one-item deprivation, for children in lone
parent families it is not their family status per se that
explains their deprivation, but rather the greater
likelihood that they are in households with one or
no paid workers or living in local authority rented
housing.
Policy implications
This analysis has a number of important implications
for policy. According to the Government, joblessness
is a major cause of childhood poverty (HM Treasury,
2000, p7). A large part of their proposed solution for
childhood poverty is to get parents into work. These
findings have shown that employment is indeed vital
to ensuring that children are not deprived of
necessities, using a threshold of ‘going without two
or more necessities’. Children in jobless households
are nine times more likely to be deprived than those
with two or more paid workers in the household.
However, the Government has also recognised that
"changes in the labour market have also increased
the risk of poverty for children whose parents are in
work" (ibid., p8). Their parallel commitment to
‘make work pay’ appears equally important to that of
reducing the number of jobless households, as
children in households with only one worker, full- or
part-time, are also much more likely to be necessities
deprived than children in households with two full-
time workers. Work per se will not keep children out
of poverty and, for those households where the
opportunity for two full-time salaries is simply not
available and/or for those households where one
parent wishes to stay at home to care for children,
other policy avenues need to be explored.
Our evidence points to anomalies in some
government policies if childhood poverty is to be
eradicated. Many benefits for children give
disproportionate emphasis to the needs of smaller
families. Child Benefit is paid at a higher rate for the
only or oldest child than for subsequent children
and the Government continues to increase this gap.
The Childcare Tax Credit provides for up to double
the level of support for one child (£100) than for a
second and, indeed, all subsequent children (a
maximum of £150 is allowed for two or more
children). The Family Premium on Income Support
is paid at a flat rate to families with children,
irrespective of how many children are in the family.
All of these benefits will therefore favour
disproportionately families with fewer children. Yet
the risk of poverty clearly increases as the number of
children in the family increases.
Tenure is also significantly related to poverty.
Children in local authority housing are three times
more likely to be deprived (using the two or more
item threshold) than those in owner-occupied
homes. For those in the private rented sector, the
odds of being deprived are twice as high. This is
even though employment status and income
(amongst other characteristics) have been controlled
for. It is to be hoped that the Government’s National
Strategy for Neighbourhood Renewal, the New Deal
for Communities, and other initiatives to improve
deprived neighbourhoods, will help to tackle the
particular problem of poverty among children in
local authority housing.
Defining and measuring childhood poverty as ‘going
without necessities that the majority of parents
believe to be necessary, because parents cannot afford
41
C H I L D P O V E R T Y I N B R I T A I N

to provide them’ has a number of advantages. First,
and most important, it is a direct measure of poverty
among children. This contrasts with indirect
measures such as household income, which can tell
us only whether the family is poor but reveal
nothing about children’s own direct experience of
poverty. Second, it has shown that small but
significant percentages of children go without food
and clothing items that almost all parents believe to
be necessary and which are widely accepted as being
vital to the continued health and development of
children. Finally, it allows other indicators to be
identified which the Government might wish to
focus on in its programme to reduce, and eventually
abolish, childhood poverty.
Note
1 A logistic regression analysis was undertaken in which all of
the characteristics that were found to be significantly
associated with an increased risk of deprivation in the previous
analysis were included in the model.
P O V E R T Y A N D S O C I A L E X C L U S I O N I N B R I T A I N
42
43
The Poverty and Social Exclusion Survey was the third
in the past two decades to measure how many people
in Britain are unable to afford socially perceived
necessities. By repeating a similar exercise in 1983,
1990 and 1999, we can get a picture of how poverty
has changed over time. Although the surveys have
not been identical, they have enough common data
to allow several types of change to be charted:
• changes in the items that the majority of the
population consider to be necessities of modern
life;
• changes in how many people are deprived of
each necessity, because they cannot afford it;
• changes in poverty defined as not having and
being unable to afford a range of the necessities
of life;
• changes in the number of people suffering from
long-term poverty.
Changes in perception ofnecessities
Chapters 2 and 3 set out how the 1999 Omnibus
Survey produced a consensual measure of
deprivation by looking at which items were
considered as necessities by the majority of the
population. In 1983 and 1990, members of the
general public were asked whether they considered
specified items to be necessities. Since the first
survey, in 1983, the responses have repeatedly
confirmed the assumption on which this
‘consensual’ method has been based - that there is a
high degree of consensus across different groups in
the population about which items are necessities
(Mack and Lansley, 1985).
Over time, if societies get richer, the relative theory
of poverty predicts that the number of people who
perceive common possessions and activities as
necessary will increase. This is precisely what
occurred between the 1983 and 1990 surveys: a
higher percentage of respondents rated as necessities
30 out of 33 items common to both surveys.
On average, the British population has become richer
throughout the 1980s and 1990s: between 1983 and
1998/9, average income rose by 51 per cent (after
housing costs), from £9,932 per year (£191 per week)
to £15,028 per year (£289 per week), at February
2000 prices.1 This increase in incomes was not
shared equally. The incomes and wealth of the
‘richest’ people increased considerably over the 1980s
and 1990s while the incomes and wealth of the
‘poorest’ declined in real terms after allowing for
inflation and increases in housing costs (DSS, 2000;
Gordon, 2000). The latest evidence on the
distribution of income for the 1998/99 financial year
shows that the gap between rich and poor has
continued to widen (Drever et al., 2000).
Nevertheless, the overall rise in prosperity would
make one expect that on average a greater
proportion of people would consider common
possessions and activities to be necessities in 1999
than in 1990 or 1983.
However, the results shown in Table 12 give a more
complicated picture indicating that people’s attitudes
have been affected by changes in taste and
technology as well as the growth in prosperity; the
most substantial changes in attitudes are highlighted
in bold. This table shows those items included in
more than one of the surveys, most of them relating
to adult necessities, but five relating to children that
were already used in 1990.
4 The growth of poverty in Britain
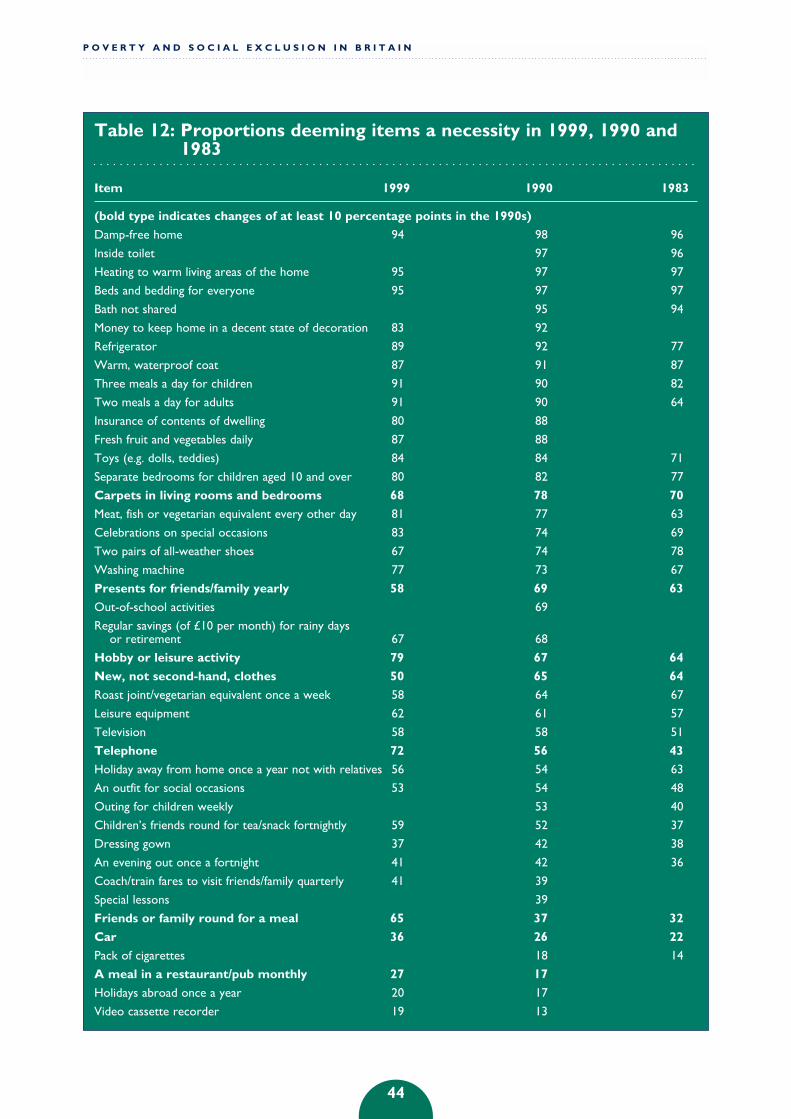
P O V E R T Y A N D S O C I A L E X C L U S I O N I N B R I T A I N
44
Table 12: Proportions deeming items a necessity in 1999, 1990 and1983
Item 1999 1990 1983
(bold type indicates changes of at least 10 percentage points in the 1990s)
Damp-free home 94 98 96
Inside toilet 97 96
Heating to warm living areas of the home 95 97 97
Beds and bedding for everyone 95 97 97
Bath not shared 95 94
Money to keep home in a decent state of decoration 83 92
Refrigerator 89 92 77
Warm, waterproof coat 87 91 87
Three meals a day for children 91 90 82
Two meals a day for adults 91 90 64
Insurance of contents of dwelling 80 88
Fresh fruit and vegetables daily 87 88
Toys (e.g. dolls, teddies) 84 84 71
Separate bedrooms for children aged 10 and over 80 82 77
Carpets in living rooms and bedrooms 68 78 70
Meat, fish or vegetarian equivalent every other day 81 77 63
Celebrations on special occasions 83 74 69
Two pairs of all-weather shoes 67 74 78
Washing machine 77 73 67
Presents for friends/family yearly 58 69 63
Out-of-school activities 69
Regular savings (of £10 per month) for rainy daysor retirement 67 68
Hobby or leisure activity 79 67 64
New, not second-hand, clothes 50 65 64
Roast joint/vegetarian equivalent once a week 58 64 67
Leisure equipment 62 61 57
Television 58 58 51
Telephone 72 56 43
Holiday away from home once a year not with relatives 56 54 63
An outfit for social occasions 53 54 48
Outing for children weekly 53 40
Children’s friends round for tea/snack fortnightly 59 52 37
Dressing gown 37 42 38
An evening out once a fortnight 41 42 36
Coach/train fares to visit friends/family quarterly 41 39
Special lessons 39
Friends or family round for a meal 65 37 32
Car 36 26 22
Pack of cigarettes 18 14
A meal in a restaurant/pub monthly 27 17
Holidays abroad once a year 20 17
Video cassette recorder 19 13

Some items that nearly all respondents felt to be
necessary fluctuated by insignificant amounts in
terms of the proportions considering them to be
necessary between the three surveys. Three items –
‘carpets in living rooms and bedrooms’, ‘presents for
family/friends yearly’ and ‘new, not second-hand,
clothes’ – did fall substantially contrary to the
expectation that as society got richer most items
would be rated as necessities by more people.
However, in most cases, asked about lower ranked,
more luxury, items such as videos, dishwashers and
cars, a greater proportion of respondents considered
these to be necessities in 1999 than in 1990 or 1983.
Similarly, many social and leisure activities such as
‘celebrations on special occasions’ and being able to
afford a ‘hobby or leisure activity’ were thought to be
a necessity by more respondents in 1999 than in the
two previous surveys. This was also true for certain
consumer durables such as telephones and washing
machines. In particular there has been a remarkably
rapid increase in the proportion of respondents that
consider a telephone to be a necessity, from 43 per
cent in 1983, to 56 per cent in 1990, to 72 per cent in
1999. Similarly ‘friends or family round for a meal’
increased from 37 per cent in 1990 to 64 per cent in
1999. However, this latter change may in part result
from changes to the question wording (e.g. 1999
‘friends or family round for a meal, snack or drink’;
1990 ‘friends/family round for a meal once a month’).
Figure 4 compares the percentage of respondents
who considered an item to be a necessity in 1999 (on
the vertical axis) with the percentage of respondents
in 1990 (horizontal axis), showing each item as a
cross. If a line were to be drawn at a 45 degree angle
from the bottom left to the top right of the chart,
points lying on it would have had the same
proportion of people citing them as necessities in
45
T H E G R O W T H O F P O V E R T Y I N B R I T A I N
Table 12 Continued
Item 1999 1990 1983
(bold type indicates changes of at least 10 percentage points in the 1990s)
Home computer 11 5
Dishwasher 7 4
Dictionary 55
Replace or repair broken electrical goods 86
Visits to friends or family 85
Visiting friends or family in hospital 92
Deep freezer/fridge freezer 55
Microwave 24
Mobile phone 8
Tumble dryer 20
Satellite TV 5
CD player 12
Appropriate clothes for job interviews 70
Medicines prescribed by doctor 91
Access to the Internet 6
A small amount of money to spend on self weekly 61
Having a daily newspaper 32
Going to the pub once a fortnight 22
Attending weddings, funerals 81
Attending place of worship 44
Collect children from school 76
Visits to school, e.g. sports day 81

1990 and 1999. In fact there would be more items to
the left/above this line and these had higher
proportions citing them as necessities in 1999 than
in 1990. A statistical technique can be used to ‘fit’ a
line through the points that minimises the total
distances between the line and individual items.
This is the middle line on the diagram. It confirms
that items considered to be important necessities by
a large number of respondents in 1990 are also
thought to be so by a large number of respondents
in 1999.
It is difficult to interpret the line’s slope, since it is
affected by the fact that an item close to 100 per cent
in 1990 cannot increase significantly by 1999. The
figure that therefore tells most about the change over
time is the point at which the line intercepts one of
the axes. This line crosses the 1999 axis at 8 per
cent, showing that overall there was an ‘average’ 8
per cent increase in the public’s perception of
necessities between 1990 and 1999. This is as
expected given the growth in average prosperity over
the 1990s. Only those items that fall outside or close
to the top and bottom solid lines show changes that
are likely to be significantly different from the
general trend.
Figure 5 shows that, between 1983 and 1999, there
was an even larger shift in the public’s perception of
the necessities of life: a baseline increase of 22 per
P O V E R T Y A N D S O C I A L E X C L U S I O N I N B R I T A I N
46
Attitudinal scatter plot comparing perceptions of necessities in1990 and 1999
Figure 4:
100
75
50
25
0
25
Notes: year 99 = 7.79 + 0.87* year 90 R-square = 0.91
1990
1999
8%
50 75 100
Linear regression with 95.00% Individual Prediction
Perception of necessities: comparing 1983 and 1999Figure 5:
100
75
50
25
0
25
Notes: year 99 = 21.82 + 0.73 x year 83 R-square = 0.62
1983
1999
22%
50 75 100
Linear regression with 95.00% Individual Prediction Interval
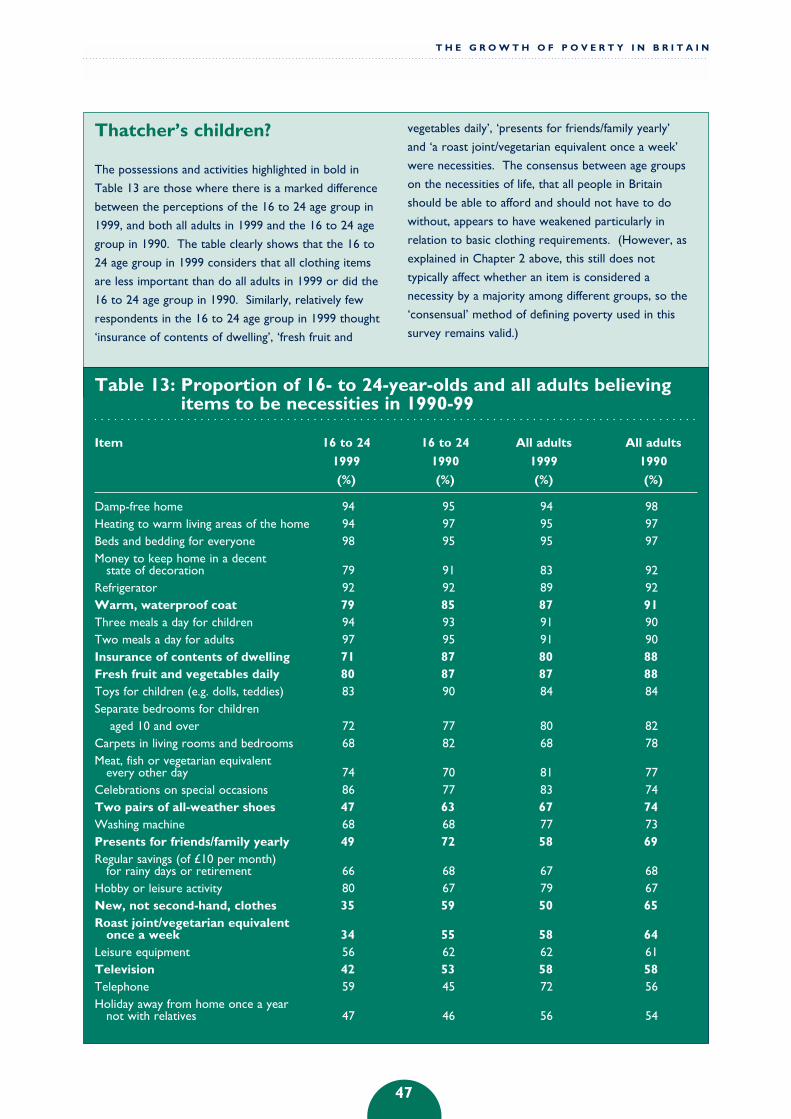
47
T H E G R O W T H O F P O V E R T Y I N B R I T A I N
Thatcher’s children?
The possessions and activities highlighted in bold in
Table 13 are those where there is a marked difference
between the perceptions of the 16 to 24 age group in
1999, and both all adults in 1999 and the 16 to 24 age
group in 1990. The table clearly shows that the 16 to
24 age group in 1999 considers that all clothing items
are less important than do all adults in 1999 or did the
16 to 24 age group in 1990. Similarly, relatively few
respondents in the 16 to 24 age group in 1999 thought
‘insurance of contents of dwelling’, ‘fresh fruit and
vegetables daily’, ‘presents for friends/family yearly’
and ‘a roast joint/vegetarian equivalent once a week’
were necessities. The consensus between age groups
on the necessities of life, that all people in Britain
should be able to afford and should not have to do
without, appears to have weakened particularly in
relation to basic clothing requirements. (However, as
explained in Chapter 2 above, this still does not
typically affect whether an item is considered a
necessity by a majority among different groups, so the
‘consensual’ method of defining poverty used in this
survey remains valid.)
Table 13: Proportion of 16- to 24-year-olds and all adults believingitems to be necessities in 1990-99
Item 16 to 24 16 to 24 All adults All adults
1999 1990 1999 1990
(%) (%) (%) (%)
Damp-free home 94 95 94 98Heating to warm living areas of the home 94 97 95 97Beds and bedding for everyone 98 95 95 97Money to keep home in a decent
state of decoration 79 91 83 92Refrigerator 92 92 89 92Warm, waterproof coat 79 85 87 91Three meals a day for children 94 93 91 90Two meals a day for adults 97 95 91 90Insurance of contents of dwelling 71 87 80 88Fresh fruit and vegetables daily 80 87 87 88Toys for children (e.g. dolls, teddies) 83 90 84 84Separate bedrooms for children
aged 10 and over 72 77 80 82Carpets in living rooms and bedrooms 68 82 68 78Meat, fish or vegetarian equivalent
every other day 74 70 81 77Celebrations on special occasions 86 77 83 74Two pairs of all-weather shoes 47 63 67 74Washing machine 68 68 77 73Presents for friends/family yearly 49 72 58 69Regular savings (of £10 per month)
for rainy days or retirement 66 68 67 68Hobby or leisure activity 80 67 79 67New, not second-hand, clothes 35 59 50 65Roast joint/vegetarian equivalent
once a week 34 55 58 64Leisure equipment 56 62 62 61Television 42 53 58 58Telephone 59 45 72 56Holiday away from home once a year
not with relatives 47 46 56 54

cent. This again reflects the large average increases
in wealth experienced by the majority of the British
population over this period.
Over the 16 years between 1983 and 1999, the
British population has, as a whole, become more
generous in what it considers to be necessities of life
that everybody should be able to afford. As the
average wealth of the population has increased and
technology has progressed, so goods and services that
were once luxuries have become more generally
available and have begun to be perceived as
necessities by increasing numbers of people.
However, the 1990s witnessed an apparent
polarisation between the attitudes of the young (aged
16 to 24) and the rest of the population. The young
have always made harsher judgements on what are
necessities than older generations, but this became
more pronounced between 1990 and 1999. This is
discussed in the box on pages 47-8, and helps
explain why there was not a simple pattern of all
P O V E R T Y A N D S O C I A L E X C L U S I O N I N B R I T A I N
48
Several commentators have remarked that the
children who grew up knowing only Conservative
governments may as adults have rather more
‘conservative’ views than their parents who grew up
during the 1960s and 1970s. However, it must be
noted that there has been little other than anecdotal
evidence to support this view. An alternative
interpretation of these data is that young people have
become less materialistic.
Many young men and women suffered from profound
socio-economic changes during the 1990s which
resulted in fewer young people being employed in full-
time jobs in 1999 than in 1990. Relative to older adults,
the earnings and benefit rates for young people
diminished. Larger numbers of young men and women
now enter post-school education and training schemes
than was the case in 1990. Although education and
training improves long-term earnings prospects, it is
associated with lower income in the short term. This
relative impoverishment of youth may be as important a
factor in explaining the change in attitudes amongst the
younger cohort as any cultural effect of 18 years of
Conservative rule. Young people in 1999 were almost
twice as likely to be in education and training than in
1990 and students have always been more restricted in
their perceptions of necessities than their working
peers. Unfortunately, due to the differences between
the surveys and changes in the definition of employment
status (particularly for working students) it is not
possible to quantify the relative importance of cultural
changes compared with these socio-economic changes.
Table 13 Continued
Item 16 to 24 16 to 24 All adults All adults1999 1990 1999 1990(%) (%) (%) (%)
An outfit for social occasions 45 54 53 54Children’s friends round for tea/snack
once a fortnight 61 50 59 52Dressing gown 16 24 37 42An evening out once a fortnight 48 50 41 42Coach/train fares to visit friends/family quarterly 39 31 41 39Friends or family round for a meal 61 35 65 37Car 27 22 36 26A meal in a restaurant/pub monthly 22 13 27 17Holidays abroad once a year 20 23 20 17Video casstte recorder 16 17 19 13Home computer 13 4 11 5Dishwasher 7 4 7 4
Note: Items in bold show marked difference between 16 to 24 age group in 1999 with the same group in 1990 and with all adults in 1999

49
T H E G R O W T H O F P O V E R T Y I N B R I T A I N
Table 14: Changes in the perception of children's necessitiesbetween 1995 and 1999
Item 1999 1999 1995
All adults Parents Small Fortunes Survey
(%) (%) (%)
Food
Three meals a day 91 91 93
Fresh fruit or vegetables daily* 94 93 89
Meat, fish or vegetarian equivalent at leasttwice a day 77 76 68
Clothing
Warm, waterproof coat‡ 95 95 94
New, properly fitted, shoes 94 96 94
All required school uniform 88 88 79
4 jumpers/cardigans/sweatshirts 73 71 62
Some new, not second-hand, clothes 70 67 61
At least 7 pairs of new underpants 83 84 59
At least 4 pairs of trousers 69 74 59
Participation and activities
Celebrations on special occasions 93 92 74
Hobby or leisure activity 90 88 66
School trip at least once a term 74 73 50
Holiday away from home at least one week a year 71 63 47
Swimming at least once a month 78 71 40
Friends round for tea/snack fortnightly 59 53 **
Leisure equipment 60 57 33
Development
Books of own 89 90 82
Play group at least once a week (pre-school age children) 88 89 74
Educational games 83 84 73
Toys (e.g. dolls, teddies) 84 85 66
Construction toys 62 66 46
Bike: new/second-hand 55 60 32
At least 50p per week for sweets 49 45 26
Computer suitable for schoolwork 42 38 20
Computer games 18 13 5
Environmental
A bed and bedding for self 93 96 94
Garden to play in 69 68 70
Bedroom for every child of differentsex over 10 years 78 77 69
Carpet in bedroom 67 75 62
Notes: * In Small Fortunes, the item parents were asked for their opinion on was ‘fresh fruit once a day’‡ In Small Fortunes, this item was identified as two separate items - ‘warm coat’ and ‘waterproof coat’. The percentage given isfor warm coat. The percentage of parents endorsing waterproof coat as a necessity was 80 per cent.** This item was inadvertently omitted from the Small Fortunes Survey

items having a higher proportion of people thinking
of them as necessities in 1999 than previously. If
one excludes young adults, few items are considered
necessities by a declining proportion.
Changes in perceptions ofnecessities for children
The measures of necessities in the original Breadline
Britain study included only five items that were
specifically for children and which can be used for
comparison with the Omnibus Survey. However, it is
possible to compare adult judgements about what are
necessities for children in 1995 when the Small
Fortunes Survey was undertaken (Middleton et al.,
1997), and in 1999, using the ONS Omnibus Survey.
More adults in the 1999 Omnibus Survey were inclined
to say that things were necessities for children than
parents in the Small Fortunes Survey (Table 14). This
was so for all adults and for parents, and for all items
with the exception of ‘three meals a day’ and a ‘garden
to play in’, where the differences were very small – one
or two percentage points. Eight items were endorsed as
necessities by less than half of parents in 1995. This
was reduced to only three items by 1999.
With one or two exceptions, differences between the
judgements of parents and adults as a whole in the
1999 survey were very small. Differences emerged
for a ‘holiday away from home once a year’, which 8
per cent fewer parents thought was a necessity than
all adults, and for a ‘carpet in their bedroom’ and
‘swimming at least once a month’, which 8 and 7 per
cent more parents thought to be a necessity than all
adults respectively. In Table 14 comparisons are
made between parents in the Omnibus Survey and
the Small Fortunes Survey parents, since the two
samples are more directly comparable.
In general, the smallest increases in the percentage
judging children’s items and activities as necessary
occurred for those items that already had very high
levels of endorsement as necessary in the earlier
survey. These are two of the three food items, ‘new,
properly fitted, shoes’, and a bed and bedding of
their own. Many of the largest increases occurred for
items that encourage participation in the social
world of childhood – in particular, a ‘hobby or
leisure activity’, ‘leisure equipment’, a ‘school trip at
least once a term’, and ‘swimming at least once a
month’ (all increases of over 20 per cent). Very large
increases can also be seen in the group of items that
contribute to children’s social and educational
development, particularly: ‘toys (e.g. dolls, teddies)’;
‘construction toys’; a ‘new/second-hand bike’; and a
‘computer suitable for schoolwork’ (although this last
item was still not regarded as necessary by the
majority of parents in 1999). It seems that awareness
of the importance of items to aid children’s social
participation and educational development is
growing among parents.
However, despite this general trend towards higher
percentage endorsement of necessities, parent’s
priorities for children remain much the same – the basic
necessities of food, clothing and health are seen as
more important than participation and development.
Of the five items most frequently judged to be
necessities in 1995, four of these items were still in this
position in 1999: ‘new, properly fitted shoes’, own bed
and bedding, a ‘warm, waterproof coat’ and ‘fresh fruit
or vegetables daily’. Of the five items that were least
likely to be regarded as necessities in 1995, four were
still in the bottom five in 1999: ‘leisure equipment’, ‘at
least 50p a week for sweets’, ‘computer suitable for
schoolwork’, and ‘computer games’.
Changes in deprivation
As technology advances, items that were once
expensive luxuries become cheaper to produce and
can begin to be afforded by increasing sections of the
population. Therefore, it would be expected that
fewer and fewer people would suffer from not being
able to afford individual items (whether they be
luxuries or necessities) as time progressed since, in
virtually every case, all these items have become
relatively less expensive with time.
However, the results shown in Table 15 indicate that
this process occurred with glacial slowness for poor
people during the 1980s and has virtually ceased
during the 1990s. The proportion of households that
could not afford an item did not change overall
between 1990 and 1999 and changed by only 0.5 per
P O V E R T Y A N D S O C I A L E X C L U S I O N I N B R I T A I N
50
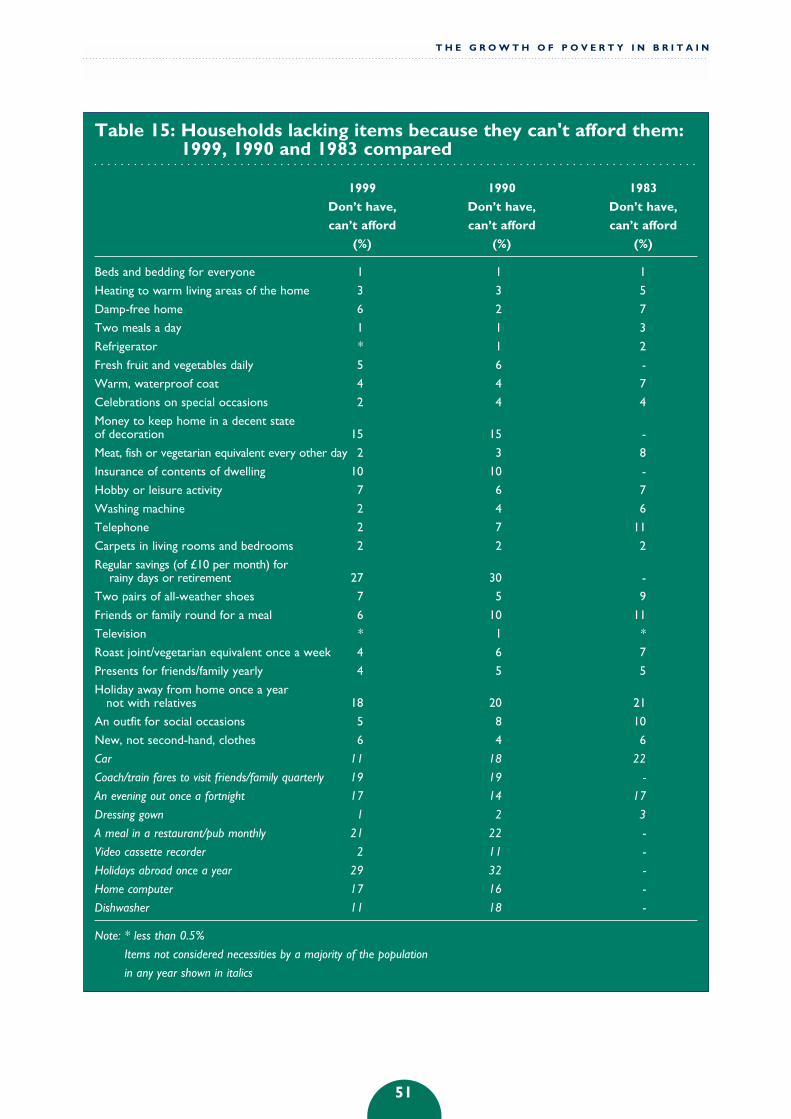
51
T H E G R O W T H O F P O V E R T Y I N B R I T A I N
Table 15: Households lacking items because they can't afford them:1999, 1990 and 1983 compared
1999 1990 1983
Don’t have, Don’t have, Don’t have,
can’t afford can’t afford can’t afford
(%) (%) (%)
Beds and bedding for everyone 1 1 1
Heating to warm living areas of the home 3 3 5
Damp-free home 6 2 7
Two meals a day 1 1 3
Refrigerator * 1 2
Fresh fruit and vegetables daily 5 6 -
Warm, waterproof coat 4 4 7
Celebrations on special occasions 2 4 4
Money to keep home in a decent state of decoration 15 15 -
Meat, fish or vegetarian equivalent every other day 2 3 8
Insurance of contents of dwelling 10 10 -
Hobby or leisure activity 7 6 7
Washing machine 2 4 6
Telephone 2 7 11
Carpets in living rooms and bedrooms 2 2 2
Regular savings (of £10 per month) for rainy days or retirement 27 30 -
Two pairs of all-weather shoes 7 5 9
Friends or family round for a meal 6 10 11
Television * 1 *
Roast joint/vegetarian equivalent once a week 4 6 7
Presents for friends/family yearly 4 5 5
Holiday away from home once a year not with relatives 18 20 21
An outfit for social occasions 5 8 10
New, not second-hand, clothes 6 4 6
Car 11 18 22
Coach/train fares to visit friends/family quarterly 19 19 -
An evening out once a fortnight 17 14 17
Dressing gown 1 2 3
A meal in a restaurant/pub monthly 21 22 -
Video cassette recorder 2 11 -
Holidays abroad once a year 29 32 -
Home computer 17 16 -
Dishwasher 11 18 -
Note: * less than 0.5%
Items not considered necessities by a majority of the population
in any year shown in italics

cent between 1983 and 1999 (in the sense that if a
scatter diagram similar to Figures 4 and 5 was drawn,
the ‘fitted’ line would cross the 1999 axis at 0.5).
The majority of this small change was accounted for
by 'luxury' items (video, dishwasher, car, etc.)
becoming relatively cheaper over the past 17 years.
The only item considered to be a necessity by a
majority of the population for which there was a big
drop was the telephone – with only 2 per cent
unable to afford one in 1999 compared with 7 per
cent in 1990 and 11 per cent in 1983 (when only a
minority considered it a necessity).
In the case of several necessities shown in Table 15,
deprivation rose between 1990 and 1999. The
number of households unable to afford a ‘damp-free
home’, ‘two pairs of all-weather shoes’ and ‘new, not
second-hand clothes’ all increased. In each case this
rise followed a fall in the 1980s. The long-term
health consequences of damp housing are now well
documented. Children who suffered from multiple
housing deprivation are 25 per cent more likely to
become seriously ill by the age of 33 than the rest of
the population after allowing for other major causes
of ill health (Marsh et al., 1999).
Slightly, fewer households could afford a home
computer in 1999 than in 1990 despite the huge fall
in the price of computers in real terms over the
1990s. This is a disturbing finding given that the
importance of the Internet is likely to increase during
the twenty-first century. The Government is
attempting to ensure universal access, so that British
society does not become divided into the
‘information poor’ and ‘information rich’.
Changes in poverty
There are a number of differences between the
previous 1983 and 1990 Breadline Britain surveys
and the current PSE survey that make direct
comparison difficult. The PSE survey is much more
accurate and detailed (and more expensive), which
allowed detailed information on poverty, social
exclusion and low income to be collected at the
individual level, whereas the Breadline Britain
surveys collected information at the household level
and only had limited information about income.
This section compares the changes in poverty and
deprivation between 1983 and 1999, using the
somewhat cruder methods and definitions of poverty
and deprivation that were available in 1983, so that
the results are directly comparable. Thus in order to
produce directly comparable data across time poverty
has been defined at the household level as lacking
three or more items considered by the population to
be necessities due to insufficient income.
This procedure slightly underestimates the ‘true’
amount of poverty discussed in Chapter 2.2 Two
differences in this cruder definition are, first of all
that it does not include people who lack two rather
than three items, and second that it does include
people currently deprived of necessities, but whose
relatively high income indicates that they have
recently risen out of poverty. There is also a
difference from the measure used in Chapter 2
because of the need to look at households when
measuring poverty over time: the 1999 measure of
individual poverty was not possible from the data in
previous surveys.
Between 1983 and 1990, the number of households
who lacked three or more socially perceived
necessities increased by almost 50 per cent. In 1983,
14 per cent of households were living in poverty, and
by 1990 this figure was 21 per cent. Poverty
continued to increase during the 1990s and, by 1999,
the number of households living in poverty on this
definition had again increased to over 24 per cent,
approximately 1 in 4 households.
Thus, just as poverty measured by income inequality
has risen over the past two decades (see Figure 1,
page 8), so poverty measured by the enforced
deprivation of necessities has increased - by an
average rate of 1 per cent of households per year
during the 1980s and at a slower average rate of 0.3
per cent of households per year during the 1990s.
This represented about half a million extra people
living in poverty on average each year between 1983
and 1990, and a smaller but continuing increase
during the 1990s. This dramatic rise in poverty, in
terms of the enforced lack of necessities, occurred
while the majority of the British population became
richer.
P O V E R T Y A N D S O C I A L E X C L U S I O N I N B R I T A I N
52

Long-term poverty
Although poverty affects a quarter of British
households, in the majority of cases the welfare state
provides an effective ‘safety net’ which prevents
people from sinking too deeply into poverty. For
many households, the experience of poverty is
extremely unpleasant but relatively brief. It is
possible to estimate from the PSE survey the number
of households that suffer from long-term chronic
poverty. The 1990 Breadline Britain survey showed
that these households invariably suffered from
extremes of multiple deprivation, misery and want.
This ‘long-term poor’ group was defined in 1990 as
households who have a deprivation score of three or
more (objective poverty), who consider that they are
genuinely poor ‘all the time’ (subjective poverty) and
who have lived in poverty in the past either ‘often’
or ‘most of the time’ (persistent poverty).
Just over 4 per cent of households were long-term
poor in 1990. However, this had fallen to 2.5 per
cent of households by 1999 (Table 16). Thus,
although more than half a million households were
suffering from long-term chronic poverty in 1999,
the numbers have fallen over the 1990s. Whilst
there were more poor households at the end of the
1990s than there were at the beginning of the
decade, there were fewer households suffering from
chronic long-term poverty in 1999, according to the
comparative measure we have used, than in 1990.
The implications for policy of this evidence of
growing poverty are considerable. To halt and
reverse the trend as the Government has committed
itself to doing will require major structural actions
affecting benefits, taxes, public services, market
conditions and earnings. These implications will be
examined in detail in subsequent reports.
Notes
1 Source: Institute for Fiscal Studies database
2 The improvements to the measurement of poverty in the PSE
survey are evolutionary compared with the Breadline Britain
methods. There is nothing radically wrong with what was done
in the 1983 and 1990 surveys and, indeed, the directly
comparable data produced in Chapter 4 tells a very similar story.
The 1983 and 1990 results should not be thought of as wrong any
more than the HBAI is wrong because of the inadequacies of the
McClements’ equivalisation scale. There is always room for
improvement and that is what the PSE represents.
53
T H E G R O W T H O F P O V E R T Y I N B R I T A I N
Table 16: Long-term chronicpoverty in 1990 and 1999
Households Households
in 1990 in 1999
(%) (%)
Not poor 79.0 76.0
Poor (not long-term) 17.0 21.5
Long-term poor 4.0 2.5
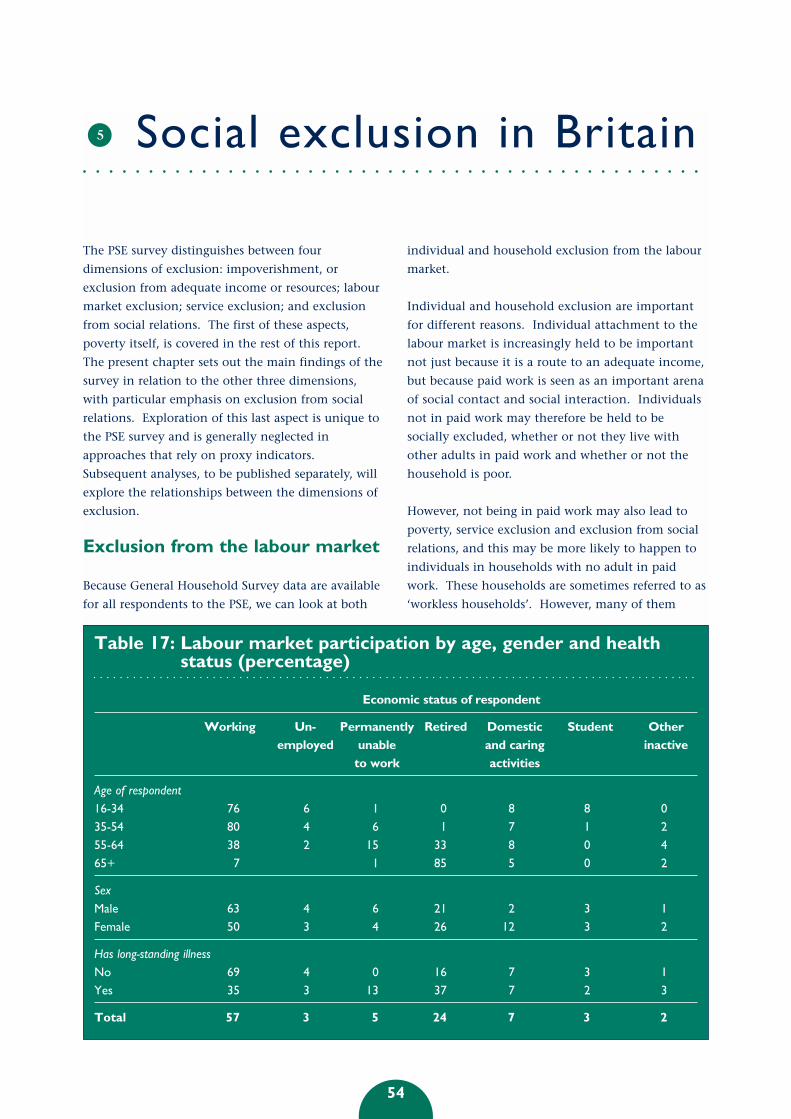
54
The PSE survey distinguishes between four
dimensions of exclusion: impoverishment, or
exclusion from adequate income or resources; labour
market exclusion; service exclusion; and exclusion
from social relations. The first of these aspects,
poverty itself, is covered in the rest of this report.
The present chapter sets out the main findings of the
survey in relation to the other three dimensions,
with particular emphasis on exclusion from social
relations. Exploration of this last aspect is unique to
the PSE survey and is generally neglected in
approaches that rely on proxy indicators.
Subsequent analyses, to be published separately, will
explore the relationships between the dimensions of
exclusion.
Exclusion from the labour market
Because General Household Survey data are available
for all respondents to the PSE, we can look at both
individual and household exclusion from the labour
market.
Individual and household exclusion are important
for different reasons. Individual attachment to the
labour market is increasingly held to be important
not just because it is a route to an adequate income,
but because paid work is seen as an important arena
of social contact and social interaction. Individuals
not in paid work may therefore be held to be
socially excluded, whether or not they live with
other adults in paid work and whether or not the
household is poor.
However, not being in paid work may also lead to
poverty, service exclusion and exclusion from social
relations, and this may be more likely to happen to
individuals in households with no adult in paid
work. These households are sometimes referred to as
‘workless households’. However, many of them
Table 17: Labour market participation by age, gender and healthstatus (percentage)
Economic status of respondent
Working Un- Permanently Retired Domestic Student Other
employed unable and caring inactive
to work activities
Age of respondent
16-34 76 6 1 0 8 8 0
35-54 80 4 6 1 7 1 2
55-64 38 2 15 33 8 0 4
65+ 7 1 85 5 0 2
Sex
Male 63 4 6 21 2 3 1
Female 50 3 4 26 12 3 2
Has long-standing illness
No 69 4 0 16 7 3 1
Yes 35 3 13 37 7 2 3
Total 57 3 5 24 7 3 2
5 Social exclusion in Britain
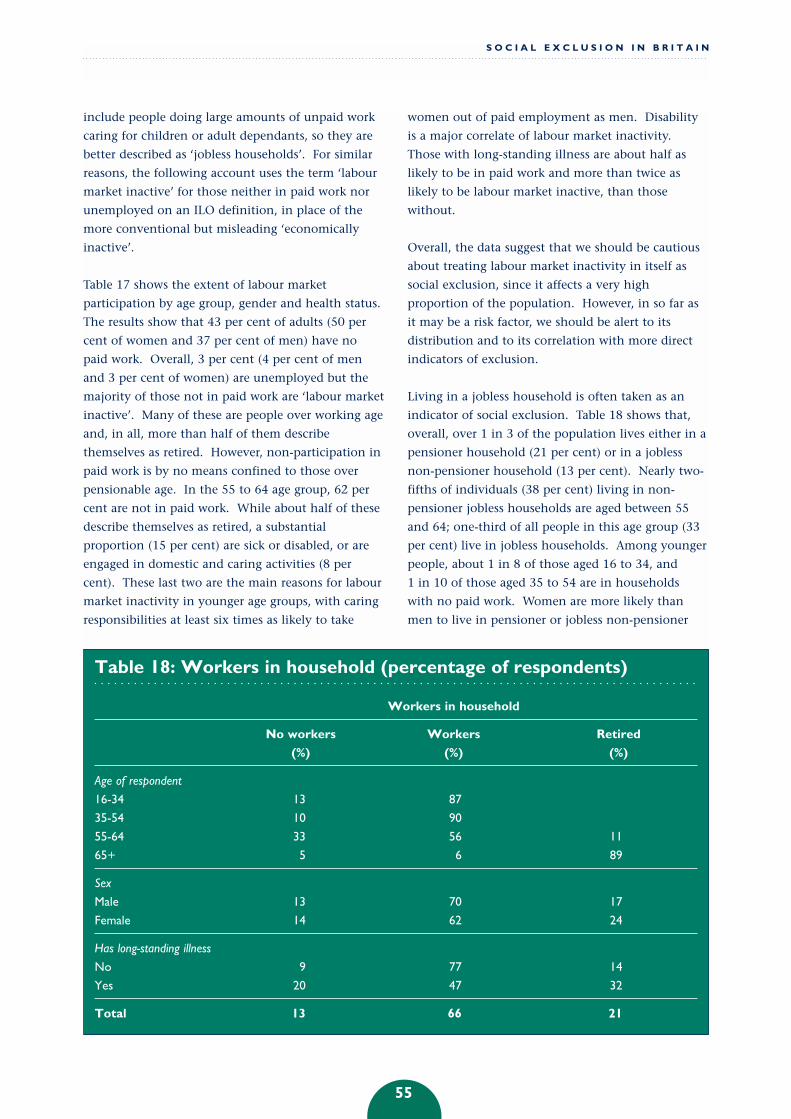
include people doing large amounts of unpaid work
caring for children or adult dependants, so they are
better described as ‘jobless households’. For similar
reasons, the following account uses the term ‘labour
market inactive’ for those neither in paid work nor
unemployed on an ILO definition, in place of the
more conventional but misleading ‘economically
inactive’.
Table 17 shows the extent of labour market
participation by age group, gender and health status.
The results show that 43 per cent of adults (50 per
cent of women and 37 per cent of men) have no
paid work. Overall, 3 per cent (4 per cent of men
and 3 per cent of women) are unemployed but the
majority of those not in paid work are ‘labour market
inactive’. Many of these are people over working age
and, in all, more than half of them describe
themselves as retired. However, non-participation in
paid work is by no means confined to those over
pensionable age. In the 55 to 64 age group, 62 per
cent are not in paid work. While about half of these
describe themselves as retired, a substantial
proportion (15 per cent) are sick or disabled, or are
engaged in domestic and caring activities (8 per
cent). These last two are the main reasons for labour
market inactivity in younger age groups, with caring
responsibilities at least six times as likely to take
women out of paid employment as men. Disability
is a major correlate of labour market inactivity.
Those with long-standing illness are about half as
likely to be in paid work and more than twice as
likely to be labour market inactive, than those
without.
Overall, the data suggest that we should be cautious
about treating labour market inactivity in itself as
social exclusion, since it affects a very high
proportion of the population. However, in so far as
it may be a risk factor, we should be alert to its
distribution and to its correlation with more direct
indicators of exclusion.
Living in a jobless household is often taken as an
indicator of social exclusion. Table 18 shows that,
overall, over 1 in 3 of the population lives either in a
pensioner household (21 per cent) or in a jobless
non-pensioner household (13 per cent). Nearly two-
fifths of individuals (38 per cent) living in non-
pensioner jobless households are aged between 55
and 64; one-third of all people in this age group (33
per cent) live in jobless households. Among younger
people, about 1 in 8 of those aged 16 to 34, and
1 in 10 of those aged 35 to 54 are in households
with no paid work. Women are more likely than
men to live in pensioner or jobless non-pensioner
55
S O C I A L E X C L U S I O N I N B R I T A I N
Table 18: Workers in household (percentage of respondents)
Workers in household
No workers Workers Retired
(%) (%) (%)
Age of respondent
16-34 13 87
35-54 10 90
55-64 33 56 11
65+ 5 6 89
Sex
Male 13 70 17
Female 14 62 24
Has long-standing illness
No 9 77 14
Yes 20 47 32
Total 13 66 21
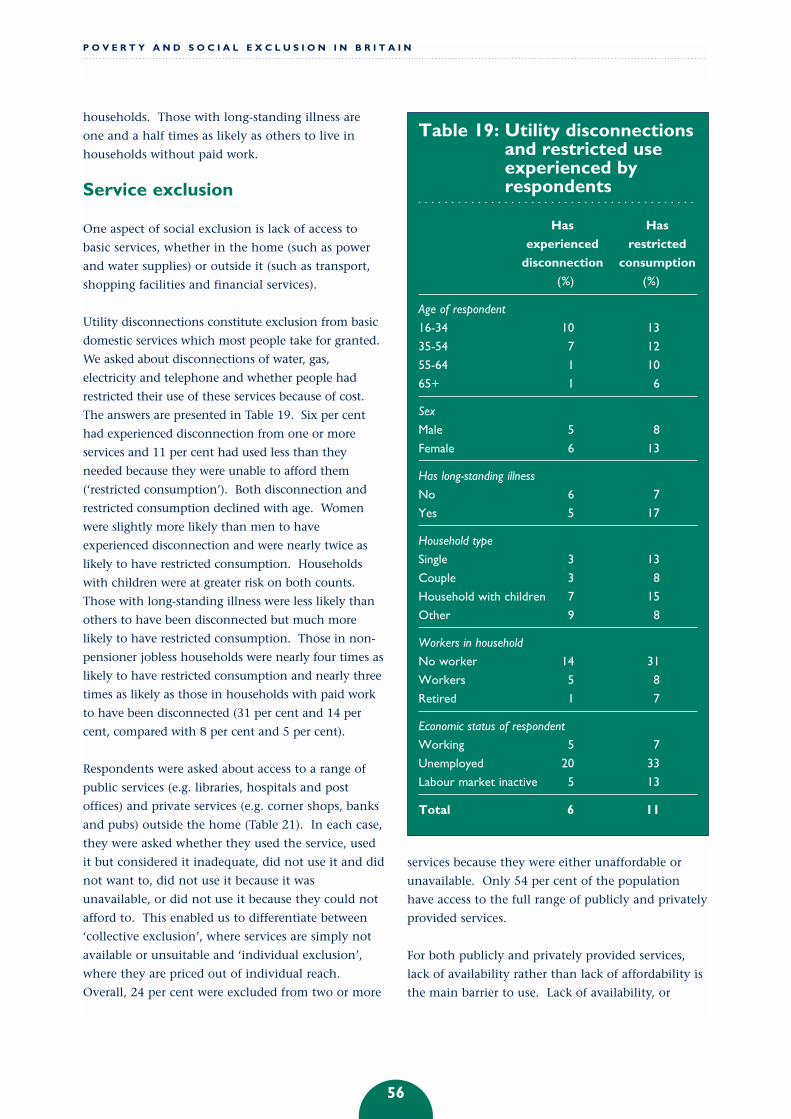
households. Those with long-standing illness are
one and a half times as likely as others to live in
households without paid work.
Service exclusion
One aspect of social exclusion is lack of access to
basic services, whether in the home (such as power
and water supplies) or outside it (such as transport,
shopping facilities and financial services).
Utility disconnections constitute exclusion from basic
domestic services which most people take for granted.
We asked about disconnections of water, gas,
electricity and telephone and whether people had
restricted their use of these services because of cost.
The answers are presented in Table 19. Six per cent
had experienced disconnection from one or more
services and 11 per cent had used less than they
needed because they were unable to afford them
(‘restricted consumption’). Both disconnection and
restricted consumption declined with age. Women
were slightly more likely than men to have
experienced disconnection and were nearly twice as
likely to have restricted consumption. Households
with children were at greater risk on both counts.
Those with long-standing illness were less likely than
others to have been disconnected but much more
likely to have restricted consumption. Those in non-
pensioner jobless households were nearly four times as
likely to have restricted consumption and nearly three
times as likely as those in households with paid work
to have been disconnected (31 per cent and 14 per
cent, compared with 8 per cent and 5 per cent).
Respondents were asked about access to a range of
public services (e.g. libraries, hospitals and post
offices) and private services (e.g. corner shops, banks
and pubs) outside the home (Table 21). In each case,
they were asked whether they used the service, used
it but considered it inadequate, did not use it and did
not want to, did not use it because it was
unavailable, or did not use it because they could not
afford to. This enabled us to differentiate between
‘collective exclusion’, where services are simply not
available or unsuitable and ‘individual exclusion’,
where they are priced out of individual reach.
Overall, 24 per cent were excluded from two or more
services because they were either unaffordable or
unavailable. Only 54 per cent of the population
have access to the full range of publicly and privately
provided services.
For both publicly and privately provided services,
lack of availability rather than lack of affordability is
the main barrier to use. Lack of availability, or
P O V E R T Y A N D S O C I A L E X C L U S I O N I N B R I T A I N
56
Table 19: Utility disconnectionsand restricted useexperienced byrespondents
Has Has
experienced restricted
disconnection consumption
(%) (%)
Age of respondent
16-34 10 13
35-54 7 12
55-64 1 10
65+ 1 6
Sex
Male 5 8
Female 6 13
Has long-standing illness
No 6 7
Yes 5 17
Household type
Single 3 13
Couple 3 8
Household with children 7 15
Other 9 8
Workers in household
No worker 14 31
Workers 5 8
Retired 1 7
Economic status of respondent
Working 5 7
Unemployed 20 33
Labour market inactive 5 13
Total 6 11
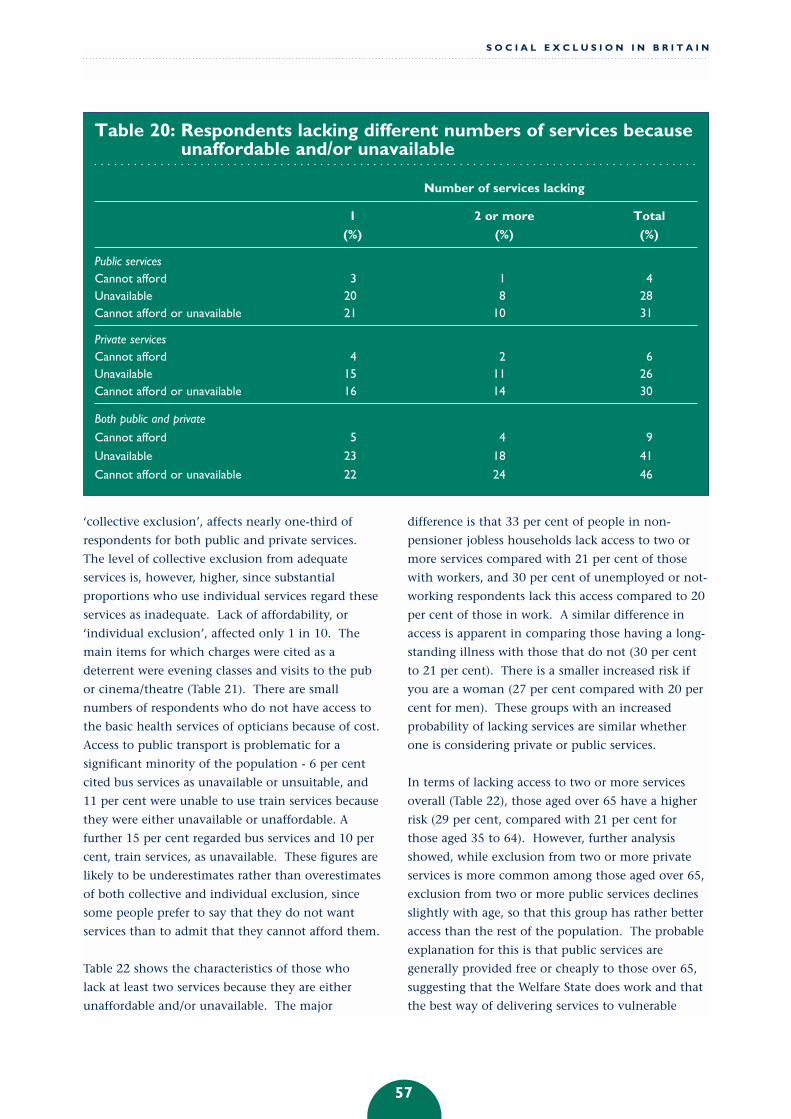
‘collective exclusion’, affects nearly one-third of
respondents for both public and private services.
The level of collective exclusion from adequate
services is, however, higher, since substantial
proportions who use individual services regard these
services as inadequate. Lack of affordability, or
‘individual exclusion’, affected only 1 in 10. The
main items for which charges were cited as a
deterrent were evening classes and visits to the pub
or cinema/theatre (Table 21). There are small
numbers of respondents who do not have access to
the basic health services of opticians because of cost.
Access to public transport is problematic for a
significant minority of the population - 6 per cent
cited bus services as unavailable or unsuitable, and
11 per cent were unable to use train services because
they were either unavailable or unaffordable. A
further 15 per cent regarded bus services and 10 per
cent, train services, as unavailable. These figures are
likely to be underestimates rather than overestimates
of both collective and individual exclusion, since
some people prefer to say that they do not want
services than to admit that they cannot afford them.
Table 22 shows the characteristics of those who
lack at least two services because they are either
unaffordable and/or unavailable. The major
difference is that 33 per cent of people in non-
pensioner jobless households lack access to two or
more services compared with 21 per cent of those
with workers, and 30 per cent of unemployed or not-
working respondents lack this access compared to 20
per cent of those in work. A similar difference in
access is apparent in comparing those having a long-
standing illness with those that do not (30 per cent
to 21 per cent). There is a smaller increased risk if
you are a woman (27 per cent compared with 20 per
cent for men). These groups with an increased
probability of lacking services are similar whether
one is considering private or public services.
In terms of lacking access to two or more services
overall (Table 22), those aged over 65 have a higher
risk (29 per cent, compared with 21 per cent for
those aged 35 to 64). However, further analysis
showed, while exclusion from two or more private
services is more common among those aged over 65,
exclusion from two or more public services declines
slightly with age, so that this group has rather better
access than the rest of the population. The probable
explanation for this is that public services are
generally provided free or cheaply to those over 65,
suggesting that the Welfare State does work and that
the best way of delivering services to vulnerable
57
S O C I A L E X C L U S I O N I N B R I T A I N
Table 20: Respondents lacking different numbers of services becauseunaffordable and/or unavailable
Number of services lacking
1 2 or more Total
(%) (%) (%)
Public servicesCannot afford 3 1 4Unavailable 20 8 28Cannot afford or unavailable 21 10 31
Private servicesCannot afford 4 2 6Unavailable 15 11 26Cannot afford or unavailable 16 14 30
Both public and private
Cannot afford 5 4 9
Unavailable 23 18 41
Cannot afford or unavailable 22 24 46

groups is by providing public services, free at the
point of use.
Referring to Table 21, among the services asked about
were banks and building societies. Five per cent of
adults said they did not use these services. In most
cases, the reason given was that they did not want
to. Whilst 1 per cent said they were unavailable,
none said that they could not afford them. Lack of
access to a bank account is an increasingly important
marker of financial exclusion, as fewer and fewer
transactions can be effected purely in cash and as the
provision of post offices and sub-post offices
declines. The question about access to services was
supplemented by a direct question about the
possession of bank or building society accounts.
Seven per cent of adults have no access to a bank
account in their own right. About 1 in 4 of these
lives with a partner or spouse with an account but 1
in 20 of the household population appear to be
currently without access to one, either personally or
by proxy.
It is important to note that factors other than price
may also result in effective exclusion from services
and activities. Those with limiting long-standing
illness or disability were asked about difficulties in
accessing various services. Nearly 1 in 3 reported
great difficulty using services such as cinemas,
museums, shops and restaurants and 1 in 6 had had
P O V E R T Y A N D S O C I A L E X C L U S I O N I N B R I T A I N
58
Table 21: Which public and private services respondents used
Collective exclusion Individual exclusion
Use - Use - Don’t use - Don’t use – Don’t use –
adequate inadequate unavailable or can’t afford don’t want or
unsuitable not relevant
(%) (%) (%) (%) (%)
Public services
Libraries 55 6 3 0 36
Public sports facilities 39 7 5 1 48
Museums and galleries 29 4 13 1 52
Evening classes 17 2 5 3 73
A public or community village hall 31 3 9 0 56
A hospital with accident/
emergency unit 75 13 2 0 10
Doctor 92 6 0 0 2
Dentist 83 5 1 0 11
Optician 78 3 1 1 17
Post office 93 4 0 0 2
Private services
Places of worship 30 1 2 0 66
Bus services 38 15 6 0 41
Train or tube station 37 10 10 1 41
Petrol stations 75 2 2 1 21
Chemist 93 3 1 0 3
Corner shop 73 7 8 0 12
Medium to large supermarket 92 4 2 0 2
Banks or building societies 87 7 1 0 4
Pub 53 4 2 2 37
Cinema or theatre 45 6 10 5 33

problems arranging accommodation or insurance or
using banks, building societies and public telephones
(Table 23).
Exclusion from social relations
A unique feature of the PSE survey is that it seeks
direct information about social relations and social
participation. At this stage of the analysis, we can
simply describe the pattern of exclusion from social
relations among the household population. In future
analysis, the links between this and other aspects of
exclusion - poverty, joblessness and service exclusion
- can be explored. Exclusion from social relations can
be looked at in different ways: through non-
participation in common social activities; isolation;
lack of support; disengagement; and confinement.
Non-participation in common social activitiesTables 24 and 25 show the extent to which people
participate in a range of common social activities
and the proportion excluded by lack of money. Only
59
S O C I A L E X C L U S I O N I N B R I T A I N
Table 22: Service exclusion by selected key variables
Number of public/private services unaffordable/unavailable
1 2 or more Total
(%) (%) (%)
Age of respondent
16-34 16 26 42
35-54 27 21 49
55-64 21 19 40
65+ 23 29 52
Sex
Male 22 20 42
Female 22 27 49
Has long-standing illness
No 22 21 43
Yes 22 30 52
Household type
Single 20 29 49
Couple 21 25 46
Household with children 24 21 45
Other 22 22 44
Workers in household
No worker 19 33 52
Workers 22 21 43
Retired 23 27 51
Economic status of respondent
Working 22 20 42
Unemployed 15 30 45
Labour market inactive 22 30 52
Total 22 24 46
Note: Numbers may not sum due to rounding
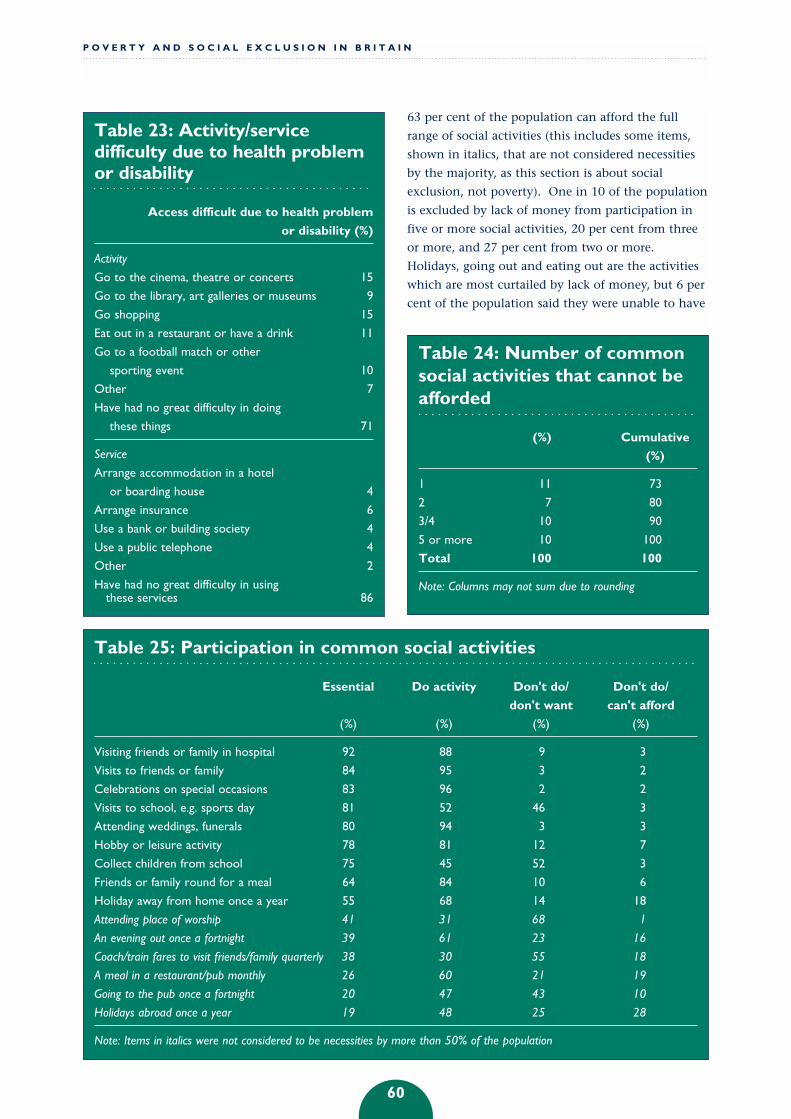
63 per cent of the population can afford the full
range of social activities (this includes some items,
shown in italics, that are not considered necessities
by the majority, as this section is about social
exclusion, not poverty). One in 10 of the population
is excluded by lack of money from participation in
five or more social activities, 20 per cent from three
or more, and 27 per cent from two or more.
Holidays, going out and eating out are the activities
which are most curtailed by lack of money, but 6 per
cent of the population said they were unable to have
P O V E R T Y A N D S O C I A L E X C L U S I O N I N B R I T A I N
60
Table 23: Activity/servicedifficulty due to health problemor disability
Access difficult due to health problem
or disability (%)
Activity
Go to the cinema, theatre or concerts 15
Go to the library, art galleries or museums 9
Go shopping 15
Eat out in a restaurant or have a drink 11
Go to a football match or other
sporting event 10
Other 7
Have had no great difficulty in doing
these things 71
Service
Arrange accommodation in a hotel
or boarding house 4
Arrange insurance 6
Use a bank or building society 4
Use a public telephone 4
Other 2
Have had no great difficulty in using these services 86
Table 25: Participation in common social activities
Essential Do activity Don't do/ Don't do/
don't want can't afford
(%) (%) (%) (%)
Visiting friends or family in hospital 92 88 9 3
Visits to friends or family 84 95 3 2
Celebrations on special occasions 83 96 2 2
Visits to school, e.g. sports day 81 52 46 3
Attending weddings, funerals 80 94 3 3
Hobby or leisure activity 78 81 12 7
Collect children from school 75 45 52 3
Friends or family round for a meal 64 84 10 6
Holiday away from home once a year 55 68 14 18
Attending place of worship 41 31 68 1
An evening out once a fortnight 39 61 23 16
Coach/train fares to visit friends/family quarterly 38 30 55 18
A meal in a restaurant/pub monthly 26 60 21 19
Going to the pub once a fortnight 20 47 43 10
Holidays abroad once a year 19 48 25 28
Note: Items in italics were not considered to be necessities by more than 50% of the population
Table 24: Number of commonsocial activities that cannot beafforded
(%) Cumulative
(%)
1 11 73
2 7 80
3/4 10 90
5 or more 10 100
Total 100 100
Note: Columns may not sum due to rounding

friends or family round for a meal, snack or drink.
Seven per cent were unable to afford a hobby or
leisure activity. Smaller numbers were excluded from
such basic social activities as visiting family and
friends, even when in hospital, and attending
weddings and funerals.
Table 26 shows the groups participating in social
activities. Most strikingly, these are unemployed
people (59 per cent, compared with 23 per cent of
working people) and those living in jobless non-
pensioner households (51 per cent compared with 23
per cent of people in households with workers or
pensioners). There is also lower participation by
households with children (40 per cent compared with
26 per cent of single people and 16 per cent of
couples without children). Greater proportions of the
youngest age group (aged 16 to 34) lack participation
in two or more activities (36 per cent compared with
25 per cent of those aged 35 to 54, and 20 per cent or
more of those aged 55 and over). A slightly higher
proportion of women do not participate in two or
61
S O C I A L E X C L U S I O N I N B R I T A I N
Table 26: Non-participation in common social activities becauserespondents cannot afford them, by selected variables
Social activities lacking because cannot afford
1 2 3/4 5+ Total
(%) (%) (%) (%) (%)
Age of respondent
16-34 13 9 11 16 49
35-54 10 4 11 10 36
55-64 9 4 9 7 29
65+ 9 9 8 5 31
Sex
Male 11 7 8 9 36
Female 10 6 11 12 39
Has long-standing illness
No 12 7 9 9 37
Yes 8 7 11 13 38
Household type
Single 10 6 10 10 35
Couple 9 5 6 5 25
Household with children 13 9 15 16 53
Other 11 6 9 12 38
Workers in household
No worker 10 9 14 28 60
Workers 11 6 9 8 35
Retired 8 8 9 6 32
Economic status of respondent
Working 12 6 8 8 34
Unemployed 6 6 21 32 65
Labour market inactive 9 8 12 12 40
Total 11 7 10 10 37
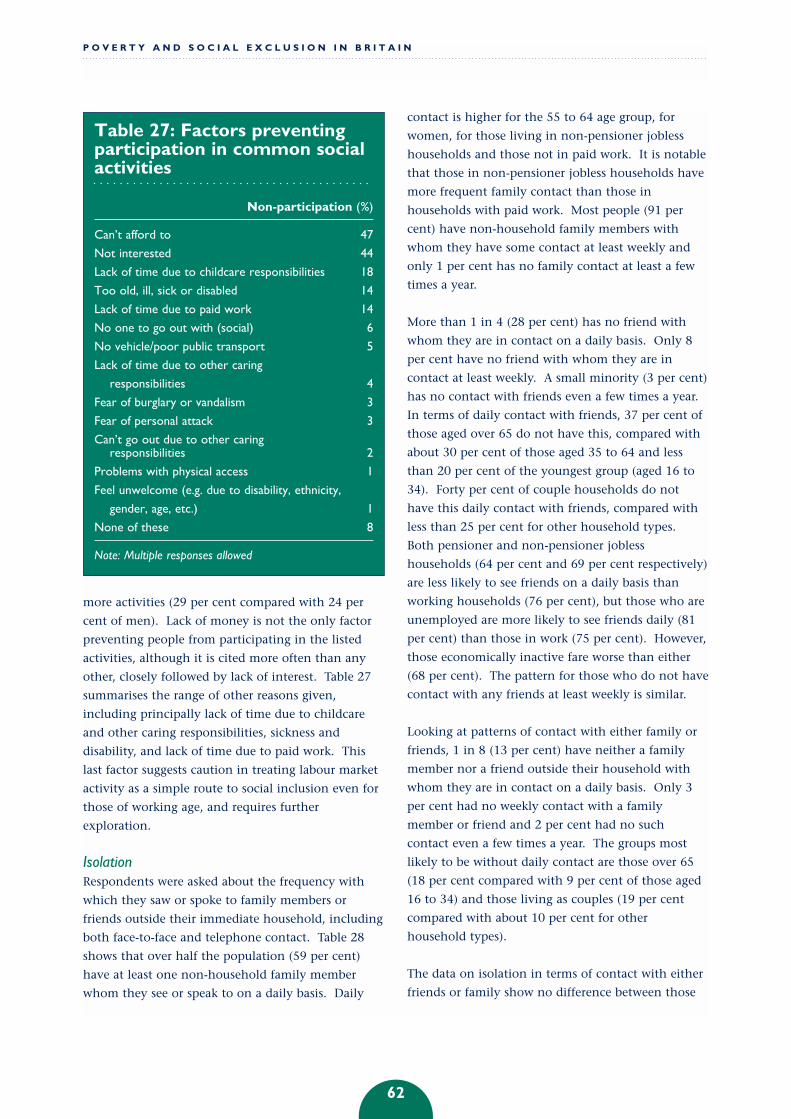
more activities (29 per cent compared with 24 per
cent of men). Lack of money is not the only factor
preventing people from participating in the listed
activities, although it is cited more often than any
other, closely followed by lack of interest. Table 27
summarises the range of other reasons given,
including principally lack of time due to childcare
and other caring responsibilities, sickness and
disability, and lack of time due to paid work. This
last factor suggests caution in treating labour market
activity as a simple route to social inclusion even for
those of working age, and requires further
exploration.
IsolationRespondents were asked about the frequency with
which they saw or spoke to family members or
friends outside their immediate household, including
both face-to-face and telephone contact. Table 28
shows that over half the population (59 per cent)
have at least one non-household family member
whom they see or speak to on a daily basis. Daily
contact is higher for the 55 to 64 age group, for
women, for those living in non-pensioner jobless
households and those not in paid work. It is notable
that those in non-pensioner jobless households have
more frequent family contact than those in
households with paid work. Most people (91 per
cent) have non-household family members with
whom they have some contact at least weekly and
only 1 per cent has no family contact at least a few
times a year.
More than 1 in 4 (28 per cent) has no friend with
whom they are in contact on a daily basis. Only 8
per cent have no friend with whom they are in
contact at least weekly. A small minority (3 per cent)
has no contact with friends even a few times a year.
In terms of daily contact with friends, 37 per cent of
those aged over 65 do not have this, compared with
about 30 per cent of those aged 35 to 64 and less
than 20 per cent of the youngest group (aged 16 to
34). Forty per cent of couple households do not
have this daily contact with friends, compared with
less than 25 per cent for other household types.
Both pensioner and non-pensioner jobless
households (64 per cent and 69 per cent respectively)
are less likely to see friends on a daily basis than
working households (76 per cent), but those who are
unemployed are more likely to see friends daily (81
per cent) than those in work (75 per cent). However,
those economically inactive fare worse than either
(68 per cent). The pattern for those who do not have
contact with any friends at least weekly is similar.
Looking at patterns of contact with either family or
friends, 1 in 8 (13 per cent) have neither a family
member nor a friend outside their household with
whom they are in contact on a daily basis. Only 3
per cent had no weekly contact with a family
member or friend and 2 per cent had no such
contact even a few times a year. The groups most
likely to be without daily contact are those over 65
(18 per cent compared with 9 per cent of those aged
16 to 34) and those living as couples (19 per cent
compared with about 10 per cent for other
household types).
The data on isolation in terms of contact with either
friends or family show no difference between those
P O V E R T Y A N D S O C I A L E X C L U S I O N I N B R I T A I N
62
Table 27: Factors preventingparticipation in common socialactivities
Non-participation (%)
Can’t afford to 47
Not interested 44
Lack of time due to childcare responsibilities 18
Too old, ill, sick or disabled 14
Lack of time due to paid work 14
No one to go out with (social) 6
No vehicle/poor public transport 5
Lack of time due to other caring
responsibilities 4
Fear of burglary or vandalism 3
Fear of personal attack 3
Can’t go out due to other caring responsibilities 2
Problems with physical access 1
Feel unwelcome (e.g. due to disability, ethnicity,
gender, age, etc.) 1
None of these 8
Note: Multiple responses allowed
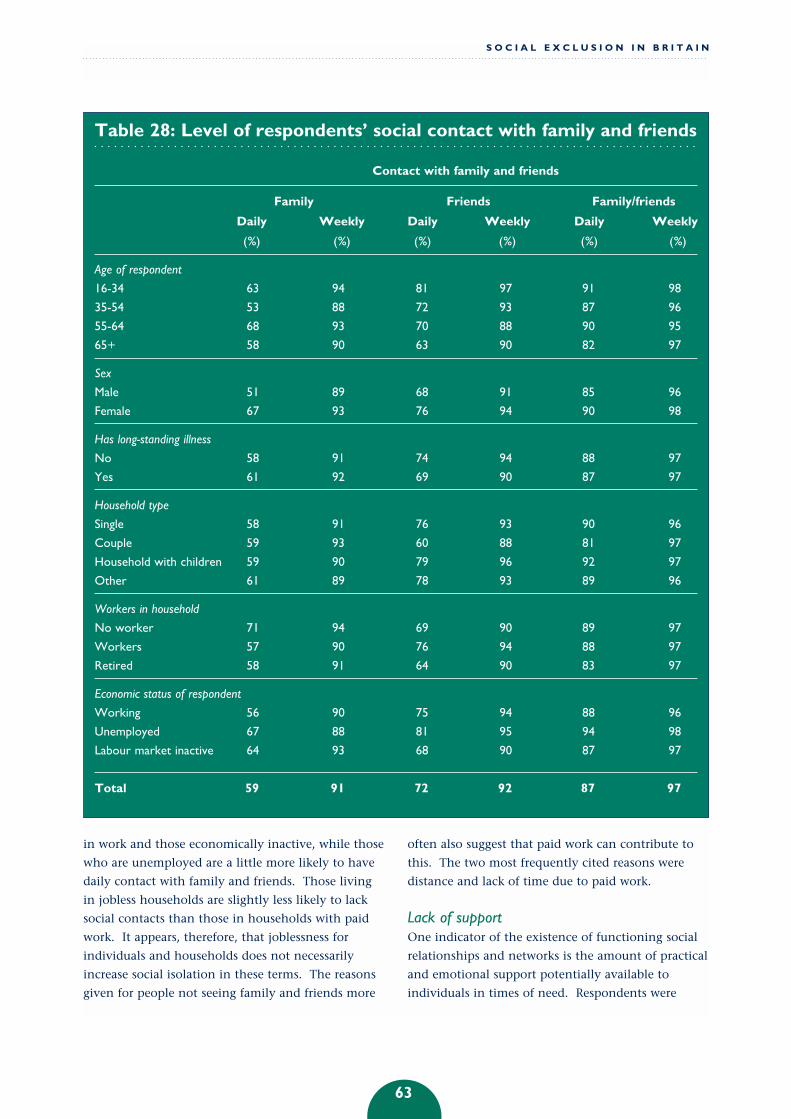
in work and those economically inactive, while those
who are unemployed are a little more likely to have
daily contact with family and friends. Those living
in jobless households are slightly less likely to lack
social contacts than those in households with paid
work. It appears, therefore, that joblessness for
individuals and households does not necessarily
increase social isolation in these terms. The reasons
given for people not seeing family and friends more
often also suggest that paid work can contribute to
this. The two most frequently cited reasons were
distance and lack of time due to paid work.
Lack of supportOne indicator of the existence of functioning social
relationships and networks is the amount of practical
and emotional support potentially available to
individuals in times of need. Respondents were
63
S O C I A L E X C L U S I O N I N B R I T A I N
Table 28: Level of respondents’ social contact with family and friends
Contact with family and friends
Family Friends Family/friends
Daily Weekly Daily Weekly Daily Weekly
(%) (%) (%) (%) (%) (%)
Age of respondent
16-34 63 94 81 97 91 98
35-54 53 88 72 93 87 96
55-64 68 93 70 88 90 95
65+ 58 90 63 90 82 97
Sex
Male 51 89 68 91 85 96
Female 67 93 76 94 90 98
Has long-standing illness
No 58 91 74 94 88 97
Yes 61 92 69 90 87 97
Household type
Single 58 91 76 93 90 96
Couple 59 93 60 88 81 97
Household with children 59 90 79 96 92 97
Other 61 89 78 93 89 96
Workers in household
No worker 71 94 69 90 89 97
Workers 57 90 76 94 88 97
Retired 58 91 64 90 83 97
Economic status of respondent
Working 56 90 75 94 88 96
Unemployed 67 88 81 95 94 98
Labour market inactive 64 93 68 90 87 97
Total 59 91 72 92 87 97

asked how much support they would expect to get in
seven situations, including support from members of
the household, other family and friends and any
other means of support. Four items related to
practical support: needing help around the home
when in bed with flu; help with heavy household or
gardening jobs; help with caring responsibilities for
children or elderly or disabled adults; someone to
look after the home or possessions when away.
Three related to emotional support: needing advice
about an important life change; someone to talk to if
depressed; and someone to talk to about problems
with a spouse or partner. The results are summarised
in Table 29.
Only just over half (54 per cent) of the population
expect to be able to call on ‘some’ or ‘a lot’ of
support in all seven categories. More than 1 in 5 (23
P O V E R T Y A N D S O C I A L E X C L U S I O N I N B R I T A I N
64
Table 29: Number of situationsin which respondents reported‘a lot of’, or ‘some’ support
Number of situations in (%)
which potential
support available
7 54
6 9
5 8
4 6
3 12
2 2
1 8
0 1
Total 100
Table 30: Proportion ofrespondents having potentialsupport in each of sevensituations
Type of support ‘None’/ ‘Some’/
‘Not much’ ‘A lot’
Informal caring 29 71Help with relationship
problems 23 77
Help with heavy household jobs 13 87
Advice 13 87
Looking after personal possessions 11 89
Talking to if depressed 11 89
Home help during personal illness 9 91
Table 31: Levels of overallsupport across all key areas byselected variables
Level of support
Good Reasonable Poor
Age of respondent
16-34 61 20 19
35-54 54 24 23
55-64 46 25 29
65+ 48 28 24
Sex
Male 51 23 26
Female 56 24 20
Has long-standing illness
No 54 23 23
Yes 52 25 23
Household type
Single 42 32 27
Couple 53 21 26
Household
with children 61 23 16
Other 54 23 23
Workers in household
No worker 47 33 20
Workers 56 21 23
Retired 49 27 25
Economic status of respondent
Working 58 21 21
Unemployed 45 31 24
Labour market inactive 48 27 25

per cent) lacks adequate support in at least four out
of seven areas. Nearly 10 per cent have some or a lot
of support in no situations or only one situation.
Table 30 shows that, in each situation, the majority
of the population think they could rely on support
but at least 1 in 10 have little or no support in each
situation and this rises to about 1 in 4 in the case of
advice about relationship problems and 1 in 3 for
informal caring.
Those with ‘thin’ support (i.e. none or not much
support) are not evenly spread through the
population (Table 31). We divided the data into
those with good support (some or a lot of support in
all seven situations), reasonable support (lacking
good support in one to three situations) and poor
support (lacking good support in four or more
situations). Overall, men have poorer support
networks than women. People with jobs are more
likely to expect good support than those
unemployed or outside the labour market. Those in
retired and non-pensioner jobless households report
less supportive networks. However, those in non-
pensioner jobless households are less likely to report
poor, rather than reasonable, support than those in
either retired or working households. It should be
stressed that the questions asked were about help
potentially available. They thus reflect how
supported people feel, rather than being a simple
measure of how supported they actually are -
although of course respondents will also have drawn
on their experience of support or the lack of it in
specific situations. The higher expectations of those
in paid work may not be wholly born out in practice.
DisengagementLack of civic engagement is sometimes deemed
to be an important aspect of social exclusion.
Respondents were asked which of a list of activities
they had done in the last three years and whether
they were currently actively involved in any of a
comprehensive range of organisations. About 17 per
cent have taken no such action at all in the previous
three years. The only two activities which drew
more than 1 in 3 of the population were voting in
local and in general elections (Table 32).
Looking next at current participation in various types
of civic organisation, this revealed that just under
60 per cent are involved, with sports clubs claiming
the highest number of participants, at around 18 per
cent (Table 33). Combining the activities and
organisations covered in Tables 32 and 33, a total of
88 per cent of individuals were engaged in some way,
leaving just under 12 per cent apparently disengaged.
The importance of voting in this total should be
emphasised - excluding it would mean that 30 per
cent are disengaged (Table 34).
The distribution of disengagement among different
groups is also outlined in Table 34. With some
exceptions, the patterns are similar for the 12 per
cent who have no engagement at all and the 30 per
cent who have no engagement beyond possibly
voting. The differences between different groups are
generally quite small. The 16-34 age group have
relatively high levels of disengagement, compared
with 35- to 64-year-olds, although it rises again to
similar levels to the young for older people, apart
from voting. Not working or being in a workless
household tends to raise disengagement, although
again retired households vote more.
ConfinementParticipation in social activities and social contact
beyond the household depends on being able to get
out and about. People who are not able to move
about freely may be effectively excluded from full
social participation. In addition to factors such as
affordability, childcare responsibilities, being too old,
disabled or sick, or lack of time due to paid work
(Table 27), other factors are involved which leave
people substantially confined to their home and, in
less extreme cases, reduce their level of activity. A
prime example is personal safety. Table 35 shows that
30 per cent of the population feels unsafe walking
alone after dark. Those most likely to feel unsafe are
women, older people, those not in paid work and
those in pensioner and non-pensioner jobless
households (Table 35).
65
S O C I A L E X C L U S I O N I N B R I T A I N

P O V E R T Y A N D S O C I A L E X C L U S I O N I N B R I T A I N
66
Table 32: Civic activities undertaken in the last three years
Activity (%)
Voted in the last general election 73
Voted in the last local election 65
Helped on fundraising drives 29
Urged someone outside the family to vote 20
Presented views to local councillor 16
Urged someone to get in touch with a local councillor 16
Been an officer of an organisation or club 14
Made a speech before an organised group 11
Written a letter to an editor 5
Taken an active part in a political campaign 3
Stood for civic office 1
None of these 17
Note: Multiple responses allowed
Table 33: Current active involvement in civic organisations
Type of group (%)
Sports club 18
Religious group or church organisation 12
Any other group or organisation 11
Trade union 10
Social club or working men’s club 10
Tenants, Residents Association, Neighbourhood Watch 9
Voluntary service group 8
Parents’ or school association 6
Environmental group 3
Other community or civic group 3
Women’s group or organisation 3
Political party 2
Other pressure group 2
Women’s Institute or Townswomen’s Guild 1
None of these 41
Don’t know 3
Note: Multiple responses allowed
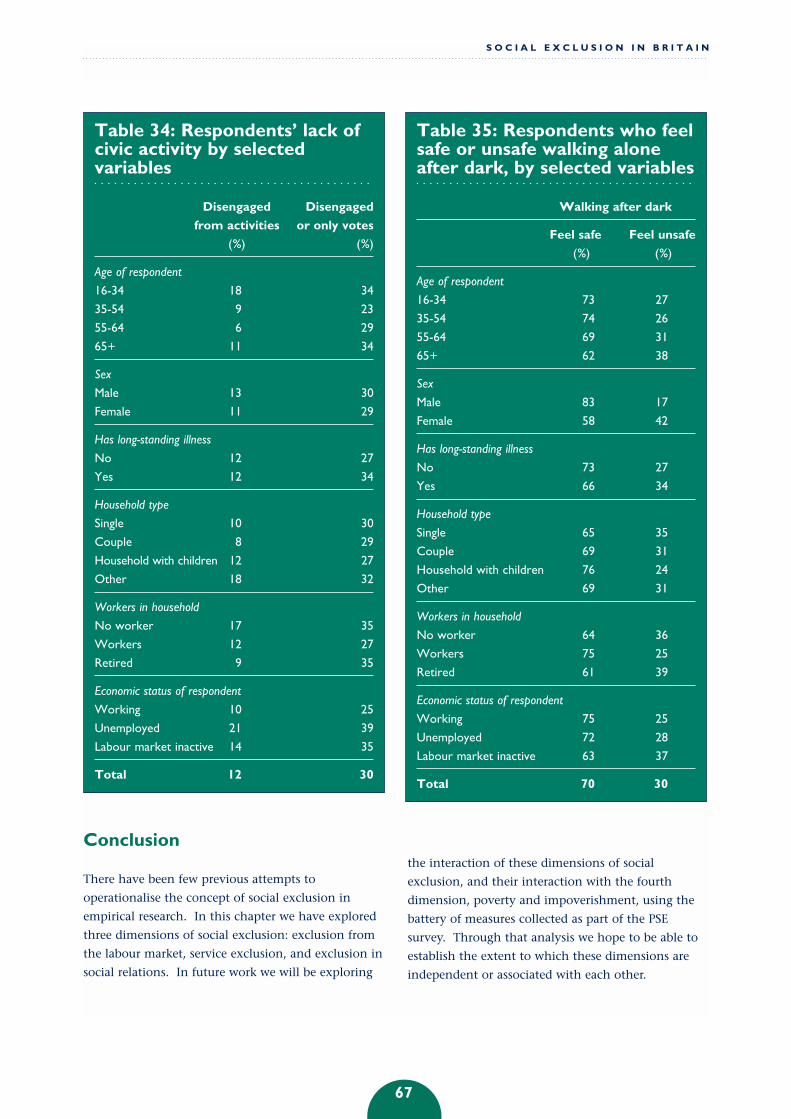
67
Conclusion
There have been few previous attempts to
operationalise the concept of social exclusion in
empirical research. In this chapter we have explored
three dimensions of social exclusion: exclusion from
the labour market, service exclusion, and exclusion in
social relations. In future work we will be exploring
the interaction of these dimensions of social
exclusion, and their interaction with the fourth
dimension, poverty and impoverishment, using the
battery of measures collected as part of the PSE
survey. Through that analysis we hope to be able to
establish the extent to which these dimensions are
independent or associated with each other.
S O C I A L E X C L U S I O N I N B R I T A I N
Table 34: Respondents’ lack ofcivic activity by selectedvariables
Disengaged Disengaged
from activities or only votes
(%) (%)
Age of respondent
16-34 18 34
35-54 9 23
55-64 6 29
65+ 11 34
Sex
Male 13 30
Female 11 29
Has long-standing illness
No 12 27
Yes 12 34
Household type
Single 10 30
Couple 8 29
Household with children 12 27
Other 18 32
Workers in household
No worker 17 35
Workers 12 27
Retired 9 35
Economic status of respondent
Working 10 25
Unemployed 21 39
Labour market inactive 14 35
Total 12 30
Table 35: Respondents who feelsafe or unsafe walking aloneafter dark, by selected variables
Walking after dark
Feel safe Feel unsafe
(%) (%)
Age of respondent
16-34 73 27
35-54 74 26
55-64 69 31
65+ 62 38
Sex
Male 83 17
Female 58 42
Has long-standing illness
No 73 27
Yes 66 34
Household type
Single 65 35
Couple 69 31
Household with children 76 24
Other 69 31
Workers in household
No worker 64 36
Workers 75 25
Retired 61 39
Economic status of respondent
Working 75 25
Unemployed 72 28
Labour market inactive 63 37
Total 70 30

68
The Poverty and Social Exclusion Survey of Britain is
the most comprehensive and scientifically rigorous
survey of this type ever undertaken. It provides
unparalleled detail about material and social
deprivation and exclusion among the British
population at the close of the twentieth century.
The UK Government and others have committed
themselves to the aim of eliminating poverty
throughout the world during the twenty-first
century. The UK government has a key role to play
not only by investigating and putting policies in
place to reduce poverty but by influencing scientific
standards of investigation, analysis of causes and
reduction of poverty in other parts of the world. The
PSE survey documents the scale and nature of the
problem in Britain with regard to both poverty and
social exclusion.
Poverty
By the end of 1999, approximately 14.5 million
people (26 per cent) were living in poverty in Britain
according to the PSE survey. The survey’s
measurement of poverty, by taking into account both
low income and multiple deprivation of items
socially defined as necessities, confirms that poverty
rates have risen sharply since the early 1980s.
Between 1983 and 1990, the number of households
living in poverty increased by almost half – from 14
per cent to 21 per cent of the population. Poverty
continued to increase during the 1990s and, by 1999,
the number of households living in poverty had again
increased, to over 24 per cent.
How does this figure compare to historic poverty
levels? At times in the past, bigger proportions of the
British population have been poor and their poverty
has often been more severe and life-threatening.
However, because of the growth in the size of the
population in the twentieth century, a larger number
of people in Britain today are poor, by the standards
of the time, than was the case in previous centuries.
The fact that an unprecedented absolute number of
individuals are affected has significant implications
for the scale and design of solutions.
The survey allows poverty to be described not just as
an aggregate statistic but also in terms of the real
conditions that people face. For example, out of 58
million people in Britain today:
• Roughly 9.5 million people in Britain cannot
afford adequate housing conditions as perceived
by the majority of the population. That is, they
cannot afford to keep their home adequately
heated, free from damp or in a decent state of
decoration.1
• About 8 million people cannot afford one or
more essential household goods, such as a fridge,
a telephone or carpets for living areas, or to
repair electrical goods or furniture when they
break or wear out.
• Almost 7.5 million people are too poor to be able
to engage in those common social activities
considered necessary: visiting friends and family,
attending weddings and funerals, or having
celebrations on special occasions.
• A third of British children go without at least one
of the things they need, like three meals a day,
toys, out of school activities or adequate
clothing. Eighteen per cent of children go
without two or more items or activities defined
as necessities by the majority of the population.
• About 6.5 million adults go without essential
clothing, such as a warm waterproof coat,
because of lack of money.
6 Conclusions
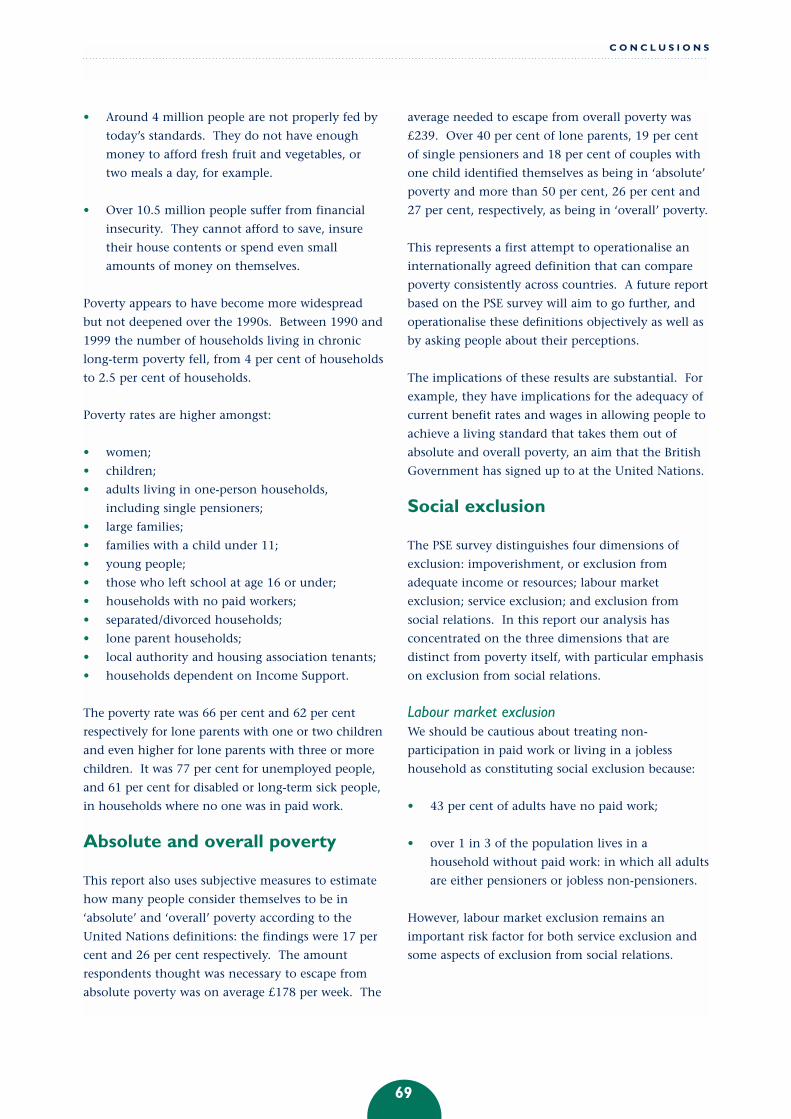
• Around 4 million people are not properly fed by
today’s standards. They do not have enough
money to afford fresh fruit and vegetables, or
two meals a day, for example.
• Over 10.5 million people suffer from financial
insecurity. They cannot afford to save, insure
their house contents or spend even small
amounts of money on themselves.
Poverty appears to have become more widespread
but not deepened over the 1990s. Between 1990 and
1999 the number of households living in chronic
long-term poverty fell, from 4 per cent of households
to 2.5 per cent of households.
Poverty rates are higher amongst:
• women;
• children;
• adults living in one-person households,
including single pensioners;
• large families;
• families with a child under 11;
• young people;
• those who left school at age 16 or under;
• households with no paid workers;
• separated/divorced households;
• lone parent households;
• local authority and housing association tenants;
• households dependent on Income Support.
The poverty rate was 66 per cent and 62 per cent
respectively for lone parents with one or two children
and even higher for lone parents with three or more
children. It was 77 per cent for unemployed people,
and 61 per cent for disabled or long-term sick people,
in households where no one was in paid work.
Absolute and overall poverty
This report also uses subjective measures to estimate
how many people consider themselves to be in
‘absolute’ and ‘overall’ poverty according to the
United Nations definitions: the findings were 17 per
cent and 26 per cent respectively. The amount
respondents thought was necessary to escape from
absolute poverty was on average £178 per week. The
average needed to escape from overall poverty was
£239. Over 40 per cent of lone parents, 19 per cent
of single pensioners and 18 per cent of couples with
one child identified themselves as being in ‘absolute’
poverty and more than 50 per cent, 26 per cent and
27 per cent, respectively, as being in ‘overall’ poverty.
This represents a first attempt to operationalise an
internationally agreed definition that can compare
poverty consistently across countries. A future report
based on the PSE survey will aim to go further, and
operationalise these definitions objectively as well as
by asking people about their perceptions.
The implications of these results are substantial. For
example, they have implications for the adequacy of
current benefit rates and wages in allowing people to
achieve a living standard that takes them out of
absolute and overall poverty, an aim that the British
Government has signed up to at the United Nations.
Social exclusion
The PSE survey distinguishes four dimensions of
exclusion: impoverishment, or exclusion from
adequate income or resources; labour market
exclusion; service exclusion; and exclusion from
social relations. In this report our analysis has
concentrated on the three dimensions that are
distinct from poverty itself, with particular emphasis
on exclusion from social relations.
Labour market exclusionWe should be cautious about treating non-
participation in paid work or living in a jobless
household as constituting social exclusion because:
• 43 per cent of adults have no paid work;
• over 1 in 3 of the population lives in a
household without paid work: in which all adults
are either pensioners or jobless non-pensioners.
However, labour market exclusion remains an
important risk factor for both service exclusion and
some aspects of exclusion from social relations.
69
C O N C L U S I O N S
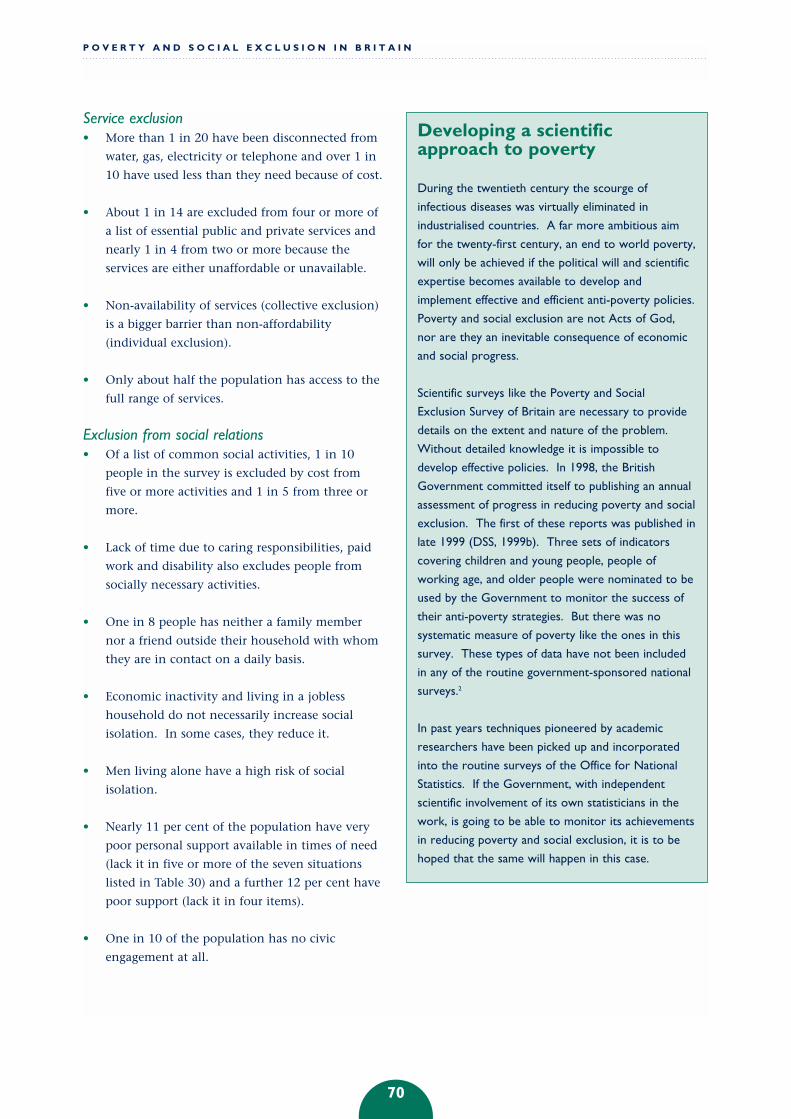
Service exclusion• More than 1 in 20 have been disconnected from
water, gas, electricity or telephone and over 1 in
10 have used less than they need because of cost.
• About 1 in 14 are excluded from four or more of
a list of essential public and private services and
nearly 1 in 4 from two or more because the
services are either unaffordable or unavailable.
• Non-availability of services (collective exclusion)
is a bigger barrier than non-affordability
(individual exclusion).
• Only about half the population has access to the
full range of services.
Exclusion from social relations• Of a list of common social activities, 1 in 10
people in the survey is excluded by cost from
five or more activities and 1 in 5 from three or
more.
• Lack of time due to caring responsibilities, paid
work and disability also excludes people from
socially necessary activities.
• One in 8 people has neither a family member
nor a friend outside their household with whom
they are in contact on a daily basis.
• Economic inactivity and living in a jobless
household do not necessarily increase social
isolation. In some cases, they reduce it.
• Men living alone have a high risk of social
isolation.
• Nearly 11 per cent of the population have very
poor personal support available in times of need
(lack it in five or more of the seven situations
listed in Table 30) and a further 12 per cent have
poor support (lack it in four items).
• One in 10 of the population has no civic
engagement at all.
P O V E R T Y A N D S O C I A L E X C L U S I O N I N B R I T A I N
70
Developing a scientificapproach to poverty
During the twentieth century the scourge of
infectious diseases was virtually eliminated in
industrialised countries. A far more ambitious aim
for the twenty-first century, an end to world poverty,
will only be achieved if the political will and scientific
expertise becomes available to develop and
implement effective and efficient anti-poverty policies.
Poverty and social exclusion are not Acts of God,
nor are they an inevitable consequence of economic
and social progress.
Scientific surveys like the Poverty and Social
Exclusion Survey of Britain are necessary to provide
details on the extent and nature of the problem.
Without detailed knowledge it is impossible to
develop effective policies. In 1998, the British
Government committed itself to publishing an annual
assessment of progress in reducing poverty and social
exclusion. The first of these reports was published in
late 1999 (DSS, 1999b). Three sets of indicators
covering children and young people, people of
working age, and older people were nominated to be
used by the Government to monitor the success of
their anti-poverty strategies. But there was no
systematic measure of poverty like the ones in this
survey. These types of data have not been included
in any of the routine government-sponsored national
surveys.2
In past years techniques pioneered by academic
researchers have been picked up and incorporated
into the routine surveys of the Office for National
Statistics. If the Government, with independent
scientific involvement of its own statisticians in the
work, is going to be able to monitor its achievements
in reducing poverty and social exclusion, it is to be
hoped that the same will happen in this case.
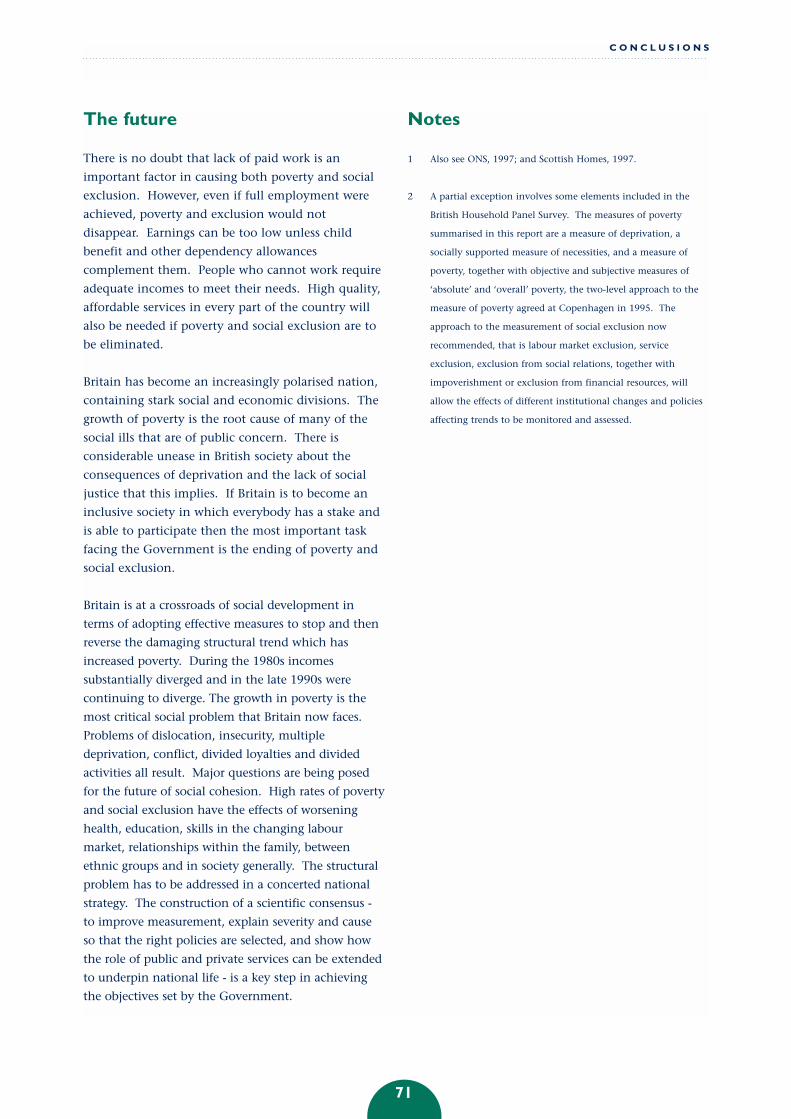
The future
There is no doubt that lack of paid work is an
important factor in causing both poverty and social
exclusion. However, even if full employment were
achieved, poverty and exclusion would not
disappear. Earnings can be too low unless child
benefit and other dependency allowances
complement them. People who cannot work require
adequate incomes to meet their needs. High quality,
affordable services in every part of the country will
also be needed if poverty and social exclusion are to
be eliminated.
Britain has become an increasingly polarised nation,
containing stark social and economic divisions. The
growth of poverty is the root cause of many of the
social ills that are of public concern. There is
considerable unease in British society about the
consequences of deprivation and the lack of social
justice that this implies. If Britain is to become an
inclusive society in which everybody has a stake and
is able to participate then the most important task
facing the Government is the ending of poverty and
social exclusion.
Britain is at a crossroads of social development in
terms of adopting effective measures to stop and then
reverse the damaging structural trend which has
increased poverty. During the 1980s incomes
substantially diverged and in the late 1990s were
continuing to diverge. The growth in poverty is the
most critical social problem that Britain now faces.
Problems of dislocation, insecurity, multiple
deprivation, conflict, divided loyalties and divided
activities all result. Major questions are being posed
for the future of social cohesion. High rates of poverty
and social exclusion have the effects of worsening
health, education, skills in the changing labour
market, relationships within the family, between
ethnic groups and in society generally. The structural
problem has to be addressed in a concerted national
strategy. The construction of a scientific consensus -
to improve measurement, explain severity and cause
so that the right policies are selected, and show how
the role of public and private services can be extended
to underpin national life - is a key step in achieving
the objectives set by the Government.
Notes
1 Also see ONS, 1997; and Scottish Homes, 1997.
2 A partial exception involves some elements included in the
British Household Panel Survey. The measures of poverty
summarised in this report are a measure of deprivation, a
socially supported measure of necessities, and a measure of
poverty, together with objective and subjective measures of
‘absolute’ and ‘overall’ poverty, the two-level approach to the
measure of poverty agreed at Copenhagen in 1995. The
approach to the measurement of social exclusion now
recommended, that is labour market exclusion, service
exclusion, exclusion from social relations, together with
impoverishment or exclusion from financial resources, will
allow the effects of different institutional changes and policies
affecting trends to be monitored and assessed.
71
C O N C L U S I O N S

72
Appendix 1: Measures of poverty
Approach
Consensual/
social indicators
Description
Townsend first pioneered the use of social indicators
in his scale of relative deprivation for his mammoth
study of Poverty in the United Kingdom (1979). The
techniques were developed further in the Breadline
Britain surveys of 1983 and 1990 (Mack and Lansley,
1985; Gordon and Pantazis, 1997) . The construction
and use of a deprivation index was also developed in a
Greater London survey in the late 1980s (Townsend
and Gordon, 1989). Mack and Lansley’s consensual
approach has had a big impact on modern poverty
research. Their original 1983 study was replicated in
Britain in 1990 (Gordon and Pantazis, 1997) and in
Wales in 1995 (Gordon, 1995). Local authorities in
London, Manchester, Liverpool and Kent have
conducted similar surveys. The Office of Population,
Censuses and Surveys (OPCS) used a similar set of
questions to measure the standard of living of disabled
adults and families with disabled children in Britain in
1985 (Martin and White, 1988; Smyth and Robus,
1989; Gordon et al., 2000). Similarly, representative
surveys were carried out by the PPRU amongst
disabled people in Northern Ireland in 1990 and 1991
(Zarb and Maher, 1997). The European Statistical
Office (Eurostat) has used a similar set of questions to
measure standard of living in Britain and the 14 other
member states annually since 1994 as part of the
European Community Household Panel Survey
(Ramprakash, 1994; Vogel, 1997; Eurostat, 1999). This
approach to measuring the standard of living has also
been adopted in Denmark (Mack and Lansley, 1985),
Sweden (Halleröd, 1994, 1995a, 1995b, 1998), Ireland
(Callan, Nolan and Whelan, 1993; Nolan and Whelan,
1996a), Belgium (Van den Bosch, 1998), Holland
(Muffels et al., 1990; Muffels and Vries, 1991; Muffels,
Berghman and Dirven, 1992), Finland (Kangas and
Ritakillio, 1998), Germany (Andreß and Lipsmeir, 1995)
and Vietnam (Davies and Smith, 1998).
Advantages
Socially
perceived
necessities are
chosen
democratically
on the basis of
(a) identifying
goods and
activities
common in
society, and (b)
inviting the public
to identify those
they regard as
necessary –
through this
‘consensual’
method.
Disadvantages
The method is as
yet not used
routinely in
government
surveys. The list
of items and
activities is
chosen by the
researcher, albeit
based on
preliminary
research - this is
not an important
criticism given
the high reliablity
of the
measurement of
deprivation.
Used in the
PSE survey
Yes, extensively.

73
A P P E N D I X 1
Approach
Social exclusion
Description
Social exclusion is the lack or denial of access to the
kinds of social relations, social customs and activities in
which the great majority of people in British society
engage. In current usage, exclusion is often regarded as
a ‘process’ rather than a ‘state’ and this helps in being
constructively precise in deciding its relationship to
poverty (among the key texts consulted are Levitas,
1999; Silver, 1994, pp. 531-78; Gore and Figueiredo,
1996; Room, 1995).
Advantages
It has the
potential of
establishing a
multi-dimensional
measure
conceptually
independent of
poverty
measures.
Disadvantages
This is the first
attempt to
operationalise
social exclusion
empirically, using
primary survey
data.
Used in the
PSE survey
In this survey we
have sought to
collect data
relevant to the
concept of social
exclusion.
Subjective
measures
This approach to identifying poverty thresholds is also
known as the income proxy method (Veit-Wilson,
1987), consensual poverty lines (see Walker, 1987,
Halleröd, 1995a, for discussion) or Sociovital Minimum
Income Level (SMIL) (Callan et al., 1989). Subjective
poverty lines are estimations by populations (obtained
through surveys) about the minimum income level at
which people find it is still possible to live ‘decently’. In
most cases, the subjective method produces poverty
lines at a relatively higher level of income than some
expect. Deleeck et al. (1992) have argued that, in many
cases, the poverty line is at such a level that it would be
very difficult to maintain that all households below it
are poor, in the sense of being socially excluded. They
suggest that the term ‘insecurity of subsistence’,
meaning a situation in which households encounter
some (financial) difficulty in participating in the average
or most widely shared lifestyle, would be more
appropriate.
All methods of estimating a subjective poverty line
make use of a Minimum Income Question (MIQ)
designed to measure the smallest income required to
avoid ‘poverty’, live ‘decently’ or ‘adequately’ or to ‘get
along’. However, the exact wording of the MIQ varies
considerably in different studies (Bradbury, 1989; Callan
and Nolan, 1991).
The simplest and arguably most democratic method of
producing a ‘subjective’ poverty line is to use the
average response to the Minimum Income Question
from the population (survey sample) as a whole. This is
a procedure that has been used in Britain (Townsend
and Gordon, 1991; Townsend et al., 1996, 1997) and
Australia (Saunders and Matheson, 1992). However,
several other methods have been used in European
countries (see Goedhart et al., 1977; Van Praag et al.,
1980; Deleeck et al., 1988).
The most
important
advantage of the
subjective
method is that
the level of the
poverty line is
not fixed by
experts, but
defined by
society itself.
The subjective
method is
therefore a
socially realistic
method.
Empirical studies
have shown that
estimates of the
subjective
poverty line
usually rise
systematically
with the actual
income of the
household/-
individual (Citro
and Michael,
1995).
Therefore,
subjective
poverty lines
tend to fluctuate
over time
depending on
changes in the
social reference
group (e.g. due
to an increase in
the overall living
standard of
elderly people,
they respond
with a higher
necessary
minimum
income) and on
the period of
reference (e.g. in
a period of crisis
aspirations might
decline).
In this survey we
have used this
technique in
operationalising
the UN
standards of
absolute and
overall poverty.
Similarly,
subjectively
perceived
poverty lines
have been
measured in the
PSE survey by
asking
respondents if
their income is ‘a
lot below’ the
income needed
to avoid poverty
and ‘a lot below’
the income
needed to avoid
‘absolute’ and
‘overall’ poverty.
Respondents
were also asked
if they
considered
themselves to be
‘genuinely poor
now - all the
time’.

P O V E R T Y A N D S O C I A L E X C L U S I O N I N B R I T A I N
74
Approach
Income
thresholds
Description
Defining poverty purely in terms of low income is the
most widely used method of measuring poverty. The
poor are defined as those people/households with an
income (or, more rarely, expenditure) below a certain
threshold level irrespective of their standard of living.
There were three approaches. One was (a) the income
provided by the state in its payment of benefit. Thus in
their seminal study, The poor and the poorest, Abel-Smith
and Townsend (1965) adopted an income threshold
related to the then National Assistance scales and later
this kind of conventional or ‘state’ standard was
adopted for many years by government in the Low
Income Statistics series. This approach was abandoned
by the Conservative Government in favour of a more
out and out relative income standard in the Households
Below Average Income (HBAI) series, which
represented a second approach (b) relating income to a
proportion of the average (usually 50 per cent of the
mean in the UK but 60 per cent of the median in
Europe). The third approach is (c) to find objectively
the level of income correlating with multiple and
material and social deprivation.
Advantages
(a) The standard
of need is
implicit in the
benefit levels
decided by
government.
(b) The main
advantage is its
simplicity, as
detailed
information on
the living
conditions of the
population is not
required. (c) The
threshold that is
chosen depends
on externally
investigated
levels of material
and social
deprivation.
Disadvantages
(a) The problem
with using benefit
levels as income
thresholds is that
when they are
increased in real
terms so are the
numbers defined as
poor. (b) The
problem with the
thresholds based
on average or
median income is
that they are
essentially arbitrary
cut-off points on
the income
distribution – really
measure of
inequality. Most
economic poverty
indices are really
measures of
income inequality
rather than
poverty
(Townsend, 1979).
Income is a poor
indicator of
command over
resources over
time.
Economic poverty
lines define the
‘poor’ as those
with a low income
even if they have a
high standard of
living. (c) There
are problems in
measuring the
entire range of
material and social
needs, as well as
resources that
augment income.
Used in the
PSE survey
Income
thresholds have
been used to
measure
poverty in this
research.

75
Approach
Budget
standards
Description
In the pre-war period poverty was studied using, as an
income threshold, a budget standard, based on a basket
of goods (mainly food) representing minimum
subsistence/basic needs/absolute standards. This was
the approach adopted by Rowntree in his three studies
of poverty in York (1901, 1941, 1951) and by Beveridge
(1942) in setting the original scales of social assistance.
Budget standards involve drawing up a list of
commodities, employing normative judgements,
supported by a combination of scientific and
behavioural evidence. The budget is then priced and
used as an income standard – anyone living below that
standard is in poverty. In Britain budget standards have
been derived to represent a minimum adequate
standard and a modest but adequate standard
(Bradshaw, 1993). The US poverty standard was
originally based on a budget standard (Orshansky,
1965).
Advantages
The main
advantage is that
a budget
standard is
transparent.
Items can easily
be put into or
taken out of a
budget standard.
Disadvantages
Budget standards
are very labour
intensive to
establish and
involve a host of
normative
judgements
about the
contents of the
basket. They are
also difficult to
keep up to date.
A basket of
goods and
services does not
encompass all
elements that
make a standard
of living. The
pre-war budget
standards
assumed that
there were basic
or absolute
needs regardless
of the time and
place.
Used in the
PSE survey
Budget standards
based poverty
measures have
not been used in
this research as a
measure of
poverty, but
were used to
establish the PSE
equivalence
scale.
A P P E N D I X 1
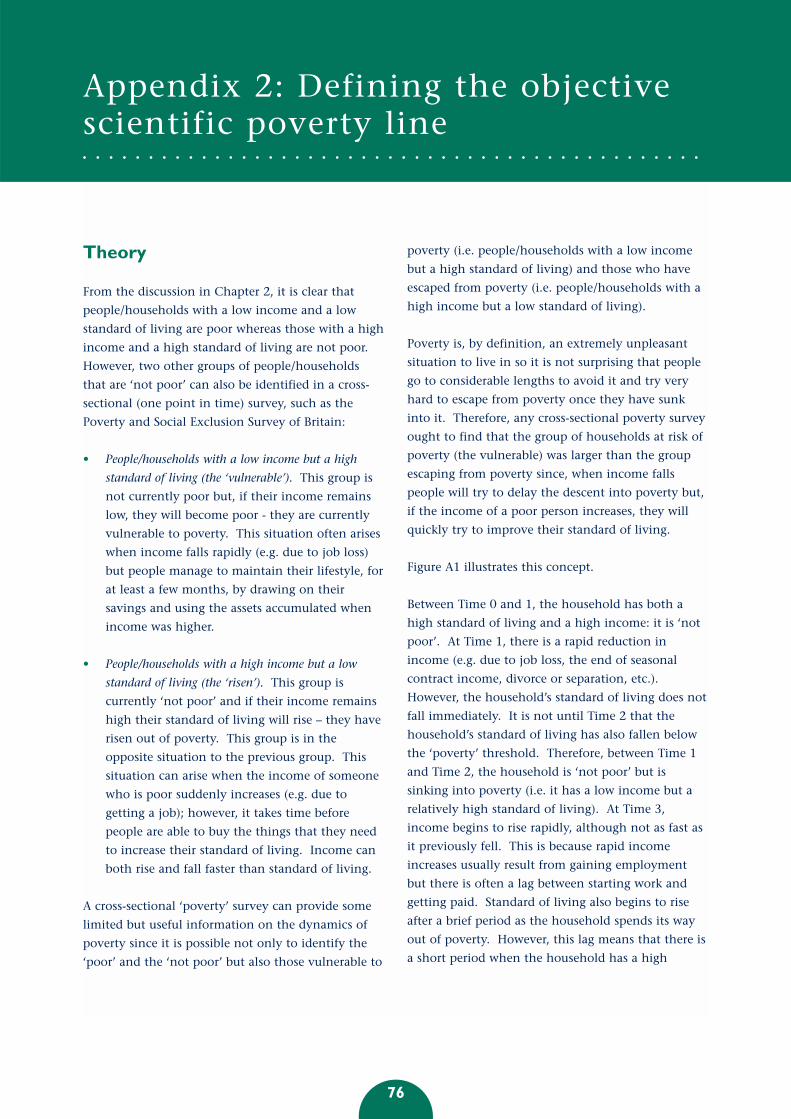
Theory
From the discussion in Chapter 2, it is clear that
people/households with a low income and a low
standard of living are poor whereas those with a high
income and a high standard of living are not poor.
However, two other groups of people/households
that are ‘not poor’ can also be identified in a cross-
sectional (one point in time) survey, such as the
Poverty and Social Exclusion Survey of Britain:
• People/households with a low income but a high
standard of living (the ‘vulnerable’). This group is
not currently poor but, if their income remains
low, they will become poor - they are currently
vulnerable to poverty. This situation often arises
when income falls rapidly (e.g. due to job loss)
but people manage to maintain their lifestyle, for
at least a few months, by drawing on their
savings and using the assets accumulated when
income was higher.
• People/households with a high income but a low
standard of living (the ‘risen’). This group is
currently ‘not poor’ and if their income remains
high their standard of living will rise – they have
risen out of poverty. This group is in the
opposite situation to the previous group. This
situation can arise when the income of someone
who is poor suddenly increases (e.g. due to
getting a job); however, it takes time before
people are able to buy the things that they need
to increase their standard of living. Income can
both rise and fall faster than standard of living.
A cross-sectional ‘poverty’ survey can provide some
limited but useful information on the dynamics of
poverty since it is possible not only to identify the
‘poor’ and the ‘not poor’ but also those vulnerable to
poverty (i.e. people/households with a low income
but a high standard of living) and those who have
escaped from poverty (i.e. people/households with a
high income but a low standard of living).
Poverty is, by definition, an extremely unpleasant
situation to live in so it is not surprising that people
go to considerable lengths to avoid it and try very
hard to escape from poverty once they have sunk
into it. Therefore, any cross-sectional poverty survey
ought to find that the group of households at risk of
poverty (the vulnerable) was larger than the group
escaping from poverty since, when income falls
people will try to delay the descent into poverty but,
if the income of a poor person increases, they will
quickly try to improve their standard of living.
Figure A1 illustrates this concept.
Between Time 0 and 1, the household has both a
high standard of living and a high income: it is ‘not
poor’. At Time 1, there is a rapid reduction in
income (e.g. due to job loss, the end of seasonal
contract income, divorce or separation, etc.).
However, the household’s standard of living does not
fall immediately. It is not until Time 2 that the
household’s standard of living has also fallen below
the ‘poverty’ threshold. Therefore, between Time 1
and Time 2, the household is ‘not poor’ but is
sinking into poverty (i.e. it has a low income but a
relatively high standard of living). At Time 3,
income begins to rise rapidly, although not as fast as
it previously fell. This is because rapid income
increases usually result from gaining employment
but there is often a lag between starting work and
getting paid. Standard of living also begins to rise
after a brief period as the household spends its way
out of poverty. However, this lag means that there is
a short period when the household has a high
76
Appendix 2: Defining the objectivescientific poverty line

income but a relatively low standard of living. By
Time 5, the household again has a high income and
a high standard of living.
Measuring deprivation
In order to measure deprivation scientifically, it is
necessary to construct a reliable, valid and additive
deprivation index (Gordon and Townsend, 1990;
Gordon, 1995). An initial deprivation index was
constructed by summing the number of deprivation
items that respondents said they ‘did not have because
they could not afford’. Only deprivation items were
selected for the initial index that more than 50 per
cent of the adults in the June 1999 ONS Omnibus
Survey had considered to be necessities of life which
all adults should be able to afford. The reliability of
each item in the index was then tested using both
classical reliability analysis models (Cronbach’s alpha)
and also Logistic Test Item Analysis (Nunnally, 1981).
The validity of each item in the index was tested by
calculating the correlation (Risk Ratio) between the
item and two health variables (General Health
Question and Limiting Long-Term Illness) and four
perceptions of poverty variables (genuinely poor now
‘all the time’, income ‘a lot below’ the poverty line,
income ‘a lot below’ the absolute and overall poverty
line). These variables are robust measures of validity
since there is now overwhelming evidence that
poverty causes ill health (Independent Inquiry into
Inequalities in Health, 1998; Davey Smith and
Gordon, 2000; Gordon et al., 1999; Shaw et al., 1999;
Townsend and Davidson, 1988; Whitehead, 1988) and
it would be expected at the population level that
respondents who can objectively be defined as living
in poverty would also be more likely to perceive
themselves as poor compared with their non-poor peers.
Table A1 summarises the reliability and validity
results. Overall, the 35 item index had a Cronbach’s
alpha of 0.8853 which is indicative of a highly
reliable index. Nunnally has argued that:
in the early stages of research...one saves time
and energy by working with instruments that
have modest reliability, for which purpose
reliabilities of 0.70 or higher will suffice...for
basic research, it can be argued that increasing
reliabilities much beyond 0.80 is often wasteful
of time and funds, at that level correlations are
attenuated very little by measurement error.
(Nunnally, 1981)
The items that were not included in the index, as
there was little evidence that they were either valid
or reliable, were:
• television;
• refrigerator;
• beds and bedding for everyone;
• washing machine.
77
A P P E N D I X 2
Relationship of standard of living to incomeFigure A1:
High
Low
0 5
Inco
me
and
sta
nd
ard
of
livin
g
Not poor
Time
1 2 3 4
Sinking intopoverty
Poor
Climbingout ofpoverty
Poverty threshold
Not poor
Income
Standard of living
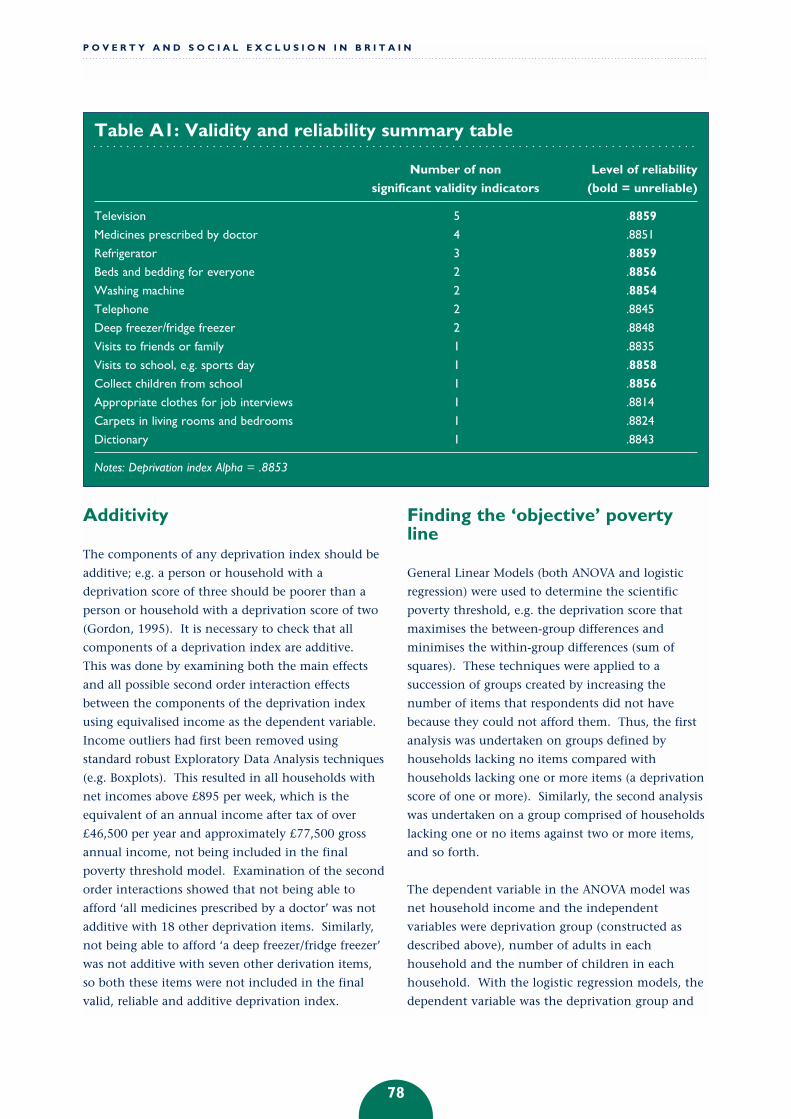
Additivity
The components of any deprivation index should be
additive; e.g. a person or household with a
deprivation score of three should be poorer than a
person or household with a deprivation score of two
(Gordon, 1995). It is necessary to check that all
components of a deprivation index are additive.
This was done by examining both the main effects
and all possible second order interaction effects
between the components of the deprivation index
using equivalised income as the dependent variable.
Income outliers had first been removed using
standard robust Exploratory Data Analysis techniques
(e.g. Boxplots). This resulted in all households with
net incomes above £895 per week, which is the
equivalent of an annual income after tax of over
£46,500 per year and approximately £77,500 gross
annual income, not being included in the final
poverty threshold model. Examination of the second
order interactions showed that not being able to
afford ‘all medicines prescribed by a doctor’ was not
additive with 18 other deprivation items. Similarly,
not being able to afford ‘a deep freezer/fridge freezer’
was not additive with seven other derivation items,
so both these items were not included in the final
valid, reliable and additive deprivation index.
Finding the ‘objective’ povertyline
General Linear Models (both ANOVA and logistic
regression) were used to determine the scientific
poverty threshold, e.g. the deprivation score that
maximises the between-group differences and
minimises the within-group differences (sum of
squares). These techniques were applied to a
succession of groups created by increasing the
number of items that respondents did not have
because they could not afford them. Thus, the first
analysis was undertaken on groups defined by
households lacking no items compared with
households lacking one or more items (a deprivation
score of one or more). Similarly, the second analysis
was undertaken on a group comprised of households
lacking one or no items against two or more items,
and so forth.
The dependent variable in the ANOVA model was
net household income and the independent
variables were deprivation group (constructed as
described above), number of adults in each
household and the number of children in each
household. With the logistic regression models, the
dependent variable was the deprivation group and
P O V E R T Y A N D S O C I A L E X C L U S I O N I N B R I T A I N
78
Table A1: Validity and reliability summary table
Number of non Level of reliability
significant validity indicators (bold = unreliable)
Television 5 .8859
Medicines prescribed by doctor 4 .8851
Refrigerator 3 .8859
Beds and bedding for everyone 2 .8856
Washing machine 2 .8854
Telephone 2 .8845
Deep freezer/fridge freezer 2 .8848
Visits to friends or family 1 .8835
Visits to school, e.g. sports day 1 .8858
Collect children from school 1 .8856
Appropriate clothes for job interviews 1 .8814
Carpets in living rooms and bedrooms 1 .8824
Dictionary 1 .8843
Notes: Deprivation index Alpha = .8853

the independent variables were net household
income, number of adults and number of children.
Both the ANOVA and logistic regression models
yielded the same final result – that a score of two or
more on the deprivation index was the optimum
position for the poverty line. Summary results are
shown in Table A2.
Identifying the rising and thevulnerable groups
In a cross-sectional survey there will probably be a
few people who have recently ‘risen out of poverty’,
e.g. those with a high deprivation score and a high
income. Their incomes and/or ‘standard of living’
should have increased in the recent past. These few
cases were identified using boxplots of income by
‘multiply deprived’ group (i.e. with a deprivation
score of 2 or more) and controlling for household
size/type. The outliers (with high incomes) in each
household type should be those risen out of poverty.
There should also be a much larger group of
households who have relatively low incomes but are
not yet suffering from multiple deprivation (i.e. the
vulnerable to poverty group who have incomes
equivalent to the median incomes of the multiply
deprived – two or more group). Thus, using these
definitions, the Poverty and Social Exclusion Survey
of Britain found that, at the end of the last
millennium:
• 25.6 per cent of people were living in poverty;
• 1.8 per cent had risen out of poverty;
• 10.3 per cent were potentially vulnerable to
poverty;
• almost two-thirds (62.2 per cent) were relatively
well off.
79
Table A2: Brief summary table for ANOVA and logistic regressionmodels of optimum position for the poverty threshold
Model F Statistic for logistic regression
corrected ANOVA Model model Chi-square
Null Model 26
Deprivation score of 1 or more 45 145
Deprivation score of 2 or more 51 223
Deprivation score of 3 or more 45 205
Deprivation score of 4 or more 42 192
Deprivation score of 5 or more 36 170
Deprivation score of 6 or more 31 126
A P P E N D I X 2

Introduction
A child deprivation index was constructed following
the general procedures set out above. Briefly, items
that over half of parents believed to be necessary
were retained for consideration in the index. This
resulted in 27 of the 30 items being retained (see
Chapter 4, Table 14). Validity tests were made on
each item whereby the odds of a child lacking the
item because their parent(s) could not afford it were
checked against the four subjective measures of
poverty described above. All valid items were then
assessed to establish if they were measuring the same
single dimension of deprivation. Finally,1 an
exploration was undertaken to establish the
appropriate number of items of which a child had to
be deprived to classify the child as poor.
Two population bases were possible for this analysis:
first, households with children; second, the total
number of children. Though either base is
legitimate, the latter was deemed to provide
information of more direct relevance to the study.
Time constraints did not allow the deprivation items
to be asked separately for each child in the
questionnaire. Instead, the respondent was asked
about deprivation for any child in the family. A
number of the items are age-related, such as attending
play-group, so any positive responses on these items
for children of inappropriate ages were excluded from
counting towards the scale (see Table A3).
Validating the items
Individual items with no significant association with
other measures of poverty were to be excluded from
further analysis. However, only two items were
found to be independent of one of the subjective
poverty measures: toys and own books (Table A4).
80
Appendix 3: Creation of the childdeprivation index
Table A3: Age adjusted items
Age
Babies Pre-school Primary Secondary
school school
Toys (e.g. dolls, teddies) + + + -
Leisure equipment - - + +
Bedrooms for every child of different sex - - + +
Bike: new/second-hand - + + +
All required school uniform - - + +
Hobby or leisure activity - - + +
Play group (pre-school age children) + + - -
School trip at least once a term - - + +
Friends round for tea/snack - - + +
Note: + deprivation response allowed
- deprivation response excluded

The overall number of significance tests used could
easily have resulted in these two items being
significant (at P<0.05) by chance. In contrast, both
of these necessities showed a positive association
with the respondent’s perception that they were poor
all the time. All children deprived of these two
necessities were also poor on the absolute and overall
poverty measures – which is why the odds ratio
could not be formed for these items. Thus, overall,
the two necessities showed a positive association
with three out of the four subjective measures and,
hence, were accepted as valid indicators of poverty.
The reliability of the scale
Reliability can be measured in a number of ways.
Table A5 shows the Cronbach’s alpha analysis for the
children’s deprivation index. The items highlighted
in bold do not contribute to the overall reliability of
the index.
81
A P P E N D I X 3
Table A4: The odds of being deprived of an item according tosubjective poverty status
Poor all the time Poverty Absolute Overall poverty poverty
Three meals a day 4.69 2.34 3.02 24.79Toys (e.g. dolls, teddies)* 3.65 1.04 -- --Leisure equipment 3.04 4.30 4.83 4.86Bedrooms for every child of different sex* 2.39 1.24 0.85 1.64Warm, waterproof coat 2.94 6.67 7.27 6.30Books of own 7.26 1.01 -- --Bike: new/second-hand* 1.65 1.07 1.51 2.97Construction toys 3.97 3.52 4.64 4.44Educational games 7.72 5.24 9.10 5.24New, properly fitted, shoes 1.68 6.89 9.07 6.04At least 7 pairs of new underpants 4.60 12.33 13.03 10.63At least 4 jumpers/cardigans/sweatshirts 4.73 4.79 8.58 5.31All required school uniform* 2.63 5.44 10.10 7.06At least 4 pairs of trousers 4.90 3.68 3.78 2.80Meat, fish or vegetarian equivalent at least twice a day 5.23 8.78 9.95 6.91Fresh fruit or vegetables daily 9.64 8.64 11.29 9.48Garden to play in 2.00 3.27 4.04 9.85New, not second-hand, clothes 3.06 7.26 7.61 4.66Carpet in bedroom 6.18 5.54 4.39 3.73Beds and bedding for everyone 7.53 4.71 6.08 4.01Hobby or leisure activity* 7.20 5.16 9.37 9.03Celebrations on special occasions 39.53 6.96 9.12 21.36Swimming at least once a month 3.51 10.63 9.34 11.65Play group (pre-school age children)* 0.90 2.99 1.58 6.03Annual week’s holiday 3.46 3.91 4.44 3.62School trip at least once a term* 6.39 7.88 6.29 4.92Friends round for tea/snack* 7.00 6.85 7.95 6.85
N 795 729 724 715Proportion poor 0.12 0.21 0.18 0.34
Notes: -- cannot be computed: one of cells is zero in the 4 way table.Figures in bold typeface are not significant at P<0.05 and therefore do not contribute to the overall reliability of the index.* age-adjusted items

The exclusion of three items (separate bedrooms for
opposite sex siblings aged over 10, a garden to play
in, a holiday away from home) would have improved
the alpha level by a small extent. However, as the
gain was minimal, it was decided to retain these
items for the purposes of the present investigation,
although further sensitivity tests are planned to
investigate the consequences of excluding particular
items.
Identifying a poverty threshold
Answering the question ‘What is the appropriate
number of items a child should be deprived of before
being considered poor?’ is not straightforward. The
essential concept underlying the scale is that
children lack necessities because their parents cannot
afford to buy them. From this perspective, it is
arguable that the parent’s current income should be
reflected in the child’s deprivation score. However,
there are many reasons why the two may not match.
For example, a family whose income has recently
P O V E R T Y A N D S O C I A L E X C L U S I O N I N B R I T A I N
82
Table A5: Children’s items reliability analysis
Corrected item Alpha if
total correlation item removed
Three meals a day 0.3620 0.8297
Toys (e.g. dolls, teddies)* 0.2992 0.8318
Leisure equipment* 0.4528 0.8250
Bedrooms for every child of different sex* 0.0865 0.8393
Warm, waterproof coat 0.4013 0.8276
Books of own 0.2189 0.8337
Bike: new/second-hand* 0.2645 0.8325
Construction toys 0.4495 0.8253
Educational games 0.5580 0.8203
New, properly fitted, shoes 0.3614 0.8287
At least 7 pairs of new underpants 0.5151 0.8239
At least 4 jumpers/cardigans/sweatshirts 0.4973 0.8232
All required school uniform* 0.3441 0.8292
At least 4 pairs of trousers 0.4717 0.8242
Meat, fish or vegetarian equivalent at least twice a day 0.5366 0.8212
Fresh fruit or vegetables daily 0.4266 0.8268
Garden to play in 0.1332 0.8373
New, not second-hand, clothes 0.5393 0.8219
Carpet in bedroom 0.2543 0.8319
Beds and bedding for everyone 0.2411 0.8324
Hobby or leisure activity* 0.4461 0.8254
Celebrations on special occasions 0.4227 0.8272
Swimming at least once a month 0.4535 0.8249
Play group (pre-school age children)* 0.1571 0.8339
Annual week’s holiday 0.3340 0.8396
School trip at least once a term* 0.3859 0.8284
Friends round for tea/snack* 0.4625 0.8246
Notes: Overall alpha 0.8339
Items highlighted in bold do not contribute to the overall reliability of the index
* age-adjusted items
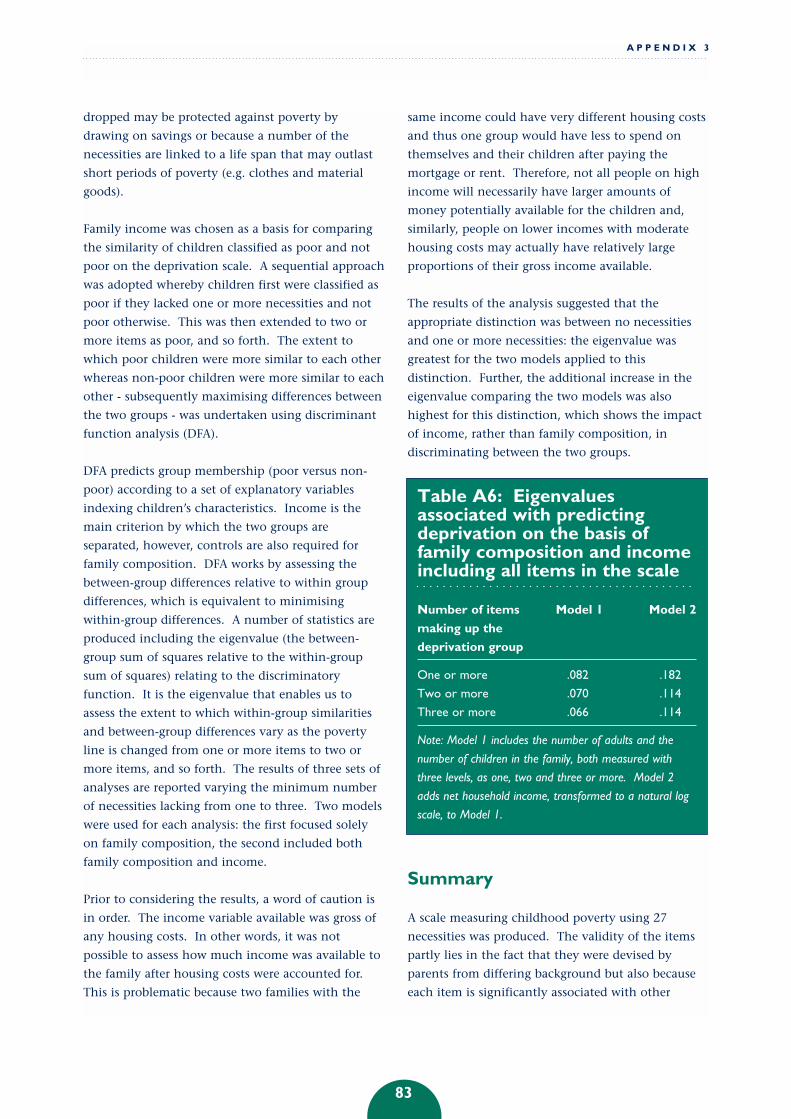
dropped may be protected against poverty by
drawing on savings or because a number of the
necessities are linked to a life span that may outlast
short periods of poverty (e.g. clothes and material
goods).
Family income was chosen as a basis for comparing
the similarity of children classified as poor and not
poor on the deprivation scale. A sequential approach
was adopted whereby children first were classified as
poor if they lacked one or more necessities and not
poor otherwise. This was then extended to two or
more items as poor, and so forth. The extent to
which poor children were more similar to each other
whereas non-poor children were more similar to each
other - subsequently maximising differences between
the two groups - was undertaken using discriminant
function analysis (DFA).
DFA predicts group membership (poor versus non-
poor) according to a set of explanatory variables
indexing children’s characteristics. Income is the
main criterion by which the two groups are
separated, however, controls are also required for
family composition. DFA works by assessing the
between-group differences relative to within group
differences, which is equivalent to minimising
within-group differences. A number of statistics are
produced including the eigenvalue (the between-
group sum of squares relative to the within-group
sum of squares) relating to the discriminatory
function. It is the eigenvalue that enables us to
assess the extent to which within-group similarities
and between-group differences vary as the poverty
line is changed from one or more items to two or
more items, and so forth. The results of three sets of
analyses are reported varying the minimum number
of necessities lacking from one to three. Two models
were used for each analysis: the first focused solely
on family composition, the second included both
family composition and income.
Prior to considering the results, a word of caution is
in order. The income variable available was gross of
any housing costs. In other words, it was not
possible to assess how much income was available to
the family after housing costs were accounted for.
This is problematic because two families with the
same income could have very different housing costs
and thus one group would have less to spend on
themselves and their children after paying the
mortgage or rent. Therefore, not all people on high
income will necessarily have larger amounts of
money potentially available for the children and,
similarly, people on lower incomes with moderate
housing costs may actually have relatively large
proportions of their gross income available.
The results of the analysis suggested that the
appropriate distinction was between no necessities
and one or more necessities: the eigenvalue was
greatest for the two models applied to this
distinction. Further, the additional increase in the
eigenvalue comparing the two models was also
highest for this distinction, which shows the impact
of income, rather than family composition, in
discriminating between the two groups.
Summary
A scale measuring childhood poverty using 27
necessities was produced. The validity of the items
partly lies in the fact that they were devised by
parents from differing background but also because
each item is significantly associated with other
83
Table A6: Eigenvaluesassociated with predictingdeprivation on the basis offamily composition and incomeincluding all items in the scale
Number of items Model 1 Model 2
making up the
deprivation group
One or more .082 .182
Two or more .070 .114
Three or more .066 .114
Note: Model 1 includes the number of adults and the
number of children in the family, both measured with
three levels, as one, two and three or more. Model 2
adds net household income, transformed to a natural log
scale, to Model 1.
A P P E N D I X 3

measures of poverty. In general, the items form an
internally consistent measure of poverty. Using the
DFA results suggests a cut-off of one or more
necessities as the classification for poverty. However,
concerns with the income variable suggest caution
over accepting these initial results.
Note
1 It was not possible to evaluate the additivity of the items, as
described for adults, due to the much smaller sample of
households with children.
P O V E R T Y A N D S O C I A L E X C L U S I O N I N B R I T A I N
84
85
Introduction
The Poverty and Social Exclusion Survey of Britain
was carried out by the Social Survey Division of the
Office for National Statistics and was supported by
the Joseph Rowntree Foundation. This appendix
describes the survey design, sampling, data collection
and fieldwork procedures and the processing of the
survey. It also includes a comparison of responding
and non-responding households.
Background and aims
The Poverty and Social Exclusion Survey of Britain
(PSE) was designed to update the Breadline Britain
surveys which were conducted by MORI in 1983 and
1990 (Gordon and Pantazis, 1997) and to improve
the methodology, particularly by the use of
probability sampling. There were two parts to the
PSE survey. First, a representative sample of the
population of Great Britain was asked for their views
on what constitute the necessities of life in present-
day Britain.
The June 1999 Omnibus Survey
The ‘necessities of life’ questions were asked in the
June 1999 Office for National Statistics Omnibus
Survey. Respondents were interviewed in their own
homes and given sets of shuffled cards and asked:
"On these cards are a number of different items
which relate to our standard of living. I would
like you to indicate the living standards you feel
all adults should have in Britain today by
placing the cards in the appropriate box. BOX A
is for items which you think are necessary; which
all adults should be able to afford and which
they should not have to do without. BOX B is
for items which may be desirable but are not
necessary."
A similar question was asked with regard to
necessities for children. Full details can be found on
the web at URL,
http://qb.soc.surrey.ac.uk/surveys/pses/psesintro.htm
A sample of 3,000 addresses was selected from the
Postcode Address File of ‘small users’. The sample
from 100 postal sectors was stratified by:
• region;
• proportion of households renting from local
authorities;
• proportion of households with heads in the
professional, employer or manager socio-
economic groups (SEG 1-5 & 13).
The 100 postal sectors were selected with probability
proportionate to size, and within each sector 30
addresses were selected at random. If an address
contained more than one household, the interviewer
used the standard ONS procedure to randomly select
just one household. Within each household, with
more than one adult member, just one person aged
16 or over was selected using random number tables.
All interviews were carried out face-to-face with the
selected respondent and no proxy interviews were
allowed.
The response rate was 69 per cent as shown in
Table A7.
Appendix 4: The 1999 Poverty andSocial Exclusion Survey of Britain:Technical report

The follow-up to the GeneralHousehold Survey
A random follow-up sample was drawn from
respondents to the 1998/9 General Household
Survey, and interviewed in detail about their
circumstances and their views on a range of issues
associated with poverty and social exclusion.
The aims of the survey were:
• to update the Breadline Britain surveys;
• to estimate the size of groups of households in
different circumstances;
• to explore movement in and out of poverty;
• to look at age and gender differences in
experiences of and responses to poverty.
Although the survey is primarily concerned with the
experience of people living in Britain, it is planned
that similar surveys will also be carried out in other
countries, using a questionnaire based on that
developed for the PSE.
The survey design
The PSE survey was designed as a follow-up survey of
respondents to the 1998/9 General Household Survey
(GHS). This design made it possible to select a
sample with known characteristics. It also meant
that one person in each selected household could be
sampled prior to fieldwork. Information from the
original survey allowed the characteristics of PSE
non-responders to be identified, allowing analysis of
the effects of non-response bias.
Sample design
The sample design was influenced by three main
considerations:
• sufficient cases were required for the analysis of
key variables by sub-groups;
• sufficient cases were required for separate
analysis of households and individuals in
Scotland;
• sufficient cases of low-income households and
respondents were required to examine their
characteristics.
The sample design therefore gave a greater
probability of selection to people in lower income
groups and Scotland. Households in the lower
income groups were identified by using a measure of
equivalised income; that is, a measure of household
income which takes account of household size and
composition.
Selecting households from lowerincome groups: equivalisedincome measure
An equivalised income measure was developed by
Jonathan Bradshaw and Sue Middleton in
conjunction with the Office for National Statistics
(ONS). The McClements equivalence scale, which is
used as the standard by ONS (Government Statistical
Service, 1998), was felt not to be appropriate for the
PSE, as it does not assign sufficient weight to
children, particularly young children. The scale used
for the PSE was designed to take account of this.
Each member of the household was assigned a value,
shown in Table A8:
P O V E R T Y A N D S O C I A L E X C L U S I O N I N B R I T A I N
86
Table A7: June 1999 OmnibusSurvey response rate
Number (%)
Selected addresses 3,000 100
Ineligible addresses 323 11
Eligible addresses 2,677 89
Refusals 588 22
Non-contact 234 9
Interviews achieved 1,855 69

The values for each household member were added
together to give the total equivalence value for that
household. This number was then divided into the
gross income for that household. For example, the
equivalence value for a lone-parent household with
two children is 0.7 + 0.35 + 0.3 + 0.1 = 1.45. If the
household’s gross income is £10,000, its equivalised
income is £6,897 (= £10,000/1.45).
Equivalised income was grouped into quintiles, with
the bottom quintile comprising households with the
lowest incomes and the top quintile those
households with the highest incomes. The quintiles
were then sampled in the following proportions, as
set out in Table A9:
Selecting areas, households andindividuals for interview
Identifying individuals for interview involved a
three-stage process. First, a number of areas were
selected from all of those used for the 1998/9 GHS.
Second, a number of households were selected from
each of the areas; third, one individual was chosen
from each sampled household. To allow for variation
in income within areas the list of primary sampling
units (PSUs) was sorted on area and quintile group
before any selections were made.
Areas
The 1998/9 GHS sample was selected from 576 PSUs
based on postcode sectors. In order to ensure
sufficient representation of the population in the PSE
sample, 70 per cent of GHS areas in England and
Wales were selected (360 areas from a total of 5181).
All of the 54 Scottish areas were sampled to provide
sufficient cases for separate analysis of the Scottish
data.
Households
A sample of households was taken from each selected
area.
Individuals
One adult aged 16 or over was selected at random
from each sampled household, using a Kish grid.
This was done in preference to interviewing all
eligible adults because individuals in households
tend to be similar to one another. Where households
differ markedly from one another, the resultant
clustering can lead to a substantial increase in the
standard error around survey estimates. This is
particularly true when asking opinion questions
where household members may influence each
other’s answers. Only those who had given a full
interview in 1998/9 were eligible for selection.
Partial interviews and proxies were excluded from
87
Table A8: Equivalised incomescale
Type of household member Equivalence
value
Head of household 0.70
Partner 0.30
Each additional adult (anyone over 16) 0.45
Add for first child 0.35
Add for each additional child 0.30
If head of household is a lone parent, add 0.10
Table A10: Number of areassampled for the PSE
Area GHS 1998 N PSE 1999 N
England and Wales 518 360
Scotland 54 54
Total 576 414
Table A9: Probability ofselection for income quintiles
Quintile group Proportion sampled
Bottom quintile (lowest income) 40%
Fourth quintile 30%
Third quintile 10%
Second quintile 10%
Top quintile (highest income) 10%
A P P E N D I X 4

the eligible sample. In keeping with the aim of
ensuring that sufficient interviews were carried out
for analysis purposes, some reserves were selected, to
be used if necessary.
If the selected adult was no longer resident in the
household, interviewers were instructed not to
substitute another household member for the
sampled person, as that would adversely affect the
representativeness of the sample. When the selected
adult had moved house since the GHS interview,
interviewers traced them to their new address if it
was nearby and asked for an interview. Otherwise,
the respondent was coded as having moved. In
those households where the sampled individual
agreed to the follow-up interview, interviewers
updated the household composition, recording
members who had moved out or died, and adding
new members who had been born or moved into the
household since the GHS interview. Table A11 shows
changes in household composition in responding
households.
Questionnaire content
As one of the aims of the PSE was to update the
Breadline Britain surveys, questions which had been
used in the previous surveys were repeated where
possible, to maintain continuity and allow
comparisons over time. The PSE survey did,
however, aim to measure a variety of concepts of
poverty and social exclusion and this involved some
redesign of the questionnaire and the development
of new questions.
For example, new questions were included to
measure respondent’s assessments of absolute and
overall poverty, as defined at the United Nations
World Summit on Social Development in
Copenhagen in 1995. The survey also tried to
measure intra-household poverty.
The main topics covered in the questionnaire were:
• housing (including the condition of
accommodation and satisfaction with
accommodation);
• health (including disability, isolation and
depression);
• time (time poverty);
• social networks and support;
• necessities (these questions were conducted as a
card sorting exercise);
• finance and debts;
• intra-household poverty;
• poverty over time;
• absolute and overall poverty;
• area deprivation;
• local services;
• crime;
• child’s school;
• perceptions of poverty;
• activism.
Choosing a survey design based on a follow-up of the
GHS meant that detailed information was already
available on those topics covered by the GHS
interview, and questions did not have to be included
in the PSE. As the follow-up interviews took place
between six and 18 months after the original
interview, a small number of follow-up questions was
included in the PSE questionnaire to record changes
to the household composition, employment and
income.
Ten PSE interviewers each wrote a short report on
how the questionnaire worked in the field. They
reported that respondents found the subject matter
of the survey interesting. Those who agreed to take
part were enthusiastic and hopeful that the results of
P O V E R T Y A N D S O C I A L E X C L U S I O N I N B R I T A I N
88
Table A11: Changes tohousehold composition of PSEresponders
Changes to household Number (%)
composition
Still in household 3329 95.7
Moved out (including deceased) 58 1.7
New to household (including
births since GHS) 82 2.4
Missing 8 0.2
Total (all household
members) 3477 100.0
the survey would be put to good use. Some
respondents used the questionnaire as an
opportunity to air their problems (such as loneliness
or problems with their local area).
The sections that the respondents found most
difficult to answer were those on absolute and overall
poverty, social networks and support, local services
and the necessities questions which involved the
card-sorting exercise. For some sections of the
questionnaire, problems arose because respondents
were being asked to think about things they would
normally take for granted, such as the goods or
services they owned or had access to. For other
sections, respondents were being asked to think
about things they would not usually consider, such
as how much money they would need to keep their
household out of poverty, and some found this very
difficult to do.
Interviewers reported that respondents found the
questions on local services repetitive and became
bored and irritated. The crime section made some
elderly respondents feel uneasy.
Data collection and fieldworkprocedures
Advance lettersAdvance letters were sent to sampled individuals,
reminding them of their participation in the GHS,
explaining the purpose of the PSE and asking for
their co-operation with the follow-up interview. As a
named respondent had been selected before the
interview, the advance letter was addressed to the
selected respondent by name. Where a name had
not been provided by the respondent during the GHS
interview, the advance letter was addressed to ‘the
resident’.
Contacting the respondentWhere contact telephone numbers were available,
interviewers made initial contact with the
respondent by telephone. This method of contacting
respondents was used to reduce costs. Once an
appointment was made with the respondent, the
interviews were conducted face-to-face. In the event
of a broken appointment, interviewers were
instructed to make a maximum of two visits at an
address before recording a non-contact, unless they
were already in the area and could make an extra call
without driving out of their way.
Respondents who had moved house since taking part
in the GHS were traced by interviewers if they had
moved within the same area. Interviewers requested
authorisation from their office-based supervisor
before tracing respondents who had moved.
Data collectionFieldwork took place between 1 September and 15
Ocober 1999. There were three types of data
collection: face-to-face interviews, a self-completion
module and a card-sorting exercise.
Face-to-face interviews were conducted using
Computer-Assisted Personal Interviewing (CAPI).
Interviewers recorded respondents’ answers on laptop
computers which had been programmed using Blaise
software. Where applicable, a limited amount of
proxy information was collected about the
respondent’s partner and child.
A Computer-Assisted Self-Interviewing (CASI) module
was used to collect answers to sensitive questions,
such as those on crime and for some questions on
self-reported health. Where the respondent was
reluctant or unable to complete the self-completion
section on the lap-top the interviewer asked the
respondent’s permission to ask these questions.
As mentioned in the introduction, a representative
sample of the population took part in the first part of
the Poverty and Social Exclusion Survey of Britain in
July 1999, carried out on the ONS Omnibus Survey.
Respondents to that part of the survey were given a
set of cards, on which were listed a number of items
(one item per card), and were asked to say which of
the items they considered were necessities in present-
day Britain. Respondents to the GHS follow-up were
asked to carry out a similar card-sorting exercise. In
this case, the respondent was asked to place each
card in a pile depending on whether they had the
item; did not have it and could not afford it; or did
not have the item and did not want it. Where
problems with literacy or manual dexterity prevented
89
A P P E N D I X 4

the respondent from completing this exercise, the
interviewer was permitted to read the cards and place
them in the correct pile according to the
respondent’s answer.
Length of interviewThe average length of interview was 60 minutes.
With older respondents or those who had literacy
problems, it took about 90 minutes. Questions
requiring a lot of thought or those involving difficult
concepts, such as assessments of absolute and overall
poverty, were particularly taxing for some elderly
respondents, a number of whom became quite tired
during the interview.
The length of the questionnaire affected the response
rate. ONS interviewers are required to give an
assessment of how long the interview is likely to take
when making an appointment, to ensure that
respondents set aside sufficient time. Some sampled
individuals refused to take part on hearing that the
interview was likely to last for an hour. Because of
the relatively short field period (a month),
interviewers also did not have sufficient time to call
back on many households to attempt to persuade
them to change their decision not to take part.
ResponseTable A12 shows the response to the PSE follow-up
interview. Of the 2,846 individuals selected, 415
(15 per cent) were ineligible because the sampled
individual had moved or died, because the
household could not be traced so it was not known
whether the whole household had moved or because
it was a reserve which was not issued to an
interviewer.
Of the 2,431 eligible individuals, 1,534 (63 per cent)
were interviewed, the vast majority completing a full
interview. This response rate is disappointing and
may reflect some of the factors outlined above.
However, the availability of information about non-
responders means that it is possible to compensate
for non-response by weighting.
P O V E R T Y A N D S O C I A L E X C L U S I O N I N B R I T A I N
90
Table A12: Response to the PSE follow-up survey
Response category Number of cases Percentage of Percentage of
set sample eligible sample
Set sample 2846
Ineligible
Household not traced, reserve not issued 210 7.4
Selected adult no longer resident 83 2.9
Selected adult deceased 19 0.7
Other ineligible 103 3.6
Total ineligible 415 14.6
Total eligible sample 2431 85.4
Full interview 1530 62.9
Partial interview 4 0.2
Total co-operating 1534 63.1
Non-contact 180 7.4
Refusals
Refusal to HQ 85 3.5
Refusal by household 113 4.6
Refusal by selected individual 470 19.3
Incapable of taking part 49 2.0
Total refusals 717 29.5

Where a refusal to the survey was given, the
interviewer recorded the main reason given, which is
shown in Table A13. The most common reasons for
refusal were ‘Can’t be bothered’ (20 per cent),
‘Genuinely too busy’ (14 per cent) and ‘Too old or
infirm’ (12 per cent).
Response to the self-completion section is shown in
Table A14. Fifty-five per cent of respondents
completed the section themselves on the laptop,
while an additional 45 per cent were asked the
questions by the interviewer. The level of self-
completion is lower than is normal on surveys of this
type. The Health Education Monitoring Survey
(HEMS), for example, regularly asks respondents to
key their answers in on the laptop and about 85 per
cent of eligible respondents do so. The low
proportion self-completing this section of the PSE
may reflect the age profile of the PSE sample. Other
surveys requiring self-completion often have an age
cut-off; the HEMS only asks those aged 16 to 54 to
self-complete. Problems with eyesight, which are
more common among older people, are often cited
by those who decline to use the laptop. Willingness
to self-complete could also have been affected by the
position of the section at the end of the
questionnaire, by which time respondents may have
become fatigued. Evidence from interviewers
suggests that this was the case, particularly for the
elderly respondents.
Weighting procedures
As noted earlier, the PSE interviewed one person per
household, oversampled households in Scotland and
oversampled households in the lowest quintile
groups of equivalised income. Several weights were
therefore calculated to allow for the probability of
selection and also to compensate for non-response.
Care must be taken to use the correct weight for the
chosen analysis unit. Details of each of these
elements and the weighting procedure are available
from the authors (see Appendix 6).
Note
1 There were 522 GHS areas in England and Wales in 1998; 518
were used to select the PSE sample, as four had been used for
the pilot study.
91
Table A13: Reasons for refusal(first reason given)
Reason for refusal (%)
Can’t be bothered 19.6
Genuinely too busy 14.2
Too old/infirm 12.3
Other reason 11.9
No reason given 9.8
Temporarily too busy 6.2
Broken appointments 6.0
Personal problems 5.5
Bad experience with previous surveys 4.2
Invasion of privacy 3.4
Late contact, insufficient time 2.1
About to go away 1.7
Doesn’t believe in surveys 1.5
Disliked survey matter 0.6
Concerns about confidentiality 0.4
Refusal to HQ 0.2
Not capable 0.2
Base 583
Table A14: Response to theself-completion module
Number (%)
Respondent completed the section 844 55.0
Interviewer completed the section 683 44.5
Section refused or not completed 7 0.5
Base 1534 100
A P P E N D I X 4

1 Pantazis, C., Townsend, P. and Gordon, D. (2000)
The necessities of life in Britain
2 Bradshaw, J., Middleton, S., Williams, J. and
Ashworth, K. (2000) The necessities of life for
children
3 Gordon, D., Pantazis, C. and Townsend, P. (2000)
Changing necessities of life 1983-99
4 Gordon, D. (2000) Income and social deprivation
5 Townsend, P., Gordon, D. and Pantazis, C.
(forthcoming UNRISD) The international
measurement of absolute and overall poverty
6 Adelman, L., Ashworth, K. and Middleton, S.
(2000) Poverty, social exclusion and employment
7 Ashworth, K., Middleton, S. and Adelman, L.
(2000) Social security, poverty and social exclusion
8 Goodwin, D., Adelman, L. and Middleton, S.
(2000) Debt, money management and access to
financial services
9 Pantazis, C. and Middleton, S. (2000) Poverty and
gender
10 Gordon, D. and Middleton, C. (2000) Poverty and
time
11 Bradshaw, J. and Levitas, R. (2000) Lone parent
families, poverty and social exclusion
12 Gordon, D. (2000) Poverty and health/disablement
13 Levitas, R., Pantazis, C. and Patsios, D. (2000)
Social exclusion as lack of social relations
14 Bramley, G. (2000) Social exclusion and lack of
access to services
15 Payne, S. (2000) Poverty and mental health
16 Pantazis, C. (2000) Poverty and crime
17 Bradshaw, J. (2000) Active citizenship, social
exclusion and social norms
18 Bramley, G. (2000) Social exclusion and local
neighbourhoods
19 Bradshaw, J. and Middleton, S. (2000) Child
poverty and social exclusion
20 Patsios, D. (2000) Poverty and social exclusion
among the elderly
21 Levitas, R., Bradshaw, J. and Townsend, P. (2000)
How multidimensional is social exclusion?
22 Townsend, P., Levitas, R. and Gordon, D. (2000)
Establishing an operational definition of material
and social deprivation, social exclusion and poverty
23 Adelman, L., Ashworth, K. and Middleton, S.
(2000) Intra-household distribution of poverty and
social exclusion
Appendix 5: List of Poverty andSocial Exclusion Survey of Britainworking papers
92

24 Pantazis, C., Gordon, D. and Townsend, P. (2000)
‘Perceptions of the necessities of life: Scotland
and England compared’, Scottish Affairs
Committee, Poverty in Scotland, Minutes of
Evidence, House of Commons, HC59-V, London,
TSO, pp123-27
25 Townsend, P. (2000) ‘Prisoners of the global
market: Social polarisation and poverty’, in J.
Baudot (ed.), Building a world community:
Globalisation and the common good. A report of
the Copenhagen Seminars, for the special session
of the United Nations General Assembly on the
follow-up to the Social Summit, Geneva 2000
Forum, pp230-53
26 Townsend, P., Pantazis, C. and Gordon, D. (2000)
‘Perceptions of the necessities of life: Wales,
England and Scotland compared’, Select
Committee on Welsh Affairs, Inquiry into social
exclusion, London: The Stationery Office
93
A P P E N D I X 5
Professor Peter Townsend
Department of Social Policy
London School of Economics
Houghton Street
London WC2A 2AE
Email [email protected]
Tel. 020 7955 6632
and
Townsend Centre for International Poverty Research
University of Bristol
8 Priory Road
Bristol BS8 1TZ
Tel. 0117 954 6771
Dr David Gordon
Townsend Centre for International Poverty Research
University of Bristol
8 Priory Road
Bristol BS8 1TZ
Email [email protected]
Tel. 0117 954 6761
Fax 0117 954 6756
Dr Ruth Levitas
University of Bristol
12 Woodland Road
Bristol BS8 1UQ
Email [email protected]
Tel. 0117 928 7506
Fax 0117 970 6022
Sue Middleton
Centre for Research in Social Policy
Department of Social Sciences
Loughborough University
Loughborough LE11 3TU
Email [email protected]
Tel. 01509 223372
Fax 01509 213409
Professor Jonathan Bradshaw
Social Policy Research Unit
University of York
Heslington
York YO10 5DD
Email [email protected]
Tel. 01904 433480
Fax 01904 433477
Appendix 6: Contact details for thelead researchers
94

95
BHPS British Household Panel Survey
CAPI Computer-Assisted Personal Interviewing
CASI Computer-Assisted Self-Interviewing
CPAG Child Poverty Action Group
CSO Central Statistical Office
DSS Department of Social Security (UK)
EEC European Economic Community
Eurostat European Statistical Office
FES Family Expenditure Survey
FRS Family Resources Survey
GHS General Household Survey
GHQ General Health Questionnaire
HBAI Households Below Average Income
HEMS Health Education Monitoring System
ILO International Labour Organisation
MIQ Minimum Income Question
MORI Market and Opinion Research
International
OECD Organisation for Economic Co-operation
and Development
ONS Office for National Statistics
OPCS Office of Population, Censuses and
Surveys
PPRU Policy Planning and Research Unit
(Northern Ireland)
PSE Poverty and Social Exclusion Survey
SD Standard Deviation
SMIL Sociovital Minimum Income Level
UN United Nations
UNDP United Nations Development Programme
UNICEF United Nations Children’s Fund
UNRISD United Nations Research Institute for
Social Development
WHO World Health Organization
Glossary

Abel-Smith, B. and Townsend, P. (1965) The poor and
the poorest: A new analysis of the Ministry of Labour’s
Family Expenditure Surveys of 1953-54 and 1960,
London: G. Bell & Sons
Andreß, H.J. (ed.) (1998) Empirical poverty research in a
comparative perspective, Aldershot: Ashgate
Andreß, H.J. and Lipsmeir, G. (1995) ‘Was gehört
zum notwendigen Lebensstandard und wer kann ihn
sich leisten? Ein neues Konzept zur Armutsmessung’,
Aus Politik und Zeitgeschichte, Beilage zur
Wochenzeitung Das Parlament, B, 31-32/95 (28 July)
Atkinson, A.B. (1998) Poverty in Europe, Oxford:
Blackwell
Atkinson, A.B., Rainwater, L. and Smeeding, T. (1995)
‘Income distribution in OECD countries’, Social Policy
Studies 18, Paris: OECD
Beveridge, W. (1942) Social insurance and allied
services, London: HM Stationery Office
Blair, T. (1999) ‘Beveridge revisited: A welfare state for
the twenty-first century’, in R. Walker (ed.) Ending
child poverty, Bristol: The Policy Press
Bradbury, B. (1989) ‘Family size equivalence scales
and survey evaluations of income and well-being’,
Journal of Social Policy 18(3): 383-408
Bradbury, B. and Jantii, M. (1999) Child poverty across
industrialised nations, Innocenti Occasional Papers,
EPS 1971, Florence: UNICEF
Bradshaw, J. (ed.) (1993) Budget Standards for the
United Kingdom, Avebury: Aldershot
Bradshaw, J. (1999) ‘Child poverty in comparative
perspective’, European Journal of Social Security,
Volume 1, 4, 383-404
Bradshaw, J., Gordon, D., Levitas, R., Middleton, S.,
Pantazis, C., Payne, S. and Townsend, P. (1998)
Perceptions of poverty and social exclusion 1998, Report
on Preparatory Research, Bristol: Townsend Centre
for International Poverty Research
Burns, D. (1992) Poll tax rebellion, Stirling: AK Press
Callan, T. and Nolan, B. (1991) ‘Concepts of poverty
and the poverty line’, Journal of Economic Surveys 5(3):
243-61
Callan, T., Nolan, B. and Whelan, C.T. (1993)
‘Resources, deprivation and the measurement of
poverty’, Journal of Social Policy 22(2): 141-72
Callan, T., Nolan, B., Whelan, B.J., Hannan, D.F. and
Creighton, S. (1989) Poverty, income and welfare in
Ireland, Dublin: Economic and Social Research
Institute
Citro, C.F. and Michael, R.T. (eds) (1995) Measuring
poverty: A new approach, Washington DC: National
Academy Press
Cmd 4045 (1998) Bringing Britain together: A national
strategy for neighbourhood renewal, Social Exclusion
Unit, London: The Stationery Office
Colasanto, D., Kapteyn, A. and van der Gaag, J.
(1984) ‘Two subjective definitions of poverty: Results
from the Wisconsin basic needs study’, Journal of
Human Resources 19(1): 127-38
96
Bibliography

Cornia, G.A. (1999) Liberalisation, globalisation and
income distribution, Working Paper No. 157, Helsinki,
Finland: UN World Institute for Development
Economic Research
CSO (Central Statistical Office) (1996-9) Family
Expenditure Survey reports for 1996/7, 1997/8 and
1998/9, London: The Stationery Office
Danziger, S., van der Gaag J., Taussig, M.K. and
Smolensky, E. (1984) ‘The direct measure of welfare
levels: How much does it cost to make ends meet?’,
Review of Economics and Statistics 6(3): 500-05
Davey Smith, G. and Gordon, D. (1999) ‘Poverty and
health inequalities’, in C. Pantazis and D. Gordon
(eds) Tackling inequalities: Where are we now and what
can be done?, Bristol: The Policy Press
Davey Smith, G. and Gordon, D. (2000) ‘Poverty
across the life-course and health’, in Pantazis, C. and
Gordon, D. (eds) Tackling inequalities: where are we
now and what can be done? Bristol: The Policy Press,
pp141-158
Davies, R. and Smith, W. (1998) The basic necessities
survey: The experience of Action Aid Vietnam, London:
Action Aid
Deleeck, H., de Lathouwer, L. and van den Bosch, K.
(1988) Social indicators of social security: A comparative
analysis of five countries, Antwerp: Centre for Social
Policy
Deleeck, H., van den Bosch, K. and de Lathouwer, L.
(eds) (1992) Poverty and the adequacy of social security
in the EC, EUROPASS Research Consortium,
Aldershot: Avebury
DETR (1998) English House Conditions Survey: 1996,
London: DETR
Dobson, B. and Middleton, S. (1998) Paying to care:
The cost of childhood disability, York: YPS/Joseph
Rowntree Foundation
Drever, F., Fisher, K., Brown, J. and Clark, J. (2000)
Social inequalities: 2000 edition, London: The
Stationery Office
DSS (Department of Social Security) (1999a)
Households below average income 1994/5–1997/8,
London: Corporate Document Services
DSS (Department of Social Security) (1999b)
Opportunities for all: Tackling poverty and social
exclusion, Cmd 4445, London: The Stationery Office
DSS (Department of Social Security) (2000)
Households below average income 1998/9, London:
Corporate Document Services
EEC (1981) Final report from the Commission to the
Council on the first programme of pilot schemes and
studies to combat poverty, Brussels: Commission of the
European Communities
EEC (1985) On specific community action to combat
poverty (Council Decision of 19 December 1984)
85/8/EEC, Official Journal of the EEC, 2/24
Eurostat (1999) European Community Household Panel
(ECHP): Selected indicators from the 1995 wave,
Luxembourg: Office for Official Publications of the EC
Goedhart, T., Halberstadt, V., Kapteyn, A. and Van
Praag, B. (1977) ‘The poverty line: concept and
measurement’, Journal of Human Resources 12(4): 503-20
Goode, J., Callender, C. and Lister, R. (1998) Purse or
wallet? Gender inequalities and income distribution
within families on benefits, London: Policy Studies
Institute
Gordon, D. (1995) ‘Census based deprivation indices:
Their weighting and validation’, Journal of
Epidemiology and Community Health, 49 (Suppl 2),
S39-S44
Gordon, D. (2000) ‘Inequalities in income, wealth
and standard of living’, in C. Pantazis and D. Gordon
(eds) Tackling inequalities: Where are we now and what
can be done? Bristol: The Policy Press
97
B I B L I O G R A P H Y

Gordon, D., Davey Smith, G., Dorling, D. and Shaw,
M. (eds) (1999) Inequalities in health: The evidence
presented to the Independent Inquiry into Inequalities in
Health, Bristol: The Policy Press
Gordon, D. and Pantazis, C. (1997) Breadline Britain
in the 1990s, Ashgate: Aldershot
Gordon, D., Parker, R and Loughran, F. with Heslop,
P. (2000) Disabled children in Britain: A reanalysis of the
OPCS Disability Surveys, London: The Stationery
Office
Gordon, D. and Spicker, P. (eds) (1999) The
international glossary on poverty, Cape Town, Dhaka,
Bangkok, London and New York: Zed Books
Gordon, D. and Townsend, P. (1990) ‘Measuring the
poverty line’, Radical Statistics, 47, 5-12
Gore, C. and Figueiredo, J.B. (1996) Social exclusion
and anti-poverty strategies, Geneva: International
Institute for Labour Studies
GSS (1998) Harmonised Concepts and Questions for
Government Social Surveys, London: Government
Statistical Service
Hagenaars, A.J.M. (1986) The perceptions of poverty,
Amsterdam: Elsevier Science Publishers
Hagenaars, A.J.M. and de Vos, K. (1988) ‘The
definition and measurement of poverty’, Journal of
Human Resources 23(2): 211-21
Halleröd, B. (1994) Poverty in Sweden: A new approach
to direct measurement of consensual poverty, Umeå
Studies in Sociology, No. 10 6, University of Umeå
Halleröd, B. (1995a) ‘Perceptions of poverty in
Sweden’, Scandinavian Journal of Social Welfare 4(3):
174-89
Halleröd, B. (1995b) ‘The truly poor: indirect and
direct measurement of consensual poverty in
Sweden’, Journal of European Social Policy 5(2): 111-29
Halleröd, B. (1998) ‘Poor Swedes, poor Britons: A
comparative analysis of relative deprivation’, in H.J.
Andreß (ed.) Empirical poverty research in a comparative
perspective, Aldershot: Ashgate
Hills, J. (1995) Income and wealth, volume 2: A
summary of the evidence, York: Joseph Rowntree
Foundation
Hills, J. (ed.) (1996) New inequalities: The changing
distribution of income and wealth in the United
Kingdom, Cambridge: Cambridge University Press
Hills, J. (1998) Income and wealth: The latest evidence,
York: Joseph Rowntree Foundation
HM Treasury (Nov 1999) ‘Supporting children
through the tax and benefit system’, The
modernisation of Britain’s tax and benefit system, 5,
London: The Stationery Office
HM Treasury (March 2000) ‘Tackling poverty and
making work pay – tax credits for the 21st Century’,
The modernisation of Britain’s tax and benefit system, 6,
London: The Stationery Office
Howarth, C., Kenway, P., Palmer, G. and Miorelli, R.
(1999) Monitoring poverty and social exclusion 1999,
York: Joseph Rowntree Foundation
Independent Inquiry into Inequalities in Health
(1998) Report of the Independent Inquiry into Inequalities
in Health, London: The Stationery Office
Kangas, O. and Ritakallio, V. (1995) Different methods
- different results? Approaches to multidimensional
poverty, Paper presented at the ISARC 19 Conference,
Pavi, Italy
Kangas, O. and Ritakallio, V.M. (1998) ‘Different
methods – different results? Approaches to
multidimensional poverty’, in H.J. Andreß (ed.)
Empirical poverty research in a comparative perspective,
Aldershot: Ashgate
Levitas, R. (1999) The inclusive society, London:
Macmillan
P O V E R T Y A N D S O C I A L E X C L U S I O N I N B R I T A I N
98
Mack, J. and Lansley, S. (1985) Poor Britain, London:
Allen and Unwin
Marsh, A., Gordon, D., Pantazis, C. and Heslop, P.
(1999) Home, sweet home? The impact of poor housing
on health, Bristol: The Policy Press
Martin, J. and White, A. (1988) The financial
circumstances of adults living in private households,
Report 2, London: HMSO
Mayer, S.E. and Jencks, C. (1988) ‘Poverty and the
distribution of material hardship’, The Journal of
Human Resources XXIV.1: 88-113
Middleton, S., Ashworth, K. and Braithwaite, I.
(1997) Small fortunes: Spending on children, childhood
poverty and parental sacrifice, York: Joseph Rowntree
Foundation
Middleton, S., Ashworth, K. and Walker, R. (1994)
Family fortunes: pressures on parents and children in the
1990s, London: CPAG Ltd
Muffels, R. and Vries, A. de (1989) Poverty in the
Netherlands, first report of an international comparative
study, Tilburg: VUGA
Muffels, R., Kapteyn, A., Vries, A. de and Berghman,
J. (1990), Poverty in the Netherlands: Report on the
Dutch Contribution to an International Comparative
Study on Poverty and the Financial Efficacy of the Social
Security System, The Hague: VUGA
Muffels, R. and Vreins, M. (1991) ‘The elaboration of
a deprivation scale and the definition of a subjective
deprivation poverty line’, paper presented at the
Annual Meeting of the European Society for Population
Economic, 6-8 June, Pisa
Muffels, R., Berghman, J. and Dirven, H. (1992) ‘A
multi-method approach to monitor the evolution of
poverty’, Journal of European Social Policy 2(3): 193-
213
Nolan, B.J. and Whelan, C.T. (1996a) Resources,
deprivation and poverty, Oxford: Clarendon Press
Nolan, B.J. and Whelan, C.T. (1996b) ‘Measuring
poverty using income and deprivation indicators:
alternative approaches’, Journal of European Social
Policy 6(3): 225-40
Nunnally, J.C. (1981) Psychometric theory, New Delhi:
Tate McGraw-Hill Publishing Company Ltd
Nyman, C. (1996) ‘Inside the black box: Intra-
household distribution of consumption in Sweden’,
in E. Bihagen, C. Nyman and M. Strand (eds) Three
aspects of consensual poverty in Sweden - work
deprivation, attitudes towards the welfare state and
household consumptional distribution, Umeå, Sweden:
Umeå University
ONS (Office for National Statistics) (1998) Social
trends 28, London: The Stationery Office
ONS (Office for National Statistics) (1999) Social
trends 29, London: The Stationery Office
ONS (Office for National Statistics) (2000) Social
trends 30, London: The Stationery Office
Orshansky, M. (1965) ‘Counting the poor: another
look at the poverty profile’, Social Security Bulletin,
June, 3-29
Payne, S. and Pantazis, C. (1997) ‘Poverty and
gender’, in D. Gordon and C. Pantazis (eds) Breadline
Britain in the 1990s, Aldershot: Ashgate
Piachaud, D. and Sutherland, H. (2000) How effective
is the British Government's attempt to reduce child
poverty?, CASE paper 38, London: Centre for Analysis
of Social Exclusion, LSE
Ramprakash, D. (1994) ‘Poverty in the countries of
the European Union: A synthesis of Eurostat's
research on poverty’, Journal of European Social Policy,
4(2): 117-28
Reynolds, M. (1992) Uncollectable: the story of the poll
tax revolt, Manchester: Greater Manchester Anti-Poll
Tax Federation
99
B I B L I O G R A P H Y
Room, G. (ed.) (1995) Beyond the threshold: the
measurement and analysis of social exclusion, Bristol:
The Policy Press
Rowntree, B.S. (1901) Poverty: A study of town life,
London: Macmillan & Co.
Rowntree, B.S. (1941) Poverty and progress: A second
social survey of York, London: Longmans, Green & Co.
Rowntree, B.S. and Lavers, G.R. (1951) Poverty and the
welfare state: A third social survey of York dealing only
with economic questions, London: Longmans, Green &
Co.
Rubinstein, W.D. (1986) Wealth and inequality in
Britain, London: Faber and Faber
Saltow, L. (1968) ‘Long run changes in British
income inequality’, Economic History Review, 2nd
Series: 21
Saunders, P. and Matheson, G. (1992) Perceptions of
poverty, income adequacy and living standards in
Australia, Social Policy Research Centre, Sydney:
University of New South Wales (Reports and
Proceedings No 99)
Scottish Homes (1997) Scottish House Conditions
Survey, Edinburgh: Scottish Homes
Shaw, M., Dorling, D., Gordon, D. and Davey Smith,
G. (1999) The widening gap: Health inequalities and
policy in Britain, Bristol: The Policy Press
Silver, H. (1994) ‘Social exclusion and social
solidarity: Three paradigms’, International Labour
Review, Vol. 133, No. 5-6
Smyth, M. and Robus, N. (1989) The financial
circumstances of families with disabled children living in
private households, OPCS Surveys of Disability Report
5, London: HMSO
Szalai, J. (ed.) (1998) ‘Old and new poverty in post-
1989 Central Europe’, special issue of East-Central
Europe, Vol. 20-23, parts 3-4
Townsend, P. (1962) ‘The meaning of poverty’, British
Journal of Sociology 8
Townsend, P. (ed.) (1970) The concept of poverty,
London: Heinemann
Townsend, P. (1979) Poverty in the United Kingdom,
London: Allen Lane and Penguin Books
Townsend, P. (1993) The international analysis of
poverty, Hemel Hempstead: Harvester Wheatsheaf
Townsend, P. and Davidson, N. (1988) Inequalities in
health: The Black Report, 2nd edition, London:
Penguin Books
Townsend, P. and Gordon, D. (1989) ‘What is
enough?’ in House of Commons Social Services
Committee, Minimum Income, House of Commons
579, HMSO: London
Townsend, P. and Gordon, D. (1991) ‘What is
enough? New evidence on poverty allowing the
definition of a minimum benefit’, in M. Alder, C.
Bell, J. Clasen and A. Sinfield (eds) The Sociology of
Social Security, Edinburgh: Edinburgh University
Press, pp35-69
Townsend, P., Gordon, D., Bradshaw, J. and
Gosschalk, B. (1997) Absolute and overall poverty in
Britain in 1997: What the population themselves say,
Report of the Second MORI Survey, University of
Bristol: Bristol Statistical Monitoring Unit
Townsend, P., Gordon, D. and Gosschalk, B. (1996)
‘The poverty line in Britain today: What the
population themselves say’, Statistical Monitoring Unit
Report No. 7, University of Bristol
UN (1995) The Copenhagen declaration and programme
of action: World summit for social development 6-12
March 1995, New York: United Nations Department
of Publications
UNDP (1997) Human development report 1997, New
York and Oxford: Oxford University Press
P O V E R T Y A N D S O C I A L E X C L U S I O N I N B R I T A I N
100

UNDP (1998) Poverty in transition, Regional Bureau
for Europe and the CIS, New York: UNDP
UNICEF (2000) A league table of child poverty in rich
nations, Innocenti Report Card Issue No.1, Florence:
UNICEF Innocenti Research Centre
Van den Bosch, K. (1998) ‘Perceptions of the
minimum standard of living in Belgium: Is there a
consensus?’, in H.J. Andreß (ed.) Empirical poverty
research in a comparative perspective, Aldershot:
Ashgate
Van Praag, B., Hagenaars, A. and van Weeren J.
(1980) Poverty in Europe, Report to the Commission of
the EC, University of Leyden
Veit-Wilson, J.H. (1987) ‘Consensual approaches to
poverty lines and social security’, Journal of Social
Policy 16(2): 183-211
Vogel, J. (1997) Living conditions and inequality in the
European Union 1997, Eurostat Working Papers:
Population and Social Conditions E/1997-3,
Luxembourg: Eurostat
Walker, R. (1987) ‘Consensual approaches to the
definition of poverty: Towards an alternative
methodology’, Journal of Social Policy 16(2): 213-26
Wedgwood, J. (1929) The economics of inheritance,
Harmondsworth: Penguin
Whitehead, M. (1988) Inequalities in health: The health
divide, 2nd edition, London: Penguin Books
World Bank (1990) World Development Report 1990:
Poverty, Washington DC: World Bank
World Bank (1996) Poverty reduction and the World
Bank: Progress and challenges in the 1990s, Washington
DC: World Bank
WHO (1998) The World Health Report 1998: Life in the
21st century: A vision for all, Geneva: WHO
Zarb, G. and Maher, L. (1997) The financial
circumstances of disabled people in Northern Ireland,
PPRU Surveys of Disability Report No. 6, Belfast:
NISRA
101
B I B L I O G R A P H Y
