poverty and public assistance for children and … baltimore city had about 48,800 poor children in...
TRANSCRIPT

(PovTCA1999rev042706)
Poverty and Public Assistance
For Children and Families in Maryland
Cynthia Taeuber The Jacob France Institute, University of Baltimore and U.S. Census Bureau
Jane Staveley
The Jacob France Institute, University of Baltimore
Richard Larson The Family Investment Administration
The Maryland Department of Human Resources
June 2003
for The Family Investment Administration
The Maryland Department of Human Resources

2
Poverty and Public Assistance
For Children and Families in Maryland
Cynthia Taeuber, Jane Staveley, and Richard Larson
Executive Summary Overall, Maryland had a relatively strong economy in both 1989 and 1999 but wages among unskilled and semi-skilled workers eroded because of the increase of low-paying service jobs, the loss of higher-paying manufacturing jobs, and the failure of the minimum wage to keep pace with inflation. As a result, there wasn’t much change in poverty rates between 1989 and 1999. In most jurisdictions, there was little difference between the number and share of Maryland’s poor and the number and share receiving public assistance. Urban jurisdictions, however, were more likely to have more poor than public assistance recipients in 1999. Children Children in Baltimore City were more likely to be poor and more likely to receive public assistance than in any other jurisdiction. The children of Prince George’s and Baltimore counties are also a noticeable part of Maryland’s child poverty and public assistance caseloads. Poverty rate About 1 in 9 children in Maryland were poor in 1999. Baltimore City had the highest estimated 1999 poverty rate for children (33 percent) followed by the counties of Western Maryland and the Eastern Shore. There was little change in poverty rates for children from 1989 to 1999 for any county except Prince George’s where the rate increased from about 7 to 10 percent. Number of poor children Maryland had about 439,000 poor people in 1999. Of these poor, about 142,000 were children under 18. In 1989, there were an estimated 128,500 poor children. There were fewer poor children in Baltimore City in 1999 than in 1989. Nevertheless, Baltimore City had the largest share of Maryland’s poor children in both years.
3
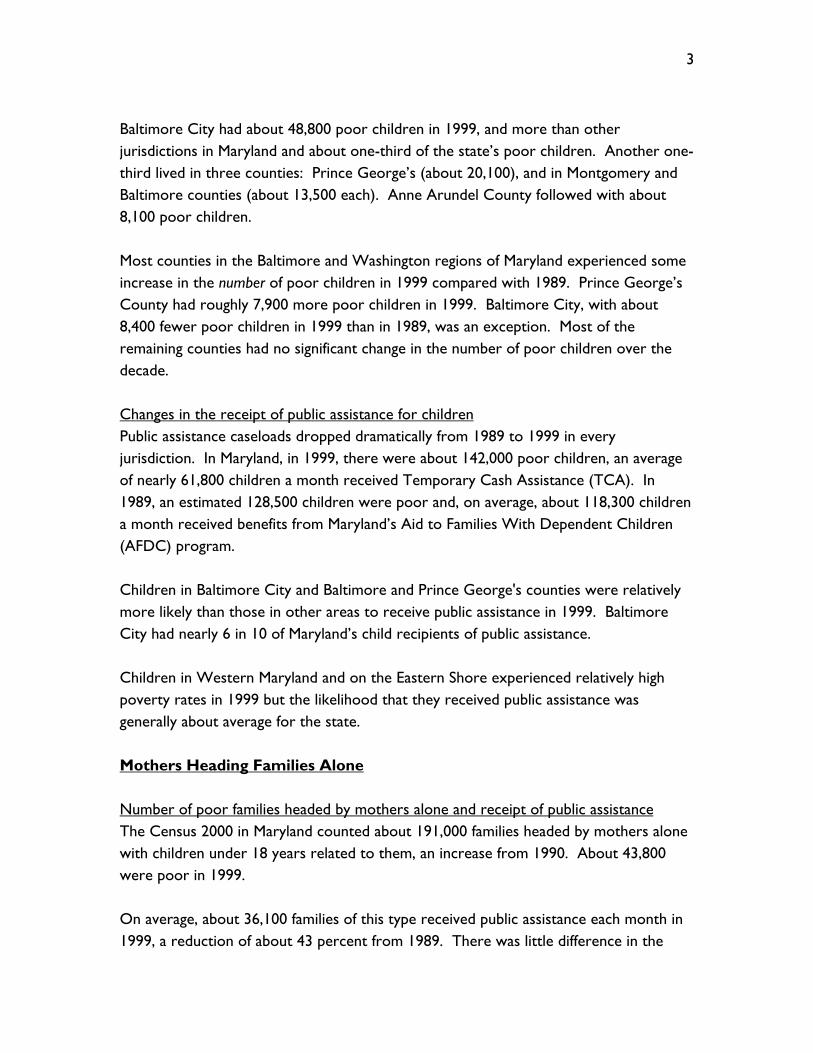
Baltimore City had about 48,800 poor children in 1999, and more than other jurisdictions in Maryland and about one-third of the state’s poor children. Another one-third lived in three counties: Prince George’s (about 20,100), and in Montgomery and Baltimore counties (about 13,500 each). Anne Arundel County followed with about 8,100 poor children. Most counties in the Baltimore and Washington regions of Maryland experienced some increase in the number of poor children in 1999 compared with 1989. Prince George’s County had roughly 7,900 more poor children in 1999. Baltimore City, with about 8,400 fewer poor children in 1999 than in 1989, was an exception. Most of the remaining counties had no significant change in the number of poor children over the decade. Changes in the receipt of public assistance for children Public assistance caseloads dropped dramatically from 1989 to 1999 in every jurisdiction. In Maryland, in 1999, there were about 142,000 poor children, an average of nearly 61,800 children a month received Temporary Cash Assistance (TCA). In 1989, an estimated 128,500 children were poor and, on average, about 118,300 children a month received benefits from Maryland’s Aid to Families With Dependent Children (AFDC) program. Children in Baltimore City and Baltimore and Prince George's counties were relatively more likely than those in other areas to receive public assistance in 1999. Baltimore City had nearly 6 in 10 of Maryland’s child recipients of public assistance. Children in Western Maryland and on the Eastern Shore experienced relatively high poverty rates in 1999 but the likelihood that they received public assistance was generally about average for the state. Mothers Heading Families Alone
Number of poor families headed by mothers alone and receipt of public assistance The Census 2000 in Maryland counted about 191,000 families headed by mothers alone with children under 18 years related to them, an increase from 1990. About 43,800 were poor in 1999. On average, about 36,100 families of this type received public assistance each month in 1999, a reduction of about 43 percent from 1989. There was little difference in the

4
number of such families who were poor in 1989 (42,170) but more received public assistance that year (monthly average of 63,100). The number of poor families of this type, and the number receiving public assistance, was about the same in most counties in 1989 and 1999. In the urban counties of Anne Arundel, Baltimore, Montgomery, and Prince George’s, however, the estimated number of poor families was slightly higher than the number receiving public assistance. Poverty rate The poverty rates of families headed by mothers alone generally declined from 1989 to 1999. Except for Baltimore City, the rates were lower in the Baltimore and Washington regions than in the rest of Maryland’s counties in both 1989 and 1999. Baltimore City’s share Baltimore City had the largest share of Maryland’s poor female-headed families with related children (39 percent in 1999; 50 percent in 1989) and the highest percentage receiving public assistance (58 percent in 1999; 57 percent in 1989). The number of poor families of this type did decline in Baltimore City, however, with about 21,200 such families in 1989 and about 17,200 in 1999. Reasons for Differences Between Data Sets We expect the census estimates of poor to be higher than the counts of families and children who received benefits from public assistance programs.
Not all poor people apply for public assistance and not all poor families are eligible for public assistance.
Data collection methods and concepts differ among data sets. The poverty statistics are collected from a sample of the population, one source of error. There are coverage errors because the decennial census misses some people and counts others more than once.
5
Table of Contents Executive Summary……………………………………………………………………2 Introduction
Changes in public assistance programs from 1989 to 1999………………………8 Data quality and the decennial censuses……………………………………….. 10
Children Total Children: 1990 and 2000 Census Counts………………………………. .11 Poor Children and Receipt of Public Assistance…………………………….…..17
Poverty rates among children……………………………………….…...17 Number of poor children…………………………………………..……27 Share of Maryland’s poor children in each county………………….…...29
Table A. County’s Estimated Share of Maryland’s Poor Children: 1989 and 1999……………………………………………..….….29
Changes in public assistance, 1989 – 1999…………..…..……………….31 Number and share of poor children and public assistance child recipients......... ……………………………………………………………37
Families Headed by Mothers Alone
Total Families With Related Children Under 18 Headed by Mothers Alone…...45 Poverty and Receipt of Public Assistance by Families With Related Children Headed by Mothers Alone……………………………………………………….48
Changes in number of families headed by mothers alone who were poor compared with such families receiving public assistance………………...48 Poverty rates of families headed by mothers alone……………………...58 Each county’s share of Maryland’s families headed by mothers alone who were poor compared with recipients of public assistance……………....61
Text Charts Children 1. Number of Children Under 18 in Maryland: 1990 and 2000 2. Percent Change in Population Under Age 18 in Maryland: 1990 – 2000 3. Percentage of Population Under Age 18: 1990 and 2000 4. Poverty Rate of Children in Maryland: 1989 and 1999

6
5. Poverty and Public Assistance Rates of Children in Maryland: 1999 6. Poverty and Public Assistance Rates of Children in Maryland: 1989 7. Ratio of Public Assistance Rates to Poverty Rates for Children in Maryland: 1989 and 1999 8. Estimated Number of Poor Children in Maryland: 1989 and 1999 9. County's Share of Maryland's Poor Children: 1989 and 1999 10. Percent Change in Children Receiving Public Assistance in Maryland: 1989 - 1999 11. Number of Child Recipients of AFDC in CY1989 and of TCA in CY1999: Maryland 12. County’s Share of Maryland’s Child Recipients of AFDC in CY1989 and of TCA in CY1999 13. Number of Children Who Were Poor in 1989 Compared With Monthly Average AFDC Recipients in Calendar Year 1989: Maryland 14. Number of Children Who Were Poor in 1999 Compared With TCA Recipient Children in Calendar Year 1999: Maryland 15. County’s Share of Maryland’s Children Who Were Poor Compared with TCA Recipient Children in 1999 16. County’s Share of Maryland’s Children Who Were Poor Compared with Monthly Average AFDC Recipients in CY1989 Families Headed by Mothers Alone 17. Total Number of Female Householder Families, No Husband Present, With Related Children Under 18, 1990 and 2000: Maryland 18. Estimated Number of Poor Female-Headed Families, No Husband Present, With Related Children in Maryland: 1989 and 1999 19. Percent Change in Public Assistance Cases for Female-Headed Households With Related Children, No Husband Present, Maryland: 1989 - 1999 20. Number of Female-Headed Families With Related Children Who Were Poor Compared With Number Who Received TCA in CY1999: Maryland 21. Number of Female-Headed Families With Related Children Who Were Poor Compared With Monthly Average AFDC Basic Cases in CY1989: Maryland 22. Poverty Rate of Female-Headed Families With Related Children in 1989 and 1999: Maryland 23. County’s Share of Maryland’s Female-Headed Families With Children Who Were Poor Compared With Those Receiving TCA in CY1999 24. County’s Share of Maryland’s Female-Headed Families With Children Who Were Poor in 1989 Compared With Monthly Average AFDC Basic Cases in CY 1989
7
Text Tables 1. Poverty Status in 1999 of Families, by Family Type, by Work Experience of Householder and Spouse 2. Number of Children Under 18 in Maryland Counties: 1990 and 2000 3. Percentage of the Area’s Population Under 18 and Percentage Change in Maryland’s Counties: 1990 - 2000 4. Poverty Rate of Children Under 18 in Maryland: 1989 and 1999 5. Poverty and Public Assistance Rates of Children in 1989 and 1999: Maryland 6. Census 2000 Estimates of Total Children, Poor Children in CY 1999, and TCA Child Recipients in CY 1999: Maryland 7. 1990 Census Estimates of Total Children, Poor Children in CY 1989, and AFDC Child Recipients in CY 1989: Maryland 8. Estimated Number of Poor Children in 1989 and 1999: Maryland 9. Family Type and Presence of Children in 1990 and 2000: Maryland 10. Census 2000 Estimates of Female-Headed Families, No Husband Present, With Related Children Under 18 Who Were Poor in 1999 Compared With TCA Caseloads in 1999: Maryland 11. 1990 Census Estimates of Female-Headed Families, No Husband Present, With Related Children Under 18 Who Were Poor in 1989 Compared with AFDC Caseloads in 1989: Maryland 12. Percentage Change in Public Assistance for Female-Headed Families, No Husband Present, With Related Children Under 18 from 1989 to 1999: Maryland 13. Poverty Rate in 1989 and 1999 of Female-Headed Families, No Husband Present, With Related Children Under 18: Maryland 14. County’s Share of Female-Headed Families, No Husband Present, With Related Children Under 18 Who Were Poor in 1999 Compared with TCA Recipient Families in 1999: Maryland 15. County’s Share of Female-Headed Families, No Husband Present, With Related Children Under 18 Who Were Poor in 1989 Compared with AFDC Recipient Families in 1989: Maryland
Appendices A-1. Income Question in Census 2000 Sample (Long Form) A-2. Income Question in 1990 Census Sample (Long Form)

8
B. Subjects in 1990 and 2000 Censuses and Census in Which Subject Was First Asked C. Determination of Eligibility for TCA in 1999
9
Poverty and Public Assistance For Children and Families in Maryland
Cynthia Taeuber, Jane Staveley, and Richard Larson
Introduction
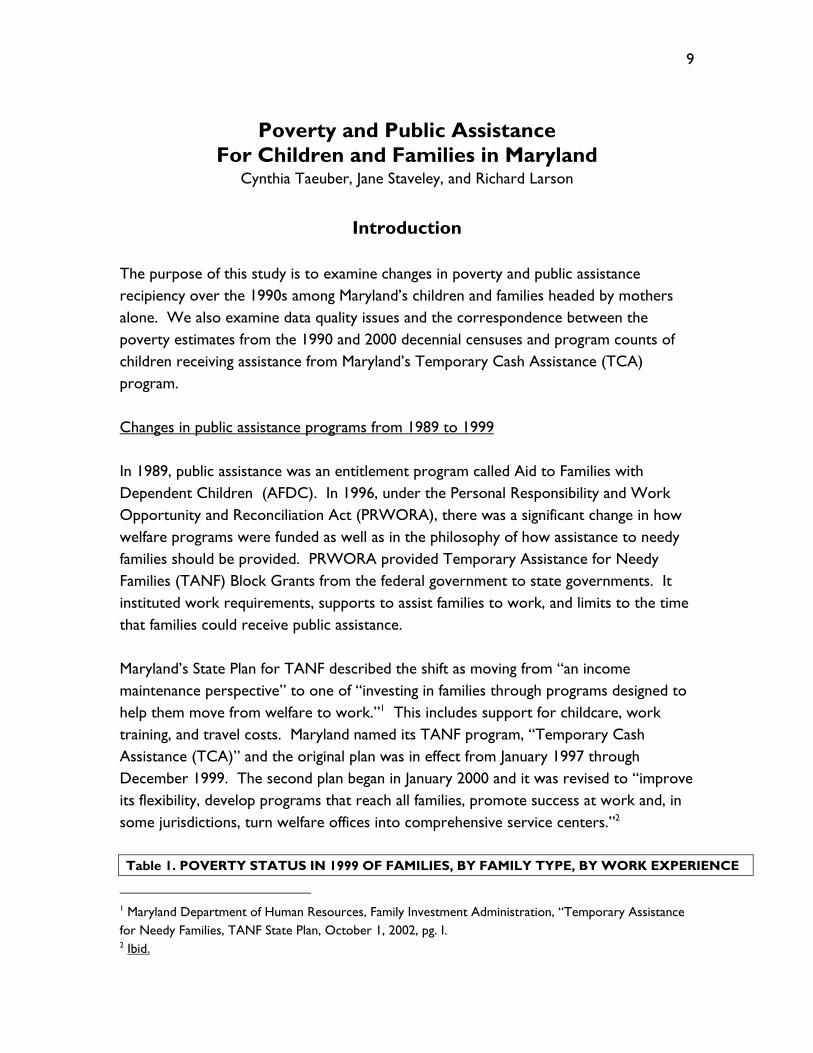
The purpose of this study is to examine changes in poverty and public assistance recipiency over the 1990s among Maryland’s children and families headed by mothers alone. We also examine data quality issues and the correspondence between the poverty estimates from the 1990 and 2000 decennial censuses and program counts of children receiving assistance from Maryland’s Temporary Cash Assistance (TCA) program. Changes in public assistance programs from 1989 to 1999 In 1989, public assistance was an entitlement program called Aid to Families with Dependent Children (AFDC). In 1996, under the Personal Responsibility and Work Opportunity and Reconciliation Act (PRWORA), there was a significant change in how welfare programs were funded as well as in the philosophy of how assistance to needy families should be provided. PRWORA provided Temporary Assistance for Needy Families (TANF) Block Grants from the federal government to state governments. It instituted work requirements, supports to assist families to work, and limits to the time that families could receive public assistance. Maryland’s State Plan for TANF described the shift as moving from “an income maintenance perspective” to one of “investing in families through programs designed to help them move from welfare to work.”1 This includes support for childcare, work training, and travel costs. Maryland named its TANF program, “Temporary Cash Assistance (TCA)” and the original plan was in effect from January 1997 through December 1999. The second plan began in January 2000 and it was revised to “improve its flexibility, develop programs that reach all families, promote success at work and, in some jurisdictions, turn welfare offices into comprehensive service centers.”2 Table 1. POVERTY STATUS IN 1999 OF FAMILIES, BY FAMILY TYPE, BY WORK EXPERIENCE
1 Maryland Department of Human Resources, Family Investment Administration, “Temporary Assistance for Needy Families, TANF State Plan, October 1, 2002, pg. I. 2 Ibid.

10
OF HOUSEHOLDER AND SPOUSE - Universe: Families
Data Set: Census 2000 Summary File 3 (SF 3) - Sample Data, PCT60 Data based on a sample. For further information on confidentiality protection, sampling and nonsampling errors, and definitions see http://factfinder.census.gov/home/en/datanotes/expsf3.htm.
Income in 1999 below poverty level
Married-couple family
Householder worked full-time, year-round in 1999
State and County Total families
Total, below poverty level
Total, Married-couple family
Total, House-holder worked full-time, year-round in 1999
Spouse worked full-time, year-round in 1999
Spouse worked less than full-time, year-round in 1999
Spouse did not work in 1999
Maryland 1,368,647 83,232 25,999 4,537 213 1,024 3,300
Allegany 19,010 1,849 904 116 0 9 107
Anne Arundel 129,964 4,626 1,569 432 0 122 310
Baltimore County 199,946 9,058 3,260 457 20 153 284
Calvert 20,205 635 185 6 0 0 6
Caroline 8,145 730 304 77 0 18 59
Carroll 41,425 1,130 494 84 19 11 54
Cecil 23,350 1,253 469 109 10 21 78
Charles 32,500 1,203 308 48 0 32 16
Dorchester 8,584 865 260 36 0 4 32
Frederick 52,278 1,530 574 125 9 40 76
Garrett 8,408 826 485 97 4 35 58
Harford 60,722 2,172 745 138 0 39 99
Howard 66,355 1,688 695 162 0 53 109
Kent 5,161 478 183 22 7 0 15
Montgomery 226,024 8,428 3,904 859 9 139 711
Prince George's 199,524 10,641 3,246 577 9 119 449
Queen Anne's 11,609 505 241 43 8 8 27
St. Mary's 22,590 1,164 413 144 6 39 99
Somerset 5,509 824 334 75 0 31 44
Talbot 9,639 510 202 50 8 23 19
Washington 34,235 2,386 910 190 17 23 150
Wicomico 21,893 1,905 563 126 3 16 107
Worcester 13,404 962 345 65 18 0 47
Baltimore City 148,167 27,864 5,406 499 66 89 344

11
With welfare reform, many parents in low-income families moved into the work place3 and the number of families receiving public assistance dropped dramatically. Data quality and the decennial censuses A source of error in the data is when respondents do not understand whether a question applies to them. Appendixes A-1 and A-2 show the Census 2000 and 1990 Census questions on income and the section that asks about cash public assistance. Census 2000 asked about “any public assistance or welfare payments from the state or local welfare office” in 1999 for each household member 15 years and older. From the data shown later in this report, it does not appear that respondent confusion about the question was a source of sizeable error. We expect the estimated number of poor to be higher than the counts of those receiving assistance because not all poor people apply for public assistance and not all are eligible. But, because data collection methods and concepts are not the same, there are differences in what sample surveys and program records measure. A previous report4 focused on data quality issues related to the 1990 Census, particularly the issue of undercounting poor households and differences among race groups. We examined why there were apparent disparities between the 1990 Census sample estimates of poverty and the counts of children and families that received public assistance payments in 1989 from the Aid to Families with Dependent Children (AFDC) program. That report concluded that once we controlled for sampling error and differences in concepts, there were no real differences in the results except in Baltimore City. Once the sampling error of the poverty estimates from the census sample was taken into account, every county had a higher estimate of poor children than they had children in families receiving AFDC payments. In Baltimore City,
3 Women with no husband present headed about 50,000 of Maryland’s more than 83,000 families that were poor in 1999 (Table 1). In about 5,300 of the 50,000 poor families headed by women alone, the age of the woman was 65 and older (U.S. Census Bureau, Census 2000, STF3, Table P89). Baltimore City had about 28,000 of the state’s total poor families and women with no husband present headed nearly 20,000 poor families; about 2,500 of these were women aged 65 and older. In Baltimore City, according to the responses to Census 2000, about half of Baltimore City’s women heading families alone did not work in 1999, about 2,000 worked year round and full time (35 or more hours a week), and roughly 8,000 worked part time or part of the year. The Census Bureau did not produce a similar tabulation of the 1990 responses for comparison. 4 Cynthia Taeuber, Jane Staveley, and Richard Larson, “Issues in Comparisons of Decennial Census Poverty Estimates With Public Assistance Caseloads in Maryland,” paper for the National Association for Welfare Research and Statistics,” August 2001. See: http://www.ubalt.edu/jfi/jfc/publications.htm

12
however, about 10,000 more children received AFDC than the census estimated were poor. Sampling error and differences in the definition and reporting of income did not explain the unexpected results. We concluded that the most plausible explanation was the undercount of African-American children in the 1990 Census of Baltimore City. We cannot do a similar analysis of household coverage for Census 2000. Nationally, there is reason to believe there was an overcount of the population and relatively less difference than in the 1990 Census between the counts of Whites and those of other racial groups. We cannot extrapolate the national results to individual jurisdictions in Maryland.5
Children
Total Children: 1990 and 2000 Census Counts To set the context for the discussion below on poor children, we provide here a picture of change in the number of total children in Maryland’s jurisdictions. Maryland had nearly 1.4 million children according to Census 2000, an increase of about 194,000 children since the 1990 Census was taken (Table 2, Chart 1). Only Baltimore City experienced a noticeable decline in the number of children over the 1990s. Allegany, Garrett, and Somerset counties also had slightly fewer children in 2000 than in 1990. While Baltimore City had the largest percentage decline in children over the decade (about 18,500 fewer children in 2000, a 10-percent decrease over the decade as shown in Chart 2), the proportion of the City’s population under 18 increased somewhat (Chart 3). Children represented anywhere from twenty-to-thirty percent of the population in Maryland’s counties in 1990 and 2000. The proportions increased a bit over the 1990s
5 (1) David A. Freedman and Kenneth W. Wachter, “On the Likelihood of Improving the Accuracy of the Census Through Statistical Adjustment,” Science and Statistics: A Festscrift for Terry Speed. Institute of Mathematical Statistics Monograph 40 (2003) pp. 197–230. D. R. Goldstein and S. Dudoit, eds. Available at: http://www.stat.berkeley.edu/users/census/; and (2) U.S. Census Bureau, “Census 2000 Testing, Experimentation, and Evaluation Program Summary,” at http://www.census.gov/pred/www/

13
in the Baltimore and Washington regions. Southern Maryland counties generally had a higher proportion of children than did those in other regions (Table 3).

14
Chart 1. Only Baltimore City experienced a noticeable decline in children from 1990-2000 Number of Children Under 18 in Maryland: 1990 and 2000
0
50,000
100,000
150,000
200,000
250,000
BA
LTIM
OR
E R
EG
ION
Ann
e A
rund
el
Bal
tim
ore
Cou
nty
Car
roll
Har
ford
How
ard
Bal
tim
ore
Cit
y
WA
SHIN
GT
ON
RE
GIO
N
Fred
eric
k
Mon
tgom
ery
Pri
nce
Geo
rge'
s
SOU
TH
ER
N M
D
Cal
vert
Cha
rles
St. M
ary
WE
STE
RN
MD
Alle
gany
Gar
rett
Was
hing
ton
UP
PE
R E
AST
ER
N S
HO
RE
Car
olin
e
Cec
il
Ken
t
Que
en A
nne'
s
Tal
bot
LOW
ER
EA
STE
RN
SH
OR
E
Dor
ches
ter
Som
erse
t
Wic
omic
o
Wor
cest
er
1990 Census count
Census 2000 count
Source: U.S. Census Bureau,
1990 and 2000 Censuses (SF1)
Number
Decline in number

15
Table 2. Number of Children Under 18 in Maryland Counties: 1990 and 2000 Red - Decrease in number of children, 1990- 2000
State, Region, County
1990 Census count of children under 18
Census 2000 count of children under 18
Maryland 1,162,241 1,356,172
BALTIMORE REGION
Anne Arundel 105,188 123,636
Baltimore County 151,162 178,363
Carroll 32,770 41,838
Harford 48,782 60,965
Howard 48,482 69,543
Baltimore City 179,869 161,353 WASHINGTON REGION
Frederick 39,731 53,887
Montgomery 178,244 221,758
Prince George's 177,945 214,602
SOUTHERN MD
Calvert 14,600 22,056
Charles 29,756 34,651
St. Mary 21,553 24,080
WESTERN MD
Allegany 16,365 15,406 Garrett 7,620 7,484 Washington 27,536 30,914
UPPER EASTERN SHORE
Caroline 7,100 7,978
Cecil 19,508 23,789
Kent 3,805 3,985
Queen Anne's 8,341 10,306
Talbot 6,433 7,324
LOWER EASTERN SHORE
Dorchester 6,917 7,151
Somerset 4,727 4,579 Wicomico 18,110 20,965
Worcester 7,697 9,559
Source: U.S. Census Bureau, 1990 and 2000 Censuses (SF1)

16
Chart 2. Baltimore City had 10 percent fewer children in 2000 than in 1990 Percent Change in Population Under Age 18 in Maryland: 1990 - 2000
-20
-10
0
10
20
30
40
50
60M
aryl
and
BA
LTIM
OR
E R
EG
ION
Ann
e A
rund
el
Bal
tim
ore
Cou
nty
Car
roll
Har
ford
How
ard
Bal
tim
ore
Cit
y
WA
SHIN
GT
ON
RE
GIO
N
Fred
eric
k
Mon
tgom
ery
Pri
nce
Geo
rge'
s
SOU
TH
ER
N M
D
Cal
vert
Cha
rles
St. M
ary
WE
STE
RN
MD
Alle
gany
Gar
rett
Was
hing
ton
UP
PE
R E
AST
ER
N S
HO
RE
Car
olin
e
Cec
il
Ken
t
Que
en A
nne'
s
Tal
bot
LOW
ER
EA
STE
RN
SH
OR
E
Dor
ches
ter
Som
erse
t
Wic
omic
o
Wor
cest
er
Percent change
Source: U.S. Census Bureau, decennial census counts (SF1)

17
Chart 3. Children were a somewhat larger part of the Baltimore and Washington Region
population in 2000 than in 1990 Percentage of Population Under Age 18: 1990 and 2000
0
5
10
15
20
25
30
35M
aryl
and
BA
LTIM
OR
E R
EG
ION
Ann
e A
rund
el
Bal
tim
ore
Cou
nty
Car
roll
Har
ford
How
ard
Bal
tim
ore
Cit
y
WA
SHIN
GT
ON
RE
GIO
N
Fred
eric
k
Mon
tgom
ery
Pri
nce
Geo
rge'
s
SOU
TH
ER
N M
D
Cal
vert
Cha
rles
St. M
ary
WE
STE
RN
MD
Alle
gany
Gar
rett
Was
hing
ton
UP
PE
R E
AST
ER
N S
HO
RE
Car
olin
e
Cec
il
Ken
t
Que
en A
nne'
s
Tal
bot
LOW
ER
EA
STE
RN
SH
OR
E
Dor
ches
ter
Som
erse
t
Wic
omic
o
Wor
cest
er
1990 Census
Census 2000
Source: U.S. Census Bureau,
1990 and 2000 Censuses (SF1)
Percent
Decline 1990 - 2000

18
Table 3. Percentage of the Area's Population Under 18 and Percentage Change in Maryland's Counties: 1990 - 2000
Red - Decrease in number of children, 1990 - 2000
State, Region, County
Percentage of population under 18 in 1990
Percentage of population under 18 in 2000
Percentage change in count of children, 1990 -2000
Maryland 24.3 25.6 16.7
BALTIMORE REGION
Anne Arundel 24.6 25.2 17.5
Baltimore County 21.8 23.6 18.0
Carroll 26.6 27.7 27.7
Harford 26.8 27.9 25.0
Howard 25.9 28.1 43.4
Baltimore City 24.4 24.8 -10.3
WASHINGTON REGION
Frederick 26.5 27.6 35.6
Montgomery 23.5 25.4 24.4
Prince George's 24.4 26.8 20.6
SOUTHERN MD
Calvert 28.4 29.6 51.1
Charles 29.4 28.7 16.5
St. Mary 28.4 27.9 11.7
WESTERN MD
Allegany 21.8 20.6 -5.9
Garrett 27.1 25.1 -1.8
Washington 22.7 23.4 12.3
UPPER EASTERN SHORE
Caroline 26.3 26.8 12.4
Cecil 27.3 27.7 21.9
Kent 21.3 20.8 4.7
Queen Anne's 24.6 25.4 23.6
Talbot 21.1 21.7 13.9
LOWER EASTERN SHORE
Dorchester 22.9 23.3 3.4
Somerset 20.2 18.5 -3.1
Wicomico 24.4 24.8 15.8
Worcester 22 20.5 24.2
Source: U.S. Census Bureau, 1990 and 2000 Censuses, (SF1)

19
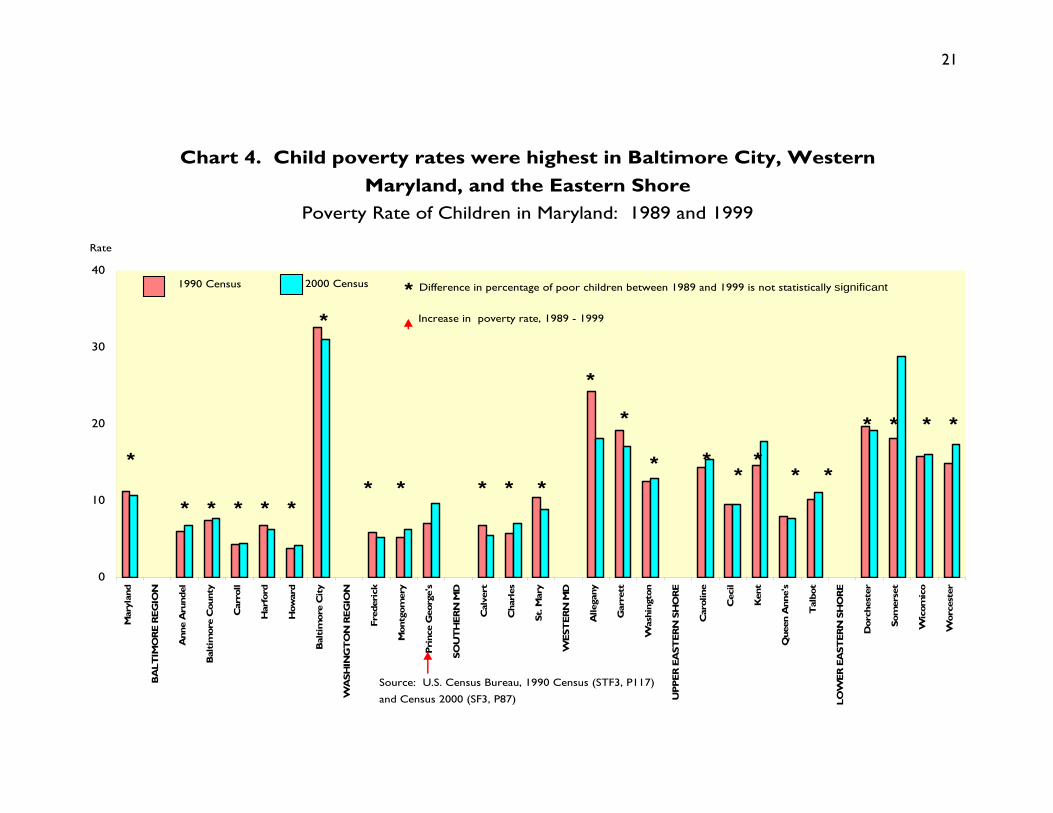
Poor Children and Receipt of Public Assistance Here we report on poverty among children and changes in their receipt of public assistance in 1989 and 1999 in Maryland, its regions, and its counties. Such statistics offer one way to evaluate the economic well being of the people of the state. Overall, Maryland had a relatively strong economy in both 1989 and 1999. In fact, Maryland’s economy grew faster than the overall U.S. economy in 1999.6 According to a study of income inequality by Maryland’s Department of Planning, during the latter half of the 1990s, Maryland experienced strong employment gains and rising real incomes while “income inequality…[grew]… at about the same pace as it had in the previous decade.” 7 The study points out that this was partly due to the erosion of wages among unskilled and semi-skilled workers because of the increase of low-paying service jobs, the loss of higher-paying manufacturing jobs, and two decades of the minimum wage failing to keep pace with inflation. Poverty rates among children Given the erosion of wages among those with lower-level work skills, it is not surprising to learn from the results of Census 2000 that in Maryland, even though the economy was strong overall, poverty8 rates among children were about the same in 1999 as they were in 1989 (Chart 4 and Table 4). About 1 in 9 children in Maryland were poor in
6 Maryland Department of Planning, “Maryland’s Economy Drives Migration Population Gains,” pg. 4, available at: http://www.mdp.state.md.us/MSDC/IRS Migr_idx.htm 7 Maryland Department of Planning, “Income Inequality Continues to Grow in Maryland,” pp. 1-2, available at: http://www.mdp.state.md.us/MSDC/Income_Inequality/income_inequality.htm 8 The estimates of poverty in this report are based on interviewing a sample of the population. As with all surveys, the estimates may differ from the actual values. The appendix tables, and some of the charts, show 90-percent confidence intervals, a measure of the uncertainty of the estimates of poverty. The degree of uncertainty because of sampling variability is considered in the analyses in this report. Poverty refers to money income before taxes only (noncash benefits and assets, for example, are not included). Poverty is defined by the U.S. Office of Management and Budget in Statistical Policy Directive No. 14 (see: http://www.census.gov/hhes/poverty/povdef.html). As stated on the Census Bureau’s website, “While the thresholds in some sense represent families' needs, the official poverty measure should be interpreted as a statistical yardstick rather than as a complete description of what people and families need to live.” The income thresholds for poverty vary by family size and composition. For example, in 1999, the poverty threshold for a single parent and two children was $13,423 and for one with four children, it was $19,578. Additional information is available at http://www.census.gov/hhes/poverty/threshld.html

20
1999,9 a poverty rate that was not significantly different from 1989. Maryland’s children were somewhat more likely to be poor than the state’s people who were 65 and older. It was only Prince George’s County where the poverty rate of children increased over the decade, from about 7 percent to 10 percent. About one-third of Baltimore City’s children were poor in both periods, the largest share of any jurisdiction. The counties of Western Maryland and the Eastern Shore had the next highest poverty rates for children. These were also the jurisdictions with the greatest degree of income inequality according to the study of the Maryland Department of Planning.10
9 Nationally, the poverty rate for children was nearly 17 percent. See: Joseph Dalaker and Bernadette D. Proctor, U.S. Census Bureau, Current Population Reports, Series P60-210, “Poverty in the United States: 1999,” U.S. Government Printing Office, Washington, DC, pg. v. 10 Maryland Department of Planning, op.cit., pg. 3.
21
Chart 4. Child poverty rates were highest in Baltimore City, Western Maryland, and the Eastern Shore
Poverty Rate of Children in Maryland: 1989 and 1999
0
10
20
30
40
Mar
ylan
d
BA
LTIM
OR
E R
EG
ION
Ann
e A
rund
el
Bal
tim
ore
Cou
nty
Car
roll
Har
ford
How
ard
Bal
tim
ore
Cit
y
WA
SHIN
GT
ON
RE
GIO
N
Fred
eric
k
Mon
tgom
ery
Pri
nce
Geo
rge'
s
SOU
TH
ER
N M
D
Cal
vert
Cha
rles
St. M
ary
WE
STE
RN
MD
Alle
gany
Gar
rett
Was
hing
ton
UP
PE
R E
AST
ER
N S
HO
RE
Car
olin
e
Cec
il
Ken
t
Que
en A
nne'
s
Tal
bot
LOW
ER
EA
STE
RN
SH
OR
E
Dor
ches
ter
Som
erse
t
Wic
omic
o
Wor
cest
er
1990 Census 2000 Census
Source: U.S. Census Bureau, 1990 Census (STF3, P117)
and Census 2000 (SF3, P87)
* * * * *
*
* * * * *
*
*
* * * * * *
* * * *
Difference in percentage of poor children between 1989 and 1999 is not statistically significant*
*
Rate
Increase in poverty rate, 1989 - 1999
22
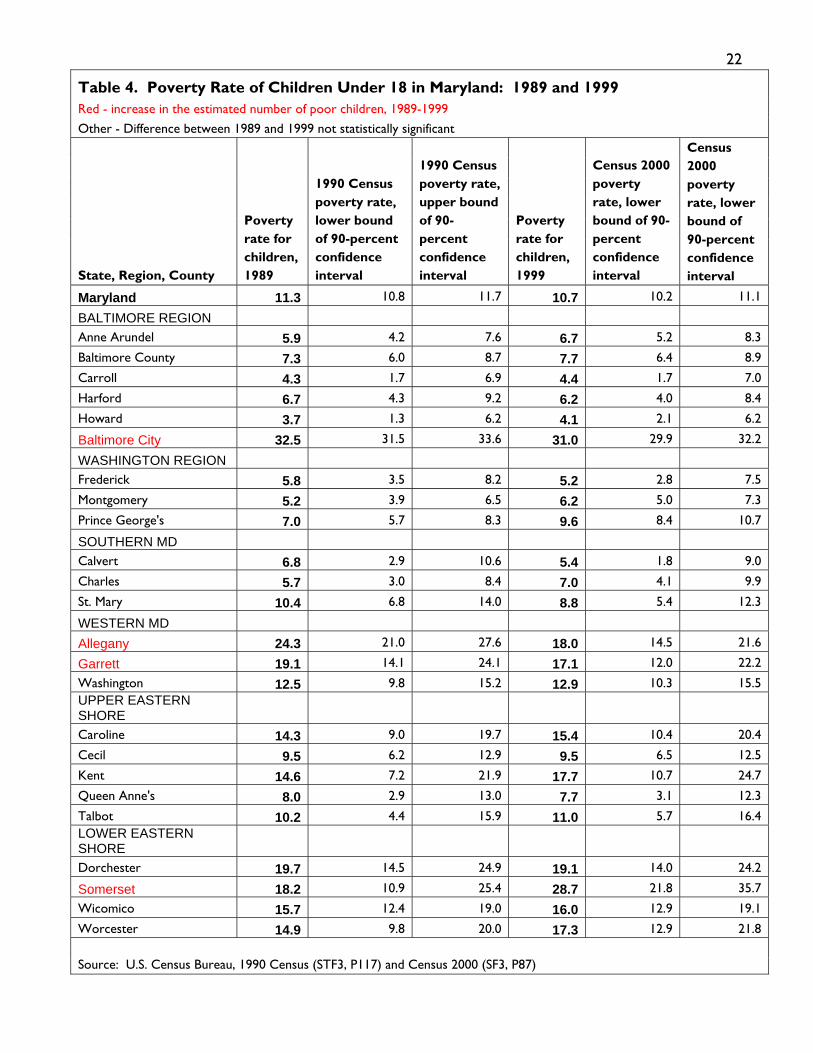
Table 4. Poverty Rate of Children Under 18 in Maryland: 1989 and 1999
Red - increase in the estimated number of poor children, 1989-1999 Other - Difference between 1989 and 1999 not statistically significant
State, Region, County
Poverty rate for children, 1989
1990 Census poverty rate, lower bound of 90-percent confidence interval
1990 Census poverty rate, upper bound of 90-percent confidence interval
Poverty rate for children, 1999
Census 2000 poverty rate, lower bound of 90-percent confidence interval
Census 2000 poverty rate, lower bound of 90-percent confidence interval
Maryland 11.3 10.8 11.7 10.7 10.2 11.1
BALTIMORE REGION
Anne Arundel 5.9 4.2 7.6 6.7 5.2 8.3
Baltimore County 7.3 6.0 8.7 7.7 6.4 8.9
Carroll 4.3 1.7 6.9 4.4 1.7 7.0
Harford 6.7 4.3 9.2 6.2 4.0 8.4
Howard 3.7 1.3 6.2 4.1 2.1 6.2
Baltimore City 32.5 31.5 33.6 31.0 29.9 32.2
WASHINGTON REGION
Frederick 5.8 3.5 8.2 5.2 2.8 7.5
Montgomery 5.2 3.9 6.5 6.2 5.0 7.3
Prince George's 7.0 5.7 8.3 9.6 8.4 10.7
SOUTHERN MD
Calvert 6.8 2.9 10.6 5.4 1.8 9.0
Charles 5.7 3.0 8.4 7.0 4.1 9.9
St. Mary 10.4 6.8 14.0 8.8 5.4 12.3
WESTERN MD
Allegany 24.3 21.0 27.6 18.0 14.5 21.6
Garrett 19.1 14.1 24.1 17.1 12.0 22.2
Washington 12.5 9.8 15.2 12.9 10.3 15.5 UPPER EASTERN SHORE
Caroline 14.3 9.0 19.7 15.4 10.4 20.4
Cecil 9.5 6.2 12.9 9.5 6.5 12.5
Kent 14.6 7.2 21.9 17.7 10.7 24.7
Queen Anne's 8.0 2.9 13.0 7.7 3.1 12.3
Talbot 10.2 4.4 15.9 11.0 5.7 16.4 LOWER EASTERN SHORE
Dorchester 19.7 14.5 24.9 19.1 14.0 24.2
Somerset 18.2 10.9 25.4 28.7 21.8 35.7
Wicomico 15.7 12.4 19.0 16.0 12.9 19.1
Worcester 14.9 9.8 20.0 17.3 12.9 21.8
Source: U.S. Census Bureau, 1990 Census (STF3, P117) and Census 2000 (SF3, P87)
23
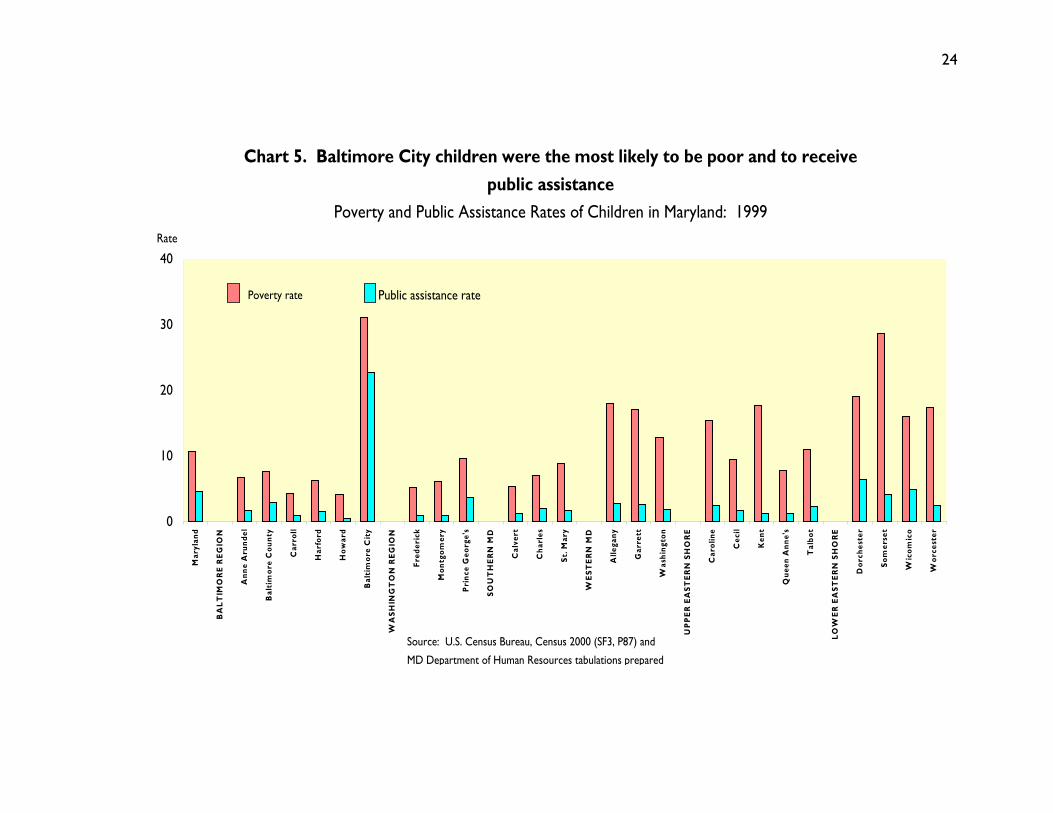
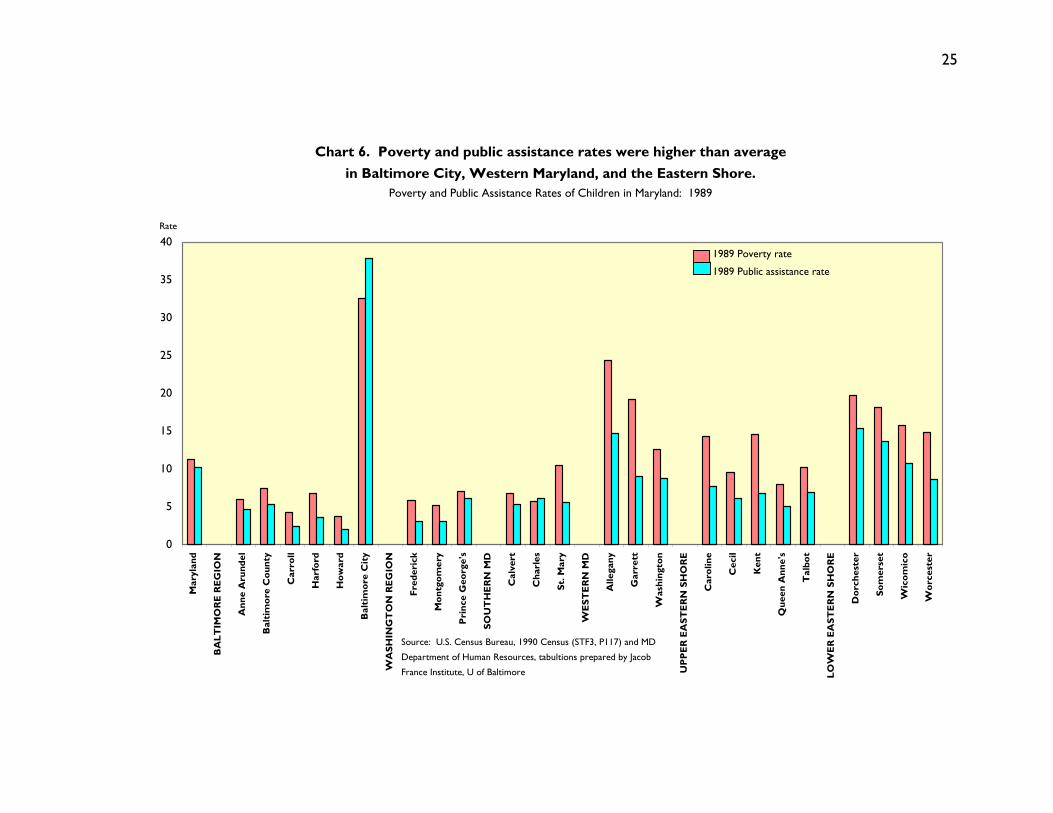
The probability of children being poor and the probability of receiving public assistance were higher for Baltimore City than for any county (Charts 5, 6, Table 5). For example, in 1999, about 31 percent of Baltimore City’s children were poor and 23 percent received TCA. While children in Western Maryland and on the Eastern Shore experienced relatively high poverty rates in 1999, the likelihood of children receiving public assistance there was generally about average for the state or somewhat less. By contrast, in 1989, the likelihood of children in those counties receiving public assistance was near or above the state average.
24
Chart 5. Baltimore City children were the most likely to be poor and to receive public assistance
Poverty and Public Assistance Rates of Children in Maryland: 1999
0
10
20
30
40
Mar
ylan
d
BA
LTIM
OR
E R
EG
ION
Ann
e A
rund
el
Bal
tim
ore
Cou
nty
Car
roll
Har
ford
How
ard
Bal
tim
ore
Cit
y
WA
SHIN
GT
ON
RE
GIO
N
Fred
eric
k
Mon
tgom
ery
Pri
nce
Geo
rge'
s
SOU
TH
ER
N M
D
Cal
vert
Cha
rles
St. M
ary
WE
STE
RN
MD
Alle
gany
Gar
rett
Was
hing
ton
UP
PE
R E
AST
ER
N S
HO
RE
Car
olin
e
Cec
il
Ken
t
Que
en A
nne'
s
Tal
bot
LOW
ER
EA
STE
RN
SH
OR
E
Dor
ches
ter
Som
erse
t
Wic
omic
o
Wor
cest
er
Public assistance rate
Source: U.S. Census Bureau, Census 2000 (SF3, P87) and
MD Department of Human Resources tabulations prepared
Rate
Poverty rate
25
Chart 6. Poverty and public assistance rates were higher than average in Baltimore City, Western Maryland, and the Eastern Shore.
Poverty and Public Assistance Rates of Children in Maryland: 1989
0
5
10
15
20
25
30
35
40
Mar
ylan
d
BA
LTIM
OR
E R
EG
ION
Ann
e A
rund
el
Bal
tim
ore
Cou
nty
Car
roll
Har
ford
How
ard
Bal
tim
ore
Cit
y
WA
SHIN
GT
ON
RE
GIO
N
Fred
eric
k
Mon
tgom
ery
Pri
nce
Geo
rge'
s
SOU
TH
ER
N M
D
Cal
vert
Cha
rles
St. M
ary
WE
STE
RN
MD
Alle
gany
Gar
rett
Was
hing
ton
UP
PE
R E
AST
ER
N S
HO
RE
Car
olin
e
Cec
il
Ken
t
Que
en A
nne'
s
Tal
bot
LOW
ER
EA
STE
RN
SH
OR
E
Dor
ches
ter
Som
erse
t
Wic
omic
o
Wor
cest
er
Rate
1989 Poverty rate
1989 Public assistance rate
Source: U.S. Census Bureau, 1990 Census (STF3, P117) and MD
Department of Human Resources, tabultions prepared by Jacob
France Institute, U of Baltimore

26Table 5. Poverty and Public Assistance Rates of Children in 1989 and 1999: Maryland
State, Region, County
Census 2000 poverty rate for all children under 18
1990 Census poverty rate for children under 18
1999 Public assistance rate,1
children
1989 Public assistance rate,1
children
1999 ratio of public assistance rate1 to poverty rate, children
1989 ratio of public assistance rate1 to poverty rate, children
Maryland 10.7 11.3 4.6 10.2 42.7 90.5
BALTIMORE REGION
Anne Arundel 6.7 5.9 1.6 4.6 24.4 78.6
Baltimore County 7.7 7.3 3.0 5.2 38.8 71.3
Carroll 4.4 4.3 0.9 2.4 20.6 56.1
Harford 6.2 6.7 1.5 3.5 24.0 52.6
Howard 4.1 3.7 0.6 2.0 13.6 52.4
Baltimore City 31.0 32.5 22.8 37.8 73.3 116.2
WASHINGTON REGION
Frederick 5.2 5.8 1.0 3.0 19.0 51.9
Montgomery 6.2 5.2 0.9 3.1 14.7 60.0
Prince George's 9.6 7.0 3.7 6.1 39.0 87.1
SOUTHERN MD
Calvert 5.4 6.8 1.3 5.3 23.6 78.0
Charles 7.0 5.7 2.1 6.1 29.9 107.6
St. Mary 8.8 10.4 1.7 5.6 19.6 53.3
WESTERN MD
Allegany 18.0 24.3 2.8 14.7 15.3 60.7
Garrett 17.1 19.1 2.7 8.9 15.6 46.7
Washington 12.9 12.5 1.9 8.7 14.9 69.7 UPPER EASTERN SHORE
Caroline 15.4 14.3 2.5 7.6 16.1 53.1
Cecil 9.5 9.5 1.7 6.2 17.4 64.6
Kent 17.7 14.6 1.3 6.7 7.1 46.0
Queen Anne's 7.7 8.0 1.3 5.1 16.3 63.6
Talbot 11.0 10.2 2.3 6.9 20.5 67.9 LOWER EASTERN SHORE
Dorchester 19.1 19.7 6.5 15.4 33.9 77.9
Somerset 28.7 18.2 4.1 13.6 14.4 74.9
Wicomico 16.0 15.7 4.9 10.7 30.6 67.7
Worcester 17.3 14.9 2.5 8.7 14.6 58.2
1Rate = Monthly average count of children receiving public assistance in the calendar year divided by the census count of children
Source: U.S. Census Bureau, Census 2000 (P87), 1990 Census (P117); and MD Department of Human Resources, tabulations prepared by the Jacob France Institute, University of Baltimore

27
By 1999, public assistance caseloads had dropped dramatically compared with the 1989 levels. In Chart 7, we look at the ratio of public assistance to poverty rates for children, in which a score of 100 indicates the rates are equal. There was an extreme change in the patterns between 1989 and 1999. Kent and Garrett counties, with ratios of about 46, had the lowest ratios in 1989. Ten years later, every jurisdiction other than Baltimore City was well below the lowest 1989 ratio. In 1999, most counties had ratios below 20, with Kent County the lowest (7). No county came close to Baltimore City’s ratio of 73. Prince George’s and Baltimore counties were next highest with ratios of 39.

28
Chart 7. Children in Baltimore City and Baltimore and Prince George's counties were relatively more likely than other areas to receive public assistance in 1999
Ratio of Public Assistance Rates to Poverty Rates for Children in Maryland: 1989 and 1999
0
20
40
60
80
100
120
140
Mar
ylan
d
BA
LTIM
OR
E R
EG
ION
Ann
e A
rund
el
Bal
tim
ore
Cou
nty
Car
roll
Har
ford
How
ard
Bal
tim
ore
Cit
y
WA
SHIN
GT
ON
RE
GIO
N
Fred
eric
k
Mon
tgom
ery
Pri
nce
Geo
rge'
s
SOU
TH
ER
N M
D
Cal
vert
Cha
rles
St. M
ary
WE
STE
RN
MD
Alle
gany
Gar
rett
Was
hing
ton
UP
PE
R E
AST
ER
N S
HO
RE
Car
olin
e
Cec
il
Ken
t
Que
en A
nne'
s
Tal
bot
LOW
ER
EA
STE
RN
SH
OR
E
Dor
ches
ter
Som
erse
t
Wic
omic
o
Wor
cest
er
Ratio
1989 ratio 1999 ratio
Source: U.S. Census Bureau, 1990 Census (STF3, P117), Census 2000
(SF3, P87) and MD Department of Human Resources tabulations
prepared by the Jacob France Institute, U of Baltimore
29
Number of poor children The number of poor children in 1999 did not change appreciably from the 1989 numbers in most Maryland counties (Chart 8). The notable exceptions were the Baltimore and Washington regions, particularly in Baltimore City where the number of poor children decreased, and in Prince George’s County where the number increased. The number of poor children increased somewhat in most of the other counties of the Baltimore and Washington Regions. The changes were not statistically significant in most of the remaining counties.

30
Chart 8. Prince George's County had more poor children in 1999 than in 1989
while Baltimore City had fewer
Estimated Number of Poor Children in Maryland: 1989 and 1999
0
20,000
40,000
60,000
BA
LTIM
OR
E R
EGIO
N
Ann
e A
rund
el
Bal
tim
ore
Cou
nty
Car
roll
Har
ford
How
ard
Bal
tim
ore
Cit
y
WA
SHIN
GT
ON
REG
ION
Fred
eric
k
Mon
tgom
ery
Pri
nce
Geo
rge'
s
SOU
TH
ERN
MD
Cal
vert
Cha
rles
St. M
ary
WES
TER
N M
D
Alle
gany
Gar
rett
Was
hing
ton
UP
PE
R E
AST
ER
N S
HO
RE
Car
olin
e
Cec
il
Ken
t
Que
en A
nne'
s
Tal
bot
LOW
ER E
AST
ERN
SH
OR
E
Dor
ches
ter
Som
erse
t
Wic
omic
o
Wor
cest
er
1990 Census estimate of poor children Census 2000 estimate of poor children
Source: U.S. Census Bureau, SF3, Census 2000 (P87)
and 1990 Census (P117)
* Difference in 1989 and 1999 estimates of poor children are not statistically significant
* * * * * * * * * * * *
Significant increase in number of poor children
Numbe
Significant decrease in number of poor
*
31
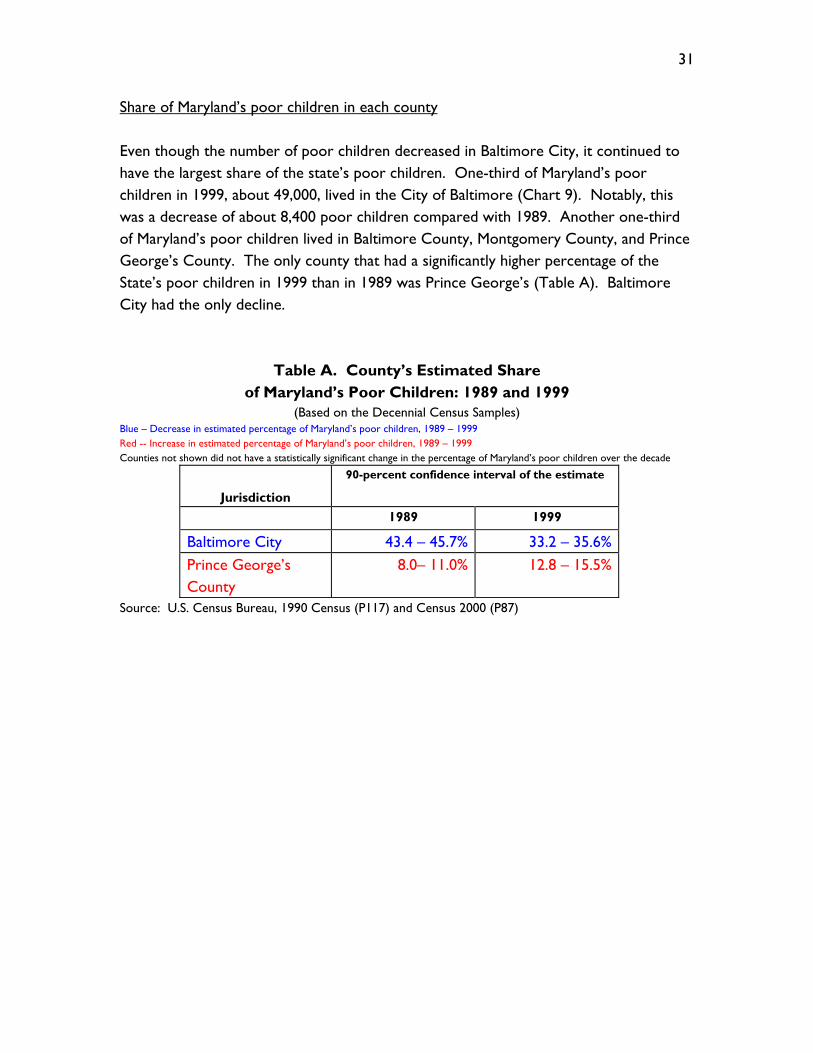
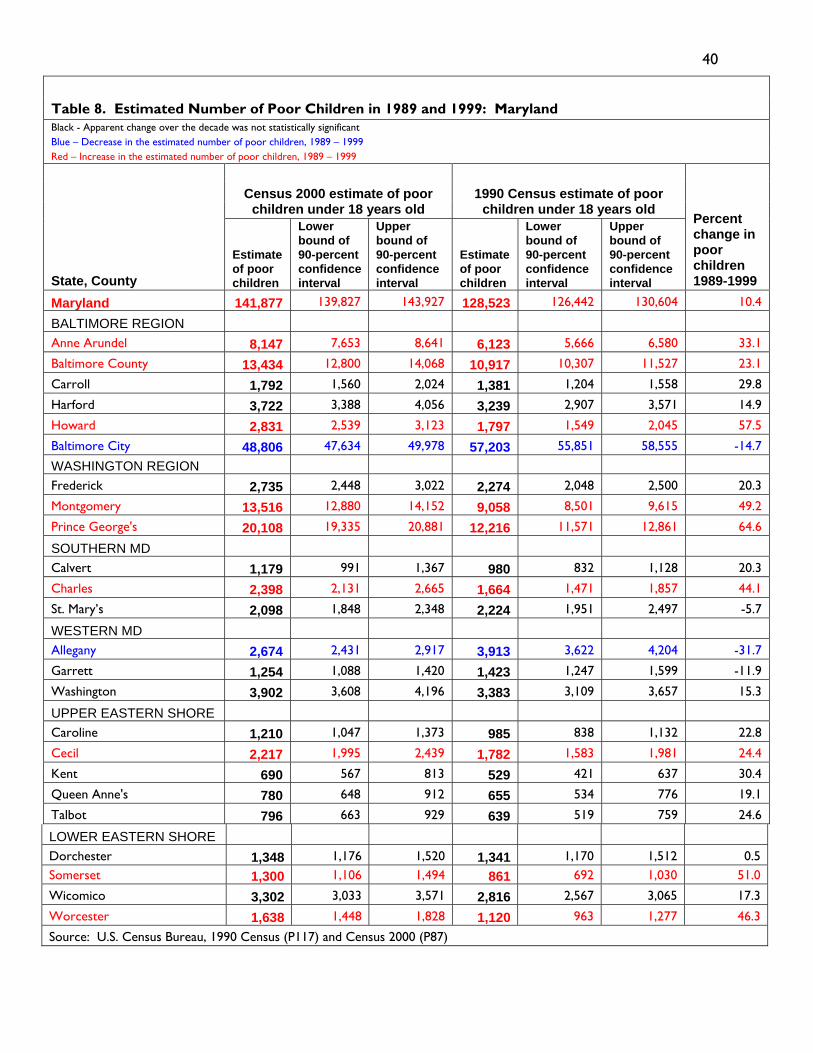
Share of Maryland’s poor children in each county Even though the number of poor children decreased in Baltimore City, it continued to have the largest share of the state’s poor children. One-third of Maryland’s poor children in 1999, about 49,000, lived in the City of Baltimore (Chart 9). Notably, this was a decrease of about 8,400 poor children compared with 1989. Another one-third of Maryland’s poor children lived in Baltimore County, Montgomery County, and Prince George’s County. The only county that had a significantly higher percentage of the State’s poor children in 1999 than in 1989 was Prince George’s (Table A). Baltimore City had the only decline.
Table A. County’s Estimated Share of Maryland’s Poor Children: 1989 and 1999
(Based on the Decennial Census Samples) Blue – Decrease in estimated percentage of Maryland’s poor children, 1989 – 1999 Red -- Increase in estimated percentage of Maryland’s poor children, 1989 – 1999 Counties not shown did not have a statistically significant change in the percentage of Maryland’s poor children over the decade
Jurisdiction
90-percent confidence interval of the estimate
1989 1999
Baltimore City 43.4 – 45.7% 33.2 – 35.6% Prince George’s County
8.0– 11.0% 12.8 – 15.5%
Source: U.S. Census Bureau, 1990 Census (P117) and Census 2000 (P87)

32
Chart 9. Baltimore City had the largest share of Maryland's poor children County's Share of Maryland's Poor Children: 1989 and 1999
0
10
20
30
40
50
BA
LTIM
OR
E R
EG
ION
Ann
e A
rund
el
Bal
tim
ore
Cou
nty
Car
roll
Har
ford
How
ard
Bal
tim
ore
Cit
y
WA
SHIN
GT
ON
RE
GIO
N
Fred
eric
k
Mon
tgom
ery
Pri
nce
Geo
rge'
s
SOU
TH
ER
N M
D
Cal
vert
Cha
rles
St. M
ary
WE
STE
RN
MD
Alle
gany
Gar
rett
Was
hing
ton
UP
PE
R E
AST
ER
N S
HO
RE
Car
olin
e
Cec
il
Ken
t
Que
en A
nne'
s
Tal
bot
LOW
ER
EA
STE
RN
SH
OR
E
Dor
ches
ter
Som
erse
t
Wic
omic
o
Wor
cest
er
Percent share
Percentage of Maryalnd's poor children in 1989
Percentage of Maryland's poor children in 1999
*Difference in percentage of poor children between 1989 and 1999 is not statistically significant
* *
* * * * * * * * * * * * * * *
Source: U.S. Census Bureau, SF3,
1990 Census (P119) and Census 2000 (P87)
* * *
*

33
Changes in public assistance, 1989 – 1999 With welfare reform, there came dramatic changes in the number of recipients of public assistance in every jurisdiction in Maryland. The 26-percent change in Prince George’s county was less than in other counties (Chart 10). Kent and Allegany counties decreased public assistance cases for children by about 80 percent. But, as shown in Chart 11, the number of child recipients is relatively small for most counties and for these, it would be misleading to make too much of apparently dramatic percentage changes. Of Maryland’s nearly 62,000 children receiving public assistance from the Temporary Cash Assistance Program (TCA) in 1999 (Table 6), Baltimore City had nearly 37,00 such children. The next highest number of cases was in Prince George’s County with about 8,000 children. These were also the two jurisdictions with the highest number of children receiving public assistance in 1989 (Table 7). Baltimore City had nearly 6 in 10 of Maryland’s child recipients of public assistance in both 1989 and 1999 (Chart 12). Prince George’s and Baltimore counties together accounted for another 2 in 10 child recipient cases in 1999 and nearly that same share in 1989.

34
Chart 10. Every jurisdiction has reduced public assistance caseloads for children since 1989Percent Change in Children Receiving Public Assistance in Maryland: 1989 - 1999
-90
-80
-70
-60
-50
-40
-30
-20
-10
0 Maryland
Allegany
Anne A
rundel
Baltim
ore County
Calvert
Caroline
Carroll
Cecil
Charles
Dorchester
Frederick
Garrett
Harford
How
ard
Kent
Montgom
ery
Prince G
eorge's
Queen A
nne's
St. Mary's
Somerset
Talbot
Washington
Wicom
ico
Worcester
Baltim
ore City
Source: Maryland Department of Humn Resources, tabulations prepared
by the Jacob France Institute, University of Baltimore
Percent change
NOTE: Also see Chart 11. The number of cases is relatively small
for most counties. For these, it would be misleading to make too
much of apparently dramatic percentage changes.

35
Chart 11. Baltimore City has more child recipients of public assistance than other jurisdictions Number of Child Recipients of AFDC in CY1989 and of TCA in CY1999: Maryland
0
10,000
20,000
30,000
40,000
50,000
60,000
70,000
Alle
gany
Ann
e A
rund
el
Bal
tim
ore
Cou
nty
Cal
vert
Car
olin
e
Car
roll
Cec
il
Cha
rles
Dor
ches
ter
Fred
eric
k
Gar
rett
Har
ford
How
ard
Ken
t
Mon
tgom
ery
Pri
nce
Geo
rge'
s
Que
en A
nne'
s
St. M
ary'
s
Som
erse
t
Tal
bot
Was
hing
ton
Wic
omic
o
Wor
cest
er
Bal
tim
ore
Cit
y
Number of child AFDC recipients in CY1989
Number of child TCA recipients in CY1999
Source: MD Department of Human Resources, FIA, tabultions prepared by
Jacob France Institute, U of Baltimore
Number

36
Table 6. Census 2000 Estimates of Total Children, Poor Children in CY1999, and TCA Child Recipients in CY1999: Maryland
Census 2000 estimate of children under 18 years old
State, County
Total estimate, children under 181
Estimate of poor children, CY19992
Lower bound of 90-percent confidence interval
Upper bound of 90-percent confidence interval
Counts of Children Under 18 Receiving TCA, Monthly average, CY 19993
Maryland 1,353,419 141,877 139,827 143,927 61,796Allegany 15,348 2,674 2,431 2,917 424Anne Arundel 123,209 8,147 7,653 8,641 2,028Baltimore County 178,290 13,434 12,800 14,068 5,315Calvert 22,057 1,179 991 1,367 281Caroline 7,992 1,210 1,047 1,373 198Carroll 41,784 1,792 1,560 2,024 376Cecil 23,792 2,217 1,995 2,439 394Charles 34,661 2,398 2,131 2,665 725Dorchester 7,151 1,348 1,176 1,520 462Frederick 53,764 2,735 2,448 3,022 531Garrett 7,497 1,254 1,088 1,420 199Harford 60,766 3,722 3,388 4,056 909Howard 69,299 2,831 2,539 3,123 389Kent 4,004 690 567 813 50Montgomery 220,580 13,516 12,880 14,152 2,016Prince George's 214,522 20,108 19,335 20,881 8,010Queen Anne's 10,258 780 648 912 130St. Mary's 24,064 2,098 1,848 2,348 418Somerset 4,572 1,300 1,106 1,494 189Talbot 7,307 796 663 929 166Washington 30,918 3,902 3,608 4,196 592Wicomico 20,932 3,302 3,033 3,571 1,027Worcester 9,552 1,638 1,448 1,828 242Baltimore City 161,100 48,806 47,634 49,978 36,725Footnotes for Table 6
1Source: U.S. Census Bureau, Census 2000, Summary File 3 (sample data),Table P8. We used sample estimates of the number of children to be consistent with the poverty sample estimates. Complete counts are shown in SF1, Table P12. For Maryland, the complete count of children under 18 years old was 1,356,172. Age refers to age on April 1, 2000.
2Source: U.S. Census Bureau, Census 2000, Summary File 3 (sample data),Table P87 (see: http://factfinder.census.gov/). Poverty status refers to total family income in 1999 and family status on April 1, 2000.
3Source: The Maryland Department of Human Resources, Family Investment Administration, Monthly Statistical Reports, June 1999 and June 2000.
37
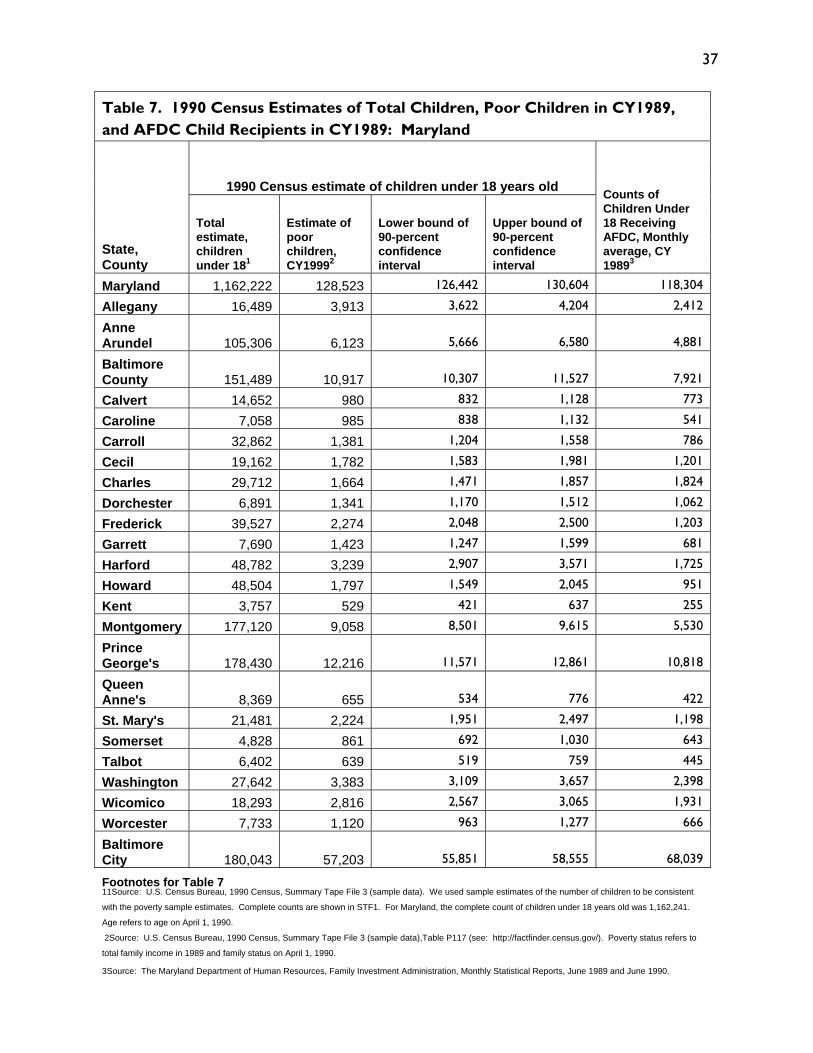
Table 7. 1990 Census Estimates of Total Children, Poor Children in CY1989, and AFDC Child Recipients in CY1989: Maryland
1990 Census estimate of children under 18 years old
State, County
Total estimate, children under 181
Estimate of poor children, CY19992
Lower bound of 90-percent confidence interval
Upper bound of 90-percent confidence interval
Counts of Children Under 18 Receiving AFDC, Monthly average, CY 19893
Maryland 1,162,222 128,523 126,442 130,604 118,304
Allegany 16,489 3,913 3,622 4,204 2,412
Anne Arundel 105,306 6,123 5,666 6,580 4,881
Baltimore County 151,489 10,917 10,307 11,527 7,921
Calvert 14,652 980 832 1,128 773
Caroline 7,058 985 838 1,132 541
Carroll 32,862 1,381 1,204 1,558 786
Cecil 19,162 1,782 1,583 1,981 1,201
Charles 29,712 1,664 1,471 1,857 1,824
Dorchester 6,891 1,341 1,170 1,512 1,062
Frederick 39,527 2,274 2,048 2,500 1,203
Garrett 7,690 1,423 1,247 1,599 681
Harford 48,782 3,239 2,907 3,571 1,725
Howard 48,504 1,797 1,549 2,045 951
Kent 3,757 529 421 637 255
Montgomery 177,120 9,058 8,501 9,615 5,530
Prince George's 178,430 12,216 11,571 12,861 10,818
Queen Anne's 8,369 655 534 776 422
St. Mary's 21,481 2,224 1,951 2,497 1,198
Somerset 4,828 861 692 1,030 643
Talbot 6,402 639 519 759 445
Washington 27,642 3,383 3,109 3,657 2,398
Wicomico 18,293 2,816 2,567 3,065 1,931
Worcester 7,733 1,120 963 1,277 666
Baltimore City 180,043 57,203 55,851 58,555 68,039
Footnotes for Table 7 11Source: U.S. Census Bureau, 1990 Census, Summary Tape File 3 (sample data). We used sample estimates of the number of children to be consistent
with the poverty sample estimates. Complete counts are shown in STF1. For Maryland, the complete count of children under 18 years old was 1,162,241.
Age refers to age on April 1, 1990. 2Source: U.S. Census Bureau, 1990 Census, Summary Tape File 3 (sample data),Table P117 (see: http://factfinder.census.gov/). Poverty status refers to
total family income in 1989 and family status on April 1, 1990. 3Source: The Maryland Department of Human Resources, Family Investment Administration, Monthly Statistical Reports, June 1989 and June 1990.

38
Chart 12. Baltimore City had the largest share of Maryland's child recipients of public assistance County's Share of Maryland's Child Recipients of AFDC in CY1989 and of TCA in CY1999
0
10
20
30
40
50
60
Alle
gany
Ann
e A
rund
el
Bal
tim
ore
Cou
nty
Cal
vert
Car
olin
e
Car
roll
Cec
il
Cha
rles
Dor
ches
ter
Fred
eric
k
Gar
rett
Har
ford
How
ard
Ken
t
Mon
tgom
ery
Pri
nce
Geo
rge'
s
Que
en A
nne'
s
St. M
ary'
s
Som
erse
t
Tal
bot
Was
hing
ton
Wic
omic
o
Wor
cest
er
Bal
tim
ore
Cit
y
Percentage of Maryland's child AFDC
recipients in CY1989Percentage of Maryland's child TCA
recipients in CY1999
Source: MD Dept. of Human Resources, FIA, tabultions prepared by Jacob
France Institute, University of Baltimore
Percent

39
Number and share of poor children and public assistance child recipients Of Maryland’s nearly 1.4 million children, an estimated 142,000 children were poor in 1999.11 This was a net increase of roughly 13,000 poor children from the 1989 estimate (Table 8). Maryland added 194,000 children to its population in that period. From 1989 to 1999, changes in public assistance programs greatly reduced the number of children receiving assistance. An average of about 61,800 children a month received Temporary Cash Assistance (TCA) in 1999 compared with about 118,300 in 1989 (Tables 6 and 7).
11 Decennial questions about income refer to the previous calendar year (1999 for Census 2000, 1989 for the 1990 Census).
40
LOWER EASTERN SHORE
Dorchester 1,348 1,176 1,520 1,341 1,170 1,512 0.5 Somerset 1,300 1,106 1,494 861 692 1,030 51.0
Wicomico 3,302 3,033 3,571 2,816 2,567 3,065 17.3
Worcester 1,638 1,448 1,828 1,120 963 1,277 46.3
Source: U.S. Census Bureau, 1990 Census (P117) and Census 2000 (P87)
Table 8. Estimated Number of Poor Children in 1989 and 1999: Maryland Black - Apparent change over the decade was not statistically significant Blue – Decrease in the estimated number of poor children, 1989 – 1999 Red – Increase in the estimated number of poor children, 1989 – 1999
Census 2000 estimate of poor children under 18 years old
1990 Census estimate of poor children under 18 years old
State, County
Estimate of poor children
Lower bound of 90-percent confidence interval
Upper bound of 90-percent confidence interval
Estimate of poor children
Lower bound of 90-percent confidence interval
Upper bound of 90-percent confidence interval
Percent change in poor children 1989-1999
Maryland 141,877 139,827 143,927 128,523 126,442 130,604 10.4
BALTIMORE REGION
Anne Arundel 8,147 7,653 8,641 6,123 5,666 6,580 33.1
Baltimore County 13,434 12,800 14,068 10,917 10,307 11,527 23.1
Carroll 1,792 1,560 2,024 1,381 1,204 1,558 29.8
Harford 3,722 3,388 4,056 3,239 2,907 3,571 14.9
Howard 2,831 2,539 3,123 1,797 1,549 2,045 57.5
Baltimore City 48,806 47,634 49,978 57,203 55,851 58,555 -14.7
WASHINGTON REGION
Frederick 2,735 2,448 3,022 2,274 2,048 2,500 20.3
Montgomery 13,516 12,880 14,152 9,058 8,501 9,615 49.2
Prince George's 20,108 19,335 20,881 12,216 11,571 12,861 64.6
SOUTHERN MD
Calvert 1,179 991 1,367 980 832 1,128 20.3
Charles 2,398 2,131 2,665 1,664 1,471 1,857 44.1
St. Mary’s 2,098 1,848 2,348 2,224 1,951 2,497 -5.7
WESTERN MD
Allegany 2,674 2,431 2,917 3,913 3,622 4,204 -31.7
Garrett 1,254 1,088 1,420 1,423 1,247 1,599 -11.9
Washington 3,902 3,608 4,196 3,383 3,109 3,657 15.3
UPPER EASTERN SHORE
Caroline 1,210 1,047 1,373 985 838 1,132 22.8
Cecil 2,217 1,995 2,439 1,782 1,583 1,981 24.4
Kent 690 567 813 529 421 637 30.4
Queen Anne's 780 648 912 655 534 776 19.1
Talbot 796 663 929 639 519 759 24.6

41
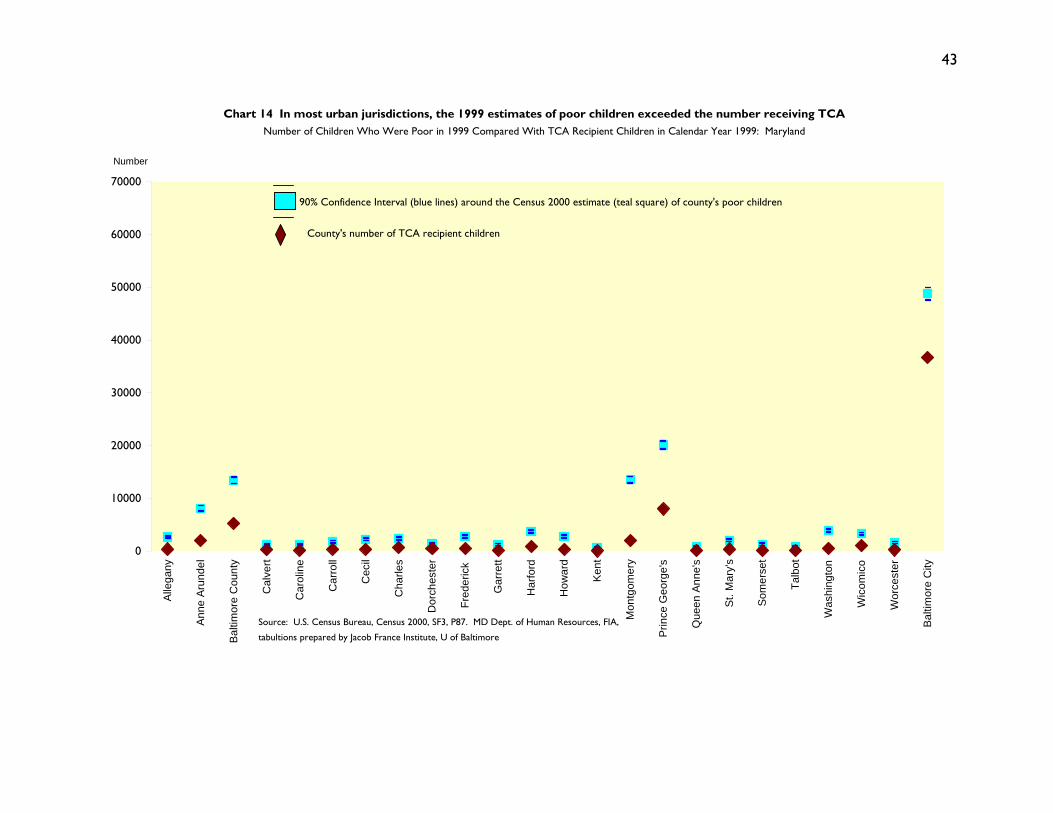
The number of poor children was about the same as the number that received public assistance in 1989 (Chart 13). This was also the case in 1999 in all but the most urban jurisdictions of Baltimore City, and Prince George’s, Montgomery, Baltimore, and Anne Arundel counties (Chart 14) where the estimates of poor children were higher than the numbers receiving TCA. In 1999, in Baltimore City, the census estimated that there were about 49,000 poor children; according to program records, just under an average of 37,000 children a month received TCA (Table 6). There was a disparity in 1989 (Table 7) as well, but in the opposite direction (some of this may have been the result of the undercount in the 1990 census).12
12 Taeuber, Staveley, and Larson, op.cit.

42
Chart 13. Except in Baltimore City, the number of children receiving AFDC was similar to the estimate of poor children in 1989
Number of Children Who Were Poor in 1989 Compared With Monthly Average AFDC Recipients in Calendar Year 1989: Maryland
0
10,000
20,000
30,000
40,000
50,000
60,000
70,000A
llega
ny
Ann
e A
rund
el
Bal
tim
ore
Cou
nty
Cal
vert
Car
olin
e
Car
roll
Cec
il
Cha
rles
Dor
ches
ter
Fred
eric
k
Gar
rett
Har
ford
How
ard
Ken
t
Mon
tgom
ery
Pri
nce
Geo
rge'
s
Que
en A
nne'
s
St. M
ary'
s
Som
erse
t
Tal
bot
Was
hing
ton
Wic
omic
o
Wor
cest
er
Bal
tim
ore
Cit
y
Number
90% Confidence Interval (lines) around the 1990 Census estimate (orange square) of county's poor children
County's number of AFDC recipient children
Source: U.S. Census Bureau, 1990 Census SF3, P119. MD Dept. of Human Resources, FIA,
tabultions prepared by Jacob France Institute, U of Baltimore
43
Chart 14 In most urban jurisdictions, the 1999 estimates of poor children exceeded the number receiving TCA Number of Children Who Were Poor in 1999 Compared With TCA Recipient Children in Calendar Year 1999: Maryland
0
10000
20000
30000
40000
50000
60000
70000A
llega
ny
Ann
e Ar
unde
l
Bal
timor
e C
ount
y
Cal
vert
Car
olin
e
Car
roll
Cec
il
Cha
rles
Dor
ches
ter
Fred
eric
k
Gar
rett
Har
ford
How
ard
Ken
t
Mon
tgom
ery
Prin
ce G
eorg
e's
Que
en A
nne'
s
St. M
ary'
s
Som
erse
t
Talb
ot
Was
hing
ton
Wic
omic
o
Wor
cest
er
Balti
mor
e C
ity
Number
90% Confidence Interval (blue lines) around the Census 2000 estimate (teal square) of county's poor children
County's number of TCA recipient children
Source: U.S. Census Bureau, Census 2000, SF3, P87. MD Dept. of Human Resources, FIA,
tabultions prepared by Jacob France Institute, U of Baltimore

44
With the exception of Baltimore City, in both 1999 and 1989, there was little difference between each county’s share of the State’s poor children and the share of child recipients of public assistance (Charts 15 and 16). In Baltimore City, the share of child recipients of public assistance was higher than the share of poor children in both periods.

45
Chart 15. Except for Baltimore City, there was little difference in each county's share of Maryland's poor children and TCA recipients
County's Share of Maryland's Children Who Were Poor Compared With Share of TCA Recipient Children in 1999
0
10
20
30
40
50
60
Alle
gany
Ann
e A
rund
el
Bal
timor
e C
ount
y
Cal
vert
Car
olin
e
Car
roll
Cec
il
Cha
rles
Dor
ches
ter
Fred
eric
k
Gar
rett
Har
ford
How
ard
Ken
t
Mon
tgom
ery
Prin
ce G
eorg
e's
Que
en A
nne'
s
St.
Mar
y's
Som
erse
t
Talb
ot
Was
hing
ton
Wic
omic
o
Wor
cest
er
Bal
timor
e C
ity
County's percentage of State
90% Confidence Interval (blue lines) around the Census 2000 estimate (teal square) of county's percentage of
Maryland's poor children
County's percentage of Maryland's TCA child recipients
Source: U.S. Census Bureau, Census 2000, SF3, P87. MD Dept. of Human Resources, FIA,
tabultions prepared by Jacob France Institute, U of Baltimore

46
Chart 16. Except for Baltimore City, there was little difference in each county's share of Maryland's poor children and AFDC recipients
County's Share of Maryland's Children Who Were Poor Compared With Monthly Average AFDC Recipients in CY 1989
0
10
20
30
40
50
60
Alle
gany
Ann
e A
rund
el
Bal
tim
ore
Cou
nty
Cal
vert
Car
olin
e
Car
roll
Cec
il
Cha
rles
Dor
ches
ter
Fred
eric
k
Gar
rett
Har
ford
How
ard
Ken
t
Mon
tgom
ery
Pri
nce
Geo
rge'
s
Que
en A
nne'
s
St. M
ary'
s
Som
erse
t
Tal
bot
Was
hing
ton
Wic
omic
o
Wor
cest
er
Bal
tim
ore
Cit
y
County's percentage
of state
90% Confidence Interval (lines) around the 1990 Census estimate (square) of county's percentage of Maryland's poor
children
County's percentage of Maryland's AFDC child recipients
Source: U.S. Census Bureau, 1990 Census SF3, P117. MD Dept. of Human Resources,
FIA, tabultions prepared by Jacob France Institute, U of Baltimore

47
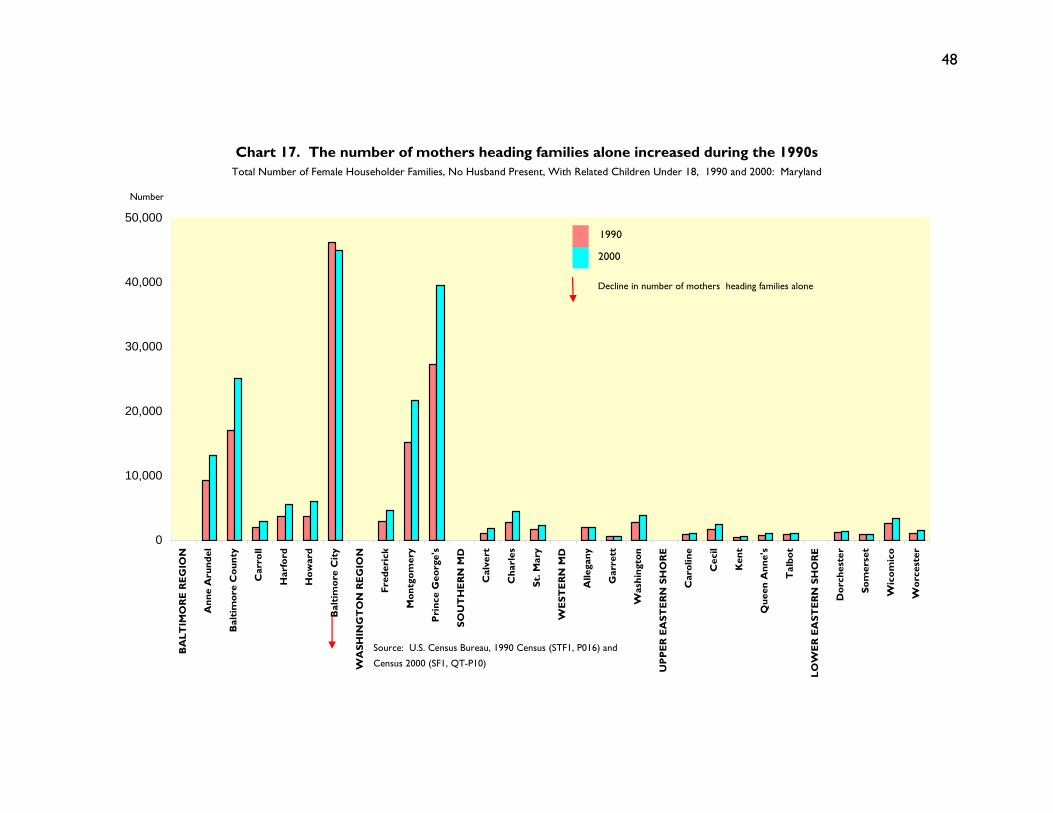
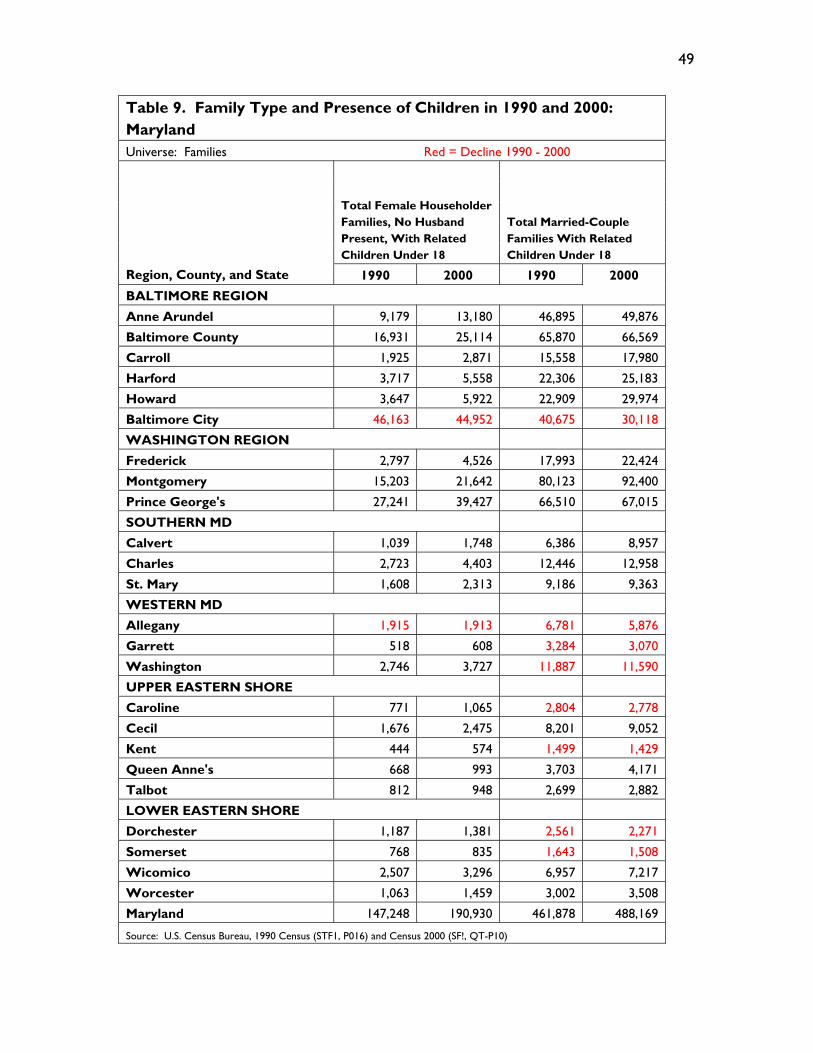
Families Headed by Mothers Alone Total Families With Related Children Under 18 Headed by Mothers Alone The Census 2000 in Maryland counted about 191,000 families headed by mothers alone with related children under 18 years old compared with more than 147,000 in 1990. More than half of such families lived in Baltimore City (23.5 percent), Prince George’s County (20.6 percent), and Montgomery County (11.3 percent) in 2000. The number of these families increased or stayed about the same in nearly every jurisdiction from 1990 to 2000. The increase was most noticeable in Prince George’s, Baltimore, and Anne Arundel counties (Chart 17 and Table 9).
48
Chart 17. The number of mothers heading families alone increased during the 1990sTotal Number of Female Householder Families, No Husband Present, With Related Children Under 18, 1990 and 2000: Maryland
0
10,000
20,000
30,000
40,000
50,000
BA
LTIM
OR
E R
EG
ION
Ann
e A
rund
el
Bal
tim
ore
Cou
nty
Car
roll
Har
ford
How
ard
Bal
tim
ore
Cit
y
WA
SHIN
GT
ON
RE
GIO
N
Fred
eric
k
Mon
tgom
ery
Pri
nce
Geo
rge'
s
SOU
TH
ER
N M
D
Cal
vert
Cha
rles
St. M
ary
WE
STE
RN
MD
Alle
gany
Gar
rett
Was
hing
ton
UP
PE
R E
AST
ER
N S
HO
RE
Car
olin
e
Cec
il
Ken
t
Que
en A
nne'
s
Tal
bot
LOW
ER
EA
STE
RN
SH
OR
E
Dor
ches
ter
Som
erse
t
Wic
omic
o
Wor
cest
er
Number
1990
2000
Decline in number of mothers heading families alone
Source: U.S. Census Bureau, 1990 Census (STF1, P016) and
Census 2000 (SF1, QT-P10)
49
Table 9. Family Type and Presence of Children in 1990 and 2000: Maryland Universe: Families Red = Decline 1990 - 2000
Total Female Householder Families, No Husband Present, With Related Children Under 18
Total Married-Couple Families With Related Children Under 18
Region, County, and State 1990 2000 1990 2000 BALTIMORE REGION
Anne Arundel 9,179 13,180 46,895 49,876
Baltimore County 16,931 25,114 65,870 66,569
Carroll 1,925 2,871 15,558 17,980
Harford 3,717 5,558 22,306 25,183
Howard 3,647 5,922 22,909 29,974
Baltimore City 46,163 44,952 40,675 30,118
WASHINGTON REGION
Frederick 2,797 4,526 17,993 22,424
Montgomery 15,203 21,642 80,123 92,400
Prince George's 27,241 39,427 66,510 67,015
SOUTHERN MD
Calvert 1,039 1,748 6,386 8,957
Charles 2,723 4,403 12,446 12,958
St. Mary 1,608 2,313 9,186 9,363
WESTERN MD
Allegany 1,915 1,913 6,781 5,876
Garrett 518 608 3,284 3,070
Washington 2,746 3,727 11,887 11,590
UPPER EASTERN SHORE
Caroline 771 1,065 2,804 2,778
Cecil 1,676 2,475 8,201 9,052
Kent 444 574 1,499 1,429
Queen Anne's 668 993 3,703 4,171
Talbot 812 948 2,699 2,882
LOWER EASTERN SHORE
Dorchester 1,187 1,381 2,561 2,271
Somerset 768 835 1,643 1,508
Wicomico 2,507 3,296 6,957 7,217
Worcester 1,063 1,459 3,002 3,508
Maryland 147,248 190,930 461,878 488,169
Source: U.S. Census Bureau, 1990 Census (STF1, P016) and Census 2000 (SF!, QT-P10)
50
Poverty and Receipt of Public Assistance by Families With Related Children Headed by Mothers Alone Here we report on changes from 1989 to 1999 in the poverty status and receipt of public assistance among families with related children headed by mothers alone. Changes in number of families headed by mothers alone who were poor compared with such families receiving public assistance About the same number of families headed by mothers alone with related children were poor in 1989 and 1999 in Maryland (about 42,200 in 1989 and 43,800 in 1999). In most counties, the apparent differences between 1989 and 1999 were not statistically significant (Chart 18, Tables 10 and 11). It was mostly in the Baltimore and Washington regions and in Southern Maryland where there were statistically significant increases in the number of such families. Baltimore City had fewer such families, however, with about 21,200 families in 1989 and about 17,200 in 1999.

51
Chart 18. Baltimore City had fewer poor families headed by mothers alone in 1999 than in
1989
Estimated Number of Poor Female-Headed Families, No Husband Present, With Related
Children in Maryland: 1989 and 1999
0
5,000
10,000
15,000
20,000
25,000
BA
LTIM
OR
E R
EG
ION
Ann
e A
rund
el
Bal
tim
ore
Cou
nty
Car
roll
Har
ford
How
ard
Bal
tim
ore
Cit
y
WA
SHIN
GT
ON
RE
GIO
N
Fred
eric
k
Mon
tgom
ery
Pri
nce
Geo
rge'
s
SOU
TH
ER
N M
D
Cal
vert
Cha
rles
St. M
ary
WE
STE
RN
MD
Alle
gany
Gar
rett
Was
hing
ton
UP
PE
R E
AST
ER
N S
HO
RE
Car
olin
e
Cec
il
Ken
t
Que
en A
nne'
s
Tal
bot
LOW
ER
EA
STE
RN
SH
OR
E
Dor
ches
ter
Som
erse
t
Wic
omic
o
Wor
cest
er
1990 Census estimate Census 2000 estimate
Source: U.S. Census Bureau, SF3, Census 2000
(SF3, P90) and 1990 Census (STF3, P123)
*Difference in 1989 and 1999 estimates are not statistically significant
* * * ** *
Significant increase in number
Number
Significant decrease in number
* * * * **

52
Table 10. Census 2000 Estimates of Female-Headed Families, No Husband Present, With Related Children Under 18 Who Were Poor in 1999 Compared With TCA Caseloads in 1999: Maryland
Census 2000 estimates of female-headed families with related children, poor in 1999
State, Region, and Counties Total
Lower bound of 90-percent confidence interval
Upper bound of 90-percent confidence interval
Female-headed families with related children who received TCA in CY1999
BALTIMORE REGION
Anne Arundel 2,329 2,100 2,558 1,109Baltimore County 4,432 4,117 4,747 3,425Carroll 530 421 639 305Harford 1,158 997 1,319 541Howard 791 657 925 281Baltimore City 17,230 16,640 17,820 20,792WASHINGTON REGION
Frederick 776 644 908 370Montgomery 3,204 2,935 3,473 1,219Prince George's 5,573 5,221 5,925 4,301SOUTHERN MD
Calvert 342 254 430 214Charles 754 624 884 368St. Mary 528 419 637 125WESTERN MD
Allegany 670 567 773 281Garrett 233 172 294 166Washington 1,174 1,038 1,310 450UPPER EASTERN SHORE
Caroline 352 278 426 131Cecil 633 533 733 322Kent 229 169 289 26Queen Anne's 209 151 267 95Talbot 244 182 306 98LOWER EASTERN SHORE
Dorchester 448 365 531 310Somerset 341 255 427 246Wicomico 1,079 949 1,209 700Worcester 495 407 583 204Maryland 43,754 42,770 44,738 36,079Source: U.S. Census Bureau, Census 2000, SF3, P87. MD Dept. of Human Resources, FIA, tabulations prepared by Jacob France Institute, University of Baltimore

53 Table 11. 1990 Census Estimates of Female-Headed Families, No Husband Present, With Related Children Under 18 Who Were Poor in 1989 Compared With AFDC Caseloads in 1989: Maryland
1990 Census estimates of female-headed families with related children, poor in 1989
Region, Counties, and State Total
Lower bound of 90-percent confidence interval
Upper bound of 90-percent confidence interval
Monthly Average AFDC Basic Cases in Calendar Year
1989 BALTIMORE REGION
Anne Arundel 1,717 1,553 1,881 2,666
Baltimore County 3,719 3,481 3,957 4,615
Carroll 370 307 433 466
Harford 1,005 888 1,122 977
Howard 543 448 638 524
Baltimore City 21,172 20,698 21,646 35,680
WASHINGTON REGION
Frederick 626 546 706 674
Montgomery 2,567 2,363 2,771 2,922
Prince George's 3,525 3,280 3,770 5,919
SOUTHERN MD
Calvert 225 176 274 403
Charles 469 398 540 931
St. Mary 427 350 504 626
WESTERN MD
Allegany 1,092 1,013 1,171 1,198
Garrett 248 208 288 317
Washington 1,120 1,027 1,213 1,308
UPPER EASTERN SHORE
Caroline 312 261 363 309
Cecil 450 384 516 659
Kent 134 99 169 145
Queen Anne's 157 118 196 248
Talbot 266 217 315 258
LOWER EASTERN SHORE
Dorchester 477 415 539 583
Somerset 314 255 373 346
Wicomico 889 802 976 974
Worcester 346 291 401 358
Maryland 42,170 41,407 42,933 63,106
Source: U.S. Census Bureau, 1990 Census, SF3, P123. MD Dept. of Human Resources, FIA, tabulations prepared by Jacob France Institute, University of Baltimore

54
Maryland reduced public assistance to mother-headed families by 43 percent (a monthly average of about 63,100 such families in 1989 compared with about 36,100 in 1999). Baltimore City had 42 percent fewer cases in 1999. The percentage changes in public assistance cases for such families are shown for each jurisdiction in Chart 19 and in Table 12. The number of cases is relatively small for most counties. For these, it would be misleading to make too much of apparently dramatic percentage changes.

55
Chart 19. Maryland reduced public assistance to mother-headed households by 43 percent from 1989-1999Percent Change in Public Assistance Cases for Female-Headed Households With Related Children, No Husband Present, Maryland: 1989 - 1999
-90
-80
-70
-60
-50
-40
-30
-20
-10
0 BA
LTIM
OR
E R
EG
ION
Anne A
rundel
Baltim
ore County
Carroll
Harford
How
ard
Baltim
ore City
WA
SHIN
GT
ON
RE
GIO
N
Frederick
Montgom
ery
Prince G
eorge's
SOU
TH
ER
N M
D
Calvert
Charles
St. Mary
WE
STE
RN
MD
Allegany
Garrett
Washington
UP
PE
R E
AST
ER
N SH
OR
E
Caroline
Cecil
Kent
Queen A
nne's
Talbot
LOW
ER
EA
STE
RN
SHO
RE
Dorchester
Somerset
Wicom
ico
Worcester
MA
RY
LAN
D
Source: Maryland Department of Humn Resources, tabulations prepared
by the Jacob France Institute, University of Baltimore
Percent change
NOTE: Also see Tables 10 and 11. The number of cases is relatively
small for most counties. For these, it would be misleading to make
too much of apparently dramatic percentage changes.

56
Table 12. Percentage Change in Public Assistance for Female-Headed Families, No Husband Present, With Related Children Under 18 From 1989 to 1999: Maryland
Region, Counties, and State
Public assistanc
e received
in CY1989
Public assistanc
e received
in CY1999
Percentage change, 1989
- 1999 BALTIMORE REGION
Anne Arundel 2,666 1,109 -58.4
Baltimore County 4,615 3,425 -25.8
Carroll 466 305 -34.5
Harford 977 541 -44.6
Howard 524 281 -46.4
Baltimore City 35,680 20,792 -41.7
WASHINGTON REGION
Frederick 674 370 -45.1
Montgomery 2,922 1,219 -58.3
Prince George's 5,919 4,301 -27.3
SOUTHERN MD
Calvert 403 214 -46.9
Charles 931 368 -60.5
St. Mary 626 125 -80.0
WESTERN MD
Allegany 1,198 281 -76.5
Garrett 317 166 -47.6
Washington 1,308 450 -65.6
UPPER EASTERN SHORE
Caroline 309 131 -57.6
Cecil 659 322 -51.1
Kent 145 26 -82.1
Queen Anne's 248 95 -61.7
Talbot 258 98 -62.0
LOWER EASTERN SHORE
Dorchester 583 310 -46.8
Somerset 346 246 -28.9
Wicomico 974 700 -28.1
Worcester 358 204 -43.0
Maryland 63,106 36,079 -42.8 Source: The Maryland Department of Human Resources, Family Investment Administration, tabulations prepared by the Jacob France Institute, University of Baltimore.

57
The number of poor families of this type, and the number receiving public assistance, was about the same in most counties in 1989 and 1999 (Charts 20 and 21). Where there was some difference in 1999, it was in the urban counties of Anne Arundel, Baltimore, Montgomery, and Prince George’s. In those counties, the estimated number of poor families was slightly higher than the number receiving public assistance. In 1989, in Prince George’s County and Baltimore City, and in 1999, in Baltimore City, the official statistics make it appear that more families received public assistance than there were poor families. Our previous study of the 1989 statistics13 showed, however, that the difference was mostly due to undercounting poor households in the 1990 Census. One might surmise the same is true of Census 2000 for Baltimore City but, as indicated earlier in this paper, evaluations of the Census 2000 provided conflicting information at the national level and unreliable conclusions for states and counties. The most we can say is that the gap between public assistance and poverty levels of poor families was much less in 1999 than in 1989.
13 Ibid.

58
Chart 20. The number of poor families headed by mothers was about the same as the number receiving TCA Number of Female-Headed Families With Related Children Who Were Poor Compared With Number Who Received TCA in CY1999: Maryland
0
10,000
20,000
30,000
40,000
BALT
IMO
RE R
EGIO
N
Ann
e A
rund
el
Balti
mor
e C
ount
y
Car
roll
Har
ford
How
ard
Balti
mor
e C
ity
WA
SHIN
GTO
N R
EGIO
N
Fred
eric
k
Mon
tgom
ery
Prin
ce G
eorg
e's
SOU
THER
N M
D
Cal
vert
Cha
rles
St. M
ary
WES
TERN
MD
Alle
gany
Gar
rett
Was
hing
ton
UPP
ER E
AST
ERN
SH
ORE
Car
olin
e
Cec
il
Ken
t
Que
en A
nne'
s
Talb
ot
LOW
ER E
AST
ERN
SH
ORE
Dor
ches
ter
Som
erse
t
Wic
omic
o
Wor
cest
er
Number
90% Confidence Interval (lines) around the Census 2000 estimate (square) of poor female-headed families, no husband present, with related
children
Number of TCA recipient female-headed families, no husband present, with related children
Source: U.S. Census Bureau, Census 2000, SF3, P90. MD Dept. of
Human Resources, FIA, tabulations prepared by Jacob France Institute,
University of Baltimore
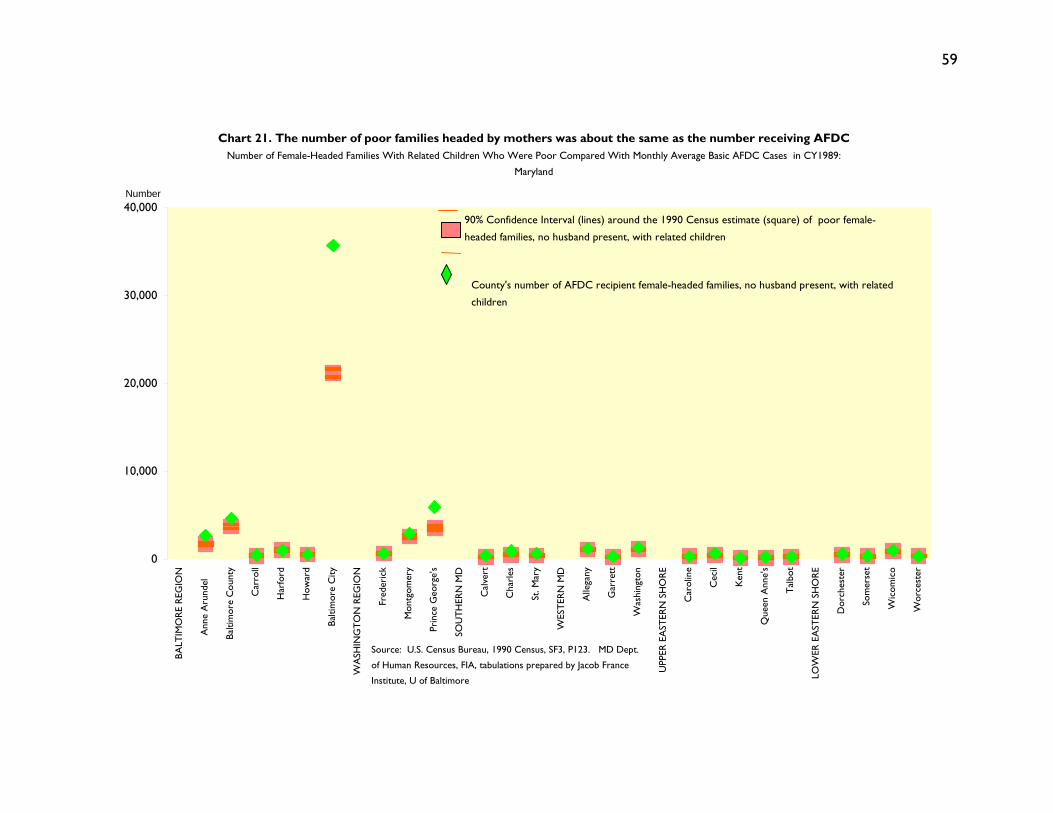
59
Chart 21. The number of poor families headed by mothers was about the same as the number receiving AFDC Number of Female-Headed Families With Related Children Who Were Poor Compared With Monthly Average Basic AFDC Cases in CY1989:
Maryland
0
10,000
20,000
30,000
40,000
BALT
IMO
RE R
EGIO
N
Ann
e A
rund
el
Balti
mor
e C
ount
y
Car
roll
Har
ford
How
ard
Balti
mor
e C
ity
WA
SHIN
GTO
N R
EGIO
N
Fred
eric
k
Mon
tgom
ery
Prin
ce G
eorg
e's
SOU
THER
N M
D
Cal
vert
Cha
rles
St. M
ary
WES
TERN
MD
Alle
gany
Gar
rett
Was
hing
ton
UPP
ER E
AST
ERN
SH
ORE
Car
olin
e
Cec
il
Ken
t
Que
en A
nne'
s
Talb
ot
LOW
ER E
AST
ERN
SH
ORE
Dor
ches
ter
Som
erse
t
Wic
omic
o
Wor
cest
er
Number
90% Confidence Interval (lines) around the 1990 Census estimate (square) of poor female-
headed families, no husband present, with related children
County's number of AFDC recipient female-headed families, no husband present, with related
children
Source: U.S. Census Bureau, 1990 Census, SF3, P123. MD Dept.
of Human Resources, FIA, tabulations prepared by Jacob France
Institute, U of Baltimore

60
Poverty rates of families headed by mothers alone The poverty rates of families headed by mothers alone generally declined somewhat from 1989 to 1999 (Table 13). Except for Baltimore City, the rates were lower in the Baltimore and Washington regions than in the rest of Maryland’s counties in both 1989 and 1999 (Chart 22).

61
Table 13. Poverty Rate in 1989 and 1999 of Female-Headed Families, No Husband Present, With Related Children Under 18: Maryland
Poverty Rate of Female-Headed Families With Related Children Under 18
Regions, Counties, and State 1990 Census Census 2000
BALTIMORE REGION
Anne Arundel 18.7 17.7
Baltimore County 22.0 17.6
Carroll 19.2 18.5
Harford 27.0 20.8
Howard 14.9 13.4
Baltimore City 45.9 38.3
WASHINGTON REGION
Frederick 22.4 17.1
Montgomery 16.9 14.8
Prince George's 12.9 14.1
SOUTHERN MD
Calvert 21.7 19.6
Charles 17.2 17.1
St. Mary 26.6 22.8
WESTERN MD
Allegany 57.0 35.0
Garrett 47.9 38.3
Washington 40.8 31.5
UPPER EASTERN SHORE
Caroline 40.5 33.1
Cecil 26.8 25.6
Kent 30.2 39.9
Queen Anne's 23.5 21.0
Talbot 32.8 25.7
LOWER EASTERN SHORE
Dorchester 40.2 32.4
Somerset 40.9 40.8
Wicomico 35.5 32.7
Worcester 32.5 33.9
Maryland 28.6 22.9
Source: U.S. Census Bureau, Census 2000 (Total, SF1, QT-P10; Poverty, (STF3, P87); and 1990 Census (Total, STF1, P016; Poverty, STF3, P123)

62
Chart 22. Poverty Rates of Families Headed by Mothers Alone Generally Declined
Poverty Rate of Female-Headed Families with Related Children in 1989 and 1999: Maryland
0
10
20
30
40
50
60
BALT
IMO
RE
REG
ION
Anne
Aru
ndel
Balti
mor
e C
ount
y
Car
roll
Har
ford
How
ard
Balti
mor
e C
ity
WAS
HIN
GTO
N R
EGIO
N
Fred
eric
k
Mon
tgom
ery
Prin
ce G
eorg
e's
SOU
THER
N M
D
Cal
vert
Cha
rles
St. M
ary
WES
TER
N M
D
Alle
gany
Gar
rett
Was
hing
ton
UPP
ER E
ASTE
RN
SH
OR
E
Car
olin
e
Cec
il
Kent
Que
en A
nne'
s
Talb
ot
LOW
ER E
ASTE
RN
SH
OR
E
Dor
ches
ter
Som
erse
t
Wic
omic
o
Wor
cest
er
Mar
ylan
d
1990 Census Census 2000Rate
Source: U.S. Census Bureau, Census 2000 (Total, SF1, QT-P10; Poverty,STF3, P90); and 1990 Census ( (Total, STF1, P016; Poverty, STF3, P123)

63
Each county’s share of Maryland’s families headed by mothers alone who were poor compared with recipients of public assistance Baltimore City had the largest share of Maryland’s poor female-headed families, no husband present, with related children (39 percent in 1999; 50 percent in 1989) and the largest share of public assistance recipient families. Nearly 3 in 5 of such Maryland families receiving public assistance lived in Baltimore City (58 percent in 1999; 57 percent in 1989). About 4 in 5 public assistance families headed by mothers alone lived either in Baltimore City, Prince George’s County, or Baltimore County. In most jurisdictions, there was little difference in the share of poor female-headed families with related children and the share receiving public assistance (Charts 23 and 24, Tables 14 and 15).

64
Chart 23. Baltimore City had the largest share of poor families and TCA recipient families headed by mothers alone County's Share of Maryland's Female-Headed Families With Children Who Were Poor Compared With Those Receiving TCA in CY 1999
0
10
20
30
40
50
60
Alle
gany
Ann
e A
rund
el
Bal
tim
ore
Cal
vert
Car
olin
e
Car
roll
Cec
il
Cha
rles
Dor
ches
ter
Fred
eric
k
Gar
rett
Har
ford
How
ard
Ken
t
Mon
tgom
ery
Pri
nce
Geo
rge'
s
Que
en A
nne'
s
St. M
ary'
s
Som
erse
t
Tal
bot
Was
hing
ton
Wic
omic
o
Wor
cest
er
Bal
tim
ore
Cit
y
County's percentage of state
90% Confidence Interval (blue lines) around the Census 2000 estimate (teal square) of county's percentage of Maryland's poor
female-headed families, no husband present, with related children
County's % of Maryland's TCA recipient female-headed families, no husband present, with related children
Source: U.S. Census Bureau, Census 2000, SF3, P90. MD Dept. of Human Resources, FIA, tabulations
prepared by Jacob France Institute, University of Baltimore
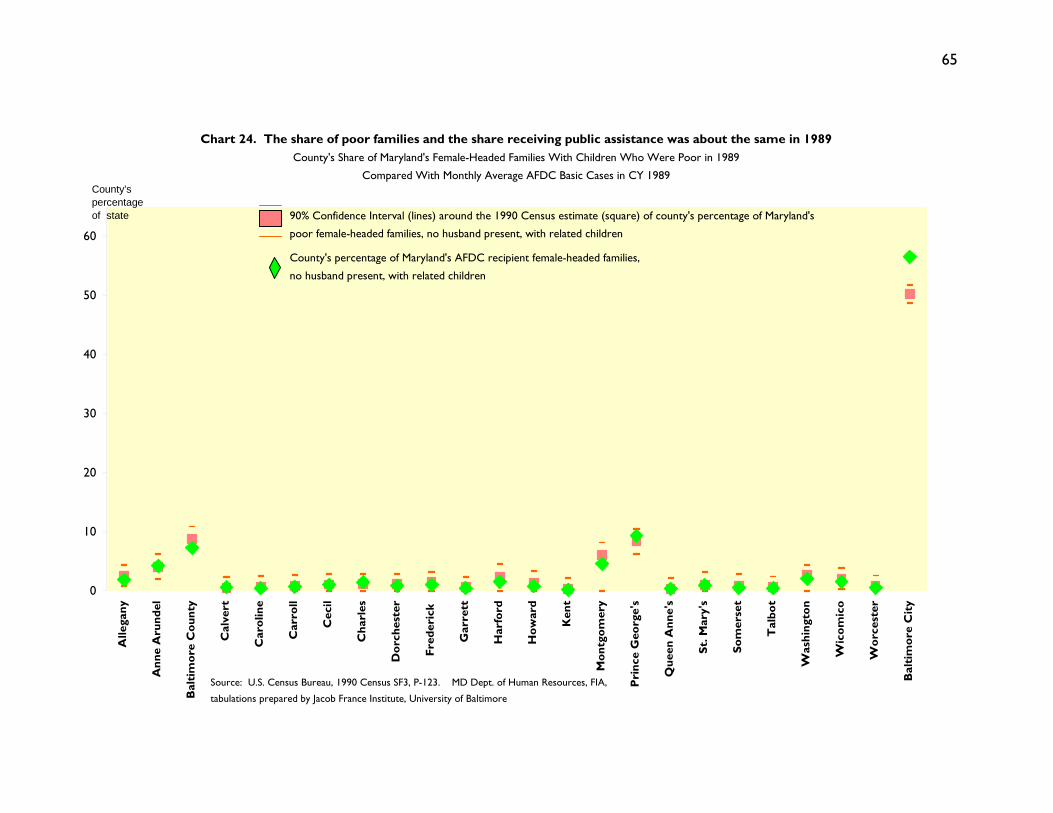
65
Chart 24. The share of poor families and the share receiving public assistance was about the same in 1989County's Share of Maryland's Female-Headed Families With Children Who Were Poor in 1989
Compared With Monthly Average AFDC Basic Cases in CY 1989
0
10
20
30
40
50
60
Alle
gany
Ann
e A
rund
el
Bal
tim
ore
Cou
nty
Cal
vert
Car
olin
e
Car
roll
Cec
il
Cha
rles
Dor
ches
ter
Fred
eric
k
Gar
rett
Har
ford
How
ard
Ken
t
Mon
tgom
ery
Pri
nce
Geo
rge'
s
Que
en A
nne'
s
St. M
ary'
s
Som
erse
t
Tal
bot
Was
hing
ton
Wic
omic
o
Wor
cest
er
Bal
tim
ore
Cit
y
County's percentage of state 90% Confidence Interval (lines) around the 1990 Census estimate (square) of county's percentage of Maryland's
poor female-headed families, no husband present, with related children
County's percentage of Maryland's AFDC recipient female-headed families,
no husband present, with related children
Source: U.S. Census Bureau, 1990 Census SF3, P-123. MD Dept. of Human Resources, FIA,
tabulations prepared by Jacob France Institute, University of Baltimore
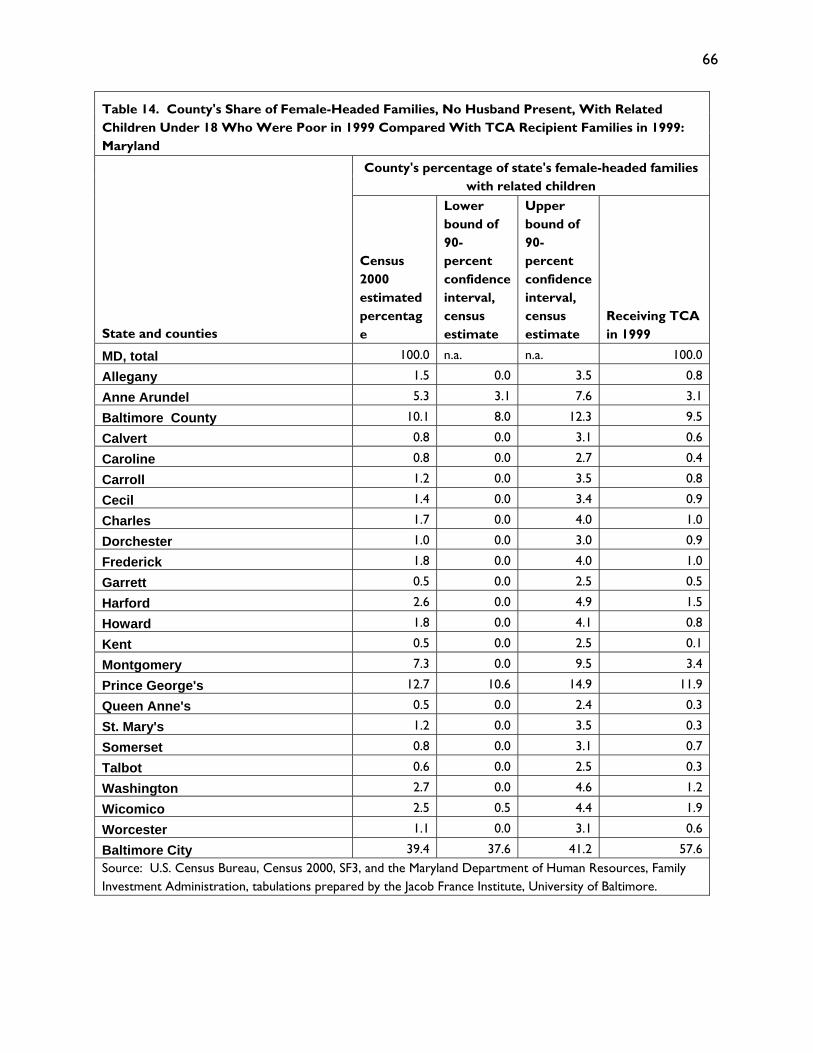
66
Table 14. County's Share of Female-Headed Families, No Husband Present, With Related Children Under 18 Who Were Poor in 1999 Compared With TCA Recipient Families in 1999: Maryland
County's percentage of state's female-headed families with related children
State and counties
Census 2000 estimated percentage
Lower bound of 90-percent confidence interval, census estimate
Upper bound of 90-percent confidence interval, census estimate
Receiving TCA in 1999
MD, total 100.0 n.a. n.a. 100.0
Allegany 1.5 0.0 3.5 0.8
Anne Arundel 5.3 3.1 7.6 3.1
Baltimore County 10.1 8.0 12.3 9.5
Calvert 0.8 0.0 3.1 0.6
Caroline 0.8 0.0 2.7 0.4
Carroll 1.2 0.0 3.5 0.8
Cecil 1.4 0.0 3.4 0.9
Charles 1.7 0.0 4.0 1.0
Dorchester 1.0 0.0 3.0 0.9
Frederick 1.8 0.0 4.0 1.0
Garrett 0.5 0.0 2.5 0.5
Harford 2.6 0.0 4.9 1.5
Howard 1.8 0.0 4.1 0.8
Kent 0.5 0.0 2.5 0.1
Montgomery 7.3 0.0 9.5 3.4
Prince George's 12.7 10.6 14.9 11.9
Queen Anne's 0.5 0.0 2.4 0.3
St. Mary's 1.2 0.0 3.5 0.3
Somerset 0.8 0.0 3.1 0.7
Talbot 0.6 0.0 2.5 0.3
Washington 2.7 0.0 4.6 1.2
Wicomico 2.5 0.5 4.4 1.9
Worcester 1.1 0.0 3.1 0.6
Baltimore City 39.4 37.6 41.2 57.6 Source: U.S. Census Bureau, Census 2000, SF3, and the Maryland Department of Human Resources, Family Investment Administration, tabulations prepared by the Jacob France Institute, University of Baltimore.
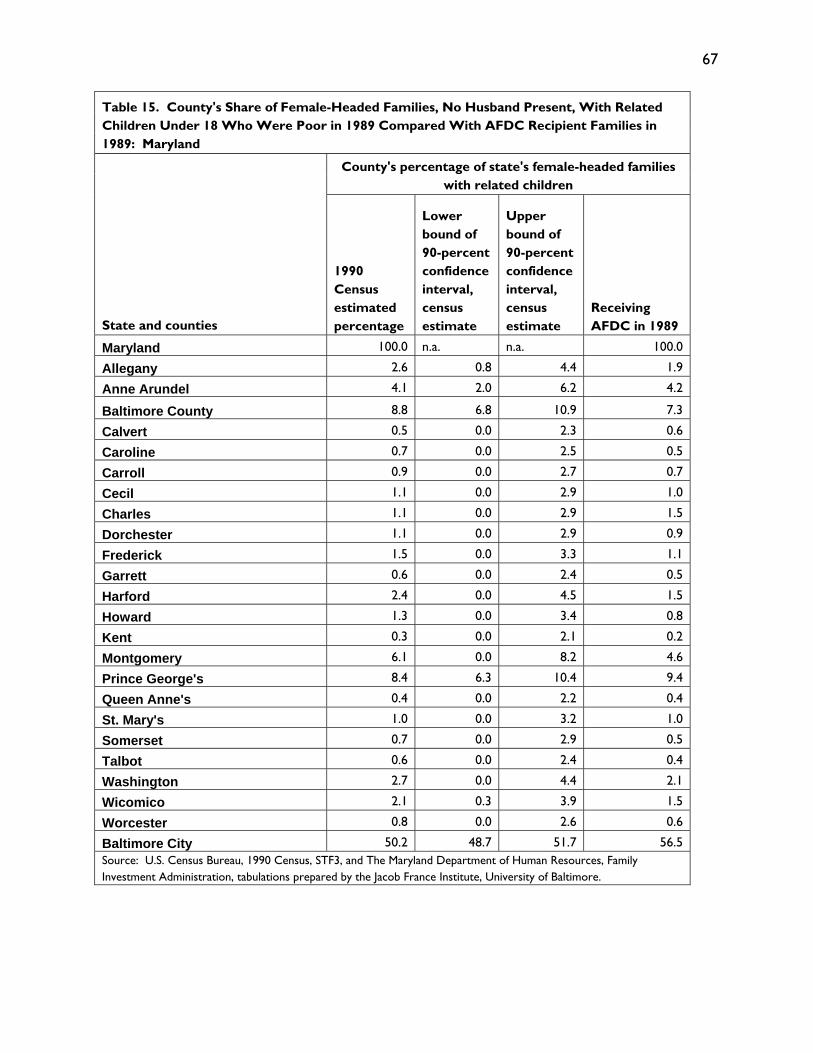
67
Table 15. County's Share of Female-Headed Families, No Husband Present, With Related Children Under 18 Who Were Poor in 1989 Compared With AFDC Recipient Families in 1989: Maryland
County's percentage of state's female-headed families with related children
State and counties
1990 Census estimated percentage
Lower bound of 90-percent confidence interval, census estimate
Upper bound of 90-percent confidence interval, census estimate
Receiving AFDC in 1989
Maryland 100.0 n.a. n.a. 100.0
Allegany 2.6 0.8 4.4 1.9
Anne Arundel 4.1 2.0 6.2 4.2
Baltimore County 8.8 6.8 10.9 7.3
Calvert 0.5 0.0 2.3 0.6
Caroline 0.7 0.0 2.5 0.5
Carroll 0.9 0.0 2.7 0.7
Cecil 1.1 0.0 2.9 1.0
Charles 1.1 0.0 2.9 1.5
Dorchester 1.1 0.0 2.9 0.9
Frederick 1.5 0.0 3.3 1.1
Garrett 0.6 0.0 2.4 0.5
Harford 2.4 0.0 4.5 1.5
Howard 1.3 0.0 3.4 0.8
Kent 0.3 0.0 2.1 0.2
Montgomery 6.1 0.0 8.2 4.6
Prince George's 8.4 6.3 10.4 9.4
Queen Anne's 0.4 0.0 2.2 0.4
St. Mary's 1.0 0.0 3.2 1.0
Somerset 0.7 0.0 2.9 0.5
Talbot 0.6 0.0 2.4 0.4
Washington 2.7 0.0 4.4 2.1
Wicomico 2.1 0.3 3.9 1.5
Worcester 0.8 0.0 2.6 0.6
Baltimore City 50.2 48.7 51.7 56.5 Source: U.S. Census Bureau, 1990 Census, STF3, and The Maryland Department of Human Resources, Family Investment Administration, tabulations prepared by the Jacob France Institute, University of Baltimore.

68
Appendix A-1. Income Question in Census 2000 Sample
(Long Form)

69
Appendix A-2. Income Question in 1990 Census Sample
(Long Form)

70
Appendix B. Subjects in 1990 and 2000 Censuses and Census in Which Subject Was First Asked
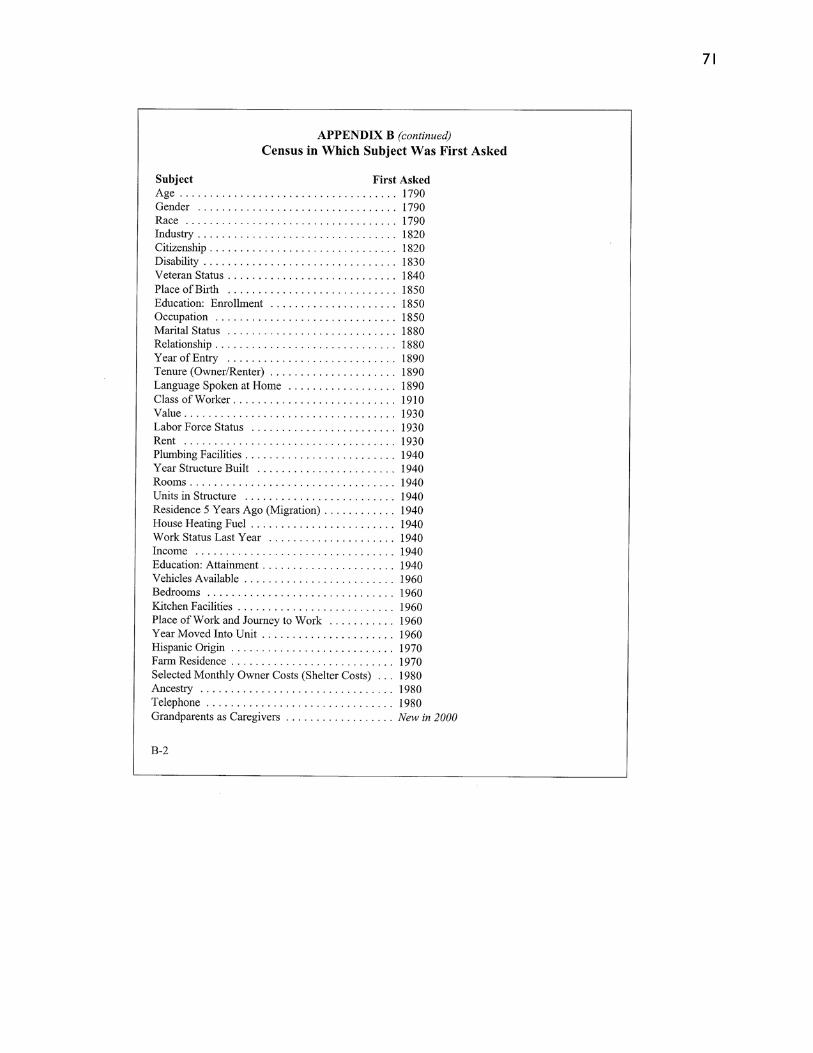
71

72
Appendix C
Determination of Eligibility for TCA in 1999
In order to be eligible for TCA, families had to pass an initial financial test. Families could not have countable assets worth more than $2,00014, net monthly unearned income15 had to be less than the TCA benefit amount for the family size, and net countable earnings had to be less than the TCA benefit amount for the family size. Net countable earnings were calculated by deducting 20 percent of gross earned income (or 50 percent of gross self-employed income), subtracting child care expenses16, adding any unearned income, and deducting child support or alimony paid to anyone outside the family unit. The maximum benefit in Federal FY 2000 is listed below for two-person, three-person and four-person families:
Two-person family $ 328 per month ($3,936 per year) Three-person family $ 417 per month ($5,004 per year) Four-person family $ 503 per month ($6,036 per year) The size of the monthly benefit received by a family was calculated by subtracting the family’s net countable earnings from the maximum allowable benefit for the family size. Countable earnings were calculated as follows. First deduct 35 percent of gross earned income, or 50 percent of the gross self-employed income, deduct child care expenses up to the allowable limit ($100 per month per child for part-time care and $200 per month per child for full-time care), add total unearned income, and then subtract child support paid to children outside the home and alimony payments made to individuals outside the home by stepparents or sponsors of legal immigrants.
14 State of Maryland, Department of Human Resources, Family Investment Administration, Temporary Cash Assistance Manual. Resources not counted in the $2,000 limit included the home, all vehicles, basic household items (e.g. clothing, toys, appliances), burial plot, farm machinery, livestock, tools and business equipment, and life estates. 15 Unearned income that was not countable included Food Stamps, Emergency Assistance grants, SSI benefits, education grants and scholarships, loans, adoption subsidies, and foster care payments. 16 The maximum monthly allowable deduction for child care expenses was $200 if working full time and $100 if working part time.