poverty alleviation research in rural china: three decades
TRANSCRIPT
1
Poverty alleviation research in rural China:
Three decades and counting
X.J. Jay Luo†‡
This draft: August 26, 2019
Abstract
Poverty alleviation is a hallmark of post-revolution Chinese policymaking. Since
1978, the Communist Party of China (CPC) has implemented successive waves of
poverty alleviation policies whose effects have become the focus of an ever-
increasing body of academic literature. This paper reviews this diverse but limited
literature that evaluates the impact of the CPC’s poverty reduction programs
through four major channels, namely fiscal investment programs, social safety nets,
rural governance on the village-, county- and provincial level, and the relocation of
rural populations from destitute regions. This paper aims to synthesize results and
evaluate whether and how the abovementioned poverty alleviation programs have
had distinct positive or negative impacts on regional development outcomes.
Furthermore, I highlight contradictions in empirical findings to motivate the
discussion about contextual importance when designing and implementing future
poverty alleviation programs. Finally, I suggest that an exhaustive and critical
† University of British Columbia, 2329 West Mall, Vancouver, BC V6T 1Z4 ‡ St. George’s School, 4175 W 29th Ave, Vancouver, BC V6S 1V1, Canada
Corresponding author: [email protected]. ∗ Declarations of interest: none. The author would like to thank Professor Wei Cui and Avery
Maloney for their valuable comments and openness to discussion during the course of
writing.
Preprints (www.preprints.org) | NOT PEER-REVIEWED | Posted: 11 September 2019 doi:10.20944/preprints201909.0119.v1
© 2019 by the author(s). Distributed under a Creative Commons CC BY license.

2
appraisal of the empirical strategies used in this literature would further the
development and application of more accurate and informative methodologies.
Keywords: Poverty alleviation, poverty analysis, depressed areas, welfare, regional
policy
1 Introduction
Since Deng Xiaoping’s monumental market reforms in 1978, 700 million Chinese
people have been lifted out of absolute poverty, accounting for 70% of poverty reduction
worldwide (Majendie, 2018). In 2013, General Secretary Xi Jinping set the ambitious
goal of lifting all 1.4 billion people out of destitution by the end of 2020, 10 years ahead
of the United Nation’s goal of eradicating poverty worldwide by 2030 (Wescott and
Wang, 2019). By the end of 2018, the 832 poorest counties have already been reduced
by least 430, and at least 100,000 villages have exited extreme poverty (South China
Morning Post, 2018). The 13th Five-Year Plan (2016-2020) aims to lift 30 million people
out of poverty through industrialization and investment, 10 million through employment
opportunities, 10 million through ex situ resettlement, and 20 million through social
security programs (Central Committee of the Communist Party of China, 2016; Zuo,
2019).
Despite the CPC’s remarkable progress in poverty alleviation, the nature of rural
poverty and the interplay of its causal factors have confounded scholars for decades.
Preprints (www.preprints.org) | NOT PEER-REVIEWED | Posted: 11 September 2019 doi:10.20944/preprints201909.0119.v1

3
The first attempt to empirically document rural poverty1 was Travers and Ma (1994),
who investigated whether agricultural intensification and investment raise peasant
incomes. Since then, rural poverty measurement in the literature has evolved from
single-dimensional—that is, purely income-based—to multidimensional, which takes
into account social deprivations, the lack of human capital, and vulnerability to enter
poverty. However, the integration of multiple poverty indicators is difficult, and
empirically measuring such indicators with precision remains challenging. While
scholars have come to the consensus that a numeric cut-off line is an oversimplified
model of defining absolute poverty2, approaches have generally differed regarding
poverty identification methods.
This paper is structured as follows: the first section gives a brief history of rural
Chinese poverty alleviation. The second section outlines the review methodology. The
third section discusses the evolution of research focus and experimental design of the
1 There may have been earlier attempts to document poverty (especially in the Chinese
literature), but those articles were excluded from the review for reasons described in the
methodology section.
2 The former official definition of poverty is based on the Chinese national poverty cut-off
line of RMB 2300 ($362.5) per capita annual income. Criticisms of the national poverty
line—in addition to its dismissal of other poverty causes—are centered around its
inflexibility. For example, the living standards of a person with a per capita annual income of
RMB 2301 is virtually identical as one with a per capita annual income of RMB 2299. The
cut-off is also criticized for being set too low in relation to the international standard. Using
a 10-year panel data set from three provinces, Glauben et al. (2011) demonstrated that
while only 4% of the households in lived five or more years in poverty according to the
national poverty line, the portion increases to almost 40% when remeasured using the
international poverty line (Glauben et al., 2011).
Preprints (www.preprints.org) | NOT PEER-REVIEWED | Posted: 11 September 2019 doi:10.20944/preprints201909.0119.v1
4
literature. The fourth section discusses the key findings of this review. The fifth section
concludes the paper.
1.1 A brief history of poverty alleviation in rural China
1949-1977 Economic development was stagnant in rural areas, whose
populations were in a state of constant poverty during this period. Poverty alleviation
policies were fruitless and misguided, focusing on the most basic physiological needs
(food, clothing) of rural populations (Liu et al., 2018). This passive blood-transfusion
form of poverty alleviation discouraged local economic growth, and transitions back into
poverty were pervasive.
1978-1985 Deng Xiaoping’s opening-up reforms led to gradual liberalizations in
agriculture and business development. The household responsibility system inspired
farmers to increase land output, which prompted a healthy increase in agricultural
product prices. The formation of township and village enterprises (TVEs) laid the
framework for rural economic structure. Poverty alleviation efforts became more
comprehensive (e.g. fiscal investment in disparate and contiguous rural areas). Absolute
poverty dropped 17.86 million people annually, and individuals with basic needs
dropped by from 30% to 15% of the rural population during this period.
1986-1993 The rural economy sustained its economic growth, but inequalities
emerged between eastern coastal cities and midwestern contiguous poverty areas. In
1986, the CPC established the State Council Leading Group on Poverty Alleviation and
Preprints (www.preprints.org) | NOT PEER-REVIEWED | Posted: 11 September 2019 doi:10.20944/preprints201909.0119.v1
5
Development (LGOPAD 国务院扶贫开发领导小组). The establishment of this
administration marked the first state-led poverty alleviation program in China.
1994-2000 This phase of poverty alleviation is characterized by the National 8-7
Plan, which was implemented to resolve food and clothing problems of 80 million poor
in midwestern mountainous regions. 82% of the 592 national poverty counties (an
increase of 261 from the previous period) concentrated in midwestern areas. The target
of the 8-7 Plan was achieved in 2000—one year ahead of its planned completion date—
and led to a 48-million decrease in rural poverty population in China. The 8-7 Plan
marked a turning point in Chinese poverty alleviation policy as it had clear objectives,
solutions, and duration (Liu et al., 2018).
2001-20133 Since the drafting of the “Outline for Development-Oriented Poverty
Reduction for China’s Rural Area” in 2001, rural China oversaw over a decade of village-
centric poverty reduction (Yan, 2016; Liu et al., 2018). Whole-village advancement
measures such as rural infrastructure development and community-based development
paved the way for more region-specific poverty alleviation, a precursor to the era of
targeted poverty alleviation (2014-present). The 2001 tax-for-fee reforms (shuifei gaige
税费改革) reduced agricultural tax burden for farmers; only five years later in 2006 did
the CPC eliminate the two-thousand-year-old agricultural surcharge. In 2003, the new-
type rural cooperative healthcare system (NRCHS) was designed to counteract poverty
3 Other scholars categorize time periods differently. Liu et al. (2018) uses the period 2001-
2012. Yan (2016) uses the period 2001-2010. 2013 was chosen as the end date in this paper
because of the initiation to targeted poverty alleviation, which marked a turning point in the
mechanism of the poverty alleviation program.
Preprints (www.preprints.org) | NOT PEER-REVIEWED | Posted: 11 September 2019 doi:10.20944/preprints201909.0119.v1
6
incidence caused by illness. The healthcare relief policies in 2004 provided “destitute”
households with “five welfare guarantees”, benefitting 3.04 million deprived population
in rural villages. By the end of 2010, China had lifted 58.26 million out of poverty and
became the first nation to achieve the UN Millennium Development target of halving the
poverty population.
2014-2020 Since 2013, China has implemented the ‘targeted’ poverty alleviation
strategy (jingzhun fupin 精准扶贫). In 2013, the State Council released “Opinions on
Promoting Rural Poverty Alleviation through Innovation Mechanisms,” a programmatic
document that stresses the need for an appropriate identification process for poverty
alleviation. The document requires local governments to generate electronic reports for
individual households, detailing the causes and circumstances of their poverty. In June
2015, Chairman Xi Jinping ratified the targeted poverty alleviation plan and positioned it
at the forefront of Chinese poverty alleviation policy.
2 Review Methodology
Here I provide a brief overview of the methodology used to review the empirical works
included in this review.
The quasi-systematic review of empirical methods and data. Original, peer-
reviewed research articles were selected from Elsevier, JSTOR, and SSRN. Publication
dates were divided into time periods (1990-2000, 2001-2010, and 2011-2019) as they
correspond to major poverty alleviation policies as well as shifts in the focus,
methodology, and findings in the literature. I review the literature in rural instead of in
Preprints (www.preprints.org) | NOT PEER-REVIEWED | Posted: 11 September 2019 doi:10.20944/preprints201909.0119.v1
7
urban China because of its significantly higher poverty incidence, persistence and
severity, and the rural-centricity of government policies. I omit research articles
analyzing poverty alleviation perspectives on ecology, biodiversity, energy use, and
tourism as environmental aspects of poverty bear little relevance to the canonical
channels of poverty alleviation. Each study in this review was evaluated based on the
components of its experimental design (geographical scope, time frame, sample source,
sample size, dependent variables).
Search methodology. I use Elsevier, JSTOR, and Google Scholar as primary
search engines. Restrictions were placed on the date of publication (1990-2000; 2001-
2010; 2011-2019), the repository (restricted to Elsevier, JSTOR and SSRN), and topic
(studies in other developing nations were rejected). The authors must have used a clear
empirical approach to analyze the effects of poverty alleviation policy in rural China. The
research articles were catalogued according to the policies they analyze4.
Examples of search phrases:
- China poverty alleviation "[insert methodology here]" -urban.
- Rural microfinance China poverty Elsevier -Vietnam -Thailand
- Poverty alleviation resettlement rural China JSTOR
4 In this review: fiscal investment, social support, resettlement, and governance
mechanisms.
Preprints (www.preprints.org) | NOT PEER-REVIEWED | Posted: 11 September 2019 doi:10.20944/preprints201909.0119.v1

8
There are important points to be discussed about this methodology. First, this work
should not be considered a meta-analysis, as a formal search algorithm was not used5,
and there has been no attempt to create standardized impact estimates. Secondly, I
acknowledge the exclusion of Chinese research, or other international research, that
may not be included in the repositories. I therefore acknowledge that there may exist
publication and inclusion bias resulting from the specific sources used for this review.
3 Experimental design in the literature
3.1 Research questions
Scholars have posed research questions that have both evolved and remained
the same with the progression of poverty alleviation policy. While new research focuses
have emerged, core concerns such as the optimization of quantitative methods to more
accurately measure poverty have remained the same. Travers and Ma (1994)
investigated the effects of agricultural investment on rural poverty, consistent with the
primary objective of the eight Five-Year Plan (1991-1995) of direct irrigation investment.
The first definitions of transient and chronic poverty were provided by Jalan and
Ravallion (1998), followed up by another study that probed the causes of transient
poverty and how the implications of the interplay between transient and chronic poverty
5 The relatively limited literature in poverty alleviation research in rural China and the
dissimilarity of geographic regions rendered an algorithm unnecessary. Alterations in word
order in the searches generally did not affect search results.
Preprints (www.preprints.org) | NOT PEER-REVIEWED | Posted: 11 September 2019 doi:10.20944/preprints201909.0119.v1
9
for measurements of overall poverty (Jalan and Ravallion, 1999). These pioneer studies
allowed for more specific analyses in the mutual exclusivity of transient and chronic
poverty (Jalan and Ravallion 2000, 2001; Mcculloch and Calandrino, 2003; Duclos et al.,
2010), and, on a broader level, introduced the inherent complexity of rural poverty—
perhaps foreshadowing the need for multidimensional approaches—and how effective
policy should adapt to rural poverty’s unpredictable fluctuations.
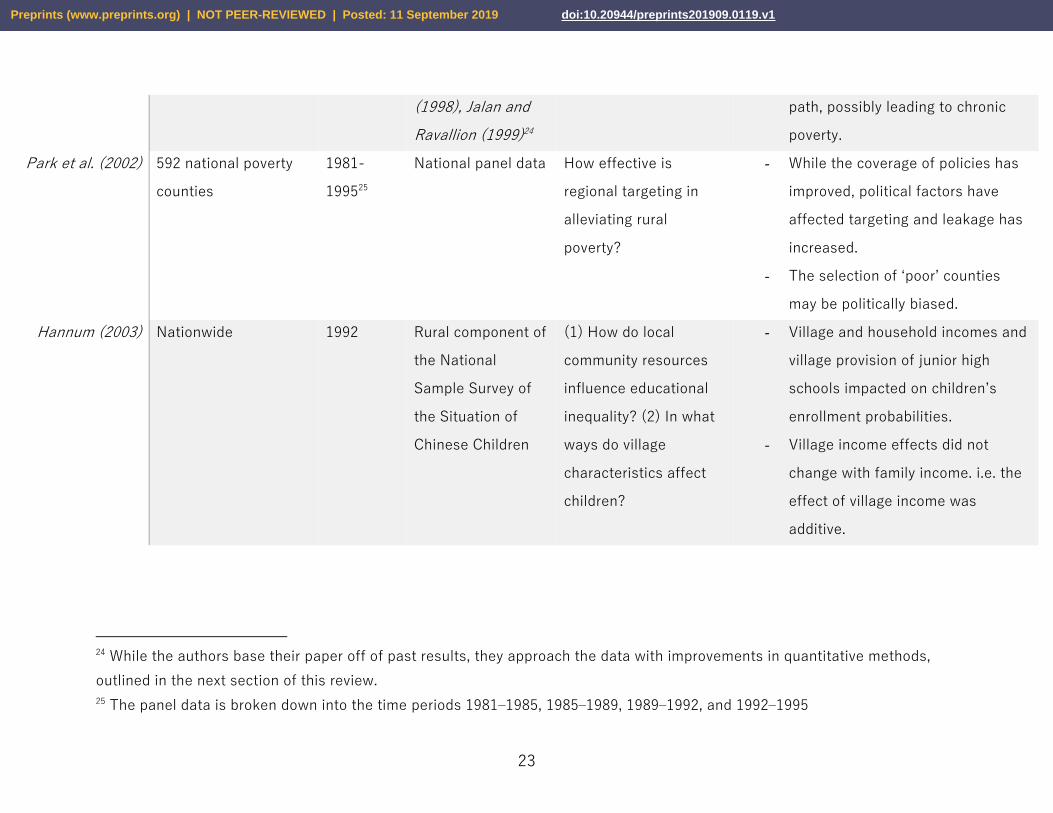
A fundamental understanding of rural poverty has enabled scholars to scrutinize
poverty alleviation policy in its distinct forms6. Hannum (2003) investigated how local
community resources influence educational inequality, providing a reference for a two-
decade study that incorporated multidimensional poverty measurement metrics to
evaluate child poverty (Qi and Wu, 2015). Cheng (2006, 2007) examined the targeting
efficacy of rural microfinance policy, leading the way for further investigation in the
welfare outcomes of microfinance programs (Li et al., 2011; Turvey and Kong, 2010; You
and Annim, 2014; Ding et al., 2018). Carrin et al. (1999) provided the first temporal
evaluation of the Rural Cooperative Medical System in fourteen pilot counties, laying
the framework for further analysis of distributive properties of healthcare policy in
poverty alleviation (Yang et al., 2016; Chen et al., 2018). It was not until 2017 when the
innerworkings of social poverty policy was elucidated, likely because of the abstract
nature of measuring social capital and the paucity of large datasets. The works of
Ratigan (2017), Zhang et al. (2017), Golan et al. (2017), and Kakwani et al. (2017)
6 It should be noted, however, that there were not particular focuses on specific poverty
alleviation programs until after 2010.
Preprints (www.preprints.org) | NOT PEER-REVIEWED | Posted: 11 September 2019 doi:10.20944/preprints201909.0119.v1
10
analyzed regional differences in social welfare provision, the association between social
relationships and the probability of living in poverty and the effectiveness of the dibao
program. In light of recent poverty resettlement efforts, Xue et al. (2013) inspected the
mechanisms of voluntary7 poverty resettlement as Lo and Wang gauge the distributive
properties and potential biases of such programs.
The efforts in the literature to characterize rural poverty in China, described
above, points to the multifaceted nature of rural poverty. A breakthrough in poverty
measurement came in 2007 when developmental economists Sabina Alkire and James
Foster published a series of papers on multidimensional poverty that encapsulated—as
the name suggests—the multiple causal factors of poverty. Yu (2013), Qi and Wu
(2015), Wang and Wang (2016), and Alkire and Wang (2018) used this method to paint a
more complete picture of multidimensional rural poverty in China (see Appendix A). It is
likely that these multidimensional measurements will receive more attention in the
future for their ability to capture previously underappreciated contributors to rural
poverty.
3.2 Sampling
The geographical scope and (quasi-)experimental design of the research articles
have generally remained comparable, which can be explained by the recurrence and
7 The definition of “voluntary” versus that of “involuntary” poverty alleviation resettlement
programs was a debated topic, with Wilmsen and Wang (2015) proposing that a people-
centered approach, not volition is the driver of improved outcomes in PAR.
Preprints (www.preprints.org) | NOT PEER-REVIEWED | Posted: 11 September 2019 doi:10.20944/preprints201909.0119.v1
11
persistence of poverty in the mid-west and northwestern regions over the past three
decades. The time frames of the empirical literature are attuned to the dates of key
policies such as the National 8-7 Plan (1994-2000). Therefore, it is of interest and more
feasible to investigate clearly defined periods of poverty policy to gauge the effects
thereof8.
The limited sampling capacity of empirical research during the first phase (1990-
2000) of poverty alleviation research can largely be derived from geographical
heterogeneity and highly decentralized and county- and village-specific policy
implementation. Implementation bears little similarity across counties, sometimes even
within villages (Park and Wang, 2010). As a result, researchers often resorted to the
analysis of two to three provinces with adequately similar geographic and demographic
characteristics with regards to poverty. The corollary of geographic limitations is a
restricted sample size, which is often limited to county- or village-level populations. In
addition, the data source was fairly homogenous among the studies during this period,
with 3 of 5 studies using data from the Rural Household Survey9 (RHS), with the
exception of Chen and Ravallion (1996), who conducted face-to-face interviews with
8 Another reason that scholars are not able to extend the temporal scope of empirical
research is the paucity of credible and accessible poverty statistics. These poverty data are
rarely made public and require personal relations with local officials, which is also a
determining factor of the effectiveness of qualitative research, explored more in the section
on empirical methodologies. 9 The RHS began in 1955, presumably the oldest survey accessible. The credibility of the
surveys, however, was questionable and access to the results were largely restricted until
the early 1990s.
Preprints (www.preprints.org) | NOT PEER-REVIEWED | Posted: 11 September 2019 doi:10.20944/preprints201909.0119.v1

12
local officials. Jalan and Ravallion (2001) even opted to re-use survey data from studies
done several years ago due to the scarcity of reliable data and of national-level surveys
conducted by the government. Overall, there was little attempt to empirically measure
and interpret rural poverty during this period.
With the maximum length of five years10, studies during the first phase were
relatively uninformative about whether and how the central government should optimize
policy options for distinct geographical regions. Observations from poverty
measurement studies had been derived from national household surveys (e.g. Rural
Household Survey (RHS)), which are cross-sectional, not longitudinal, data. Cross-
sectional data obtained at a single point in time do not provide any indication of the a
priori or post priori conditions of poverty, thereby failing to capture fluctuations in
poverty levels between the times of measurement. It was not until 1998 when Jalan and
Ravallion (1998) addressed this by constructing a new panel data set was from the
RHS11 done by China’s State Statistical Bureau (SSB).
10 Jalan and Ravallion (1996, 1998, 2001) used the same dataset likely due to data
unavailability from other surveys.
11The authors note that the RHS has been a well-designed budget survey of a random
sample of households drawn from a sample frame spanning rural China (including small-
medium towns), with unusual effort made to reduce non-sampling errors. Sampled
households fill in a diary on daily expenditures and are visited on average every two weeks
by an interviewer to check on the diaries and collect other data. There is also an elaborate
system of cross-checking at the local level. The consumption data obtained from such an
intensive survey process are almost certainly more reliable than those obtained by the far
more common cross-sectional surveys in which the consumption data are based on recall at
a single interview or possibly with one follow-up interview. For a six-year period 1985–1990,
the survey was also longitudinal, as it sampled the same households over time.
Preprints (www.preprints.org) | NOT PEER-REVIEWED | Posted: 11 September 2019 doi:10.20944/preprints201909.0119.v1
13
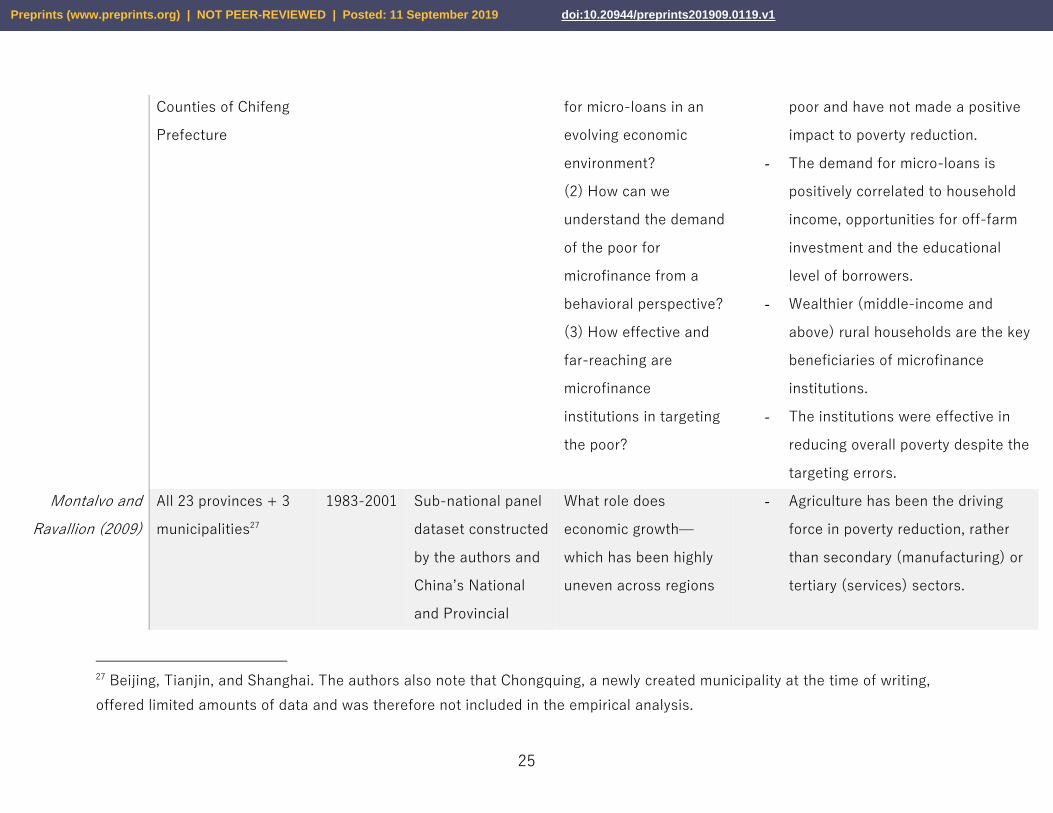
A clear upward trend in sample size and data variety began in the late-2000s.
Montalvo and Ravallion (2009), using a sub-national panel dataset constructed by the
authors and China’s National and Provincial Bureaus of Statistics, evaluated rural
China’s economic growth from 1983 to 2001, re-defining the “longitudinal study” in rural
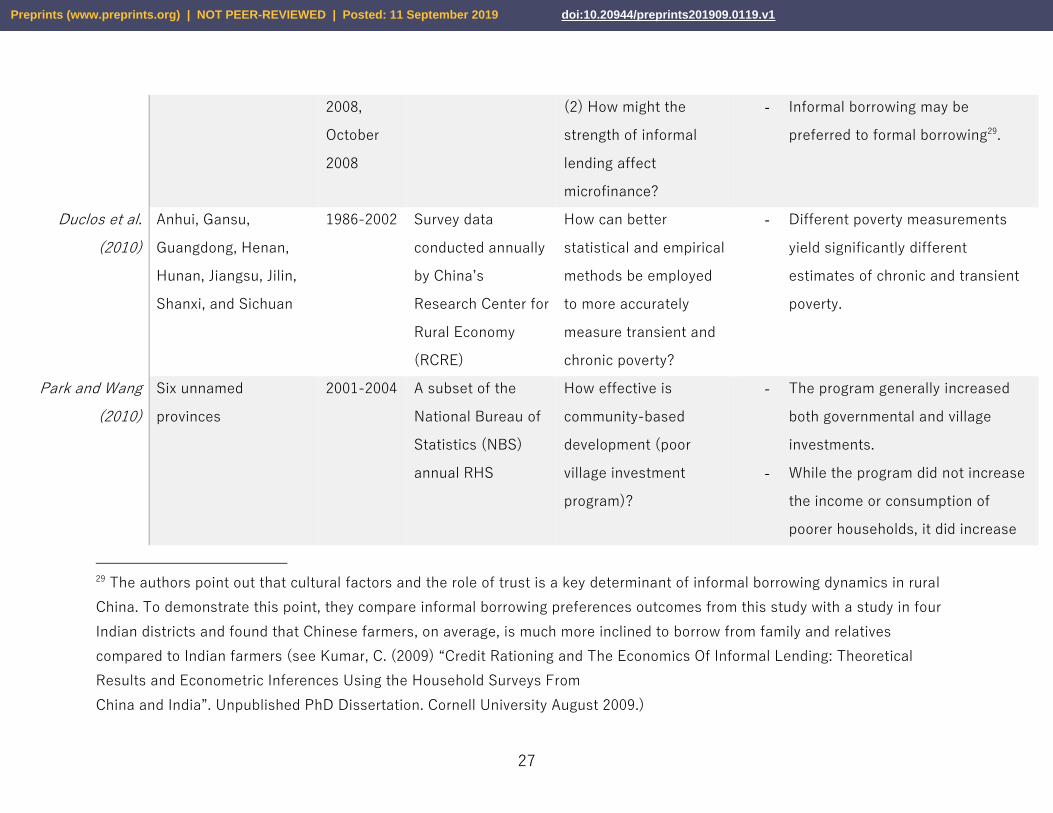
Chinese poverty alleviation research. Duclos et al. (2010) used survey data conducted
annually by China’s Research Center for Rural Economy (RCRE) to measure long-term
changes in transient and chronic poverty incidence from 1986 to 2002, followed by many
others that used the growing wealth of rural poverty data provided by all levels of
Chinese administration (Appendix A).
4 Findings and Discussion
Drawing on the diverse repertoire of literature in Chinese poverty alleviation, I
argue that there is no chief culprit for rural poverty12 and that whether the CPC’s
poverty alleviation programs are effective is not so clear-cut. All the evidence points to
the fact that Chinese rural poverty is a concoction of geographic location and natural
conditions, local governance, and the array of stochastic indicators of transient and
chronic poverty.
Several generalizations can be made. Expectedly, investment in agriculture has
remained effective in reducing poverty (Travers and Ma, 1994; Montalvo and Ravallion,
12 Though there certainly are primary causes of poverty for inhabitants in specific contexts
(e.g. for the poor people living in mountainous areas, natural factors and lack of
infrastructure is the main contributor of poverty).
Preprints (www.preprints.org) | NOT PEER-REVIEWED | Posted: 11 September 2019 doi:10.20944/preprints201909.0119.v1
14
2009; You, 2014; Imai and You, 2014), especially in the poorest areas where there are
no readily available external sources of employment. Investment in education has also
been shown to be successful in reducing poverty vulnerability (Hannum, 2003; Goh et
al., 2009; Glauben et al., 2011; Imai and You, 2014; Lü, 2015; Ratigan, 2017; Ren et al.,
2017; Alkire and Shen, 2018), although the study areas are generally limited to several
provinces and may not reflect regional peculiarities13. It seems that the programs that
are commonly associated with international poverty alleviation generally hold true for
rural China despite drastic demographic and spatial differences. That said, inequalities
remain and whether and how they will be addressed is a moot point.
Perhaps the most important finding of this review is that studies that analyze the
same policy can produce different, even opposite, findings. I argue that, ceteris
paribus14, these differences can primarily be attributed to spatial heterogeneity15 and
that regional differences in sampling in studies are not negligible. Whereas Ravallion
and Chen (2005) find that microfinance programs have little or no impact on permanent
income, Li et al. (2011), You and Annim (2014) and Ding et al. (2018) all find significant
positive impacts thereof. A comparison of geographic regions of the studies reveals that
the study done by Ravallion and Chen was conducted in southwestern provinces,
13 Goh et al. (2009) is an exception (see Appendix A). 14 I acknowledge that there may be other variables driving these differences (e.g. differences
in methodology, time frame); however, only geographic heterogeneity has been concretely
shown to be involved in differences in poverty severity and type. 15 I refer to not only geographic and natural characteristics but also the variation in the
attention local governments pay to individual counties or villages (i.e. differences in local
governance).
Preprints (www.preprints.org) | NOT PEER-REVIEWED | Posted: 11 September 2019 doi:10.20944/preprints201909.0119.v1

15
whereas the three others focus almost exclusively on central and northern provinces.
Whereas Xue et al. (2013) find positive effects of poverty alleviation resettlement (PAR
programs) on economic opportunities and social welfare, Lo and Wang (2018) find
inconsistencies in implementation and Liu et al. (2018) emphasize distinct program
outcomes between different relocation regions. Yang et al. (2016) finds coverage issues
in the New Cooperative Medical Scheme (NCMS) in the inland Shaanxi Province,
whereas Chen et al. (2018) find improved service accessibility in the eastern coastal
Zhejiang Province. The pattern of provincial and regional exceptions plays itself out in
all channels of poverty alleviation—grave targeting errors or questionable local
accountability cannot and should not be generalized, and the failure of an investment
program on one region does not mean that it will have the same effect in another.
The fact that the literature can be identified with distinct aspects of rural poverty,
among them fiscal, social and health poverty, signifies that poverty alleviation programs
are not yet inclusive enough to confront all dimensions of poverty. That said, PAR
programs do hold some promise as they have been shown, at least regionally, to
dramatically improve living and economic conditions for those that chose to re-locate. It
is expected that PAR programs will do even more to reduce the financial burden on the
relocated by providing more affordable transportation services, carry out community-
based programs to foster social capital, assist the relocated in their search job searches
by providing training in specific skills, and, most importantly, ensuring that the non-
movers do not continue to suffer from endemic chronic poverty.
Preprints (www.preprints.org) | NOT PEER-REVIEWED | Posted: 11 September 2019 doi:10.20944/preprints201909.0119.v1

16
The policy implications of these findings are far-reaching: the specificity to which
policies may be required to adapt will need to be on the village- or even on the
household-level. Future attempts to create more targeted poverty alleviation programs
should aim to ensure that not one of the millions of people who exit poverty relapses for
any reason, be it a transient income shock, adverse natural conditions, or poor local
governance. The “eradication” of poverty should therefore be defined as the elimination
of every possible root cause of poverty through painstakingly specific programs and the
ridding of the whack-a-mole approach to policy implementation that still plagues some
of the poorest rural areas. The sources of poverty that we know of16 may be incredibly
difficult to control for given that there are hundreds of counties and thousands of
villages in poverty at any given time. Because of the context-specific nature of rural
poverty, a more holistic and multidimensional approach should be used to evaluate
poverty not only in rural China but also internationally. Despite clear evidence that
certain aspects of the CPC’s plan can and must be improved, we must refrain from
making brazen conclusions about the plan’s validity or effectiveness.
It is important to be cognizant of the inherent noise involved in rural Chinese
poverty alleviation research. This paper assumes that the data sources are free of error
and bias17 and that empirical strategies are optimal for the context of a specific
16 These conclusions are made on the assumption that scholars have already “decoded” all
the possible sources of poverty. It may well be that new or unknown sources of poverty will
surface as time progresses and as more novel poverty alleviation approaches such as e-
commerce and tourism become more widespread.
17 This is especially concerning when designing mass questionnaires and collecting data
from millions of poor people from geographically distinct regions.
Preprints (www.preprints.org) | NOT PEER-REVIEWED | Posted: 11 September 2019 doi:10.20944/preprints201909.0119.v1

17
province, county, or village. We also lack a firm grip on the precise mechanisms by
which poverty alleviation is carried out in the poorest of the poor areas, and it is
certainly possible that exogenous influences such as ulterior political motives distort
survey data. An in-depth survey of empirical strategies and the relationship between the
context of rural poverty and empirical methods will be a crucial step in our quantitative
understanding of poverty and development in rural China. I have provided an overview
of all the empirical methods researchers have used to date (Appendix B) and anticipate
that these methods will continue to be fine-tuned to match the dynamics of Chinese
rural poverty.
5 Conclusion
To the author’s knowledge, this is the first quasi-systematic review of the rural
Chinese poverty alleviation literature. It is reasonable to conclude that Chinese poverty
alleviation policy is partitioned into periods of gradual and intense focus, as is the
research that seeks to better understand rural poverty dynamics. As poverty alleviation
shifted from being more material-centric to region- and household-specific, so did the
literature.
As of April 2019, there are still approximately 373.1 million people living in extreme
poverty (World Bank, 2019)18 in China. Eradicating poverty by 2020 remains a daunting
18 While the UN rightly defines ‘extreme’ as earning less than $5.50 a day, the literature has
acknowledged that poverty is not entirely income-dependent (although it plays a large role
in poverty) and there may be, especially in a country as large and complex as China, millions
suffering from poverty with other inadequacies, among them social poverty, education
Preprints (www.preprints.org) | NOT PEER-REVIEWED | Posted: 11 September 2019 doi:10.20944/preprints201909.0119.v1

18
task despite the extensive scale of poverty alleviation efforts. It is likely that rural
poverty and its intricacies will continue to pose challenges for the CPC even after
supposed ‘eradication’.19 The CPC nevertheless appears to be willing to devote as
much resource as needed into this unprecedented effort for as long as rural poverty
persists in China.
deprivation and the inaccessibility of healthcare. This situation, again, stresses the need for
more holistic measurements of poverty that encompass multiple possible sources of rural
poverty.
19 The reviewed literature has made a strong case for more optimized policy for different
types of poverty (e.g. transient or chronic) in different regions of China.
Preprints (www.preprints.org) | NOT PEER-REVIEWED | Posted: 11 September 2019 doi:10.20944/preprints201909.0119.v1

19
Appendix A: Study design
Authors of study Geographical scope Time
frame
Data source Research question(s) Key findings
Travers and Ma
(1994)
12 provinces20 1980-1987 China’s County
Level Rural
Economic
Statistical Abstract
Can agricultural
intensification and
investment raise
peasant incomes in
poor areas?
- Increased use of machinery and
fertilizer offers some potential for
increasing peasant income in rural
areas.
- Investment in irrigation in poor
regions would only increase net
peasant incomes if government
subsidies compensate for at least a
third of the costs of the projects.
Chen and
Ravallion (1996)
Guangxi, Yunnan,
Guizhou, and
Guangdong
1985-
199021
Rural Household
Survey (RHS); in-
person interviews
with county officials
(1) How can we better
understand and
validate poverty rates
from existing data (i.e.
how can we improve
- Poor distributional effects of
policies led to preferential growth
in rural areas in coastal regions.
- Inland provinces experienced
slower growth.
20 Heilongjiang, Neimenggu, Hebei, Henan and Shanxi are in North and North East China; Sichuan, Hubei, Jiangxi, and Jiangsu.
21 The authors note that 1984 data was unavailable because it was a trial period and the data produced were unreliable.
Preprints (www.preprints.org) | NOT PEER-REVIEWED | Posted: 11 September 2019 doi:10.20944/preprints201909.0119.v1
20
data-collecting
methods)? (2) How can
we corroborate the
concerns of
policymakers regarding
the effectiveness of the
policies in the 1980s?
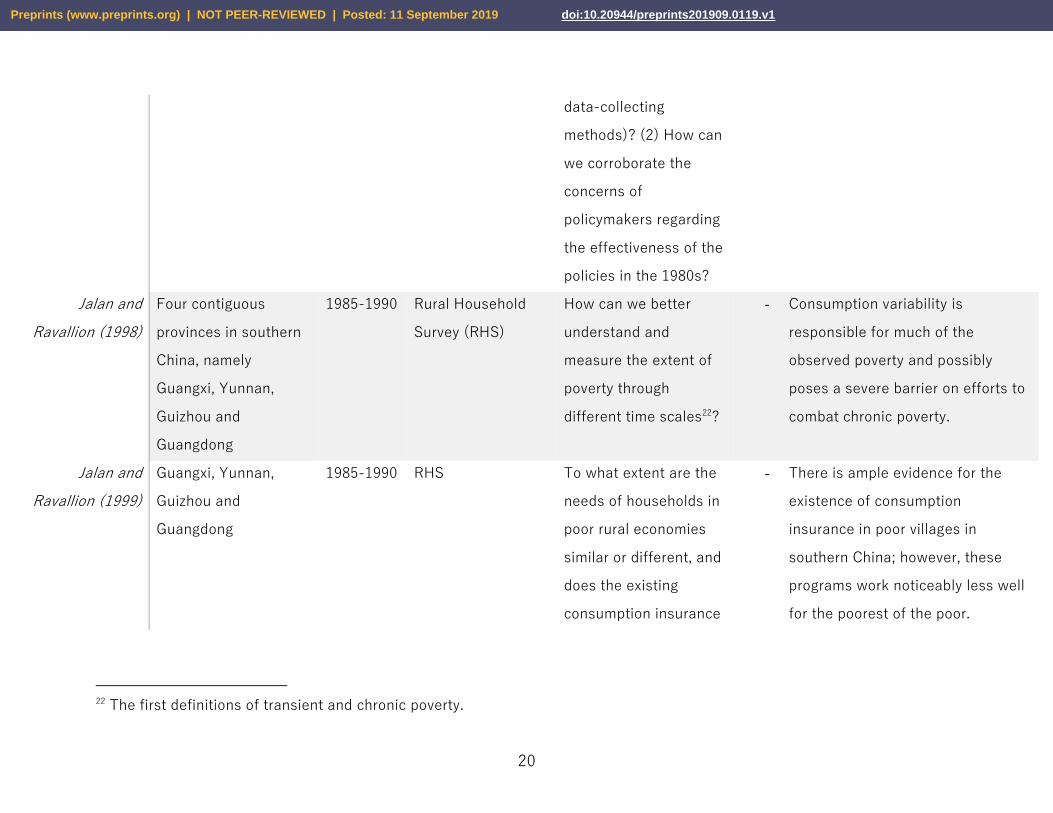
Jalan and
Ravallion (1998)
Four contiguous
provinces in southern
China, namely
Guangxi, Yunnan,
Guizhou and
Guangdong
1985-1990 Rural Household
Survey (RHS)
How can we better
understand and
measure the extent of
poverty through
different time scales22?
- Consumption variability is
responsible for much of the
observed poverty and possibly
poses a severe barrier on efforts to
combat chronic poverty.
Jalan and
Ravallion (1999)
Guangxi, Yunnan,
Guizhou and
Guangdong
1985-1990 RHS To what extent are the
needs of households in
poor rural economies
similar or different, and
does the existing
consumption insurance
- There is ample evidence for the
existence of consumption
insurance in poor villages in
southern China; however, these
programs work noticeably less well
for the poorest of the poor.
22 The first definitions of transient and chronic poverty.
Preprints (www.preprints.org) | NOT PEER-REVIEWED | Posted: 11 September 2019 doi:10.20944/preprints201909.0119.v1

21
work better for some
groups than others?
- There is evidence for inequitable
economic growth within poor rural
economies in Southern China.
Carrin et al.
(1999)
14 pilot counties (two
counties in each of
seven designated
provinces)23
1994 Same as Carrin et
al. (1996)
(1) To what extent have
counties and their
townships been able to
reduce the burden of
healthcare costs on the
rural population?
(2) How effective are
the policies’ population
coverage and how
adequate is the
reimbursement
structure?
- Although all counties are rural, the
population structure by occupation
and income clearly varies.
- The project has, however, adapted
itself to the variety in population
structure, and it has given
sustained support in
implementation and in monitoring
the progress in the different pilot
counties.
- The average population coverage in
most townships is adequate and
that full population coverage seems
to be a feasible goal. However,
coverage requires drastic
23 Tongxian and Pinggu (Beijing), Qidong and Xinghua (Jiangxu Province), Haining and Xiaoshan (Zhejiang Province), Xinmi and
Wuzhi (Henan Province), Wuxue and Changyang (Hubei Province), Yongning and Lingwu (Ningxia Province) and Yongxiu and
Yihuang (Jiangxi Province); early 1995, Tongxian County was replaced by Fangshan County of Beijing.
Preprints (www.preprints.org) | NOT PEER-REVIEWED | Posted: 11 September 2019 doi:10.20944/preprints201909.0119.v1
22
Improvements in some townships
as well.
- Reimbursement rates differ, often
significantly, from the scheduled
rates.
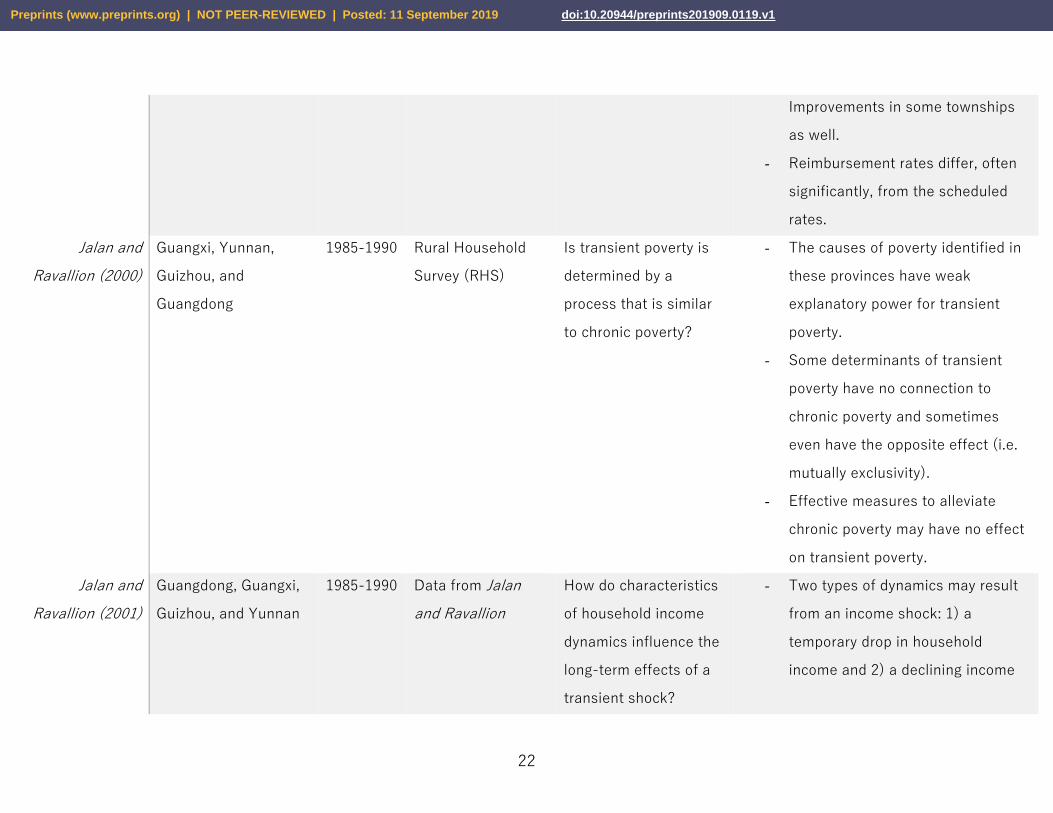
Jalan and
Ravallion (2000)
Guangxi, Yunnan,
Guizhou, and
Guangdong
1985-1990 Rural Household
Survey (RHS)
Is transient poverty is
determined by a
process that is similar
to chronic poverty?
- The causes of poverty identified in
these provinces have weak
explanatory power for transient
poverty.
- Some determinants of transient
poverty have no connection to
chronic poverty and sometimes
even have the opposite effect (i.e.
mutually exclusivity).
- Effective measures to alleviate
chronic poverty may have no effect
on transient poverty.
Jalan and
Ravallion (2001)
Guangdong, Guangxi,
Guizhou, and Yunnan
1985-1990 Data from Jalan
and Ravallion
How do characteristics
of household income
dynamics influence the
long-term effects of a
transient shock?
- Two types of dynamics may result
from an income shock: 1) a
temporary drop in household
income and 2) a declining income
Preprints (www.preprints.org) | NOT PEER-REVIEWED | Posted: 11 September 2019 doi:10.20944/preprints201909.0119.v1
23
(1998), Jalan and
Ravallion (1999)24
path, possibly leading to chronic
poverty.
Park et al. (2002) 592 national poverty
counties
1981-
199525
National panel data How effective is
regional targeting in
alleviating rural
poverty?
- While the coverage of policies has
improved, political factors have
affected targeting and leakage has
increased.
- The selection of ‘poor’ counties
may be politically biased.
Hannum (2003) Nationwide 1992 Rural component of
the National
Sample Survey of
the Situation of
Chinese Children
(1) How do local
community resources
influence educational
inequality? (2) In what
ways do village
characteristics affect
children?
- Village and household incomes and
village provision of junior high
schools impacted on children’s
enrollment probabilities.
- Village income effects did not
change with family income. i.e. the
effect of village income was
additive.
24 While the authors base their paper off of past results, they approach the data with improvements in quantitative methods,
outlined in the next section of this review.
25 The panel data is broken down into the time periods 1981–1985, 1985–1989, 1989–1992, and 1992–1995
Preprints (www.preprints.org) | NOT PEER-REVIEWED | Posted: 11 September 2019 doi:10.20944/preprints201909.0119.v1

24
Mcculloch and
Calandrino (2003)
Sichuan Province 1991-1995 Household Survey
Division of the
Rural Survey
Organization in the
National Bureau
Statistics (NBS)
How chronic is poverty
in China?
- 57% of the households experience
transient poverty (one or more
years of poverty).
- Geographic location has the most
significant impact on poverty
vulnerability26 as well as chronic
poverty.
- Household size is significantly
related to chronic poverty.
Ravallion and
Chen (2005)
20 project counties,
200 villages in
southwestern
provinces
1996-2000 Rural Household
Survey (RHS)
What is the savings
behavior of
beneficiaries of a large
poor-area development
project?
- A large share of the income gained
was saved by the participants in
the project over 5 years.
- Despite an overall gain income,
little to no impact on consumption
was found upon comparing the first
and final years of the project.
- The project’s effects on permanent
income are unknown.
Cheng (2007) Aohan, Nanzhao,
Zhuoquan, Linxian
Mid-2005 RHS (1) What factors affect
the household demand
- Microfinance projects in China
failed to target the poorest of the
26 The authors stress the need for a more location-dependent targeting mechanism.
Preprints (www.preprints.org) | NOT PEER-REVIEWED | Posted: 11 September 2019 doi:10.20944/preprints201909.0119.v1
25
Counties of Chifeng
Prefecture
for micro-loans in an
evolving economic
environment?
(2) How can we
understand the demand
of the poor for
microfinance from a
behavioral perspective?
(3) How effective and
far-reaching are
microfinance
institutions in targeting
the poor?
poor and have not made a positive
impact to poverty reduction.
- The demand for micro-loans is
positively correlated to household
income, opportunities for off-farm
investment and the educational
level of borrowers.
- Wealthier (middle-income and
above) rural households are the key
beneficiaries of microfinance
institutions.
- The institutions were effective in
reducing overall poverty despite the
targeting errors.
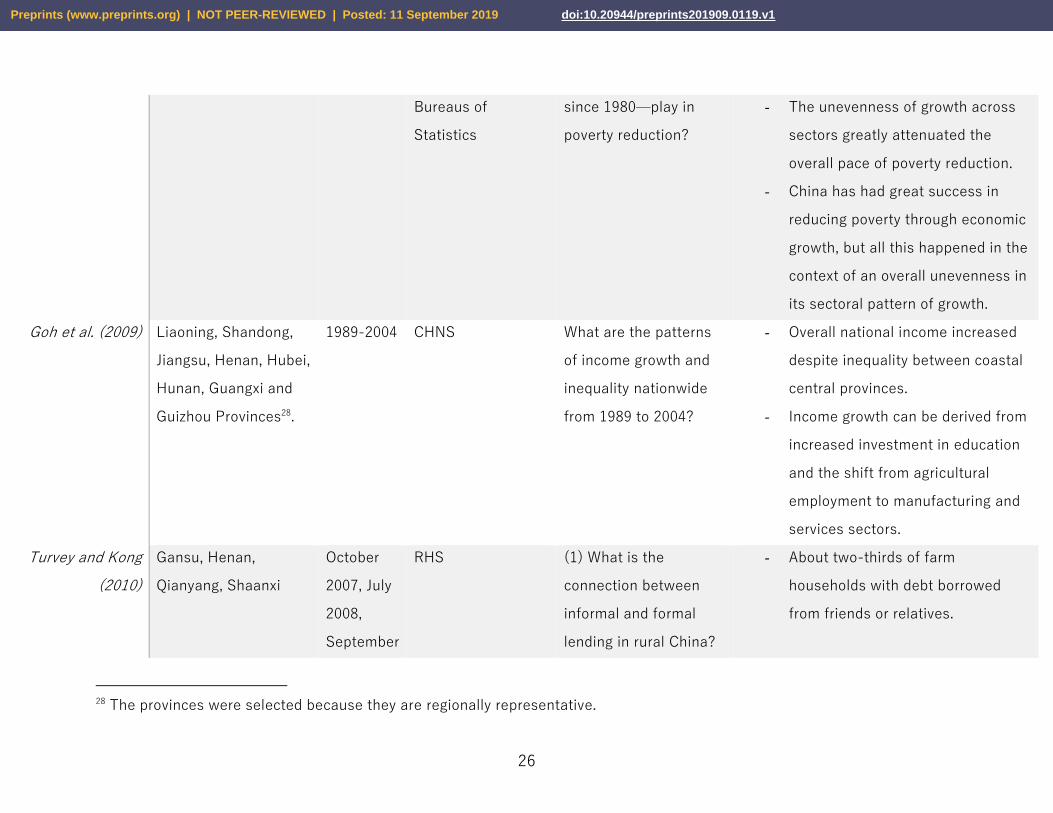
Montalvo and
Ravallion (2009)
All 23 provinces + 3
municipalities27
1983-2001 Sub-national panel
dataset constructed
by the authors and
China’s National
and Provincial
What role does
economic growth—
which has been highly
uneven across regions
- Agriculture has been the driving
force in poverty reduction, rather
than secondary (manufacturing) or
tertiary (services) sectors.
27 Beijing, Tianjin, and Shanghai. The authors also note that Chongquing, a newly created municipality at the time of writing,
offered limited amounts of data and was therefore not included in the empirical analysis.
Preprints (www.preprints.org) | NOT PEER-REVIEWED | Posted: 11 September 2019 doi:10.20944/preprints201909.0119.v1
26
Bureaus of
Statistics
since 1980—play in
poverty reduction?
- The unevenness of growth across
sectors greatly attenuated the
overall pace of poverty reduction.
- China has had great success in
reducing poverty through economic
growth, but all this happened in the
context of an overall unevenness in
its sectoral pattern of growth.
Goh et al. (2009) Liaoning, Shandong,
Jiangsu, Henan, Hubei,
Hunan, Guangxi and
Guizhou Provinces28.
1989-2004 CHNS What are the patterns
of income growth and
inequality nationwide
from 1989 to 2004?
- Overall national income increased
despite inequality between coastal
central provinces.
- Income growth can be derived from
increased investment in education
and the shift from agricultural
employment to manufacturing and
services sectors.
Turvey and Kong
(2010)
Gansu, Henan,
Qianyang, Shaanxi
October
2007, July
2008,
September
RHS (1) What is the
connection between
informal and formal
lending in rural China?
- About two-thirds of farm
households with debt borrowed
from friends or relatives.
28 The provinces were selected because they are regionally representative.
Preprints (www.preprints.org) | NOT PEER-REVIEWED | Posted: 11 September 2019 doi:10.20944/preprints201909.0119.v1
27
2008,
October
2008
(2) How might the
strength of informal
lending affect
microfinance?
- Informal borrowing may be
preferred to formal borrowing29.
Duclos et al.
(2010)
Anhui, Gansu,
Guangdong, Henan,
Hunan, Jiangsu, Jilin,
Shanxi, and Sichuan
1986-2002 Survey data
conducted annually
by China’s
Research Center for
Rural Economy
(RCRE)
How can better
statistical and empirical
methods be employed
to more accurately
measure transient and
chronic poverty?
- Different poverty measurements
yield significantly different
estimates of chronic and transient
poverty.
Park and Wang
(2010)
Six unnamed
provinces
2001-2004 A subset of the
National Bureau of
Statistics (NBS)
annual RHS
How effective is
community-based
development (poor
village investment
program)?
- The program generally increased
both governmental and village
investments.
- While the program did not increase
the income or consumption of
poorer households, it did increase
29 The authors point out that cultural factors and the role of trust is a key determinant of informal borrowing dynamics in rural
China. To demonstrate this point, they compare informal borrowing preferences outcomes from this study with a study in four
Indian districts and found that Chinese farmers, on average, is much more inclined to borrow from family and relatives
compared to Indian farmers (see Kumar, C. (2009) “Credit Rationing and The Economics Of Informal Lending: Theoretical
Results and Econometric Inferences Using the Household Surveys From
China and India”. Unpublished PhD Dissertation. Cornell University August 2009.)
Preprints (www.preprints.org) | NOT PEER-REVIEWED | Posted: 11 September 2019 doi:10.20944/preprints201909.0119.v1
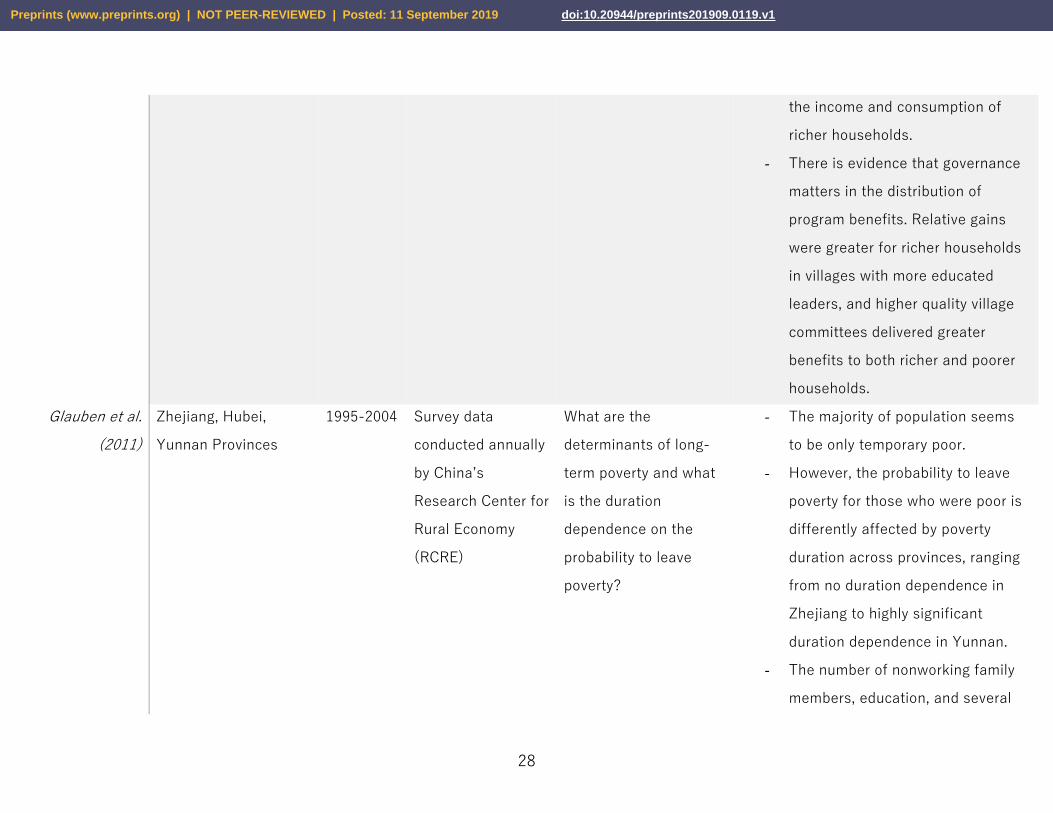
28
the income and consumption of
richer households.
- There is evidence that governance
matters in the distribution of
program benefits. Relative gains
were greater for richer households
in villages with more educated
leaders, and higher quality village
committees delivered greater
benefits to both richer and poorer
households.
Glauben et al.
(2011)
Zhejiang, Hubei,
Yunnan Provinces
1995-2004 Survey data
conducted annually
by China’s
Research Center for
Rural Economy
(RCRE)
What are the
determinants of long-
term poverty and what
is the duration
dependence on the
probability to leave
poverty?
- The majority of population seems
to be only temporary poor.
- However, the probability to leave
poverty for those who were poor is
differently affected by poverty
duration across provinces, ranging
from no duration dependence in
Zhejiang to highly significant
duration dependence in Yunnan.
- The number of nonworking family
members, education, and several
Preprints (www.preprints.org) | NOT PEER-REVIEWED | Posted: 11 September 2019 doi:10.20944/preprints201909.0119.v1
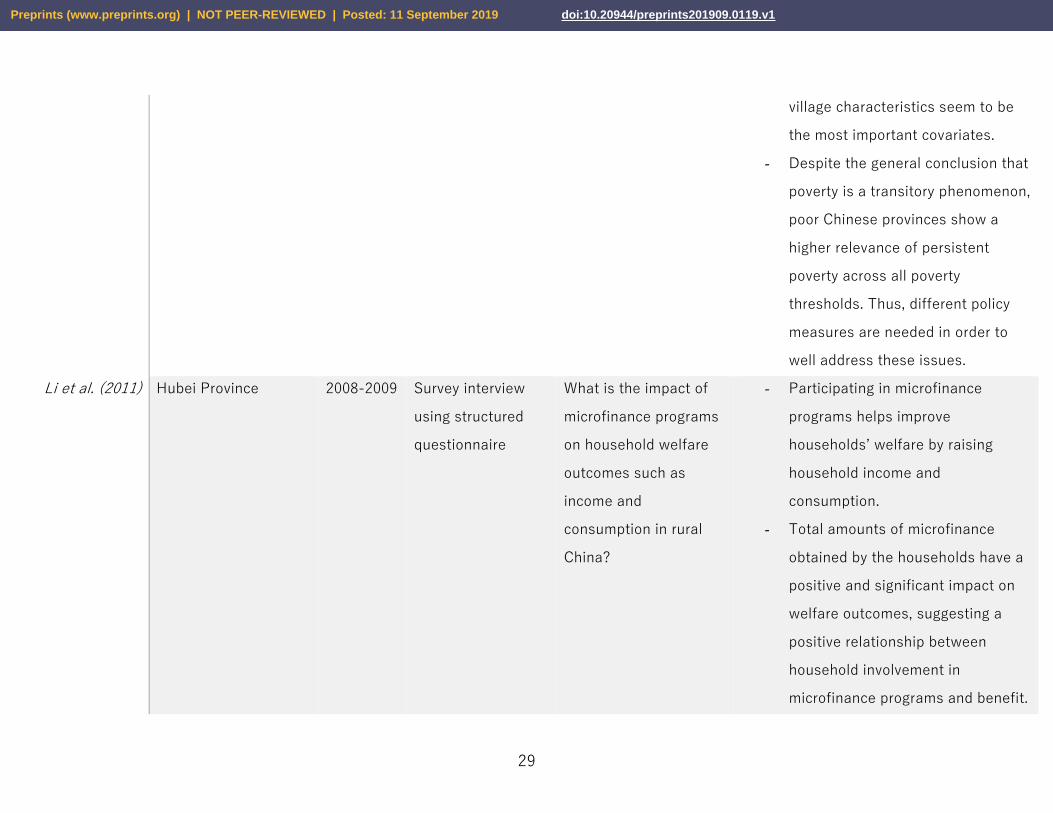
29
village characteristics seem to be
the most important covariates.
- Despite the general conclusion that
poverty is a transitory phenomenon,
poor Chinese provinces show a
higher relevance of persistent
poverty across all poverty
thresholds. Thus, different policy
measures are needed in order to
well address these issues.
Li et al. (2011) Hubei Province 2008-2009 Survey interview
using structured
questionnaire
What is the impact of
microfinance programs
on household welfare
outcomes such as
income and
consumption in rural
China?
- Participating in microfinance
programs helps improve
households’ welfare by raising
household income and
consumption.
- Total amounts of microfinance
obtained by the households have a
positive and significant impact on
welfare outcomes, suggesting a
positive relationship between
household involvement in
microfinance programs and benefit.
Preprints (www.preprints.org) | NOT PEER-REVIEWED | Posted: 11 September 2019 doi:10.20944/preprints201909.0119.v1
30
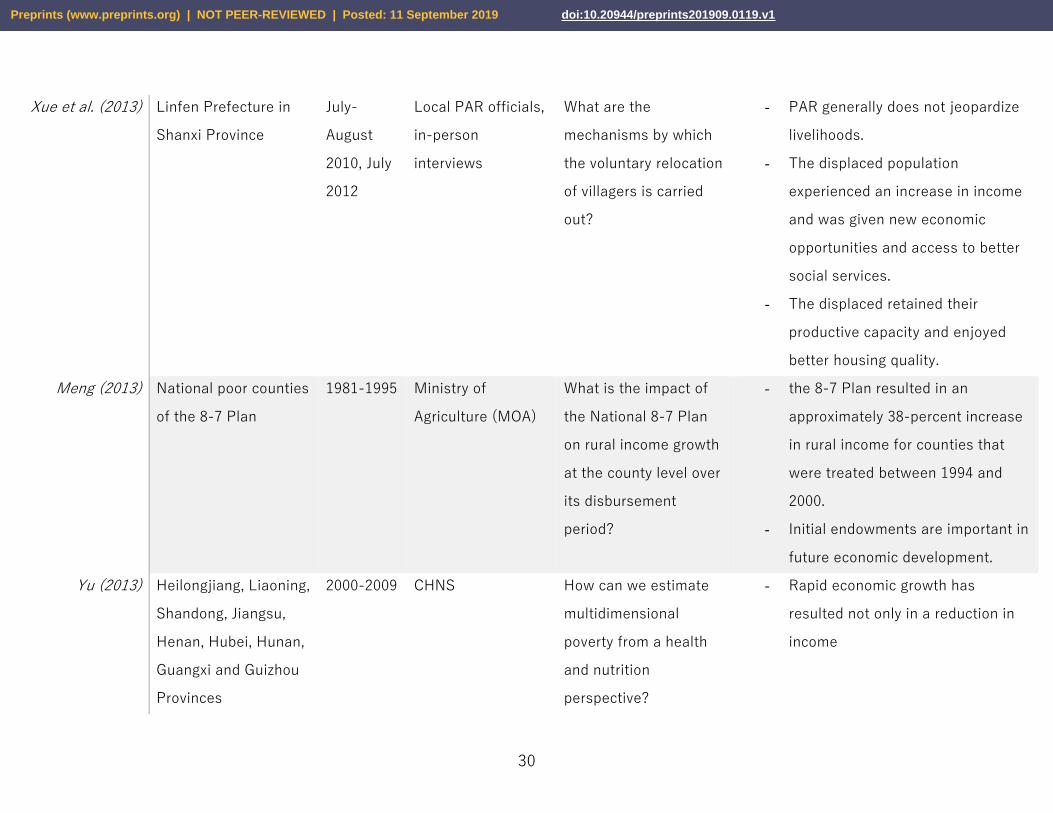
Xue et al. (2013) Linfen Prefecture in
Shanxi Province
July-
August
2010, July
2012
Local PAR officials,
in-person
interviews
What are the
mechanisms by which
the voluntary relocation
of villagers is carried
out?
- PAR generally does not jeopardize
livelihoods.
- The displaced population
experienced an increase in income
and was given new economic
opportunities and access to better
social services.
- The displaced retained their
productive capacity and enjoyed
better housing quality.
Meng (2013) National poor counties
of the 8-7 Plan
1981-1995 Ministry of
Agriculture (MOA)
What is the impact of
the National 8-7 Plan
on rural income growth
at the county level over
its disbursement
period?
- the 8-7 Plan resulted in an
approximately 38-percent increase
in rural income for counties that
were treated between 1994 and
2000.
- Initial endowments are important in
future economic development.
Yu (2013) Heilongjiang, Liaoning,
Shandong, Jiangsu,
Henan, Hubei, Hunan,
Guangxi and Guizhou
Provinces
2000-2009 CHNS How can we estimate
multidimensional
poverty from a health
and nutrition
perspective?
- Rapid economic growth has
resulted not only in a reduction in
income
Preprints (www.preprints.org) | NOT PEER-REVIEWED | Posted: 11 September 2019 doi:10.20944/preprints201909.0119.v1

31
- Poverty but also in a reduction in
multidimensional poverty in the last
decade.
- However, there are disparities
across provinces and between
urban and rural areas (poverty is
1.5 times higher in rural areas than
in urban ones in 2009)
Rogers (2014) Ji County, Shanxi
Province
2012, 2013 Survey interview
using structured
questionnaire
What is the pattern of
resource allocation in
terms of poverty
alleviation and rural
development in one of
China's poverty
counties?
- The county government is ‘betting
on the strong’: concentrating
resources in villages with better
existing conditions or potential for
development.
- Unfortunately, the poorer villages
who are in greater need, suffer
from an inequitable resource
allocation.
You (2014) Jiangsu, Shandong,
Henan, Hubei, Hunan,
Guangxi and Guizhou
Provinces
1989,
1991,
1993,
1997,
China Health and
Nutrition Survey
(CHNS)
How can we better
understand the
persistent hardship in
some Chinese rural
households from the
- Overall, households' responses to
uninsured shocks and risk cause
inefficiencies and deficiencies of
investment in agricultural asset
accumulation.
Preprints (www.preprints.org) | NOT PEER-REVIEWED | Posted: 11 September 2019 doi:10.20944/preprints201909.0119.v1

32
2000, 2004
and 2006
perspective of assets,
stressing the long-run
implications of shocks
and risk on households'
agricultural asset
holdings (i.e. why has
poverty persisted)?
- Multiple equilibria in the dynamics
of household agricultural assets as
well as under-investment as a
response to risk make some
households less able to earn
income above the poverty line and
keep them trapped in long-term
low-equilibrium asset poverty.
You and Annim
(2014)
Gansu Province 2000, 2004 Gansu Survey of
Children and
Families (GSCF)
What are the effects of
formal microcredit
programs on children’s
educational outcomes
in northwest rural
China?
- There is a significant positive
impact of microcredit on children’s
schooling years in 2000 only.
- There appears to be no relationship
between academic performance
and microcredit programs in both
2000 and 2004.
- In the long term, microcredit has
the positive effects of both longer
schooling years.
- Formal microcredit appears to
improve education in long term
compared to the short term.
Preprints (www.preprints.org) | NOT PEER-REVIEWED | Posted: 11 September 2019 doi:10.20944/preprints201909.0119.v1
33
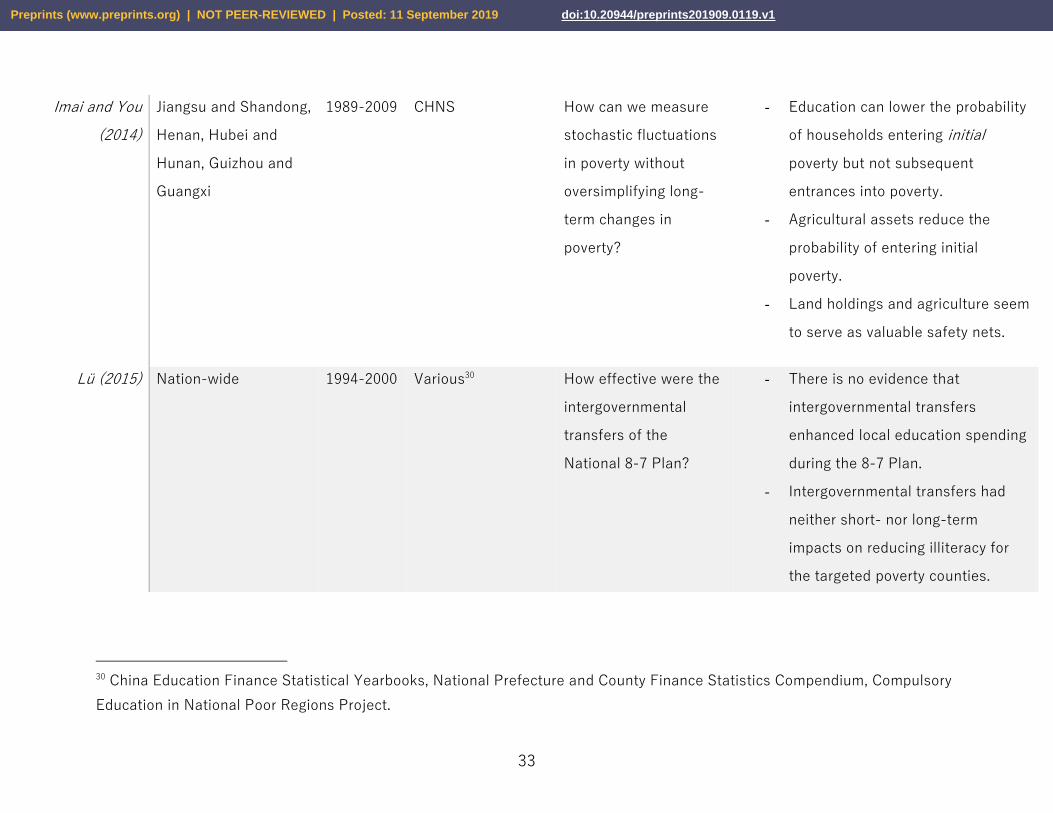
Imai and You
(2014)
Jiangsu and Shandong,
Henan, Hubei and
Hunan, Guizhou and
Guangxi
1989-2009 CHNS How can we measure
stochastic fluctuations
in poverty without
oversimplifying long-
term changes in
poverty?
- Education can lower the probability
of households entering initial
poverty but not subsequent
entrances into poverty.
- Agricultural assets reduce the
probability of entering initial
poverty.
- Land holdings and agriculture seem
to serve as valuable safety nets.
Lü (2015) Nation-wide 1994-2000 Various30 How effective were the
intergovernmental
transfers of the
National 8-7 Plan?
- There is no evidence that
intergovernmental transfers
enhanced local education spending
during the 8-7 Plan.
- Intergovernmental transfers had
neither short- nor long-term
impacts on reducing illiteracy for
the targeted poverty counties.
30 China Education Finance Statistical Yearbooks, National Prefecture and County Finance Statistics Compendium, Compulsory
Education in National Poor Regions Project.
Preprints (www.preprints.org) | NOT PEER-REVIEWED | Posted: 11 September 2019 doi:10.20944/preprints201909.0119.v1
34
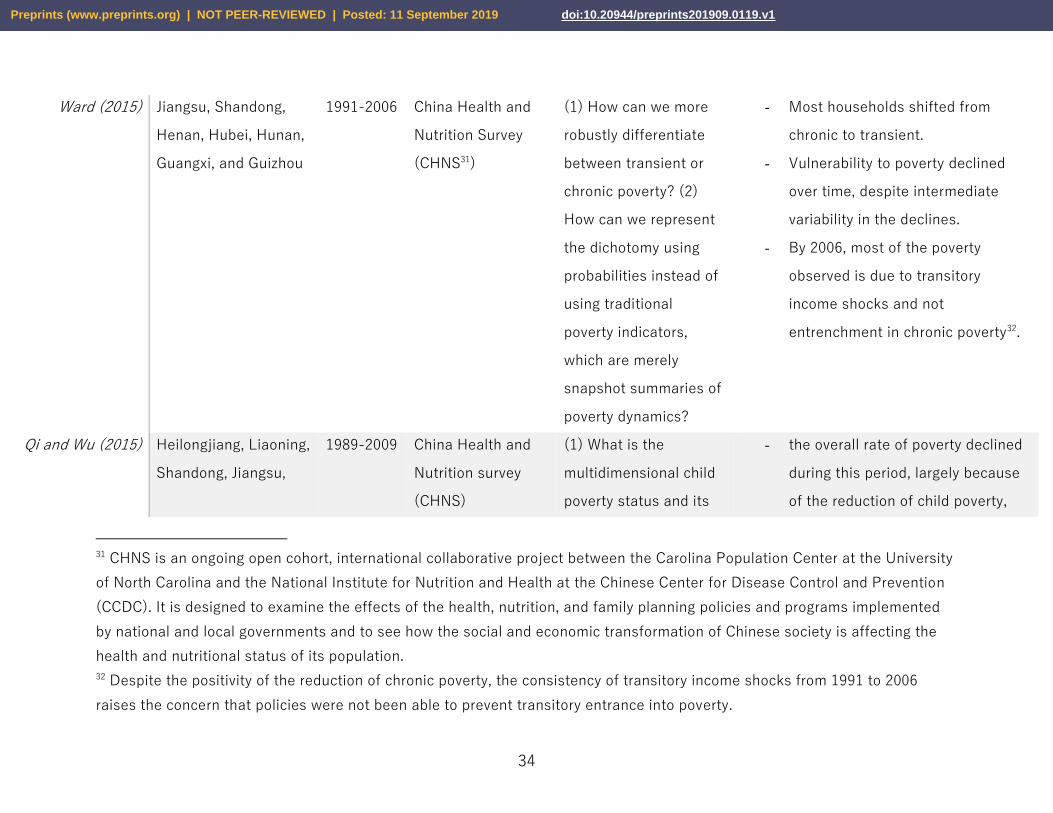
Ward (2015) Jiangsu, Shandong,
Henan, Hubei, Hunan,
Guangxi, and Guizhou
1991-2006 China Health and
Nutrition Survey
(CHNS31)
(1) How can we more
robustly differentiate
between transient or
chronic poverty? (2)
How can we represent
the dichotomy using
probabilities instead of
using traditional
poverty indicators,
which are merely
snapshot summaries of
poverty dynamics?
- Most households shifted from
chronic to transient.
- Vulnerability to poverty declined
over time, despite intermediate
variability in the declines.
- By 2006, most of the poverty
observed is due to transitory
income shocks and not
entrenchment in chronic poverty32.
Qi and Wu (2015) Heilongjiang, Liaoning,
Shandong, Jiangsu,
1989-2009 China Health and
Nutrition survey
(CHNS)
(1) What is the
multidimensional child
poverty status and its
- the overall rate of poverty declined
during this period, largely because
of the reduction of child poverty,
31 CHNS is an ongoing open cohort, international collaborative project between the Carolina Population Center at the University
of North Carolina and the National Institute for Nutrition and Health at the Chinese Center for Disease Control and Prevention
(CCDC). It is designed to examine the effects of the health, nutrition, and family planning policies and programs implemented
by national and local governments and to see how the social and economic transformation of Chinese society is affecting the
health and nutritional status of its population.
32 Despite the positivity of the reduction of chronic poverty, the consistency of transitory income shocks from 1991 to 2006
raises the concern that policies were not been able to prevent transitory entrance into poverty.
Preprints (www.preprints.org) | NOT PEER-REVIEWED | Posted: 11 September 2019 doi:10.20944/preprints201909.0119.v1

35
Henan, Hubei, Hunan,
Guizhou and Guangxi
dynamic changes in
China from 1989 to
2009? (2) Do certain
geographic regions
receive more poverty
alleviation than others?
signifying an improvement in child
living conditions.
- All poverty headcount ratios in
different provinces were reduced
over time, but provinces with
middle economic growth rates
oversaw the largest reduction in
child multidimensional poverty.
- Multidimensional poverty rates
decreased in both urban and rural
areas, and the gap between the two
have been reduced.
Wilmsen and
Wang (2015)
Linfen Prefecture,
Shanxi
2003-2012 Local PAR officials,
in-person
interviews
Is there really a
dichotomy between
voluntary and
involuntary poverty
alleviation
resettlement?
- A people-centered approach, not
volition is the driver of improved
outcomes in PAR.
- While volition was not different
between the PAR and the Three
Gorges Project, the aims and
beneficiaries, the identification of
population and affected poverty
sites, integration into broader
national development plans, and
Preprints (www.preprints.org) | NOT PEER-REVIEWED | Posted: 11 September 2019 doi:10.20944/preprints201909.0119.v1
36
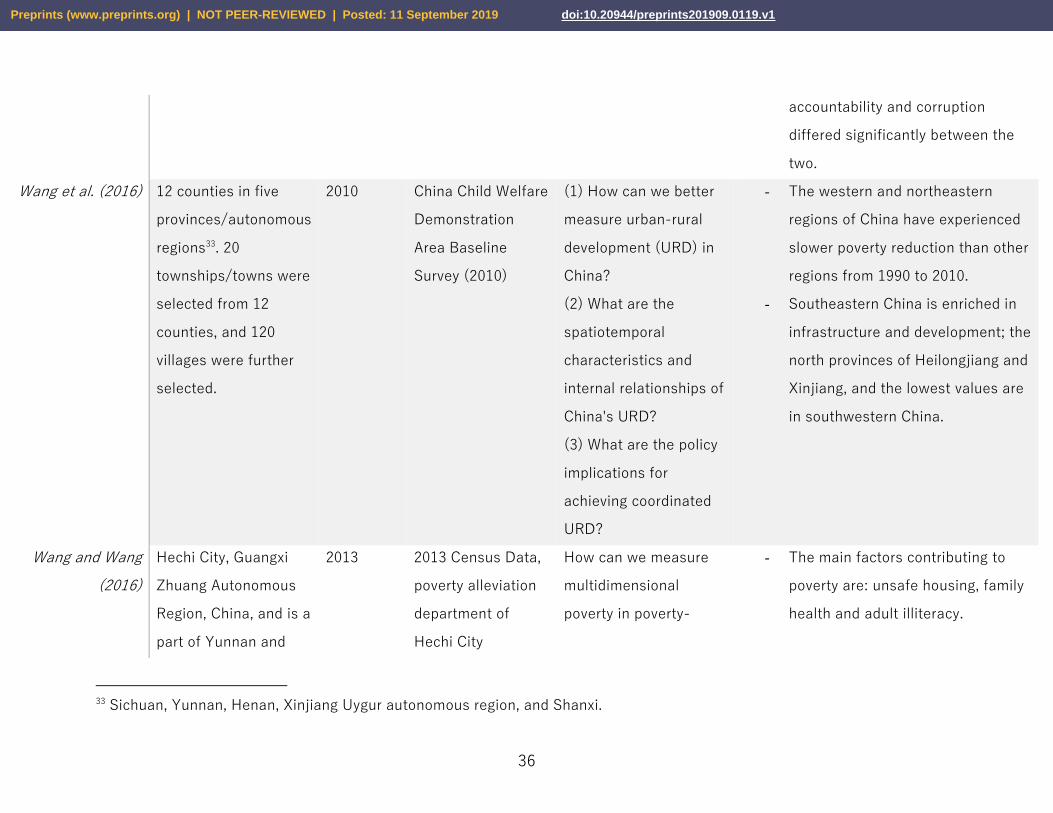
accountability and corruption
differed significantly between the
two.
Wang et al. (2016) 12 counties in five
provinces/autonomous
regions33. 20
townships/towns were
selected from 12
counties, and 120
villages were further
selected.
2010 China Child Welfare
Demonstration
Area Baseline
Survey (2010)
(1) How can we better
measure urban-rural
development (URD) in
China?
(2) What are the
spatiotemporal
characteristics and
internal relationships of
China's URD?
(3) What are the policy
implications for
achieving coordinated
URD?
- The western and northeastern
regions of China have experienced
slower poverty reduction than other
regions from 1990 to 2010.
- Southeastern China is enriched in
infrastructure and development; the
north provinces of Heilongjiang and
Xinjiang, and the lowest values are
in southwestern China.
Wang and Wang
(2016)
Hechi City, Guangxi
Zhuang Autonomous
Region, China, and is a
part of Yunnan and
2013 2013 Census Data,
poverty alleviation
department of
Hechi City
How can we measure
multidimensional
poverty in poverty-
- The main factors contributing to
poverty are: unsafe housing, family
health and adult illiteracy.
33 Sichuan, Yunnan, Henan, Xinjiang Uygur autonomous region, and Shanxi.
Preprints (www.preprints.org) | NOT PEER-REVIEWED | Posted: 11 September 2019 doi:10.20944/preprints201909.0119.v1

37
Guangxi and Guizhou
rocky desertification
areas.
stricken counties in
rural China?
- Multidimensional poverty indexes
increased with an increasing
degree of desertification and rocky
desertification, corroborating
previous findings that
multidimensional poverty is strongly
region-dependent.
Yang et al. (2016) Shaanxi Province 2013 5th National Health
Service Survey of
Shaanxi Province
What are the effects of
the New Cooperative
Medical Scheme
(NCMS) on alleviating
financial-induced
health rural poverty?
- While the NCMS can alleviate
health poverty, the coverage is
lacking— the benefits of the NCMS
is greater for hospital admission-
insured than for general-insured;
serious diseases as well as more
common illnesses should receive
equal attention.
Golan et al.
(2017)
Hebei, Jiangsu,
Zhejiang, Anhui,
Henan, Hubei,
Guangdong,
Chongqing, and
Sichuan
2007-2009 CHIP survey What are the targeted
poverty reduction
implications of China’s
rural dibao program?
- The rural dibao program provided
sufficient income to poor
beneficiaries, but the overall impact
on poverty was small.
- Although total dibao expenditures
are fairly large relative to the
poverty gap, the program did not
Preprints (www.preprints.org) | NOT PEER-REVIEWED | Posted: 11 September 2019 doi:10.20944/preprints201909.0119.v1
38
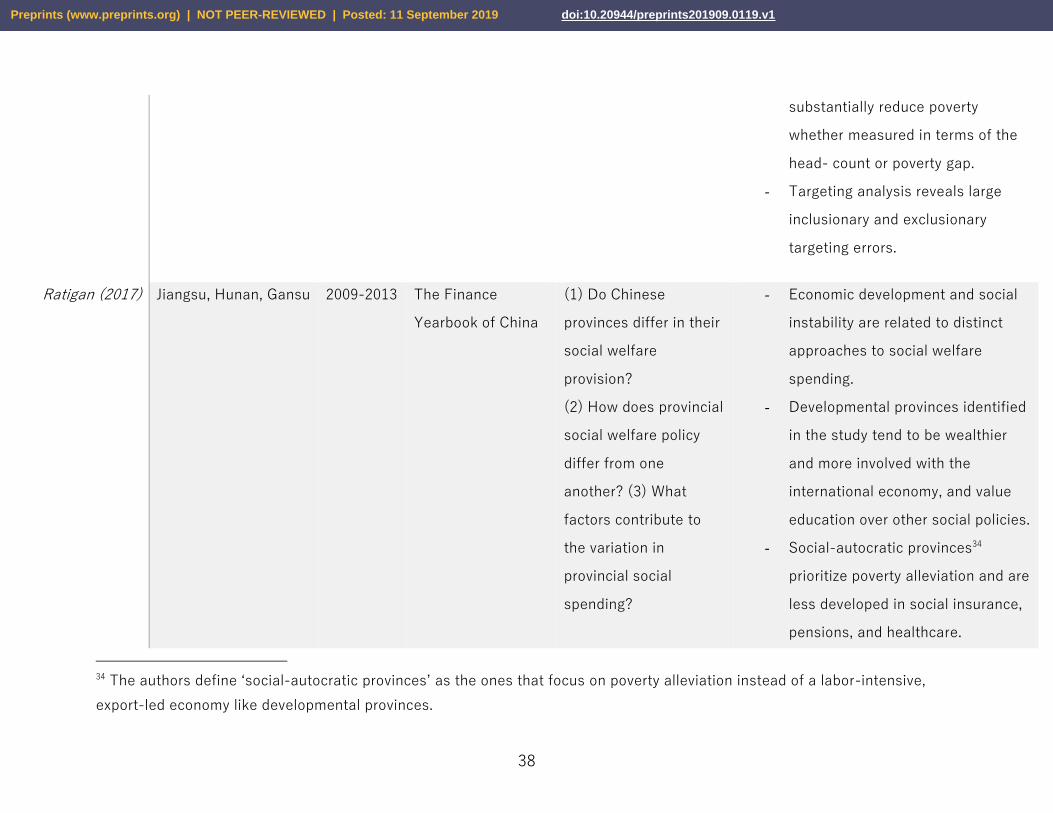
substantially reduce poverty
whether measured in terms of the
head- count or poverty gap.
- Targeting analysis reveals large
inclusionary and exclusionary
targeting errors.
Ratigan (2017) Jiangsu, Hunan, Gansu 2009-2013 The Finance
Yearbook of China
(1) Do Chinese
provinces differ in their
social welfare
provision?
(2) How does provincial
social welfare policy
differ from one
another? (3) What
factors contribute to
the variation in
provincial social
spending?
- Economic development and social
instability are related to distinct
approaches to social welfare
spending.
- Developmental provinces identified
in the study tend to be wealthier
and more involved with the
international economy, and value
education over other social policies.
- Social-autocratic provinces34
prioritize poverty alleviation and are
less developed in social insurance,
pensions, and healthcare.
34 The authors define ‘social-autocratic provinces’ as the ones that focus on poverty alleviation instead of a labor-intensive,
export-led economy like developmental provinces.
Preprints (www.preprints.org) | NOT PEER-REVIEWED | Posted: 11 September 2019 doi:10.20944/preprints201909.0119.v1

39
Ren et al. (2017) 13 contiguous poverty-
stricken counties
designated in 201135
2013 State council
leading group office
of poverty
alleviation and
development
(CPAD)
What are the
geographical patterns
in rural poverty at the
county level? How do
we estimate the effects
of socioeconomic
predictors of poverty
incidence?
- Poverty incidence was negatively
associated with rural income,
urbanization and education36 in the
13 poverty-stricken counties.
- Urbanization policy did not
incorporate the development of
poverty-stricken rural areas.
- Investment in senior high schools in
rural Yunnan Province could
significantly contribute to poverty
reduction.
- Irrigation is negatively correlated
with poverty, although there is
variability.
Zhang et al.
(2017)
11 western provinces
(unnamed)
Late
2000s
Data from a joint
research project
administered by the
Ministry of Science
of Technology of
What is the relationship
between social capital
and households’
probability of living
under poverty?
- Social assets such as business ties,
political connections, and social
organizations can contribute
significantly to poverty reduction.
35 The authors note that the fourteenth contiguous poverty county, Tibet, was excluded due to unavailability of data.
36 Gross enrolment ratio of senior high school students
Preprints (www.preprints.org) | NOT PEER-REVIEWED | Posted: 11 September 2019 doi:10.20944/preprints201909.0119.v1

40
China and Norway
Fafo Institute
- The uneven distribution of social
resources significantly impacts the
probability of living in poverty.
- More upper-reaching social
connections can help rural
households overcome economic
constraints.
Liu et al. (2017) 14 contiguous poverty
counties
197837,
2000-2015
2015 Yearbook of
China's Poverty
Alleviation and
Development,
Poverty Monitoring
Report of Rural
China, China Rural
Statistical
Yearbook
What is the spatial
distribution of rural
poverty in China?
- Poverty is manifested as spatially
“clustered” regions
(agglomerations).
- Poverty is concentrated in rocky
mountainous areas, consistent with
previous results. The majority of
these areas remain plagued with
both chronic and transient poverty.
- The “islanding effect”—that is, the
isolation of destitute areas that
lack public infrastructure and
37 Data from 1978 and 2014 are derived from a previous study (for details see Li, Z., Wu, G., Wang, S., Sun, R., Hu, S., 2007.
China's poverty alleviation performance and its factors. In: Li, Z. (Ed.), Anti-poverty and Sustainable Development in China.
Science Press, Beijing, pp. 225e274)
Preprints (www.preprints.org) | NOT PEER-REVIEWED | Posted: 11 September 2019 doi:10.20944/preprints201909.0119.v1
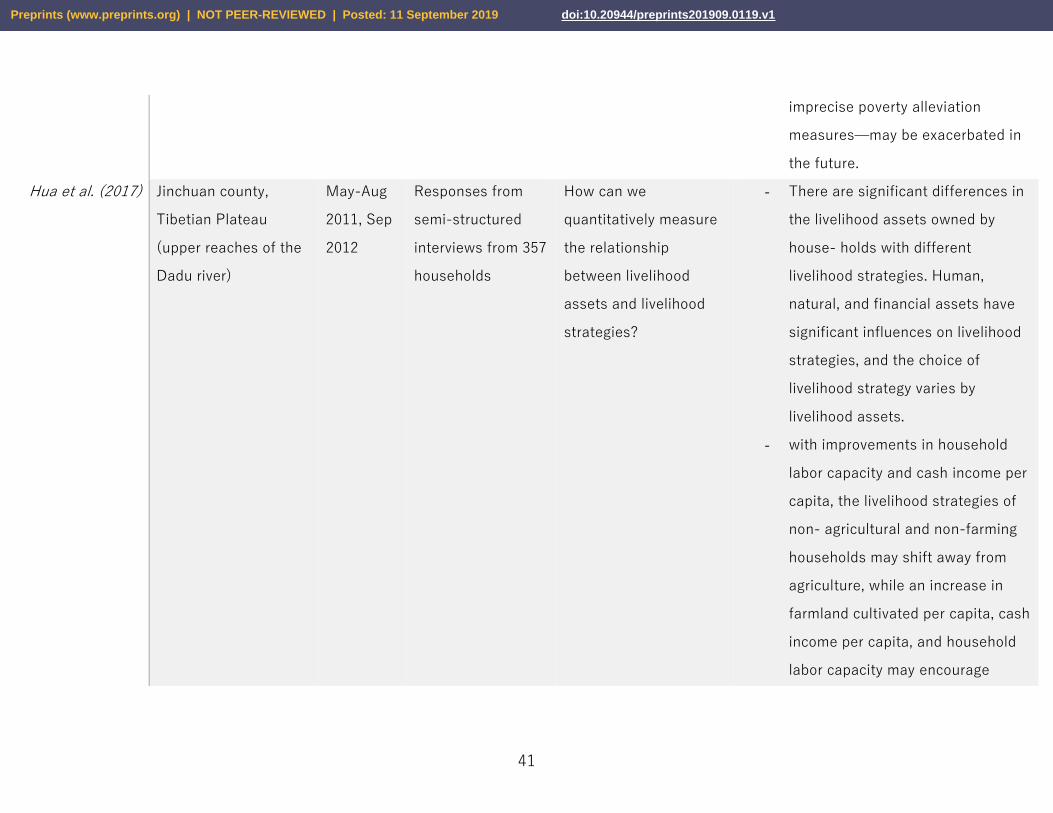
41
imprecise poverty alleviation
measures—may be exacerbated in
the future.
Hua et al. (2017) Jinchuan county,
Tibetian Plateau
(upper reaches of the
Dadu river)
May-Aug
2011, Sep
2012
Responses from
semi-structured
interviews from 357
households
How can we
quantitatively measure
the relationship
between livelihood
assets and livelihood
strategies?
- There are significant differences in
the livelihood assets owned by
house- holds with different
livelihood strategies. Human,
natural, and financial assets have
significant influences on livelihood
strategies, and the choice of
livelihood strategy varies by
livelihood assets.
- with improvements in household
labor capacity and cash income per
capita, the livelihood strategies of
non- agricultural and non-farming
households may shift away from
agriculture, while an increase in
farmland cultivated per capita, cash
income per capita, and household
labor capacity may encourage
Preprints (www.preprints.org) | NOT PEER-REVIEWED | Posted: 11 September 2019 doi:10.20944/preprints201909.0119.v1

42
households to adopt agriculture-
dependent livelihood strategies
Alkire and Shen
(2018)
Liaoning, Shanghai,
Guangdong, Henan
and Gansu Provinces
2010-2014 China Family Panel
Studies (CFPS)
What are the national
levels of rural
multidimensional
poverty?
- Dimensions such as nutrition,
education, safe drinking water and
cooking fuel aggravate overall non-
fiscal poverty.
Alkire and Fang
(2018)
Liaoning, Heilongjiang,
Jiangsu, Shandong,
Henan, Hubei, Hunan,
Guangxi, and Guizhou
All 9
rounds of
the
CHNS38
China Health and
Nutrition Survey
(CHNS)
How can we paint a
more complete picture
of poverty in rural China
by combining traditional
income poverty
measures and new
multidimensional
poverty measures?
- both the income poverty and
multidimensional poverty decline
quickly as the time goes, and rural
multidimensional poverty is more
severe than urban areas, especially
in sanitation, drinking water and
cooking fuel, it mainly attributes to
the segregation produced by the
China’s registration system and its
induced formed rural living habits,
lagged infrastructure construction
and high transformation costs.
38 1989, 1991, 1993, 1997, 2000, 2004, 2006, 2009, and 2011
Preprints (www.preprints.org) | NOT PEER-REVIEWED | Posted: 11 September 2019 doi:10.20944/preprints201909.0119.v1
43
- rural education and rural
malnutrition is still not very
optimistic.
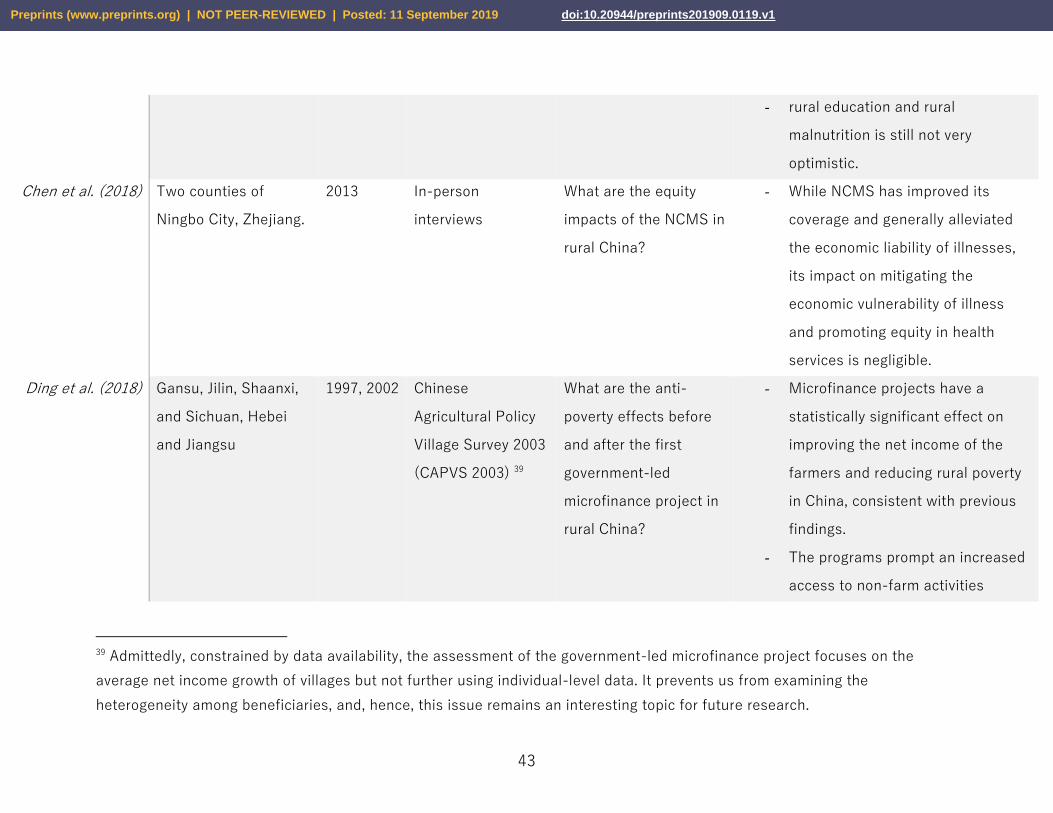
Chen et al. (2018) Two counties of
Ningbo City, Zhejiang.
2013 In-person
interviews
What are the equity
impacts of the NCMS in
rural China?
- While NCMS has improved its
coverage and generally alleviated
the economic liability of illnesses,
its impact on mitigating the
economic vulnerability of illness
and promoting equity in health
services is negligible.
Ding et al. (2018) Gansu, Jilin, Shaanxi,
and Sichuan, Hebei
and Jiangsu
1997, 2002 Chinese
Agricultural Policy
Village Survey 2003
(CAPVS 2003) 39
What are the anti-
poverty effects before
and after the first
government-led
microfinance project in
rural China?
- Microfinance projects have a
statistically significant effect on
improving the net income of the
farmers and reducing rural poverty
in China, consistent with previous
findings.
- The programs prompt an increased
access to non-farm activities
39 Admittedly, constrained by data availability, the assessment of the government-led microfinance project focuses on the
average net income growth of villages but not further using individual-level data. It prevents us from examining the
heterogeneity among beneficiaries, and, hence, this issue remains an interesting topic for future research.
Preprints (www.preprints.org) | NOT PEER-REVIEWED | Posted: 11 September 2019 doi:10.20944/preprints201909.0119.v1
44
instead of the reliance on the
growth of the farm sector.
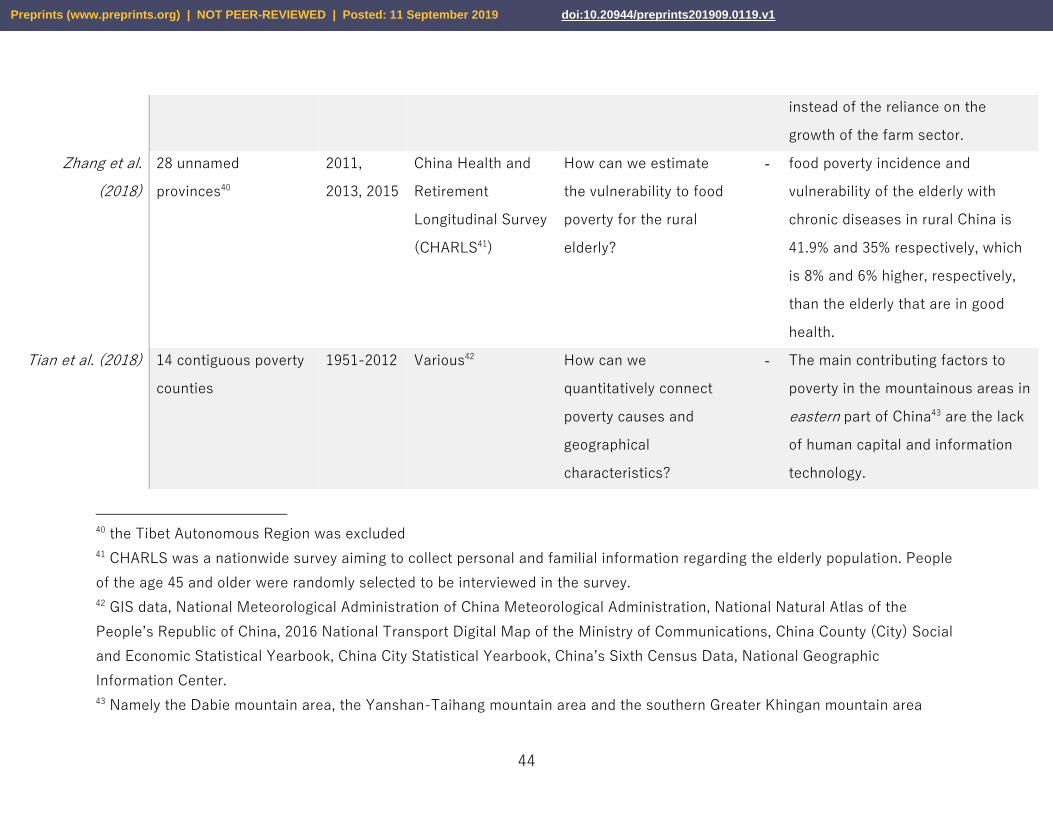
Zhang et al.
(2018)
28 unnamed
provinces40
2011,
2013, 2015
China Health and
Retirement
Longitudinal Survey
(CHARLS41)
How can we estimate
the vulnerability to food
poverty for the rural
elderly?
- food poverty incidence and
vulnerability of the elderly with
chronic diseases in rural China is
41.9% and 35% respectively, which
is 8% and 6% higher, respectively,
than the elderly that are in good
health.
Tian et al. (2018) 14 contiguous poverty
counties
1951-2012 Various42 How can we
quantitatively connect
poverty causes and
geographical
characteristics?
- The main contributing factors to
poverty in the mountainous areas in
eastern part of China43 are the lack
of human capital and information
technology.
40 the Tibet Autonomous Region was excluded
41 CHARLS was a nationwide survey aiming to collect personal and familial information regarding the elderly population. People
of the age 45 and older were randomly selected to be interviewed in the survey.
42 GIS data, National Meteorological Administration of China Meteorological Administration, National Natural Atlas of the
People’s Republic of China, 2016 National Transport Digital Map of the Ministry of Communications, China County (City) Social
and Economic Statistical Yearbook, China City Statistical Yearbook, China’s Sixth Census Data, National Geographic
Information Center.
43 Namely the Dabie mountain area, the Yanshan-Taihang mountain area and the southern Greater Khingan mountain area
Preprints (www.preprints.org) | NOT PEER-REVIEWED | Posted: 11 September 2019 doi:10.20944/preprints201909.0119.v1
45
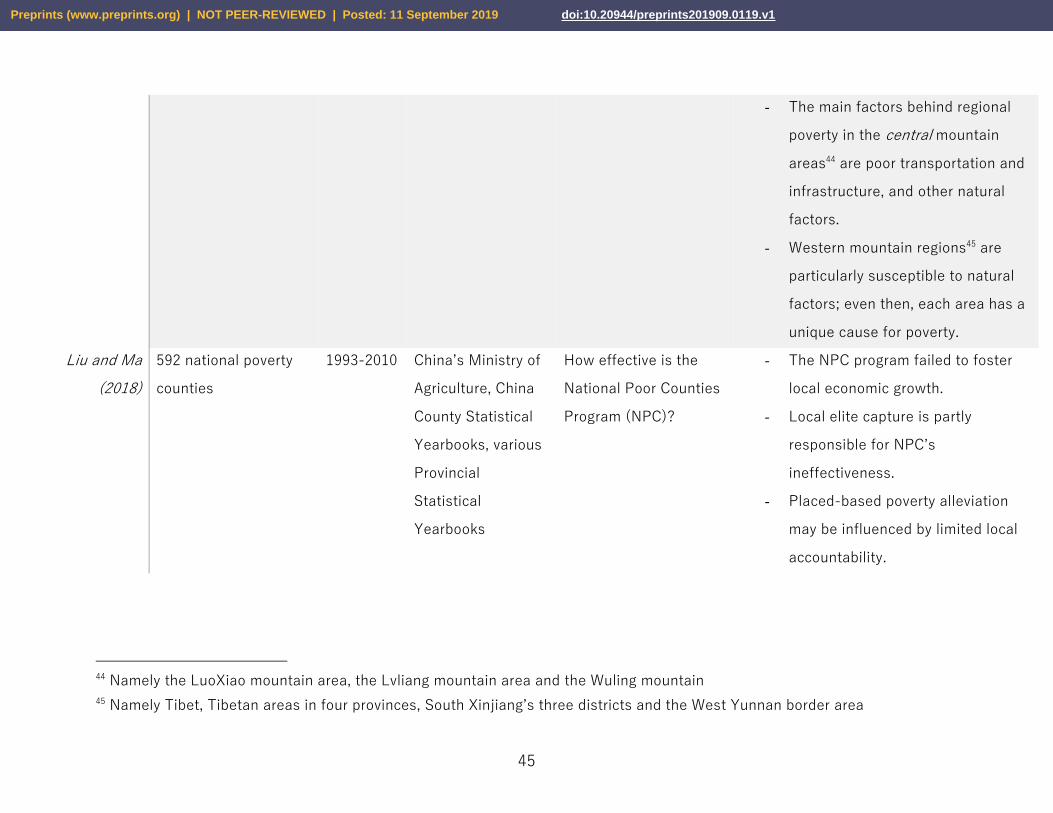
- The main factors behind regional
poverty in the central mountain
areas44 are poor transportation and
infrastructure, and other natural
factors.
- Western mountain regions45 are
particularly susceptible to natural
factors; even then, each area has a
unique cause for poverty.
Liu and Ma
(2018)
592 national poverty
counties
1993-2010 China’s Ministry of
Agriculture, China
County Statistical
Yearbooks, various
Provincial
Statistical
Yearbooks
How effective is the
National Poor Counties
Program (NPC)?
- The NPC program failed to foster
local economic growth.
- Local elite capture is partly
responsible for NPC’s
ineffectiveness.
- Placed-based poverty alleviation
may be influenced by limited local
accountability.
44 Namely the LuoXiao mountain area, the Lvliang mountain area and the Wuling mountain
45 Namely Tibet, Tibetan areas in four provinces, South Xinjiang’s three districts and the West Yunnan border area
Preprints (www.preprints.org) | NOT PEER-REVIEWED | Posted: 11 September 2019 doi:10.20944/preprints201909.0119.v1
46
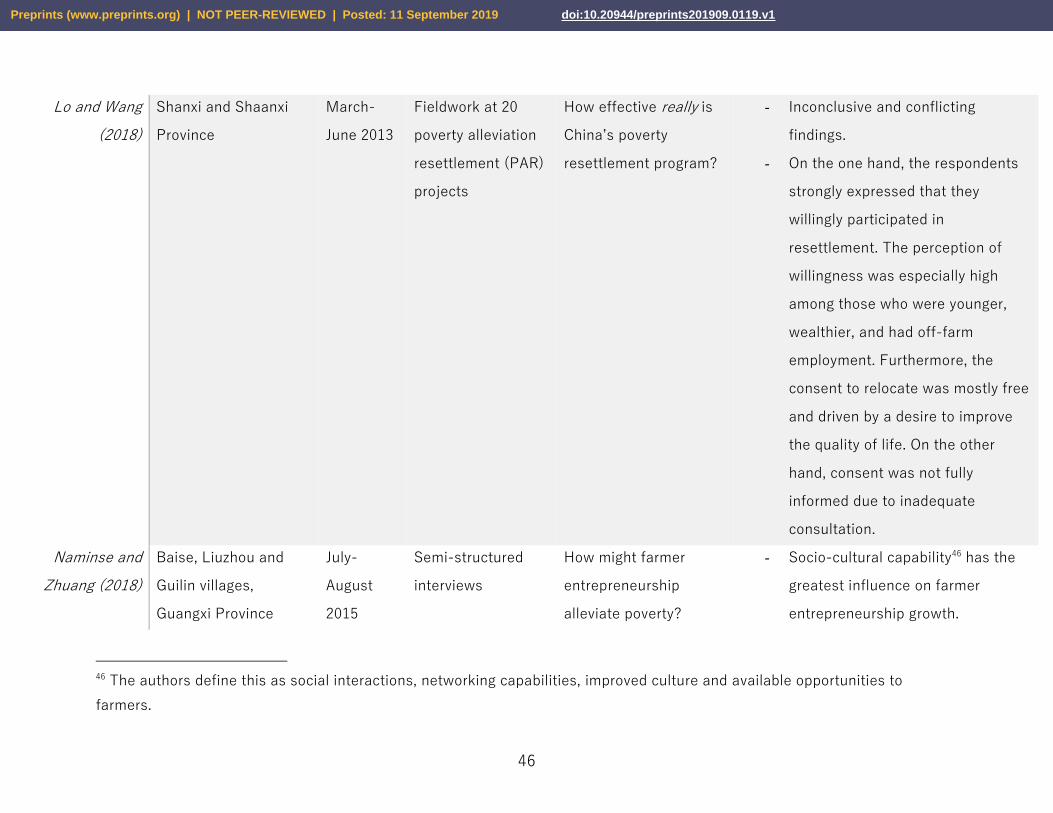
Lo and Wang
(2018)
Shanxi and Shaanxi
Province
March-
June 2013
Fieldwork at 20
poverty alleviation
resettlement (PAR)
projects
How effective really is
China’s poverty
resettlement program?
- Inconclusive and conflicting
findings.
- On the one hand, the respondents
strongly expressed that they
willingly participated in
resettlement. The perception of
willingness was especially high
among those who were younger,
wealthier, and had off-farm
employment. Furthermore, the
consent to relocate was mostly free
and driven by a desire to improve
the quality of life. On the other
hand, consent was not fully
informed due to inadequate
consultation.
Naminse and
Zhuang (2018)
Baise, Liuzhou and
Guilin villages,
Guangxi Province
July-
August
2015
Semi-structured
interviews
How might farmer
entrepreneurship
alleviate poverty?
- Socio-cultural capability46 has the
greatest influence on farmer
entrepreneurship growth.
46 The authors define this as social interactions, networking capabilities, improved culture and available opportunities to
farmers.
Preprints (www.preprints.org) | NOT PEER-REVIEWED | Posted: 11 September 2019 doi:10.20944/preprints201909.0119.v1
47
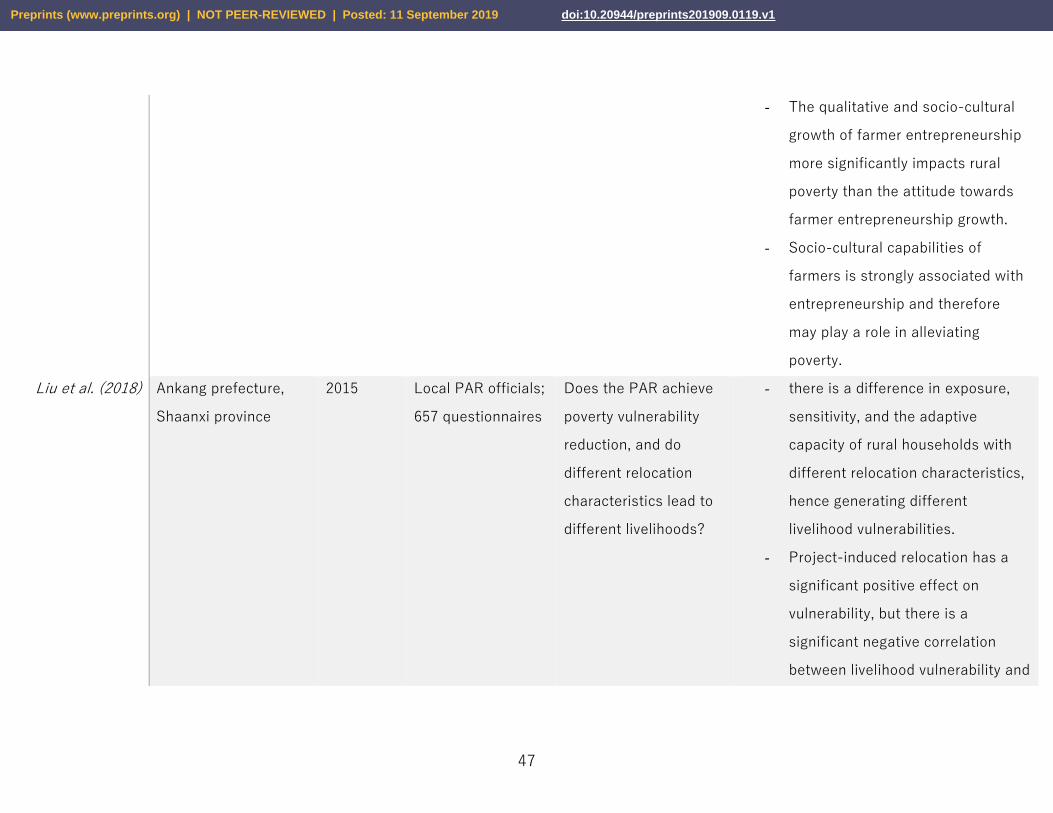
- The qualitative and socio-cultural
growth of farmer entrepreneurship
more significantly impacts rural
poverty than the attitude towards
farmer entrepreneurship growth.
- Socio-cultural capabilities of
farmers is strongly associated with
entrepreneurship and therefore
may play a role in alleviating
poverty.
Liu et al. (2018) Ankang prefecture,
Shaanxi province
2015 Local PAR officials;
657 questionnaires
Does the PAR achieve
poverty vulnerability
reduction, and do
different relocation
characteristics lead to
different livelihoods?
- there is a difference in exposure,
sensitivity, and the adaptive
capacity of rural households with
different relocation characteristics,
hence generating different
livelihood vulnerabilities.
- Project-induced relocation has a
significant positive effect on
vulnerability, but there is a
significant negative correlation
between livelihood vulnerability and
Preprints (www.preprints.org) | NOT PEER-REVIEWED | Posted: 11 September 2019 doi:10.20944/preprints201909.0119.v1
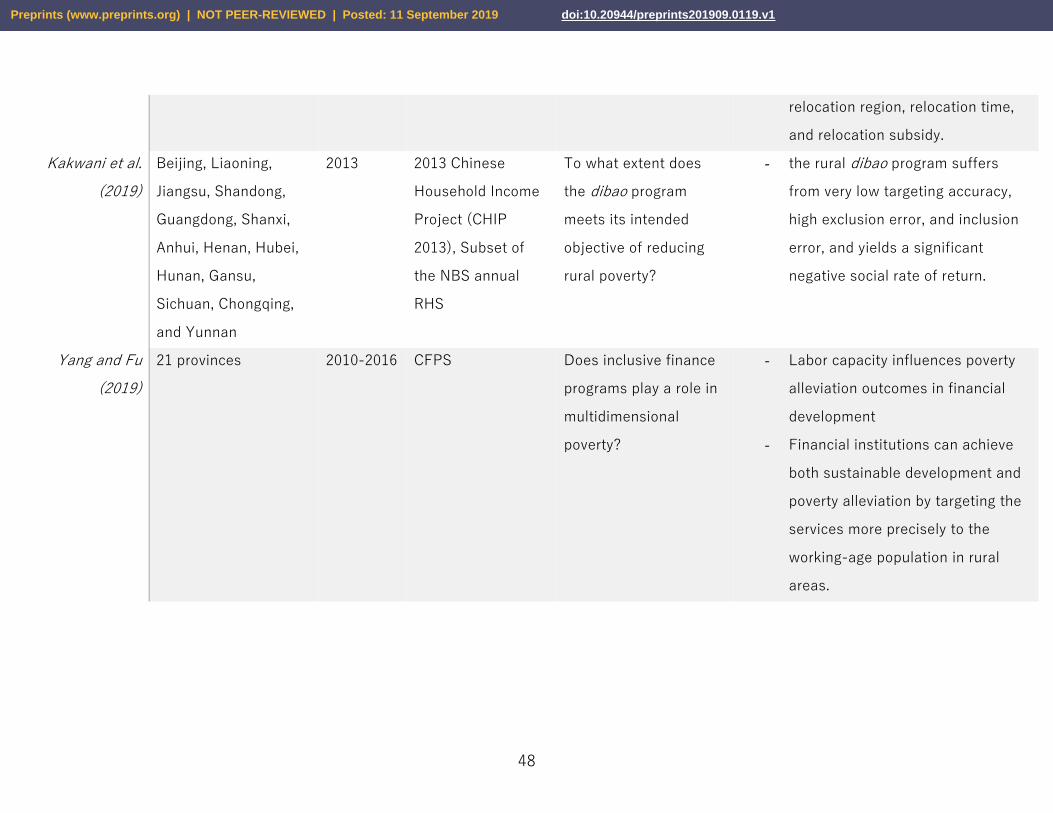
48
relocation region, relocation time,
and relocation subsidy.
Kakwani et al.
(2019)
Beijing, Liaoning,
Jiangsu, Shandong,
Guangdong, Shanxi,
Anhui, Henan, Hubei,
Hunan, Gansu,
Sichuan, Chongqing,
and Yunnan
2013 2013 Chinese
Household Income
Project (CHIP
2013), Subset of
the NBS annual
RHS
To what extent does
the dibao program
meets its intended
objective of reducing
rural poverty?
- the rural dibao program suffers
from very low targeting accuracy,
high exclusion error, and inclusion
error, and yields a significant
negative social rate of return.
Yang and Fu
(2019)
21 provinces 2010-2016 CFPS Does inclusive finance
programs play a role in
multidimensional
poverty?
- Labor capacity influences poverty
alleviation outcomes in financial
development
- Financial institutions can achieve
both sustainable development and
poverty alleviation by targeting the
services more precisely to the
working-age population in rural
areas.
Preprints (www.preprints.org) | NOT PEER-REVIEWED | Posted: 11 September 2019 doi:10.20944/preprints201909.0119.v1

49
Appendix B: Empirical methods
Authors of
study
Empirical method and usage Data source Research question(s)
Travers and
Ma (1994)
A variable elasticity model to gauge
aggregate agricultural production and its
impacts on poverty.
China’s County Level
Rural Economic
Statistical Abstract
Can the agricultural intensification and
investment raise peasant incomes in poor
areas?
Chen and
Ravallion
(1996)
Two poverty lines (on the basis of the
standard poverty line made by the State
Statistics Bureau) to measure the extent to
which rural populations are considered poor.
Rural Household Survey
(RHS); in-person
interviews with county
officials
(1) How can we better understand and
validate poverty rates from existing data
(i.e. how can we improve data-collecting
methods)? (2) How can we corroborate the
concerns of policymakers regarding the
effectiveness of the policies in the 1980s?
Jalan and
Ravallion
(1998)
A poverty index to measure household-level
consumption over time.
RHS How can we better understand and
measure the extent of poverty through
different time scales47?
Jalan and
Ravallion
(1999)
Generalized Method of Moments to estimate
risk insurance.
Rural Household Survey
(RHS)
To what extent are the needs of
households in poor rural economies similar
or different, and does the existing
Preprints (www.preprints.org) | NOT PEER-REVIEWED | Posted: 11 September 2019 doi:10.20944/preprints201909.0119.v1

50
consumption insurance work better for
some groups than others?
Carrin et al.
(1999)
Summary statistics of reimbursement
structure in the selected counties.
Data is based off of
Carrin et al. (1996)
(1) To what extent have counties and their
townships been able to reduce the burden
of healthcare costs on the rural
population?
(2) How effective are the policies’
population coverage and how adequate is
the reimbursement structure?
Jalan and
Ravallion
(2000)
Tobit and logit models to estimate transient
and chronic poverty.
Rural Household Survey
(RHS)
Is transient poverty is determined by a
process that is similar to chronic poverty?
Jalan and
Ravallion
(2001)
A nonlinear dynamic model to take into
account long-term fluctuations in mean
household income.
Data from Jalan and
Ravallion (1998), Jalan
and Ravallion (1999)
How do characteristics of household
income dynamics influence the long-term
effects of a transient shock?
Park et al.
(2002)
Propensity-score matching method to
measure regional differences in targeting.
National panel data How effective is regional targeting in
alleviating rural poverty?
Hannum
(2003)
Binary logit models to test the impact of
community characteristics (topography,
demography) on the prediction of
educational provision.
Rural component of the
National Sample Survey
of the Situation of
Chinese Children
(1) How do local community resources
influence educational inequality? (2) In
what ways do village characteristics affect
children?
Mcculloch
and
A vulnerability measure (based on the
probability of being in poverty in any given
Household Survey
Division of the Rural
Survey Organization in
How chronic is poverty in China?
Preprints (www.preprints.org) | NOT PEER-REVIEWED | Posted: 11 September 2019 doi:10.20944/preprints201909.0119.v1

51
Calandrino
(2003)
year) to measure the relationship between
chronic poverty and poverty vulnerability.
the National Bureau
Statistics (NBS)
Ravallion and
Chen (2005)
Difference-in-difference (DID) to measure
differences in outcomes between the
treatment and non-treatment group before
and after project implementation
Rural Household Survey
(RHS)
What is the savings behavior of
beneficiaries of a large poor-area
development project?
Cheng (2007) Grameen methodology to test the
sustainability and effect of microfinance
projects.
RHS (1) What factors affect the household
demand for micro-loans in an evolving
economic environment?
(2) How can we understand the demand of
the poor for microfinance from a behavioral
perspective?
Montalvo and
Ravallion
(2009)
Regression models to determine whether
the pattern of China’s growth played a
significant role in poverty reduction.
Sub-national panel
dataset constructed by
the authors and China’s
National and Provincial
Bureaus of Statistics
What role does economic growth—which
has been highly uneven across regions
since 1980— play in poverty reduction?
Goh et al.
(2009)
Growth incidence curve48 and the Poverty–
Growth–Inequality arithmetic49 to measure
the extent of change in income growth over
time.
CHNS What are the patterns of income growth and
inequality nationwide from 1989 to 2004?
48 Adapted from the nonlinear model of Ravallion and Chen (2001).
49 See Bourguignon, François (February 2004). "The Poverty-Growth-Inequality Triangle" (PDF). World Bank Website.
Preprints (www.preprints.org) | NOT PEER-REVIEWED | Posted: 11 September 2019 doi:10.20944/preprints201909.0119.v1

52
Turvey and
Kong (2010)
Summary statistics on farm household
attributes and ran a Bonferroni test against
the null hypothesis of households being
equal in attributes.
RHS (1) What is the connection between
informal and formal lending in rural China?
(2) How might the strength of informal
lending affect microfinance?
Duclos et al.
(2010)
A new index to measure transient and
chronic poverty that is based on the Jalan-
Ravallion method.
Survey data conducted
annually by China’s
Research Center for Rural
Economy (RCRE)
How can better statistical and empirical
methods be employed to more accurately
measure transient and chronic poverty?
Park and
Wang (2010)
Difference-in-Difference Propensity Score
Matching.
(DID-PSM). The authors compare incomes
and public investment levels between
(similar) villages that took advantage of
community-based development programs,
and those that did not.
A subset of the National
Bureau of Statistics
(NBS) annual RHS
How effective is community-based
development (poor village investment
program)?
Glauben et
al. (2011)
A hazard model to take into account the fact
that the likelihood to leave poverty may be
associated with the amount of time spent in
poverty.
Survey data conducted
annually by China’s
Research Center for Rural
Economy (RCRE)
What are the determinants of long-term
poverty and what is the duration
dependence on the probability to leave
poverty?
Li et al.
(2011)
Adjusted Difference in Difference Approach.
In lieu of a matching method these authors
perform a DID estimation which includes
household characteristics as controls.
Survey interview using
structured questionnaire
What is the impact of microfinance
programs on household welfare outcomes
such as income and consumption in rural
China?
Preprints (www.preprints.org) | NOT PEER-REVIEWED | Posted: 11 September 2019 doi:10.20944/preprints201909.0119.v1
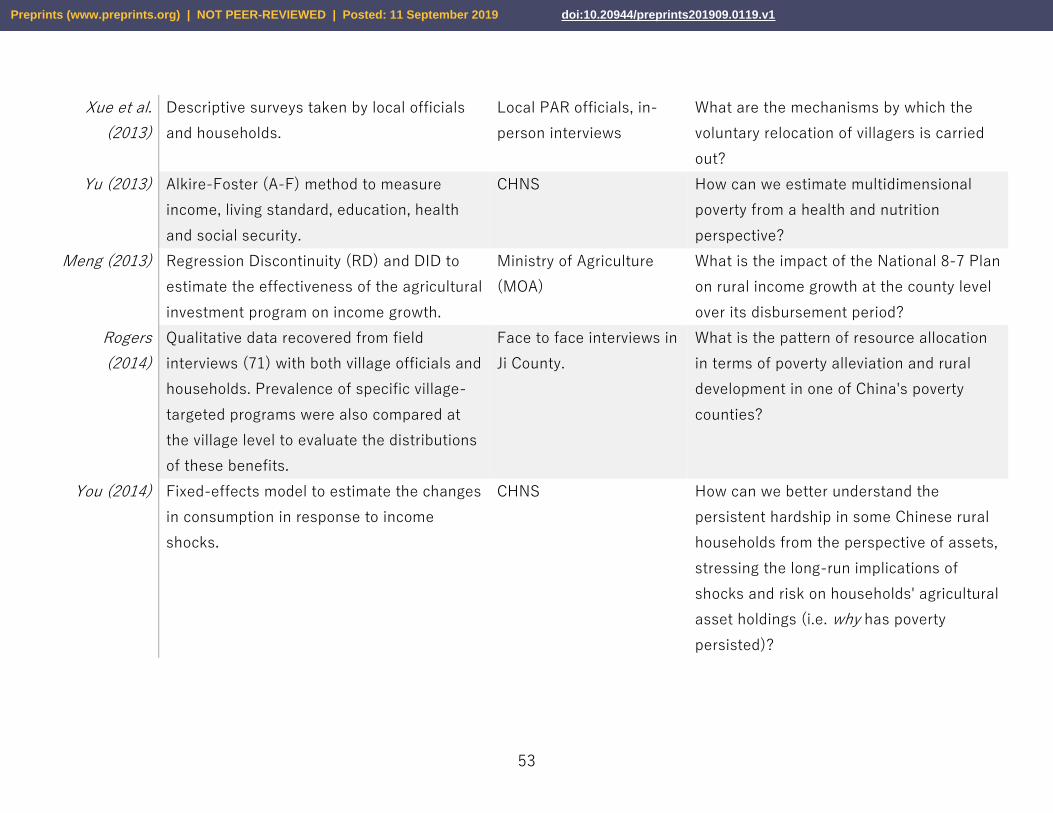
53
Xue et al.
(2013)
Descriptive surveys taken by local officials
and households.
Local PAR officials, in-
person interviews
What are the mechanisms by which the
voluntary relocation of villagers is carried
out?
Yu (2013) Alkire-Foster (A-F) method to measure
income, living standard, education, health
and social security.
CHNS How can we estimate multidimensional
poverty from a health and nutrition
perspective?
Meng (2013) Regression Discontinuity (RD) and DID to
estimate the effectiveness of the agricultural
investment program on income growth.
Ministry of Agriculture
(MOA)
What is the impact of the National 8-7 Plan
on rural income growth at the county level
over its disbursement period?
Rogers
(2014)
Qualitative data recovered from field
interviews (71) with both village officials and
households. Prevalence of specific village-
targeted programs were also compared at
the village level to evaluate the distributions
of these benefits.
Face to face interviews in
Ji County.
What is the pattern of resource allocation
in terms of poverty alleviation and rural
development in one of China's poverty
counties?
You (2014) Fixed-effects model to estimate the changes
in consumption in response to income
shocks.
CHNS
How can we better understand the
persistent hardship in some Chinese rural
households from the perspective of assets,
stressing the long-run implications of
shocks and risk on households' agricultural
asset holdings (i.e. why has poverty
persisted)?
Preprints (www.preprints.org) | NOT PEER-REVIEWED | Posted: 11 September 2019 doi:10.20944/preprints201909.0119.v1
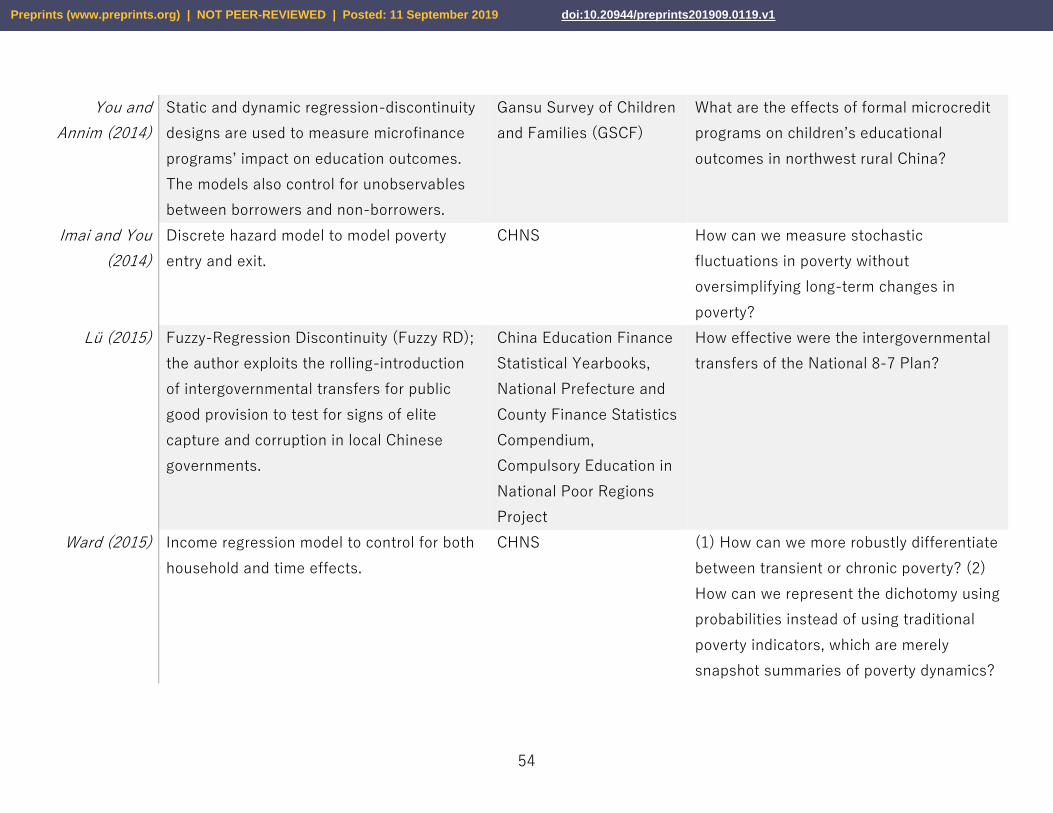
54
You and
Annim (2014)
Static and dynamic regression-discontinuity
designs are used to measure microfinance
programs’ impact on education outcomes.
The models also control for unobservables
between borrowers and non-borrowers.
Gansu Survey of Children
and Families (GSCF)
What are the effects of formal microcredit
programs on children’s educational
outcomes in northwest rural China?
Imai and You
(2014)
Discrete hazard model to model poverty
entry and exit.
CHNS How can we measure stochastic
fluctuations in poverty without
oversimplifying long-term changes in
poverty?
Lü (2015) Fuzzy-Regression Discontinuity (Fuzzy RD);
the author exploits the rolling-introduction
of intergovernmental transfers for public
good provision to test for signs of elite
capture and corruption in local Chinese
governments.
China Education Finance
Statistical Yearbooks,
National Prefecture and
County Finance Statistics
Compendium,
Compulsory Education in
National Poor Regions
Project
How effective were the intergovernmental
transfers of the National 8-7 Plan?
Ward (2015) Income regression model to control for both
household and time effects.
CHNS (1) How can we more robustly differentiate
between transient or chronic poverty? (2)
How can we represent the dichotomy using
probabilities instead of using traditional
poverty indicators, which are merely
snapshot summaries of poverty dynamics?
Preprints (www.preprints.org) | NOT PEER-REVIEWED | Posted: 11 September 2019 doi:10.20944/preprints201909.0119.v1
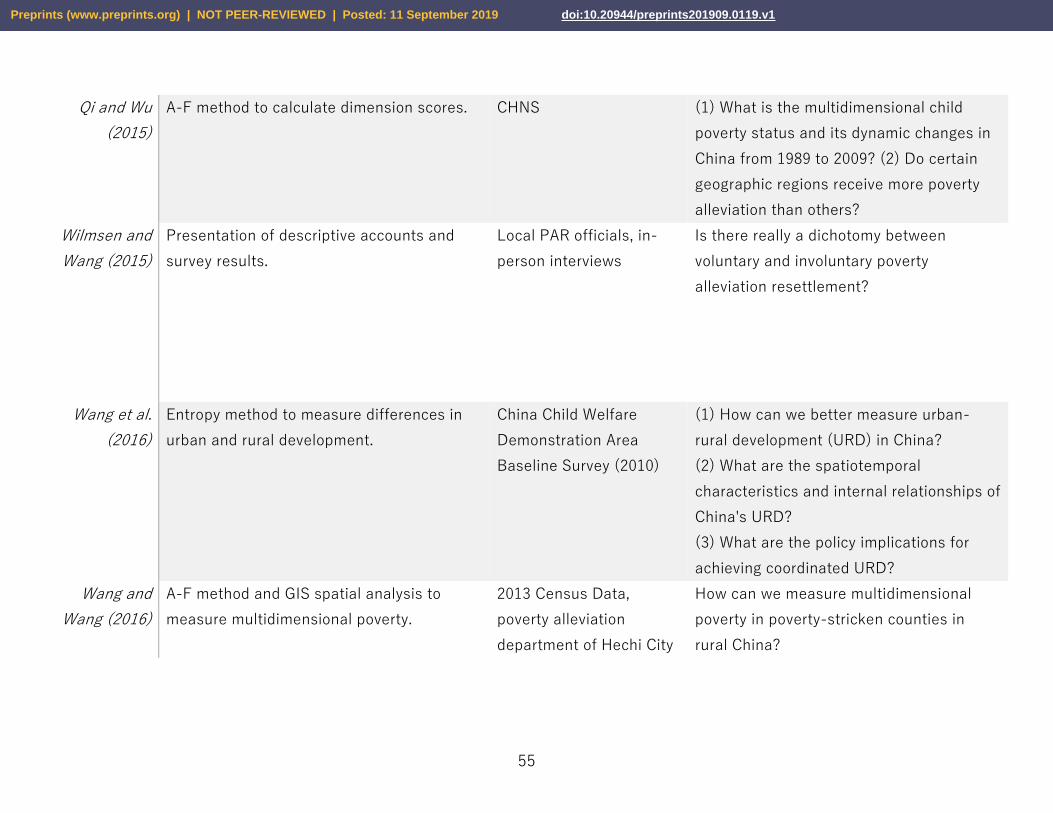
55
Qi and Wu
(2015)
A-F method to calculate dimension scores. CHNS (1) What is the multidimensional child
poverty status and its dynamic changes in
China from 1989 to 2009? (2) Do certain
geographic regions receive more poverty
alleviation than others?
Wilmsen and
Wang (2015)
Presentation of descriptive accounts and
survey results.
Local PAR officials, in-
person interviews
Is there really a dichotomy between
voluntary and involuntary poverty
alleviation resettlement?
Wang et al.
(2016)
Entropy method to measure differences in
urban and rural development.
China Child Welfare
Demonstration Area
Baseline Survey (2010)
(1) How can we better measure urban-
rural development (URD) in China?
(2) What are the spatiotemporal
characteristics and internal relationships of
China's URD?
(3) What are the policy implications for
achieving coordinated URD?
Wang and
Wang (2016)
A-F method and GIS spatial analysis to
measure multidimensional poverty.
2013 Census Data,
poverty alleviation
department of Hechi City
How can we measure multidimensional
poverty in poverty-stricken counties in
rural China?
Preprints (www.preprints.org) | NOT PEER-REVIEWED | Posted: 11 September 2019 doi:10.20944/preprints201909.0119.v1
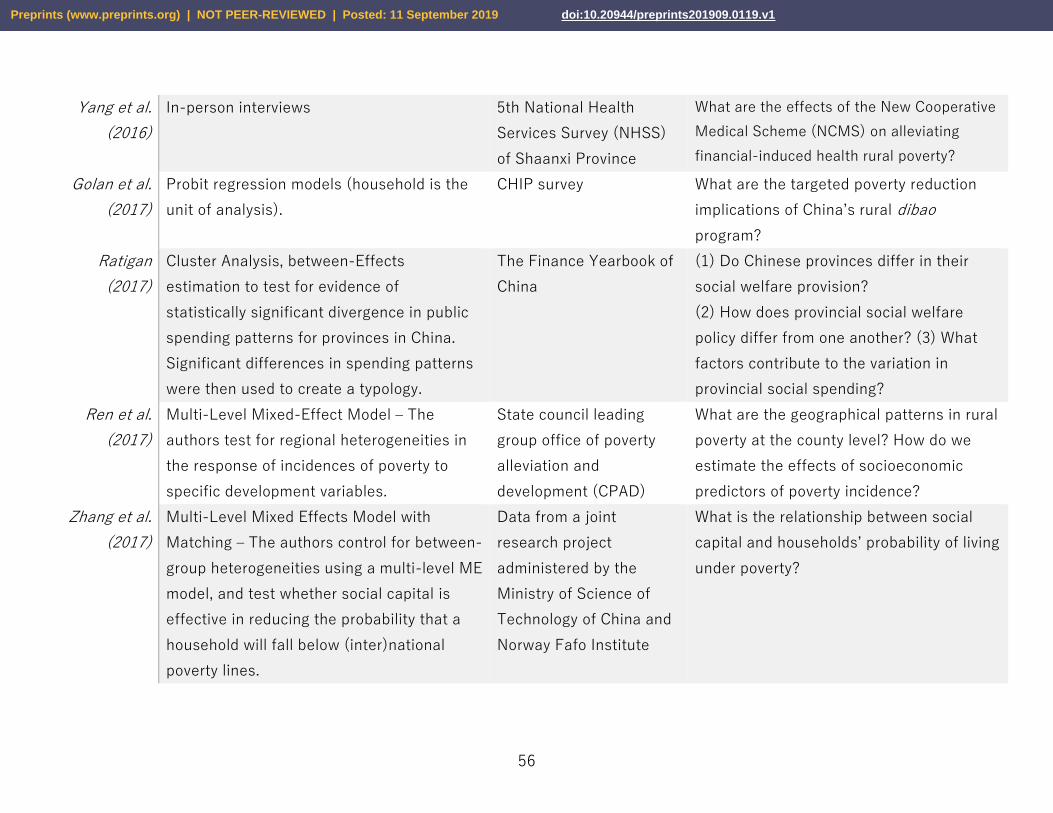
56
Yang et al.
(2016)
In-person interviews 5th National Health
Services Survey (NHSS)
of Shaanxi Province
What are the effects of the New Cooperative
Medical Scheme (NCMS) on alleviating
financial-induced health rural poverty?
Golan et al.
(2017)
Probit regression models (household is the
unit of analysis).
CHIP survey What are the targeted poverty reduction
implications of China’s rural dibao
program?
Ratigan
(2017)
Cluster Analysis, between-Effects
estimation to test for evidence of
statistically significant divergence in public
spending patterns for provinces in China.
Significant differences in spending patterns
were then used to create a typology.
The Finance Yearbook of
China
(1) Do Chinese provinces differ in their
social welfare provision?
(2) How does provincial social welfare
policy differ from one another? (3) What
factors contribute to the variation in
provincial social spending?
Ren et al.
(2017)
Multi-Level Mixed-Effect Model – The
authors test for regional heterogeneities in
the response of incidences of poverty to
specific development variables.
State council leading
group office of poverty
alleviation and
development (CPAD)
What are the geographical patterns in rural
poverty at the county level? How do we
estimate the effects of socioeconomic
predictors of poverty incidence?
Zhang et al.
(2017)
Multi-Level Mixed Effects Model with
Matching – The authors control for between-
group heterogeneities using a multi-level ME
model, and test whether social capital is
effective in reducing the probability that a
household will fall below (inter)national
poverty lines.
Data from a joint
research project
administered by the
Ministry of Science of
Technology of China and
Norway Fafo Institute
What is the relationship between social
capital and households’ probability of living
under poverty?
Preprints (www.preprints.org) | NOT PEER-REVIEWED | Posted: 11 September 2019 doi:10.20944/preprints201909.0119.v1
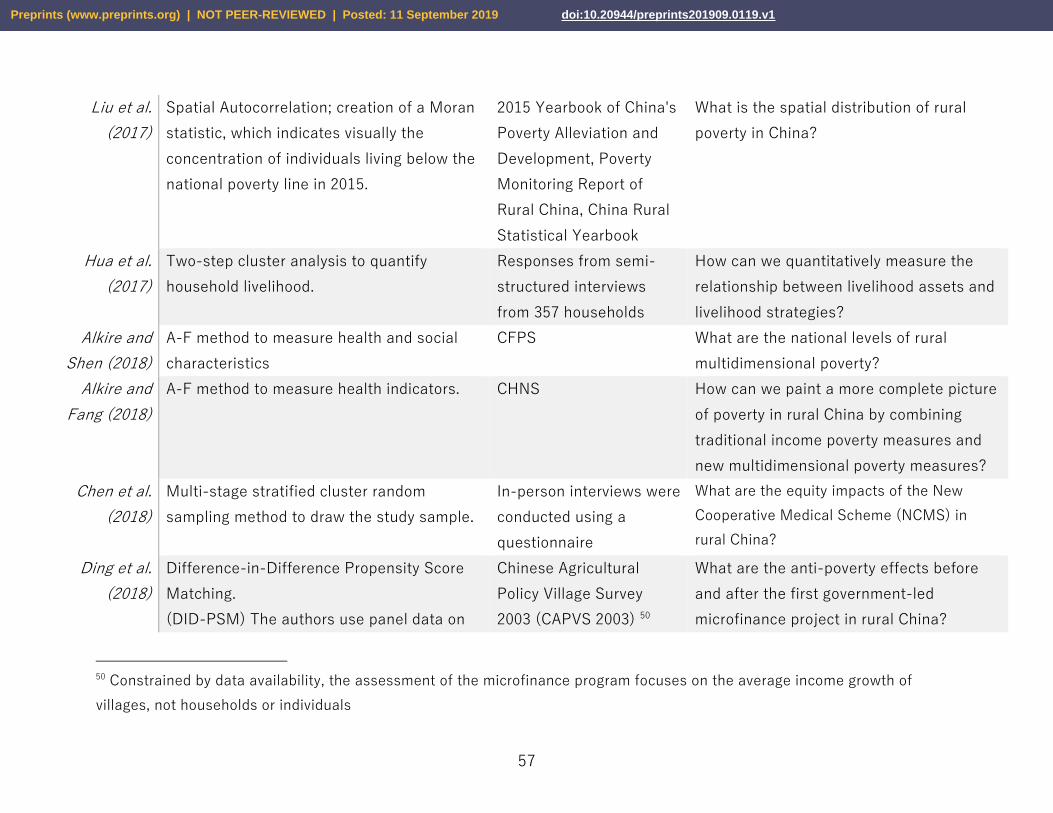
57
Liu et al.
(2017)
Spatial Autocorrelation; creation of a Moran
statistic, which indicates visually the
concentration of individuals living below the
national poverty line in 2015.
2015 Yearbook of China's
Poverty Alleviation and
Development, Poverty
Monitoring Report of
Rural China, China Rural
Statistical Yearbook
What is the spatial distribution of rural
poverty in China?
Hua et al.
(2017)
Two-step cluster analysis to quantify
household livelihood.
Responses from semi-
structured interviews
from 357 households
How can we quantitatively measure the
relationship between livelihood assets and
livelihood strategies?
Alkire and
Shen (2018)
A-F method to measure health and social
characteristics
CFPS What are the national levels of rural
multidimensional poverty?
Alkire and
Fang (2018)
A-F method to measure health indicators. CHNS
How can we paint a more complete picture
of poverty in rural China by combining
traditional income poverty measures and
new multidimensional poverty measures?
Chen et al.
(2018)
Multi-stage stratified cluster random
sampling method to draw the study sample.
In-person interviews were
conducted using a
questionnaire
What are the equity impacts of the New
Cooperative Medical Scheme (NCMS) in
rural China?
Ding et al.
(2018)
Difference-in-Difference Propensity Score
Matching.
(DID-PSM) The authors use panel data on
Chinese Agricultural
Policy Village Survey
2003 (CAPVS 2003) 50
What are the anti-poverty effects before
and after the first government-led
microfinance project in rural China?
50 Constrained by data availability, the assessment of the microfinance program focuses on the average income growth of
villages, not households or individuals
Preprints (www.preprints.org) | NOT PEER-REVIEWED | Posted: 11 September 2019 doi:10.20944/preprints201909.0119.v1

58
villages between 1998 and 2003 to compare
incomes in villages that undertook
microfinance programs to those that did not.
Zhang et al.
(2018)
Three-Stage Feasible GLS - The authors
create a metric for food vulnerability, the
probability a household will fall below a
specific level of caloric intake.
China Health and
Retirement Longitudinal
Survey (CHARLS51)
How can we estimate the vulnerability to
food poverty for the rural elderly?
Tian et al.
(2018)
Creates a topography index to quantify
destitute areas then investigates the links
between certain geographic features and
regional poverty.
Several topographic
databases (SPI, DEM
databases)
Income Survey Data
Are there regionally-specific determinants
of poverty in China?
Liu and Ma
(2018)
Regression Discontinuity (RD). The authors
exploit the discontinuous cut-off for the
National Poverty County (NPC) program to
compare development outcomes between
participant and non-participant villages.
Chinese Ministry of
Agriculture (1992)
China County Statistical
Yearbooks (2010)
Provincial Statistical
Yearbooks (2010)
Have there been any short run (1994 –
2000) or long run (1994-2010) impacts
from the NPC program?
Lo and Wang
(2018)
Household surveys and semi-structured
interviews to measure satisfaction with PAR
programs.
Fieldwork at 20 poverty
alleviation resettlement
(PAR) projects
How effective really is China’s poverty
resettlement program?
51 CHARLS was a nationwide survey aiming to collect personal and familial information regarding the elderly population. People
of the age 45 and older were randomly selected to be interviewed in the survey.
Preprints (www.preprints.org) | NOT PEER-REVIEWED | Posted: 11 September 2019 doi:10.20944/preprints201909.0119.v1
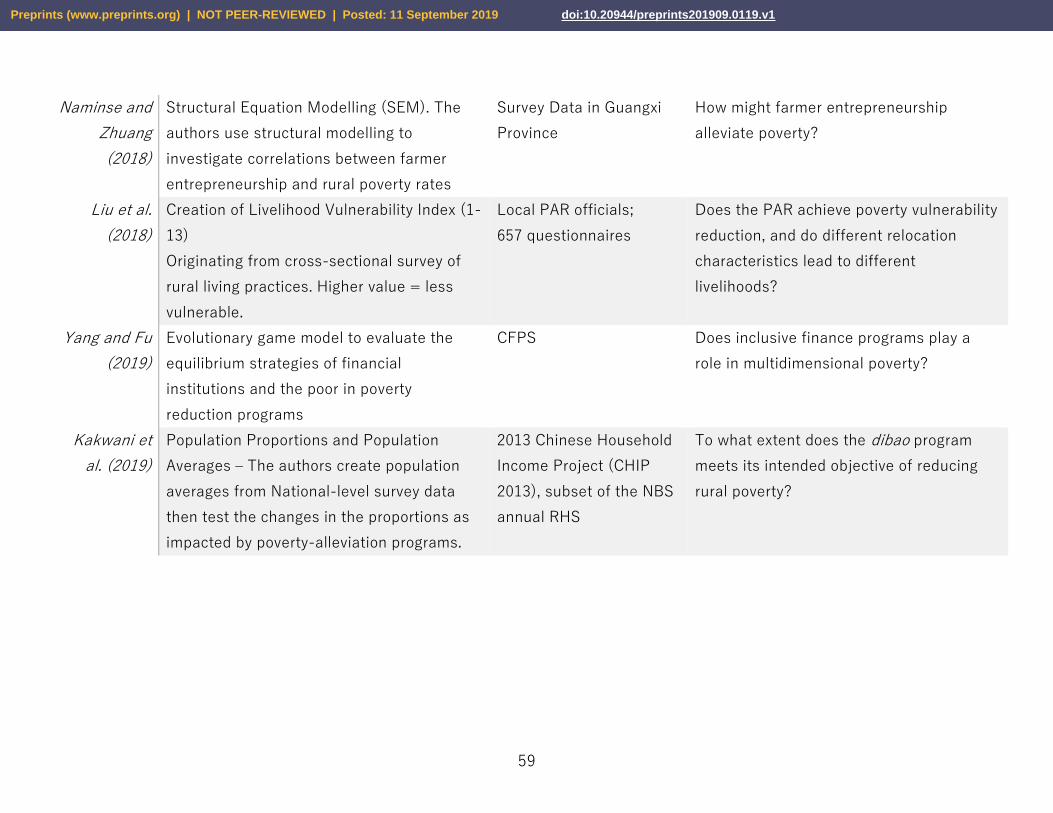
59
Naminse and
Zhuang
(2018)
Structural Equation Modelling (SEM). The
authors use structural modelling to
investigate correlations between farmer
entrepreneurship and rural poverty rates
Survey Data in Guangxi
Province
How might farmer entrepreneurship
alleviate poverty?
Liu et al.
(2018)
Creation of Livelihood Vulnerability Index (1-
13)
Originating from cross-sectional survey of
rural living practices. Higher value = less
vulnerable.
Local PAR officials;
657 questionnaires
Does the PAR achieve poverty vulnerability
reduction, and do different relocation
characteristics lead to different
livelihoods?
Yang and Fu
(2019)
Evolutionary game model to evaluate the
equilibrium strategies of financial
institutions and the poor in poverty
reduction programs
CFPS Does inclusive finance programs play a
role in multidimensional poverty?
Kakwani et
al. (2019)
Population Proportions and Population
Averages – The authors create population
averages from National-level survey data
then test the changes in the proportions as
impacted by poverty-alleviation programs.
2013 Chinese Household
Income Project (CHIP
2013), subset of the NBS
annual RHS
To what extent does the dibao program
meets its intended objective of reducing
rural poverty?
Preprints (www.preprints.org) | NOT PEER-REVIEWED | Posted: 11 September 2019 doi:10.20944/preprints201909.0119.v1

60
Appendix C: Explanatory and dependent variables
Authors of study Explanatory and dependent variables
Travers and Ma
(1994)
Income, output, labor, land, mechanical power, irrigation area, fertilizer consumption
Chen and Ravallion
(1996)
Head-count index (H), poverty gap index (PG), squared poverty gap index (SPG).
Jalan and Ravallion
(1998)
Mean consumption, poverty line, household size, level of education of household head (hh), wealth of hh,
standard deviation (std) of hh wealth, mean agricultural yield.
Jalan and Ravallion
(1999)
Richest decile, 70-90th percentile, 40-70th percentile, 40th percentile, poorest decile.
Jalan and Ravallion
(2000)
Household size (log) Household with couple & child (dummy), Household with couple & 2 children (dummy),
Household with couple & 3+ children (dummy), Three generation household (dummy), Proportion of
children: 6—11 years Proportion of children: 12—14 years Proportion of children: 15—17 years, Age of
household head, Age of household head, Proportion of adults: illiterate Proportion of adults: primary school
educated, Proportion of adults: secondary school educated, Highest education of labor: illiterate (dummy),
Highest education of labor: primary school (dummy), Highest education of labor: middle school (dummy),
Proportion of children: primary school educated Proportion of children: secondary school educated,
Household member works in state sector (dummy), Household member works in TVE's (dummy), Household
member works out of town (dummy), Mean grain yield, Standard deviation of grain yield, Mean wealth per
capita, Standard deviation of wealth per capita, Cultivated land per capita, Plains (dummy), Coast (dummy),
Preprints (www.preprints.org) | NOT PEER-REVIEWED | Posted: 11 September 2019 doi:10.20944/preprints201909.0119.v1
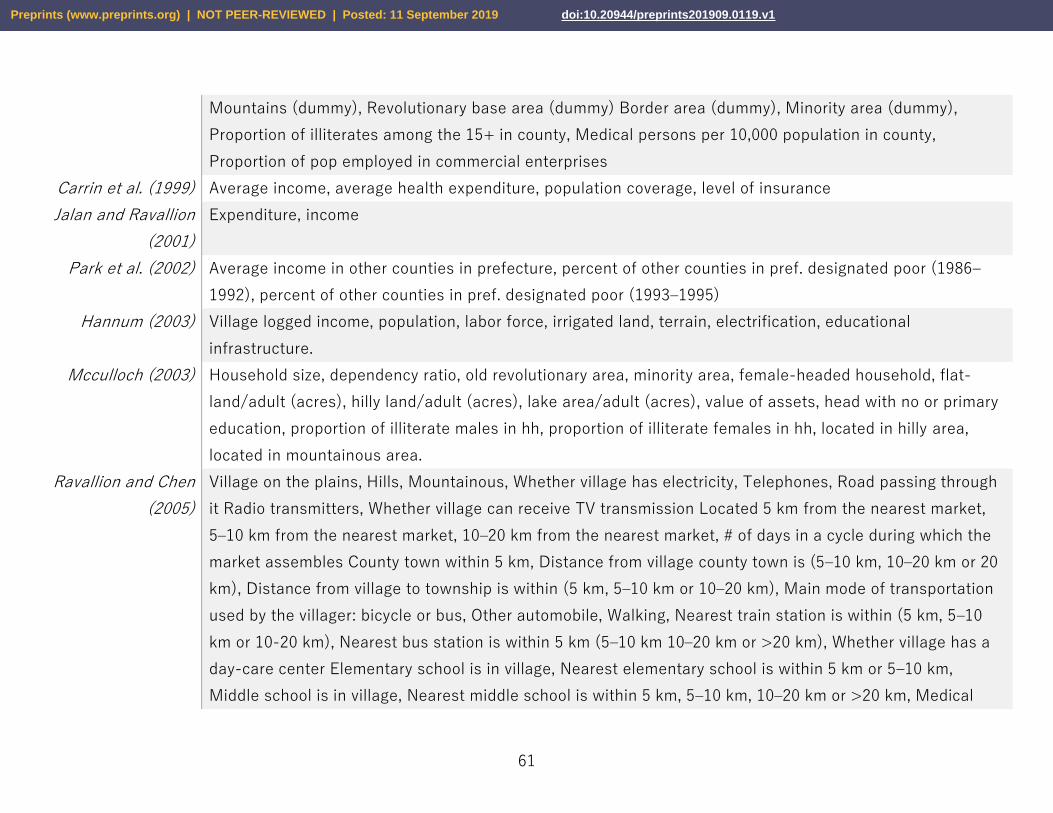
61
Mountains (dummy), Revolutionary base area (dummy) Border area (dummy), Minority area (dummy),
Proportion of illiterates among the 15+ in county, Medical persons per 10,000 population in county,
Proportion of pop employed in commercial enterprises
Carrin et al. (1999) Average income, average health expenditure, population coverage, level of insurance
Jalan and Ravallion
(2001)
Expenditure, income
Park et al. (2002) Average income in other counties in prefecture, percent of other counties in pref. designated poor (1986–
1992), percent of other counties in pref. designated poor (1993–1995)
Hannum (2003) Village logged income, population, labor force, irrigated land, terrain, electrification, educational
infrastructure.
Mcculloch (2003) Household size, dependency ratio, old revolutionary area, minority area, female-headed household, flat-
land/adult (acres), hilly land/adult (acres), lake area/adult (acres), value of assets, head with no or primary
education, proportion of illiterate males in hh, proportion of illiterate females in hh, located in hilly area,
located in mountainous area.
Ravallion and Chen
(2005)
Village on the plains, Hills, Mountainous, Whether village has electricity, Telephones, Road passing through
it Radio transmitters, Whether village can receive TV transmission Located 5 km from the nearest market,
5–10 km from the nearest market, 10–20 km from the nearest market, # of days in a cycle during which the
market assembles County town within 5 km, Distance from village county town is (5–10 km, 10–20 km or 20
km), Distance from village to township is within (5 km, 5–10 km or 10–20 km), Main mode of transportation
used by the villager: bicycle or bus, Other automobile, Walking, Nearest train station is within (5 km, 5–10
km or 10-20 km), Nearest bus station is within 5 km (5–10 km 10–20 km or >20 km), Whether village has a
day-care center Elementary school is in village, Nearest elementary school is within 5 km or 5–10 km,
Middle school is in village, Nearest middle school is within 5 km, 5–10 km, 10–20 km or >20 km, Medical
Preprints (www.preprints.org) | NOT PEER-REVIEWED | Posted: 11 September 2019 doi:10.20944/preprints201909.0119.v1

62
clinic in village, Nearest medical clinic is within 5 km, 5–10 km 10–20 km or >20 km, Total population of the
village Elevated land (mu), Forest land (mu), # of people work in TVE over # of labor Whether village has
TVE, Output of grain per capita (kg/person) , Net income per capita , (End of year) # of pigs per person,
(End of year) # of cows per person, (End of year) # of sheep, goat per person (End of year) # of poultry per
person , (End of year) # of honey bee per person Workforce per capita, Average household size, Share of
workforce female, Cultivated land per capita (mu), Grassland per capita (mu)
Cheng (2007) Loan demand, hh income52, head school, partner school, head skill, labour ratio, official status, wage ratio,
off-farm ratio, land area, Event 200453, RCC loan, informal loan, A2, and A3 (dummy variables for county 2
and 3, respectively).
Montalvo and
Ravallion (2009)
Counterfactual vector of rates of poverty reduction, counterfactual change in the headcount index,
counterfactual of the average growth of each sector.
Goh et al. (2009) Age of household head, average age of other adults excluding household head, completed years of formal
education of household head, dummy of coastal provinces, occupation of household head, number of skilled
workers in the household excluding, type of firm of household head, number of household members with an
occupation outside of agriculture, household's farmed land per member, participation in off-farm activities
Turvey and Kong
(2010)
Year farming, farm size, total household income, % income from farming, number of people living in
household, outstanding debt, amount of debt, asset value, informal loan value, formal loan value, both
informal and formal loan value, debt to asset ratio.
Duclos et al. (2010) Transient and chronic poverty
52 Separated into net family income per capita and net family income per capita squared.
53 Whether the family had large events in 2004, including wedding, funerals, and house-building.
Preprints (www.preprints.org) | NOT PEER-REVIEWED | Posted: 11 September 2019 doi:10.20944/preprints201909.0119.v1
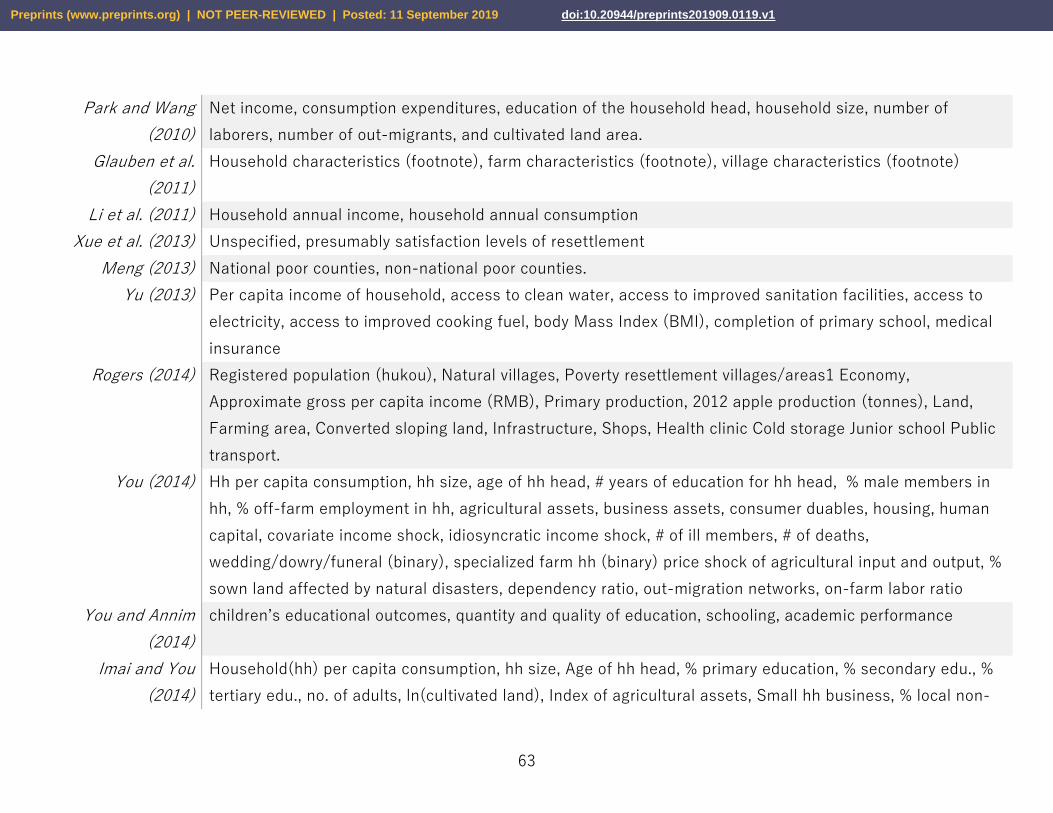
63
Park and Wang
(2010)
Net income, consumption expenditures, education of the household head, household size, number of
laborers, number of out-migrants, and cultivated land area.
Glauben et al.
(2011)
Household characteristics (footnote), farm characteristics (footnote), village characteristics (footnote)
Li et al. (2011) Household annual income, household annual consumption
Xue et al. (2013) Unspecified, presumably satisfaction levels of resettlement
Meng (2013) National poor counties, non-national poor counties.
Yu (2013) Per capita income of household, access to clean water, access to improved sanitation facilities, access to
electricity, access to improved cooking fuel, body Mass Index (BMI), completion of primary school, medical
insurance
Rogers (2014) Registered population (hukou), Natural villages, Poverty resettlement villages/areas1 Economy,
Approximate gross per capita income (RMB), Primary production, 2012 apple production (tonnes), Land,
Farming area, Converted sloping land, Infrastructure, Shops, Health clinic Cold storage Junior school Public
transport.
You (2014) Hh per capita consumption, hh size, age of hh head, # years of education for hh head, % male members in
hh, % off-farm employment in hh, agricultural assets, business assets, consumer duables, housing, human
capital, covariate income shock, idiosyncratic income shock, # of ill members, # of deaths,
wedding/dowry/funeral (binary), specialized farm hh (binary) price shock of agricultural input and output, %
sown land affected by natural disasters, dependency ratio, out-migration networks, on-farm labor ratio
You and Annim
(2014)
children’s educational outcomes, quantity and quality of education, schooling, academic performance
Imai and You
(2014)
Household(hh) per capita consumption, hh size, Age of hh head, % primary education, % secondary edu., %
tertiary edu., no. of adults, ln(cultivated land), Index of agricultural assets, Small hh business, % local non-
Preprints (www.preprints.org) | NOT PEER-REVIEWED | Posted: 11 September 2019 doi:10.20944/preprints201909.0119.v1

64
agricultural employment in hh, % village out-migration, % hh members having health insur, % hh members
having commercial insurance % hh members having gov. free insur, % hh members having cooperative
insurance, Urbanization, Economic activity, Access to markets, Social service, Purchasing price change of
farm products, Prov. % cultivated land in natural disasters.
Lü (2015) Log Education Spending Per Capita, Log Budgetary Education Spending Per Capita
Ward (2015) Age of hh head, number of dependents, # of working age hh members, female-headed hh (=1), education of
hh head, avg. education of hh members, natural logarithm (ln) of Land Area Cultivated, Agricultural capital
index, business capital index, Communting near open-trade area (=1), Pct. Ag. Employment in comm., pct.
Migrants in comm.
Qi and Wu (2015) Nutrition, water, sanitation facilities, shelter, education, health, information
Wilmsen and Wang
(2015)
Satisfaction levels of resettlement, volition of resettlement, living conditions pre- and post-resettlement
Wang et al. (2016) Economic development, Urban-rural livelihood, Urban share, Employment structure, Industrial structure,
Ratio of urban built land, Urban-rural income gap,
Urban-rural consumption comparison, Industrial labor productivity disparity
Wang and Wang
(2016)
Unsafe housing, family health, adults’ illiteracy, fuel type, children enrollment rate, rocky desertification
degree and topographic fragmentation degree
Yang et al. (2016) Gender, age groups, marital status, education status, employment status, economic status
Preprints (www.preprints.org) | NOT PEER-REVIEWED | Posted: 11 September 2019 doi:10.20944/preprints201909.0119.v1
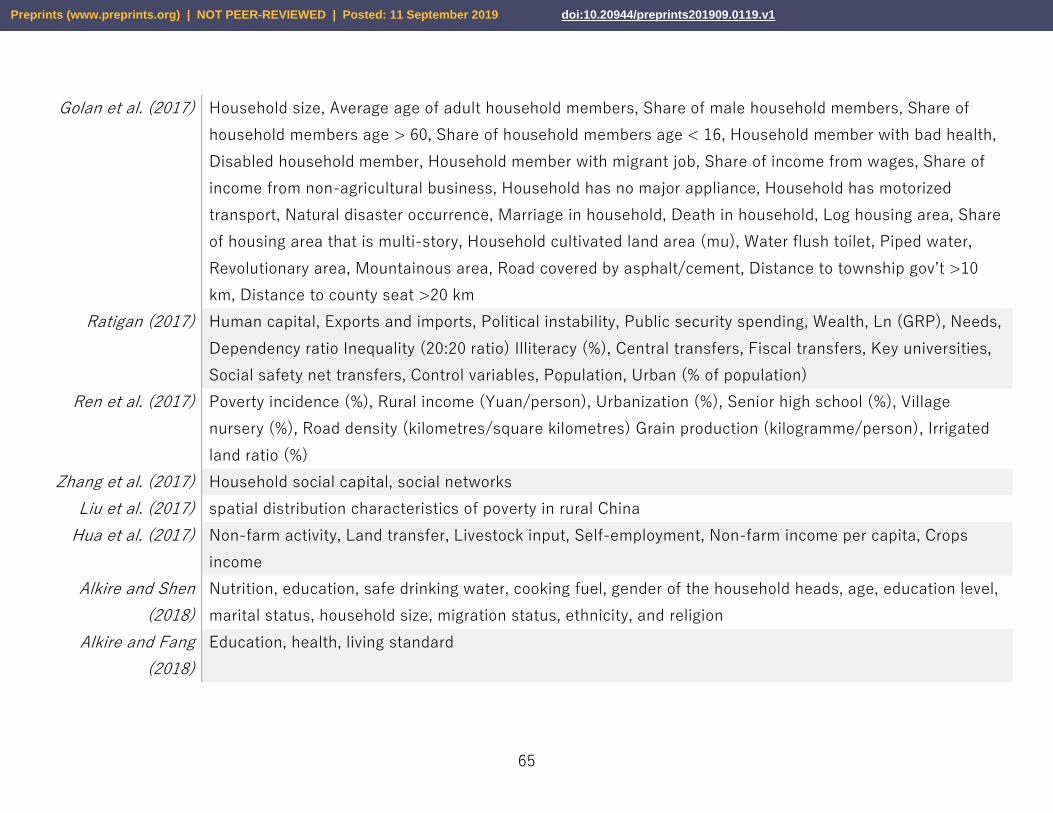
65
Golan et al. (2017) Household size, Average age of adult household members, Share of male household members, Share of
household members age > 60, Share of household members age < 16, Household member with bad health,
Disabled household member, Household member with migrant job, Share of income from wages, Share of
income from non-agricultural business, Household has no major appliance, Household has motorized
transport, Natural disaster occurrence, Marriage in household, Death in household, Log housing area, Share
of housing area that is multi-story, Household cultivated land area (mu), Water flush toilet, Piped water,
Revolutionary area, Mountainous area, Road covered by asphalt/cement, Distance to township gov’t >10
km, Distance to county seat >20 km
Ratigan (2017) Human capital, Exports and imports, Political instability, Public security spending, Wealth, Ln (GRP), Needs,
Dependency ratio Inequality (20:20 ratio) Illiteracy (%), Central transfers, Fiscal transfers, Key universities,
Social safety net transfers, Control variables, Population, Urban (% of population)
Ren et al. (2017) Poverty incidence (%), Rural income (Yuan/person), Urbanization (%), Senior high school (%), Village
nursery (%), Road density (kilometres/square kilometres) Grain production (kilogramme/person), Irrigated
land ratio (%)
Zhang et al. (2017) Household social capital, social networks
Liu et al. (2017) spatial distribution characteristics of poverty in rural China
Hua et al. (2017) Non-farm activity, Land transfer, Livestock input, Self-employment, Non-farm income per capita, Crops
income
Alkire and Shen
(2018)
Nutrition, education, safe drinking water, cooking fuel, gender of the household heads, age, education level,
marital status, household size, migration status, ethnicity, and religion
Alkire and Fang
(2018)
Education, health, living standard
Preprints (www.preprints.org) | NOT PEER-REVIEWED | Posted: 11 September 2019 doi:10.20944/preprints201909.0119.v1
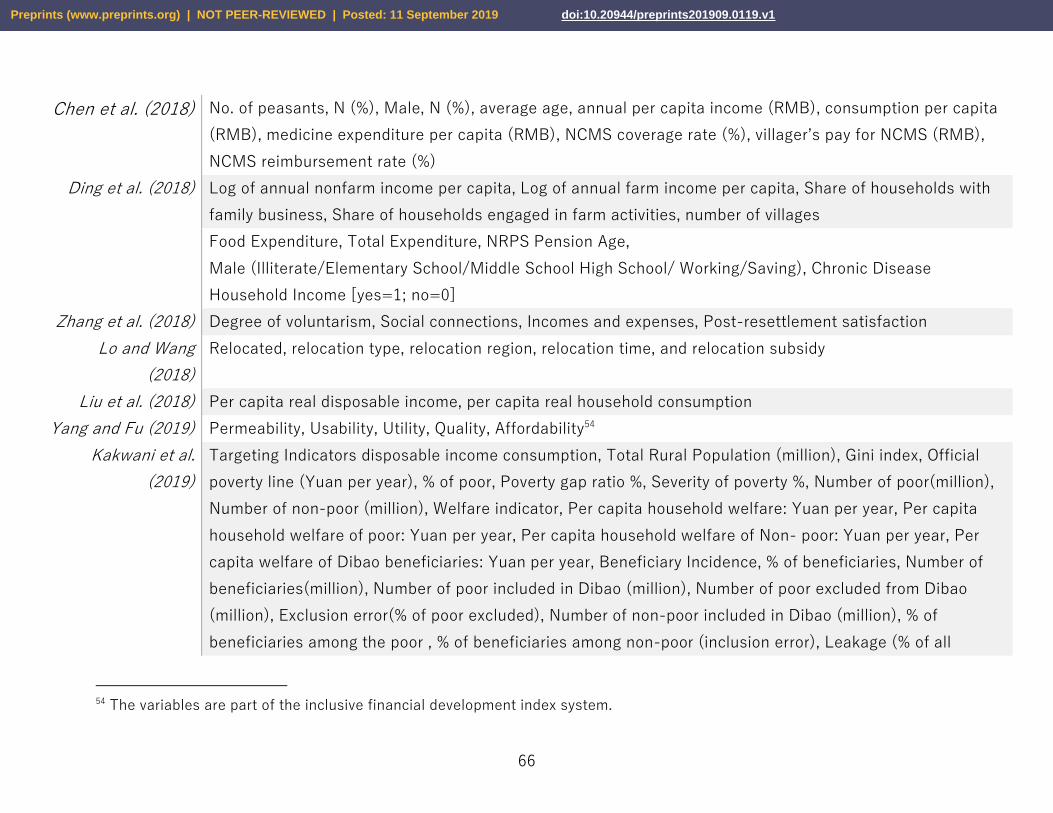
66
Chen et al. (2018) No. of peasants, N (%), Male, N (%), average age, annual per capita income (RMB), consumption per capita
(RMB), medicine expenditure per capita (RMB), NCMS coverage rate (%), villager’s pay for NCMS (RMB),
NCMS reimbursement rate (%)
Ding et al. (2018) Log of annual nonfarm income per capita, Log of annual farm income per capita, Share of households with
family business, Share of households engaged in farm activities, number of villages
Food Expenditure, Total Expenditure, NRPS Pension Age,
Male (Illiterate/Elementary School/Middle School High School/ Working/Saving), Chronic Disease
Household Income [yes=1; no=0]
Zhang et al. (2018) Degree of voluntarism, Social connections, Incomes and expenses, Post-resettlement satisfaction
Lo and Wang
(2018)
Relocated, relocation type, relocation region, relocation time, and relocation subsidy
Liu et al. (2018) Per capita real disposable income, per capita real household consumption
Yang and Fu (2019) Permeability, Usability, Utility, Quality, Affordability54
Kakwani et al.
(2019)
Targeting Indicators disposable income consumption, Total Rural Population (million), Gini index, Official
poverty line (Yuan per year), % of poor, Poverty gap ratio %, Severity of poverty %, Number of poor(million),
Number of non-poor (million), Welfare indicator, Per capita household welfare: Yuan per year, Per capita
household welfare of poor: Yuan per year, Per capita household welfare of Non- poor: Yuan per year, Per
capita welfare of Dibao beneficiaries: Yuan per year, Beneficiary Incidence, % of beneficiaries, Number of
beneficiaries(million), Number of poor included in Dibao (million), Number of poor excluded from Dibao
(million), Exclusion error(% of poor excluded), Number of non-poor included in Dibao (million), % of
beneficiaries among the poor , % of beneficiaries among non-poor (inclusion error), Leakage (% of all
54 The variables are part of the inclusive financial development index system.
Preprints (www.preprints.org) | NOT PEER-REVIEWED | Posted: 11 September 2019 doi:10.20944/preprints201909.0119.v1

67
beneficiaries from non-poor), Benefit incidence, Average transfer in the population Yuan per year, Average
transfer among the poor Yuan per year, Average transfer among the non-poor, Total transfers going to
beneficiaries per year (billion), Total transfers going to poor beneficiaries (billion), Total transfers going to
non-poor beneficiaries (billion), Leakage: Proportion of total transfers going to non-poor%, Average transfer
per beneficiary (Yuan per year), Average transfer per beneficiary among the poor, Average transfer per
beneficiary among the non-poor
References
1. Alkire, S., & Fang, Y. (2019). Dynamics of Multidimensional Poverty and Uni-dimensional Income Poverty: An
Evidence of Stability Analysis from China. Social Indicators Research, 142(1), 25–64.
https://doi.org/10.1007/s11205-018-1895-2
Preprints (www.preprints.org) | NOT PEER-REVIEWED | Posted: 11 September 2019 doi:10.20944/preprints201909.0119.v1

68
2. Alkire, S., Shen, Y., Alkire, S., & Shen, Y. (2017). Exploring Multidimensional Poverty in China: 2010 to 2014. In
Research on Economic Inequality: Vol. 25. Research on Economic Inequality (Vol. 25, pp. 161–228).
https://doi.org/10.1108/S1049-258520170000025006
3. Cai, Y., & Xia, C. (2018). Interpretive Structural Analysis of Interrelationships among the Elements of
Characteristic Agriculture Development in Chinese Rural Poverty Alleviation. Sustainability, 10(3), 786.
https://doi.org/10.3390/su10030786
4. Carrin, G., Ron, A., Hui, Y., Hong, W., Tuohong, Z., Licheng, Z., … Xuesheng, L. (1999). The reform of the rural
cooperative medical system in the People’s Republic of China: Interim experience in 14 pilot counties1The
present article is largely based on findings and data in Carrin et al. (1996).1. Social Science & Medicine, 48(7),
961–972. https://doi.org/10.1016/S0277-9536(98)00396-7
Preprints (www.preprints.org) | NOT PEER-REVIEWED | Posted: 11 September 2019 doi:10.20944/preprints201909.0119.v1

69
5. Chen, J., Dong, H., Yu, H., Gu, Y., & Zhang, T. (2018). Impact of new rural cooperative medical scheme on the
equity of health services in rural China. BMC Health Services Research, 18(1), 486.
https://doi.org/10.1186/s12913-018-3288-2
6. Chen, S., & Ravallion, M. (1996). Data in transition: Assessing rural living standards in Southern China. China
Economic Review, 7(1), 23–56. https://doi.org/10.1016/S1043-951X(96)90018-8
7. Cheng, E. (2007). THE DEMAND FOR MICROCREDIT AS A DETERMINANT FOR MICROFINANCE OUTREACH -
EVIDENCE FROM CHINA. Savings and Development, 31(3), 307–334. Retrieved from JSTOR.
8. Ding, H., Qin, C., & Shi, K. (2018). Who benefit from government-led microfinance projects? Evidence from rural
China. Journal of Comparative Economics, 46(4), 1253–1272.
9. Duclos, J.-Y., Araar, A., & Giles, J. (2010). Chronic and transient poverty: Measurement and estimation, with
evidence from China. Journal of Development Economics, 91(2), 266–277.
https://doi.org/10.1016/j.jdeveco.2009.09.002
Preprints (www.preprints.org) | NOT PEER-REVIEWED | Posted: 11 September 2019 doi:10.20944/preprints201909.0119.v1

70
10. ECES. (n.d.). The Poverty-Growth-Inequality Triangle: With Some Reflections on Egypt. Retrieved August 31,
2019, from Eces.org.eg website: http://www.eces.org.eg/Publication.aspx?Id=57
11. Glauben, T., Herzfeld, T., Rozelle, S., & Wang, X. (2012). Persistent Poverty in Rural China: Where, Why, and How
to Escape? World Development, 40(4), 784–795. https://doi.org/10.1016/j.worlddev.2011.09.023
12. Goh, C., Luo, X., & Zhu, N. (2009). Income growth, inequality and poverty reduction: A case study of eight
provinces in China. China Economic Review, 20(3), 485–496. https://doi.org/10.1016/j.chieco.2008.10.008
13. Golan, J., Sicular, T., & Umapathi, N. (2017). Unconditional Cash Transfers in China: Who Benefits from the Rural
Minimum Living Standard Guarantee (Dibao) Program? World Development, 93, 316–336.
https://doi.org/10.1016/j.worlddev.2016.12.011
14. Hannum, E. (2003). Poverty and Basic Education in Rural China: Villages, Households, and Girls’ and Boys’
Enrollment. Comparative Education Review, 47(2), 141–159. https://doi.org/10.1086/376542
Preprints (www.preprints.org) | NOT PEER-REVIEWED | Posted: 11 September 2019 doi:10.20944/preprints201909.0119.v1

71
15. Hua, X., Yan, J., & Zhang, Y. (2017). Evaluating the role of livelihood assets in suitable livelihood strategies:
Protocol for anti-poverty policy in the Eastern Tibetan Plateau, China. Ecological Indicators, 78, 62–74.
https://doi.org/10.1016/j.ecolind.2017.03.009
16. Jalan, J., & Ravallion, M. (1998). Transient Poverty in Postreform Rural China. Journal of Comparative Economics,
26(2), 338–357. https://doi.org/10.1006/jcec.1998.1526
17. Jalan, J., & Ravallion, M. (1999). Are the poor less well insured? Evidence on vulnerability to income risk in rural
China. Journal of Development Economics, 58(1), 61–81. https://doi.org/10.1016/S0304-3878(98)00103-5
18. Jalan, J., & Ravallion, M. (2000). Is transient poverty different? Evidence for rural China. Journal of Development
Studies, 36(6), 82–99.
19. Kakwani, N., Li, S., Wang, X., & Zhu, M. (2019). Evaluating the effectiveness of the rural minimum living standard
guarantee (Dibao) program in China. China Economic Review, 53(C), 1–14.
Preprints (www.preprints.org) | NOT PEER-REVIEWED | Posted: 11 September 2019 doi:10.20944/preprints201909.0119.v1

72
20. Li, X., Gan, C., & Hu, B. (2011). The welfare impact of microcredit on rural households in China. The Journal of
Socio-Economics, 40(4), 404–411. https://doi.org/10.1016/j.socec.2011.04.012
21. Liu, C., & Ma, G. (2018). Are Place-Based Policies Always a Blessing? Evidence from China’s National Poor
County Programme. The Journal of Development Studies, 0(0), 1–13.
https://doi.org/10.1080/00220388.2018.1438598
22. Liu, Yanhua, & Xu, Y. (2016). A geographic identification of multidimensional poverty in rural China under the
framework of sustainable livelihoods analysis. Applied Geography, 73, 62–76.
https://doi.org/10.1016/j.apgeog.2016.06.004
23. Liu, Yansui, Liu, J., & Zhou, Y. (2017). Spatio-temporal patterns of rural poverty in China and targeted poverty
alleviation strategies. Journal of Rural Studies, 52, 66–75. https://doi.org/10.1016/j.jrurstud.2017.04.002
Preprints (www.preprints.org) | NOT PEER-REVIEWED | Posted: 11 September 2019 doi:10.20944/preprints201909.0119.v1
73
24. Liu, Yansui, Yuanzhi, G., & Zhou, Y. (2018). Poverty alleviation in rural China: Policy changes, future challenges
and policy implications. China Agricultural Economic Review, 10, 00–00. https://doi.org/10.1108/CAER-10-2017-
0192
25. Lo, K., & Wang, M. (2018). How voluntary is poverty alleviation resettlement in China? Habitat International, 73,
34–42. https://doi.org/10.1016/j.habitatint.2018.01.002
26. Lo, K., Xue, L., & Wang, M. (2016). Spatial restructuring through poverty alleviation resettlement in rural China.
Journal of Rural Studies, 47, 496–505. https://doi.org/10.1016/j.jrurstud.2016.06.006
27. Lü, X. (2015). Intergovernmental transfers and local education provision—Evaluating China’s 8-7 National Plan for
Poverty Reduction. China Economic Review, 33, 200–211. https://doi.org/10.1016/j.chieco.2015.02.001
28. Majendie, A. (2018, December 16). The Next Economic Superpower: China’s 40-Year Rise, in Photos. Retrieved
August 26, 2019, from Bloomberg website: https://www.bloomberg.com/news/photo-essays/2018-12-17/china-
s-four-decade-opening-in-pictures
Preprints (www.preprints.org) | NOT PEER-REVIEWED | Posted: 11 September 2019 doi:10.20944/preprints201909.0119.v1
74
29. McCulloch, N., & Calandrino, M. (2003). Vulnerability and Chronic Poverty in Rural Sichuan. World Development,
31(3), 611–628. https://doi.org/10.1016/S0305-750X(02)00216-4
30. Meng, L. (2013). Evaluating China’s poverty alleviation program: A regression discontinuity approach. Journal of
Public Economics, 101, 1–11. https://doi.org/10.1016/j.jpubeco.2013.02.004
31. Montalvo, J. G., & Ravallion, M. (2010). The pattern of growth and poverty reduction in China. Journal of
Comparative Economics, 38(1), 2–16. https://doi.org/10.1016/j.jce.2009.10.005
32. Naminse, E. Y., & Zhuang, J. (2018). Does farmer entrepreneurship alleviate rural poverty in China? Evidence from
Guangxi Province. PLOS ONE, 13(3), e0194912. https://doi.org/10.1371/journal.pone.0194912
33. Park, A., & Wang, S. (2010). Community-based development and poverty alleviation: An evaluation of China’s poor
village investment program. Journal of Public Economics, 94(9), 790–799.
https://doi.org/10.1016/j.jpubeco.2010.06.005
Preprints (www.preprints.org) | NOT PEER-REVIEWED | Posted: 11 September 2019 doi:10.20944/preprints201909.0119.v1
75
34. Park, A., Wang, S., & Wu, G. (2002). Regional poverty targeting in China. Journal of Public Economics, 86(1), 123–
153. https://doi.org/10.1016/S0047-2727(01)00108-6
35. Qi, D., & Wu, Y. (2015). A multidimensional child poverty index in China. Children and Youth Services Review, 57,
159–170. https://doi.org/10.1016/j.childyouth.2015.08.011
36. Ratigan, K. (2017). Disaggregating the Developing Welfare State: Provincial Social Policy Regimes in China. World
Development, 98(C), 467–484.
37. Ravallion, M. (2009). Decentralizing Eligibility for a Federal Antipoverty Program. World Bank Economic Review,
23(1), 1–30. https://doi.org/10.1093/wber/lhn023
38. Ravallion, M., & Chen, S. (2005). Hidden impact? Household saving in response to a poor-area development
project. Journal of Public Economics, 89(11), 2183–2204. https://doi.org/10.1016/j.jpubeco.2004.12.003
39. Ravallion, M., & Jalan, J. (2001). Household Income Dynamics in Rural China (SSRN Scholarly Paper No. ID
632775). Retrieved from Social Science Research Network website: https://papers.ssrn.com/abstract=632775
Preprints (www.preprints.org) | NOT PEER-REVIEWED | Posted: 11 September 2019 doi:10.20944/preprints201909.0119.v1
76
40. Ren, Z., Ge, Y., Wang, J., Mao, J., & Zhang, Q. (2017). Understanding the inconsistent relationships between
socioeconomic factors and poverty incidence across contiguous poverty-stricken regions in China: Multilevel
modelling. Spatial Statistics, 21, 406–420. https://doi.org/10.1016/j.spasta.2017.02.009
41. Rogers, S. (2014). Betting on the strong: Local government resource allocation in China’s poverty counties.
Journal of Rural Studies, 36, 197–206. https://doi.org/10.1016/j.jrurstud.2014.08.001
42. Rozelle, S., Park, A., Benziger, V., & Changqing, R. (1998). Targeted poverty investments and economic growth in
China. World Development, 26(12), 2137–2151. https://doi.org/10.1016/S0305-750X(98)00104-1
43. South China Morning Post. (2018). Extreme poverty in China: Poorest village hopes for change. Retrieved from
https://www.youtube.com/watch?v=W11o_4keAwA
44. Tian, Y., Wang, Z., Zhao, J., Jiang, X., & Guo, R. (2018). A Geographical Analysis of the Poverty Causes in China’s
Contiguous Destitute Areas. Sustainability; Basel, 10(6), 1895.
http://dx.doi.org.ezproxy.library.ubc.ca/10.3390/su10061895
Preprints (www.preprints.org) | NOT PEER-REVIEWED | Posted: 11 September 2019 doi:10.20944/preprints201909.0119.v1

77
45. Travers, L., & Ma, J. (1994). Agricultural productivity and rural poverty in China. China Economic Review, 5(1),
141–159. https://doi.org/10.1016/1043-951X(94)90019-1
46. Turvey, C. G., & Kong, R. (2010). Informal lending amongst friends and relatives: Can microcredit compete in rural
China? China Economic Review, 21(4), 544–556. https://doi.org/10.1016/j.chieco.2010.05.001
47. Wang, X., Zhou, L., & Shang, X. (2015). Child Poverty in Rural China: Multidimensional Perspective. Asian Social
Work and Policy Review, 9(2), 109–124. https://doi.org/10.1111/aswp.12050
48. Wang, Yanfei, Liu, Y., Li, Y., & Li, T. (2016). The spatio-temporal patterns of urban–rural development
transformation in China since 1990. Habitat International, 53, 178–187.
https://doi.org/10.1016/j.habitatint.2015.11.011
49. Wang, Yanhui, & Wang, B. (2016). Multidimensional poverty measure and analysis: A case study from Hechi City,
China. SpringerPlus, 5(1), 642. https://doi.org/10.1186/s40064-016-2192-7
Preprints (www.preprints.org) | NOT PEER-REVIEWED | Posted: 11 September 2019 doi:10.20944/preprints201909.0119.v1

78
50. Ward, P. S. (2016). Transient Poverty, Poverty Dynamics, and Vulnerability to Poverty: An Empirical Analysis
Using a Balanced Panel from Rural China. World Development, 78, 541–553.
https://doi.org/10.1016/j.worlddev.2015.10.022
51. Wilmsen, B., & Wang, M. (2015). Voluntary and involuntary resettlement in China: A false dichotomy?
Development in Practice, 25(5), 612–627. https://doi.org/10.1080/09614524.2015.1051947
52. Xue, L., Wang, M. Y., & Xue, T. (2013). ‘Voluntary’ Poverty Alleviation Resettlement in China. Development and
Change, 44(5), 1159–1180. https://doi.org/10.1111/dech.12054
53. Yang, X., Gao, J., Zhou, Z., Yan, J., Lai, S., Xu, Y., & Chen, G. (2016). Assessing the Effects of the New Cooperative
Medical Scheme on Alleviating the Health Payment-Induced Poverty in Shaanxi Province, China. PLOS ONE,
11(7), e0157918. https://doi.org/10.1371/journal.pone.0157918
54. You, J. (2014). Risk, under-investment in agricultural assets and dynamic asset poverty in rural China. China
Economic Review, 29, 27–45. https://doi.org/10.1016/j.chieco.2014.02.002
Preprints (www.preprints.org) | NOT PEER-REVIEWED | Posted: 11 September 2019 doi:10.20944/preprints201909.0119.v1

79
55. You, J., & Annim, S. K. (2013). The Impact of Microcredit on Child Education: Quasi-Experimental Evidence from
Rural China (SSRN Scholarly Paper No. ID 2256569). Retrieved from Social Science Research Network website:
https://papers.ssrn.com/abstract=2256569
56. Yu, J. (2013). Multidimensional Poverty in China: Findings Based on the CHNS. Social Indicators Research,
112(2), 315–336. https://doi.org/10.1007/s11205-013-0250-x
57. Zhang, Z., Luo, Y., & Robinson, D. (2018). Reducing Food Poverty and Vulnerability among the Rural Elderly with
Chronic Diseases: The Role of the New Rural Pension Scheme in China. International Journal of Environmental
Research and Public Health, 15(6). https://doi.org/10.3390/ijerph15061253
58. Zhu, M., Shuai, C., Wang, X., Leng, Z., & Zhang, F. (2018). Analysis of China’s policy effect on poverty alleviation:
Evidence from Chongqing in the Three Gorges Reservoir Region. Quality & Quantity.
https://doi.org/10.1007/s11135-018-0817-3
Preprints (www.preprints.org) | NOT PEER-REVIEWED | Posted: 11 September 2019 doi:10.20944/preprints201909.0119.v1

80
59. Zuo, C. (Ed.). (2019). The Evolution of China’s Poverty Alleviation and Development Policy (2001-2015). Retrieved
from https://www.springer.com/gp/book/9789811316890
Preprints (www.preprints.org) | NOT PEER-REVIEWED | Posted: 11 September 2019 doi:10.20944/preprints201909.0119.v1