poverty alleviation and reduction of inequality- the role
TRANSCRIPT

Poverty Alleviation and reduction of Inequality-
The Role of the Bureaucracy
Syndicate Group 2
1st April 2021

Poverty – Multiple Definitions & Multidimensions
• World Bank - less than US$1.90 per day. (PPP)
• UN - Poverty entails more than the lack of income and productive resources to ensure sustainable livelihoods.
• conventional approach- poverty line / to specify a minimum expenditure
• Amartya Sen
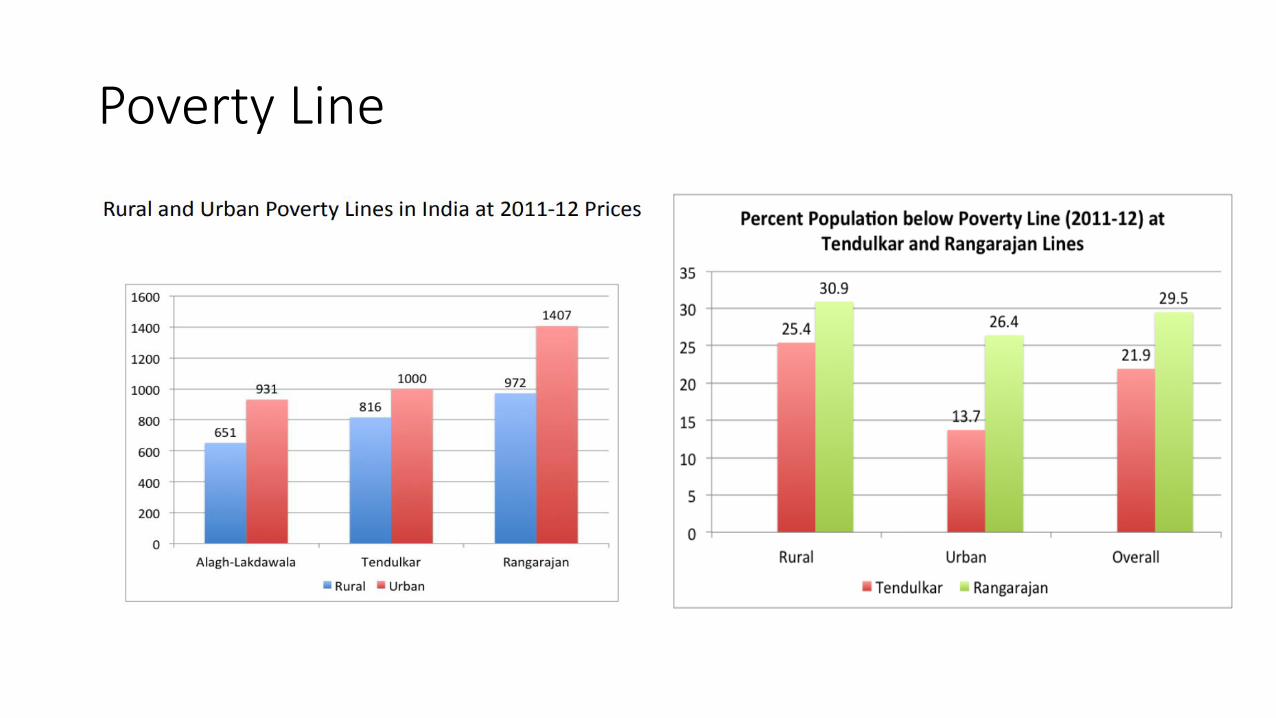
Poverty Line

Tendulkar Methodology

Poverty Trends in India:
Net domestic product by sector and poverty rate
Source: Datt et al. (2016)
Poverty Trends in India

INEQUALITY

Types • Economic Inequality refers to the inequality in terms of wealth
distribution and opportunities among people belonging to different groups, communities or countries.
• Social inequality is the expression of lack of access to housing, health care, education, employment opportunities, politics, and status. It is the exclusion of people from full and equal participation in what we perceive as being valuable, important, personally worthwhile and socially desirable.
• The two are strongly correlated.
• Economic Inequality has an increasing trend which indicates more disparity, which can be appropriately expressed with the cliché “the rich get richer while the poor get poorer”. In other words, it captures the growing gap in assets or income between the richest and the poorest segments of the society.

Types of Economic Inequality • Income Inequality – Income inequality refers to the extent of income
disparity among the people in a group. In this case, income doesn’t just include money received from employment. Rather all the income earned in wages, salaries, return on investments, interest on deposits, dividends from equity, rent, etc.
• Pay Inequality – Pay inequality is slightly different than income inequality as pay includes the payment received from the employment, which can be on an hourly, weekly, monthly, annual basis. The pay, in this case, may also include bonuses.
• Wealth Inequality – Wealth inequality indicates a disparity in terms of total assets owned by an individual or household. These assets also include financial assets, private pension rights, and property.
• One can easily correlate this with a typical situation in rural areas, where landlords have all the wealth, they also give loans to farmers, collect land revenue, collect interest on loans and may even double up as market agents for selling of crops. Thus, there is a huge power asymmetry and inequality becomes sharper.

Measurement of Economic Inequality
• Gini Coefficient – The Gini coefficient helps determine the inequality across the entire society as a whole and not just among some specific income groups. Gini coefficient of 1 indicates maximum inequality, which means that all the income went to a single person and no one else got anything. In contrast, the Gini coefficient of 0 indicates minimum inequality, which means that the income is equally shared in society. The lower the Gini coefficient, the lower, is the inequality.
• The overall correlation between HDI and the Gini inequality measure is negative. Interestingly, there is a slightly positive correlation within countries over time, but the correlation between countries is negative and larger in terms of absolute value.


Trends in Inequality • According to the latest survey by Oxfam, India’s top 1% now holds
almost 40 percent of the nation’s wealth, while the top 10 percent holds almost 70-80 percent. This has brought India among the top three most unequal countries in the world.
• Wealth inequality in India is rising with the Gini wealth coefficient having risen to 83.2% in 2019 from 81.2% in 2008.

Trends in Inequality

Relationship Between Poverty and Inequality • Inequality needs to be distinguished from poverty. Inequality refers to the
degree of dispersion in the distribution of assets, income or consumption. Poverty refers to the assets, income or consumption of those at the bottom of the distribution. Poverty could be conceptualised in relative terms or in absolute terms. People feel themselves to be poor, and think others to be poor if they have substantially less than what is commonplace among others in their society.
• Poverty, in this view, is relative deprivation. If the poverty is conceptualized
in relative terms, there is no need to distinguish it from inequality. A relative measure of poverty is indeed a measure of inequality.
• On the other hand, if poverty is conceptualized in an absolute sense, that
is, focusing on the absolute levels of assets, income or consumption of those at the low end of the distribution, then increases in inequality may be accompanied by reduction in poverty.
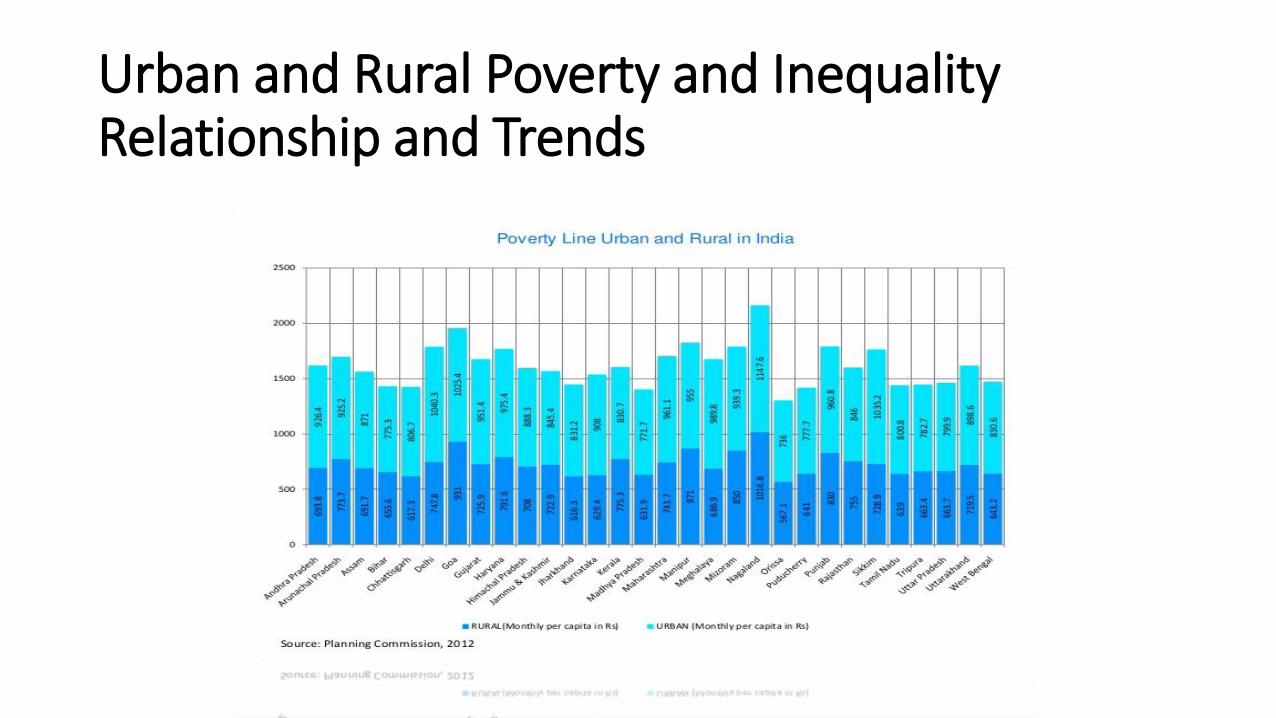
Urban and Rural Poverty and Inequality Relationship and Trends

Inequality after Covid 19 • The COVID-19 pandemic has, further, underscored the need to keep
sustainable development at the very core of any development strategy. The pandemic has challenged the health infrastructure, adversely impacted livelihoods and exacerbated the inequality in the food and nutritional availability in the country.
• The Economic Survey 2019-20 argued that ethical wealth creation – by combining the invisible hand of markets with the hand of trust – provides the way forward for India to develop economically.

Measures to Reduce Income Inequality • Tax slabs: Many companies have different tax slabs as per the income of
the individual. These tax slabs ensure that the person earning more should pay much more tax as compared to the one earning less. An income class can be left out from the taxation system too, that is, tax-free (direct tax). The government can redistribute these collected taxes in the form of other perks and benefits like health and education to the underprivileged section of the society
• Subsidies: Since the tax slabs can help through direct taxes only, subsidies can help in saving other needful expenses of the people. The government can subsidize the essentials like food, water, health, education, etc. for the lower income group
• Easier Availability of Capital: In order to boost entrepreneurship among the lower income group of the society, the government can provide the loans at a cheaper rate of interest.

Poverty Reduction Strategies A brief history :-
• Poverty alleviation- one of the guiding principles of Planning process, land reforms started immediately after independence.
• From Second plan period - focused on the growth of basic and heavy industries – targeting wage employment and increase in national income.
• Fifth five year plan (1974-1979)- Removal of poverty became the main objective (Garibi Hatao).
• Capability development approach accepted in 1990s- social security programmes started.
• Right based approach developed – Right to food and right to work.
Strategies followed-
• Employment based programmes- Wage employment and self employment programmes, creation of assets and minimum wages, targeting poverty of income.
• Food security and Social security based programmes – targeting food security, social protection and welfare measures.
• Skill development programmes - skill and capability development based approach.

Employment based
• Integrated rural development programme(1978)
• National rural livelihood mission
• National Urban livelihood mission
• MGNREGA
Food and Social Security based
• PM Gramin Awaas Yojana
• Old age pension schemes
• National Food Security Mission
• Ayushman Bharat
• PM Jan Dhan Yojana
Skill Development
• PM Kaushal Vikas Yojana
• SANKALP
• UDAAN
• Vocational education

Impacts • Poverty rate reduction very slow till 1970s- low rate of growth, low productivity and
overdependence on agriculture, incomplete land reforms and wars with Pakistan and China.
• Poverty rate reduction accelerated after 1970, rate further improved after Economic reforms in 1991
• 271 million people moved out of poverty between 2005-06 and 2015-16, poverty rate halved –from 55% to 28%.( UNDP MPI Report 2018)

• Better social security and human resource development- eg. PM kaushal Vikas Yojana resulted into more than 60 lakhs trained candidates.
• Gender empowerment – linked to breaking off of vicious cycle of poverty, eg. JAN DHAN scheme, MGNREGA.
• Wage and consumptions based strategies resulted into multidimensional poverty – 55% people in India multidimensional poor.
• Spatial differences in poverty reduction – 2% in Kerala, 40% in Chhattisgarh.
• Urban and rural poverty difference (25% in rural areas, 14% in urban areas)

Role of Bureaucracy in reduction of Poverty and Inequality A Comparative Analyses with other Developing countries

WEBERIAN TRADITION
“There is a strong relationship between states with effective public institutions and their ability to reduce poverty”

Bureaucratic Role in Poverty
Reduction
Through Administrative
Reforms
Through Decentralization
Through Citizen
Participation
Through Legal
Framework

1. Administrative Reforms Reform of the bureaucracy to improve the internal rules and restraint mechanisms that promote public-sector efficiency e.g. Korea bureaucracy heavily involved in micro level project implementation like Agriculture e.g. Taipei & China undertook reforms since 1930s. ‘3 Connected states of administration’ i. planning ii. implementation & iii. Evaluation
Administrative Reforms in Select Developing Countries

2. Decentralization
Empowers local communities providing opportunities to be heard and participate in public decision-making
Case Study 1: India
In 1978, CPI M led West Bengal devolved implementation to Village Panchayat
Led to expansion of employment opportunities & higher agricultural wage rates
Case Study 2: Philippines
landmark Local Government Code in 1992
empowered local communities to build local infrastructure such as public housing, health etc
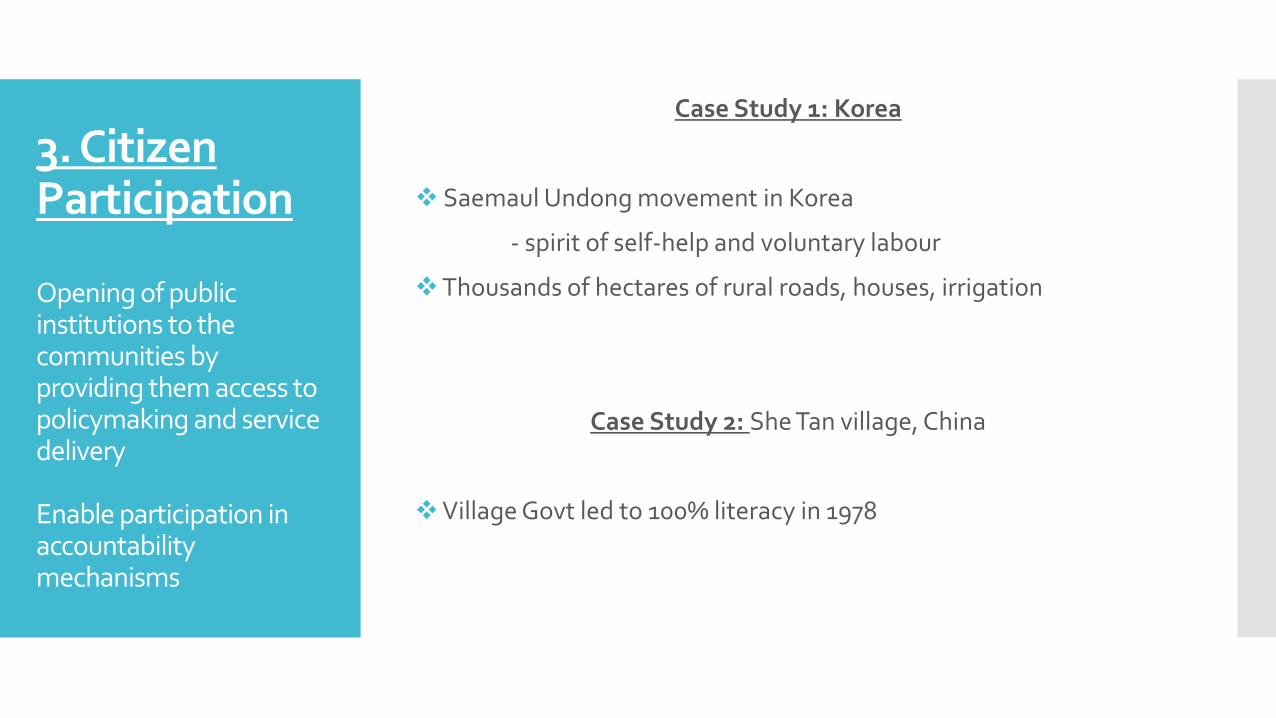
3. Citizen Participation Opening of public institutions to the communities by providing them access to policymaking and service delivery Enable participation in accountability mechanisms
Case Study 1: Korea
Saemaul Undong movement in Korea
- spirit of self-help and voluntary labour
Thousands of hectares of rural roads, houses, irrigation
Case Study 2: She Tan village, China
Village Govt led to 100% literacy in 1978

4. Legal Policy
“Universal Social protection reduces poverty and inequality”
- UNICEF

CASE STUDY:SIKKIM
In 1975, BPL population of 41.43%.
Present BPL population is 9.85%.

WHAT SIKKIM HAS DONE DIFFERENTLY??
• 70% budget allocation for rural development as rural population is around 75% of its
total population.
• Invested in quality education , health and basic infrastructure like roads, electricity
• Promoting traditional craft and industries, low cost housing.

• Decentralisation of administration: Gram Vikas Kendras and Gram Prashashan
Kendras came up in the state. They continue to play a central role in dissemination
of central and state grants and grassroots development planning
• Govt. Jobs 10% of state population holding government jobs as against the
average of 3.55 % in the rest of India
• The One Family One Job Scheme : formalisation of economy with social security
net to its youth. 1,22,000 families will be entitled to the employee benefits.

CONCLUSIONS & WAY FORWARD
The Sustainable Livelihood framework o One way of organising the complex issues surrounding Poverty o Not the only way, It need to be
• Modified & Adapted to local conditions • Made appropriate to local ethos and priorities
Livelihood – used by DFID A livelihood comprises the capabilities, assets, and activities required for a means of living. It is deemed sustainable when it can cope with and recover from stresses and shocks and maintain or enhance its capabilities, assets, and activities both now and in the future, while not undermining the natural resource base. (Chambers, R. & G. Conway, 1992)

PRINCIPLES •People-centered
•Responsive and participatory
•Multilevel
• In partnership with the public and private sectors
•Dynamic
• Sustainable
•Holistic
•Building on strengths

Livelihood Assets
* Singh and Gilman

Expanding the Asset Base

SLF support to Project/Program Planning • Livelihood strategies
• Helps to identify groups of poor people according to their main livelihood sources. Recognizes that households may pursue a range of different livelihood strategies.
• Livelihood assets • Helps identify the principal assets needed to support different livelihoods. includes
economic assets such as employment opportunities, and social assets such as informal safety nets.
• Vulnerability context • Helps identify the main sources of vulnerability associated with certain livelihood
strategies, which are not normally considered systematically in planning processes
• Policies, institutions and processes • Helps to identify institutional and policy influences on poor people’s livelihoods. Draws
attention to the issue of poor people’s access to the structures and processes that can help to transform their livelihoods.
• Livelihood outcomes • Helps to ensure that linkages are made between the above elements and the
achievement of positive livelihood outcomes.

Sustainable Livelihood Framework
Source – DFID,1999
Sector specific impact on Assets – Example “IMPACT OF TRANSPORT/IT ON LIVELIHOOD ASSETS”

Approach in Livelihood Development
Understanding Local Economy and Incentive
Testing in the Field
Training and Building Support
Services
Promotion and Scaling Up
Monitoring and Evaluation

Application SL framework to explore the links between rural livelihoods and common property
resource management (CPRM) in Namibia WILD project - Wildlife Integration for Livelihood Diversification. The project
facilitated participatory livelihoods analysis and land use planning, with continuous feedback of lessons into the community and other communities interested in the project. As such, livelihoods analysis was seen as an intrinsic part of the project, rather than simply a stage within it.
Impact of tourism development from a livelihoods perspective. As such, the aim was to assess how tourism development impacts upon the different aspects of rural livelihoods, using the SL framework as an analytical checklist.
Kenya with an assessment of the livelihoods impact of wildlife enterprises, aiming to identify how such enterprises are contributing to development and conservation.
Tata Trust

Thank You