poultry farm business summarypublications.dyson.cornell.edu/outreach/extension... · poultry farm...
TRANSCRIPT
August 1982 A.E. Ext. 82-25
Poultry Farm Business Summary 1981
D.L Cunningham
Department of Poultry and Avian Sciences
C.A. Bratton •
Department of Agricultural Economics
New Yo rk State College of Agricul ture a nd Li fe Scie nces A Statutory College of th e State University
Cornell University, Ith aca, New York, 14853
TABLE OF CONTENTS
INTRODUCTION ••..•.• « ............................. « • • • • • • 1 Good Management is Basic............................. 2 Gross Farm Income from Poultry and Eggs. United States.
1971-1981 .... « •••••••••••••••••••••••'. ••• • • • •••••• • •••• 3 Farm Price of Eggs and Laying Feed Prices. New York.
1979 to 1981 ......................................... . 4 Prices Paid by Farmers for Selected Items. 1974-1981 •••. 5 General Summary of All Farms .•••••••.•••••..••.•.••••••• 6
SUMMARY OF THE EGG PRODUCING BUSINESSES ••..•••..••••.••••. 8 Physical Resources and Business Practices •.•••••..•••••• 8 Capital Investment ..................................... . 9 Receipts ............................................... . 10 Expenses•••..•••.•.••••••.•••••..•••.••.•••.••••.•••.••• 11 Financial Sununary ...................................... . 12
Farm income .......................................... . 12 Labor and management income •••..•••..••••.••••••••.••• 12 Rate of return on investment .•••.•.•••.••••....••••••. 13 Net farm cash flow and debt repayment ability ••..•••.• 13
ANALYSIS OF THE EGG PRODUCTION BUSINESSES ••.••••.•••.••••. 14 Size of Business ....................................... . 14 Rates of Production.................................... . 15 Labor Efficiency ....................................... . 16 Cost Control ........................................... . 17
Labor and machinery costs •.••••.•• 18 Comparison of Recent Summaries •.••••.••••••••.•.•••••••• 20 Cost of Producing Eggs .•••••.•.••..••••..••••••••.•.•••• 21
FARM BUSINESS SUMMARY: 20 Farms........................ 23 Average Per Hen. 20 Farms ••.•••• 24 26 Farms ...............·......... 25
Progress of the Farm Business .••••••..••••.•.••••..•••.••• 26

1981 NEW YORK POULTRY FARM BUSINESS SUMMARY
Large nonfarm businesses usually prepare and publish an annual report in which they review and analyze the business for the year. This provides a basis for evaluating past operations and for making plans for the future. A similar summary and analysis is useful in managing a farm business. The Cooperative Extension business management projects provide farm operators an annual business report which can be used much the same as nonfarm business annual reports.
Poultry farm business management records have been summarized by the College of Agriculture and Life Sciences at Cornell for a number of years. For the 1981 record year, 26 poultrymen submitted records for summary and analysis. Extension field staff working with poultrymen collected the figures for each farm and the College staff summarized them. The summary results are presented in this workbook.
Poultry farm businesses vary in organizational makeup. The farms included in this report were divided into two groups; poultry (egg production) only, and poultry and others which include those with other major enterprises such as crops, dairy or hogs.
The economic climate for poultrymen in 1981 was improved over 1980. Egg prices were higher in 1981. Layer feed prices for 1981 averaged lower than 1980 and the cost of producing eggs was 2.5¢ less in 1981. However, many poultrymen still had negative labor incomes for 1981.
This workbook is designed to provide a systematic summarization and analysis of a poultry business. The group averages can be used in making comparisons. Working through this report step by step provides a good checkup for a poultry operation. In addition to the persons whose records are in the summary, this report should be useful to other poultrymen in the State, to teachers of agriculture, college farm management instructors, agency representatives. and to agribusiness persons.
Acknowledgements
This summary was prepared by D. L. Cunninghal'l, Department of Poultry &
Avian Sciences and C. A. Bratton, Departrrlent of Agricultural Economics, New York State College of Agriculture and Life Sciences, in cooperation with Cooperative Extension Specialists S. E. Ackerman, A. Aja and W. J. Toleman. Barbara Wilcox supervised the summarization of the records and Barbara Smagner typed this report.
-2
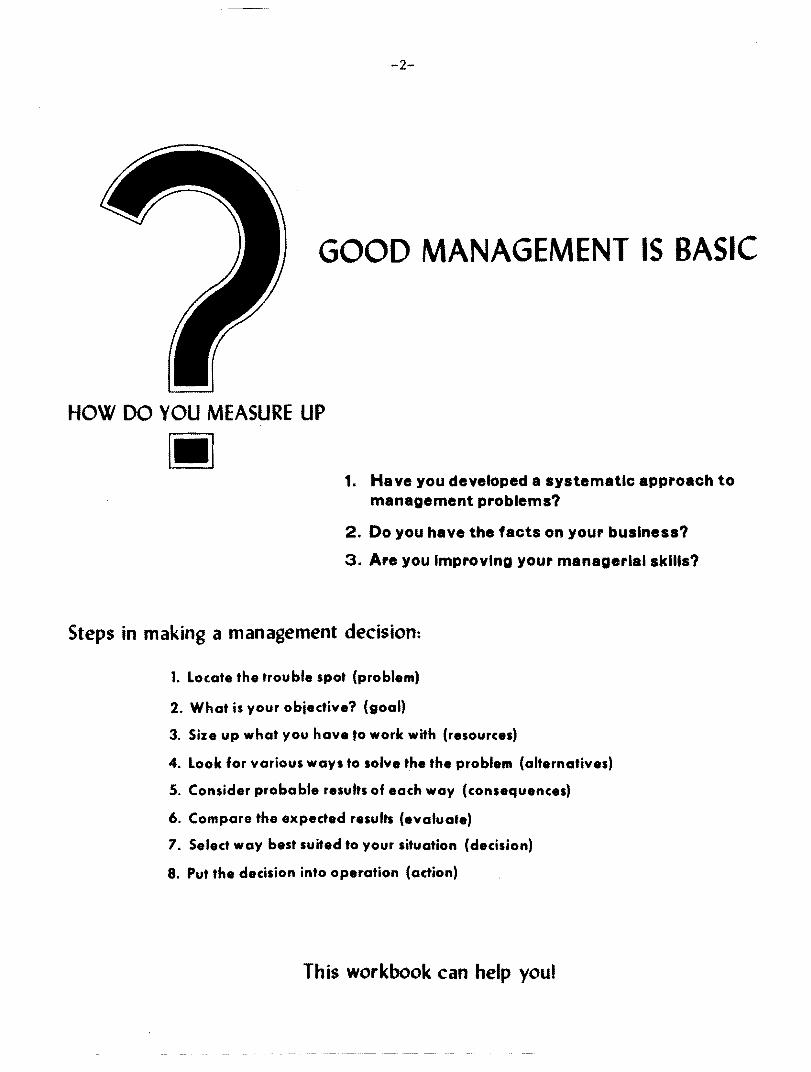
GOOD MANAGEMENT IS BASIC
HOW DO YOU MEASURE UP
• 1. Have you developed a systematic approach to management problems?
2. Do you have the facts on your business?
3. Are you Improving your managerial skills?
Steps in making a management decision:
1. Locate the trouble spot (problem)
2. What is your obiective? (goal)
3. Size up what you have to work with (resources)
4. Look for various ways to solve the the problem (alternatives)
5. Consider probable results of each way (consequences)
6. Compare the expected results (evaluate)
7. Select way best suited to your situation (decision)
8. Put the decision into operation (action)
This workbook can help youl
-3
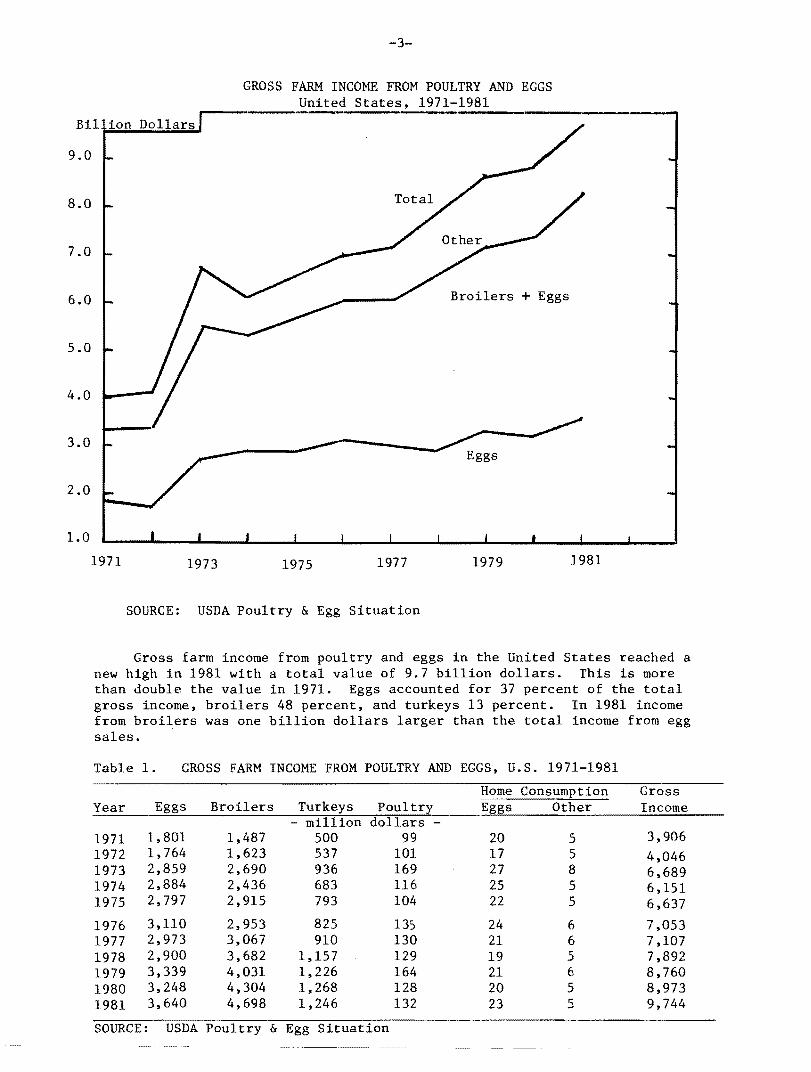
GROSS FARM INCOME FROM POULTRY AND EGGS United States, 1971-1981
Billion Dollars
9.0
8.0
7.0
6.0
5.0
4.0
- -
Broilers + Eggs
3.0
2.0
Eggs
1.0
1971 1973 1975 1977 1979 1981
SOURCE: USDA Poultry & Egg Situation
new Gross farm income
high in 1981 with a from poultry and eggs in the United total value of 9.7 billion dollars.
States reached This is more
a
than double the value in 1971. Eggs accounted for 37 percent of the total gross income, broilers 48 percent. and turkeys 13 percent. In 1981 income from broilers was one billion dollars larger than the total income from egg sales.
Table 1. GROSS FARM INCOME FROM POULTRY AND EGGS. U.S. 1971-1981
Year Eggs Broilers Turkeys Poultry - million dollars -
Home Consumption Eggs Other
Gross Income
1971 1972 1973 1974 1975
1,801 1. 764 2.859 2,884 2,797
1,487 1,623 2,690 2,436 2.915
500 537 936 683 793
99 101 169 116 104
20 17 27 25 22
5 5 8 5 5
3,906 4,046 6,689 6,151 6.637
1976 1977 1978 1979 1980 1981
3,110 2,973 2.900 3.339 3.248 3.640
2,953 3.067 3,682 4,031 4,304 4.698
825 910
1,157 1,226 1,268 1.246
13:; 130 129 164 128 132
24 21 19 21 20 23
6 6 5 6 5 5
7.053 7,107 7,892 8,760 8,973 9.744
SOURCE: USDA Poultry & Egg Situation
-4
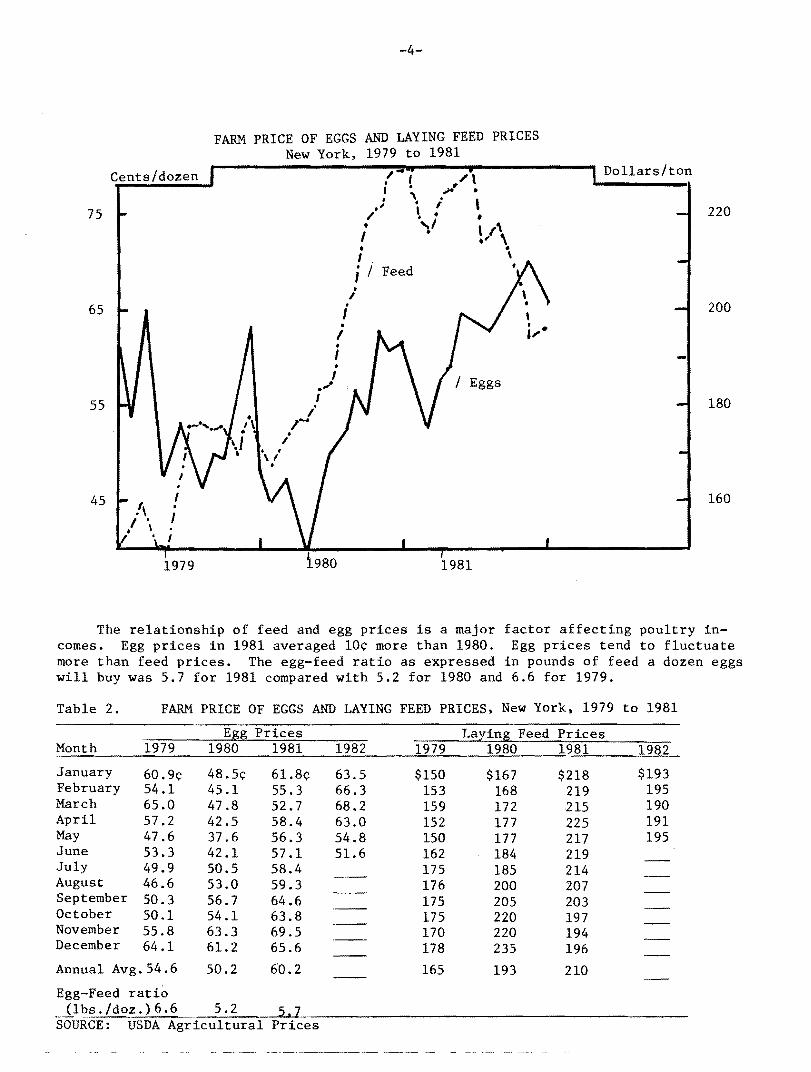
FARM PRICE OF EGGS AND LAYING FEED PRICES New York, 1979 to 1981
~------------------~/~~~----~~----------~ Dollars/tonCents/dozen ., 1",I • ,,;<If'.. , . ,
220.; • f75 ,. '. ,: \1 t/\I . \• •\I
• / FeedI
I • 20065 .i
I•I •I
.". / Eggs I 18055 /r
I •
16045
1979 1981
The relationship of feed and egg prices is a major factor affecting poultry incomes. Egg prices in 1981 averaged 10¢ more than 1980. Egg prices tend to fluctuate more than feed prices. The egg-feed ratio as expressed in pounds of feed a dozen eggs will buy was 5.7 for 1981 compared with 5.2 for 1980 and 6.6 for 1979.
Table 2. FARM PRICE OF EGGS AND LAYING FEED PRICES, New York, 1979 to 1981
Egg Prices Laying Feed Prices Month 1979 1980 1981 1982 1979 1980 1981 1982
January 60.9¢ 48.5¢ 61.8¢ 63.5 $150 $167 $218 $193 February 54.1 45.1 55.3 66.3 153 168 219 195 March 65.0 47.8 52.7 68.2 159 172 215 190 April 57.2 42.5 58.4 63.0 152 177 225 191 May 47.6 37.6 56.3 54.8 150 177 217 195 June 53.3 42.1 57.1 51.6 162 184 219 July 49.9 50.5 58.4 175 185 214 August 46.6 53.0 59.3 176 200 207 September 50.3 56.7 64.6 175 205 203 October 50.1 54.1 63.8 175 220 197 November 55.8 63.3 69.5 170 220 194 December 64.1 61.2 65.6 178 235 196 Annual Avg.54.6 50.2 60.2 165 193 210
Egg-Feed ratio _J..1bs. /doz.) 6.6 5.2 5.1 SOURCE: USDA Agricultural Prices
- - ".---~.--------~..- --- -.-----~..
-5
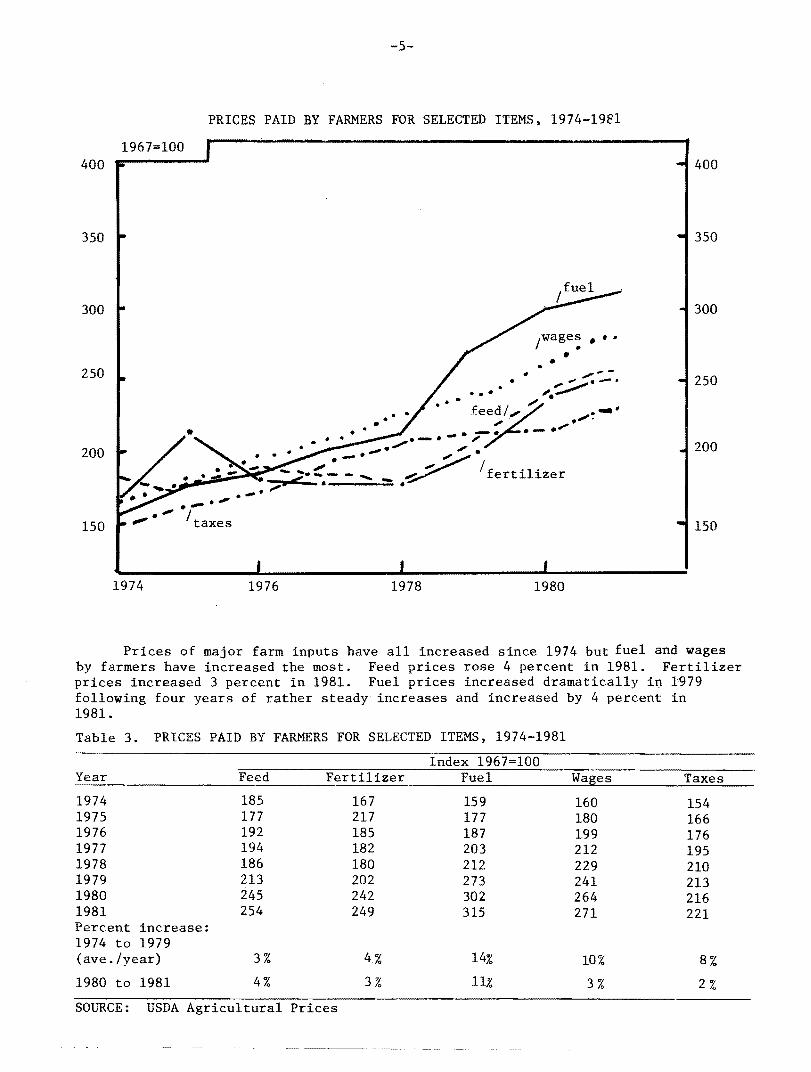
PRICES PAID BY FARMERS FOR SELECTED ITEMS, 1974-1981
1967=100 400
350
300
250
200
150
.. . ~
"."- ;;- ... -".... ....
"" •
.--.,. /taxes
•... ., .; ,::"-. .. - '.~ .... fY-/" ·•• • ",ee" .....!
". ".."...... .-."..-- .... ,..".,... ,'"'~ / .. _ _ ~ fert1.11.zer.
400
350
300
250
200
150
1974 1976 1978 1980
Prices of major farm inputs have all increased since 1974 but fuel and wages by farmers have increased the most. Feed prices rose 4 percent in 1981. Fertilizer prices increased 3 percent in 1981. Fuel prices increased dramatically in 1979 following four years of rather steady increases and increased by 4 percent in 1981.
Table 3. PRICES PAID BY FARMERS FOR SELECTED ITEMS, 1974-1981
Index 1967=100 Year Feed Fertilizer Fuel Wages Taxes
1974 185 167 159 160 154 1975 177 217 177 180 166 1976 192 185 187 199 176 1977 194 182 203 212 195 1978 186 180 212 229 210 1979 213 202 273 241 213 1980 245 242 302 264 216 1981 254 249 315 271 221 Percent increase: 1974 to 1979 (ave./year) 3% 4,% 14% 10% 8%
1980 to 1981 4% 3% 11% 3% 2%
SOURCE: USDA Agricultural Prices
-6
General Summary of All Farms
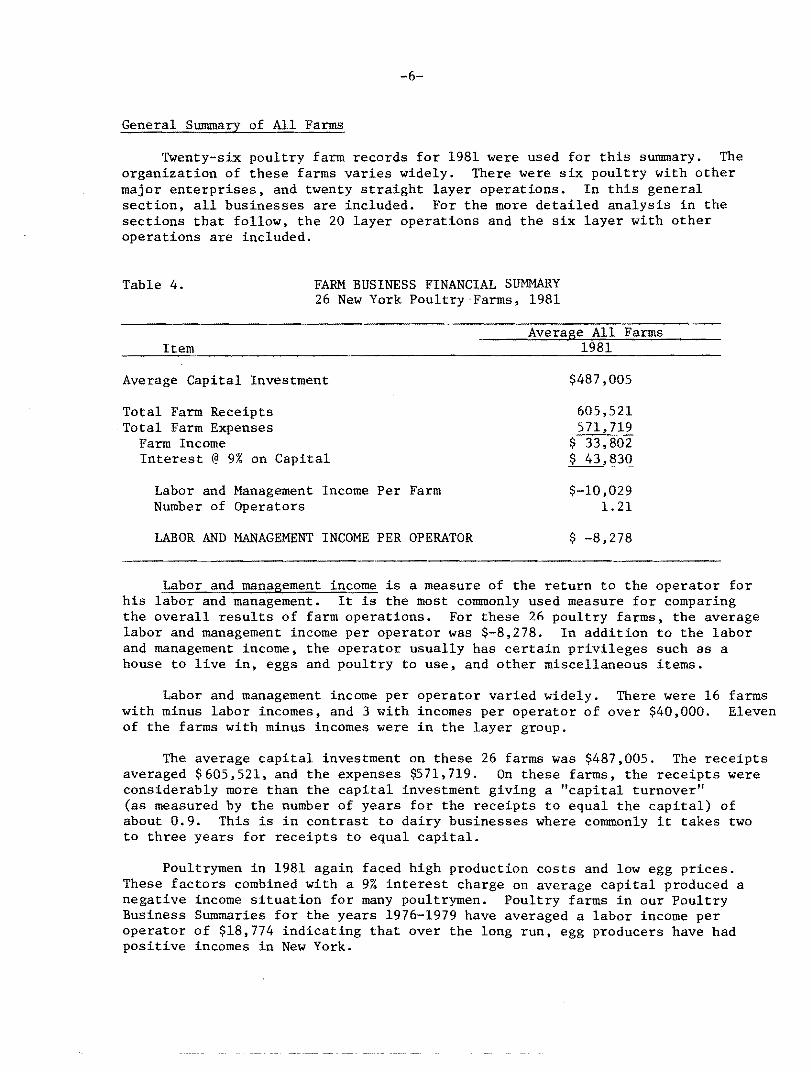
Twenty-six poultry farm records for 1981 were used for this summary. The organization of these farms varies widely. There were six poultry with other major enterprises, and twenty straight layer operations. In this general section, all businesses are included. For the more detailed analysis in the sections that follow, the 20 layer operations and the six layer with other operations are included.
Table 4. FARM BUSINESS FINANCIAL SUMMARY 26 New York Poultry-Farms, 1981
Average All Farms Item 1981
Average Capital Investment
Total Farm Receipts Total Farm Expenses
Farm Income Interest @ 9% on Capital
Labor and Management Income Per Farm Number of Operators
LABOR AND MANAGEMENT INCOME PER OPERATOR
$487,005
605,521 571,719
$ 33,802 $ 43,830
$-10,029 1.21
$ -8,278
Labor and management income is a measure of the return to the operator for his labor and management. It is the most commonly used measure for comparing the overall results of farm operations. For these 2n poultry farms, the average labor and management income per operator was $-8,278. In addition to the labor and management income, the operator usually has certain privileges such as a house to live in, eggs and poultry to use. and other miscellaneous items.
Labor and management income per operator varied widely. There were 16 farms with minus labor incomes. and 3 with incomes per operator of over $40,000. Eleven of the farms with minus incomes were in the layer group.
The average capital investment on these 26 farms was $487,005. The receipts averaged $605,521, and the expenses $571,719. On these farms, the receipts were considerably more than the capital investment giving a "capital turnover" (as measured by the number of years for the receipts to equal the capital) of about 0.9. This is in contrast to dairy businesses where commonly it takes two to three years for receipts to equal capital.
Poultrymen in 1981 again faced high production costs and low egg prices. These factors combined with a 9% interest charge on average capital produced a negative income situation for many poultrymen. Poultry farms in our Poultry Business Summaries for the years 1976-1979 have averaged a labor income per operator of $18.774 indicating that over the long run, egg producers have had positive incomes in New York.
-7
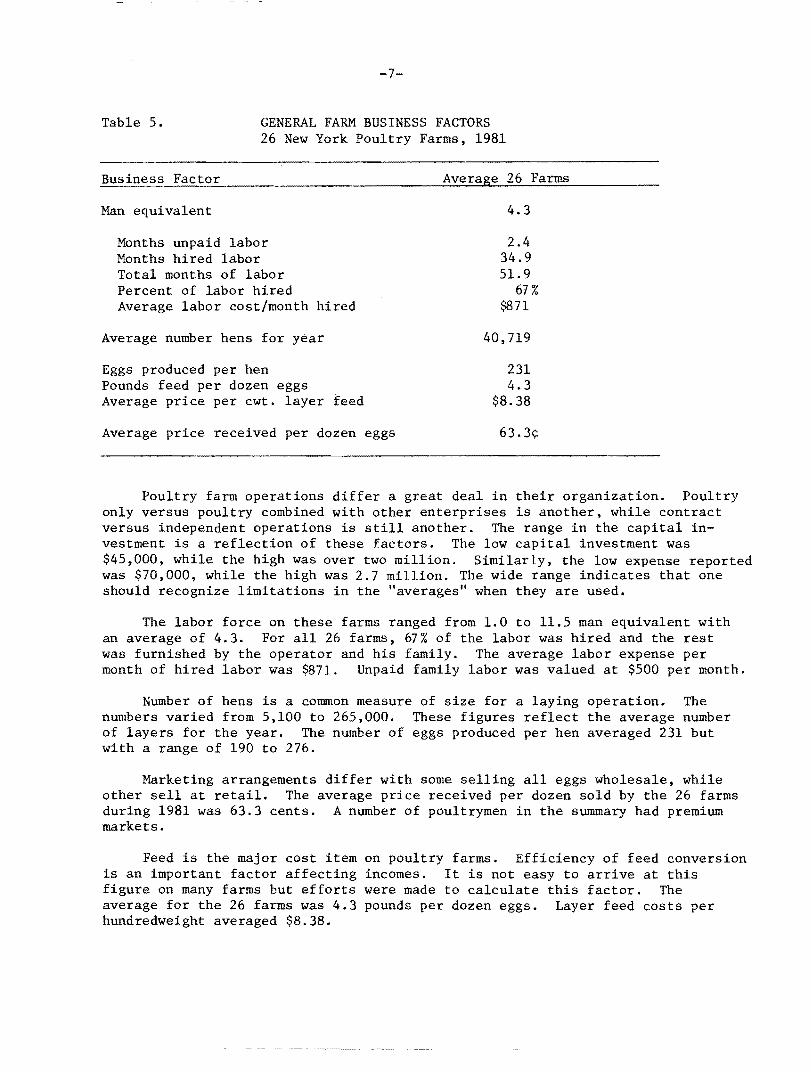
Table 5. GENERAL FARM BUSINESS FACTORS 26 New York Poultry Farms, 1981
Business Factor Average 26 Farms
Man equivalent 4.3
Months unpaid labor 2.4 Months hired labor 34.9 Total months of labor 51.9 Percent of labor hired 67% Average labor cost/month hired $871
Average number hens for year 40,719
Eggs produced per hen 231 Pounds feed per dozen eggs 4.3 Average price per cwt. layer feed $8.38
Average price received per dozen eggs 63.3¢.
Poultry farm operations differ a great deal in their organization. Poultry only versus poultry combined with other enterprises is another, while contract versus independent operations is still another. The range in the capital investment is a reflection of these factors. The low capital investment was $45,000, while the high was over two million. Similarly, the low expense reported was $70,000, while the high was 2.7 million. The wide range indicates that one should recognize limitations in the "averages" when they are used.
The labor force on these farms ranged from 1.0 to 11.5 man equivalent with an average of 4.3. For all 26 farms, 67% of the labor was hired and the rest was furnished by the operator and his family. The average labor expense per month of hired labor was $871. Unpaid family labor was valued at $500 per month.
Number of hens is a common measure of size for a laying operation. The numbers varied from 5,100 to 265,000. These figures reflect the average number of layers for the year. The number of eggs produced per hen averaged 231 but with a range of 190 to 276.
Marketing arrangements differ with some selling all eggs wholesale, while other sell at retail. The average prjce received per dozen sold by the 26 farms during 1981 was 63.3 cents. A number of poultrymen in the summary had premium markets.
Feed is the major cost item on poultry farms. Efficiency of feed conversion is an important factor affecting incomes. It is not easy to arrive at this figure on many farms but efforts were made to calculate this factor. The average for the 26 farms was 4.3 pounds per dozen eggs. Layer feed costs per hundredweight averaged $8.38.
-8
SUMMARY OF THE EGG PRODUCING BUSINESSES
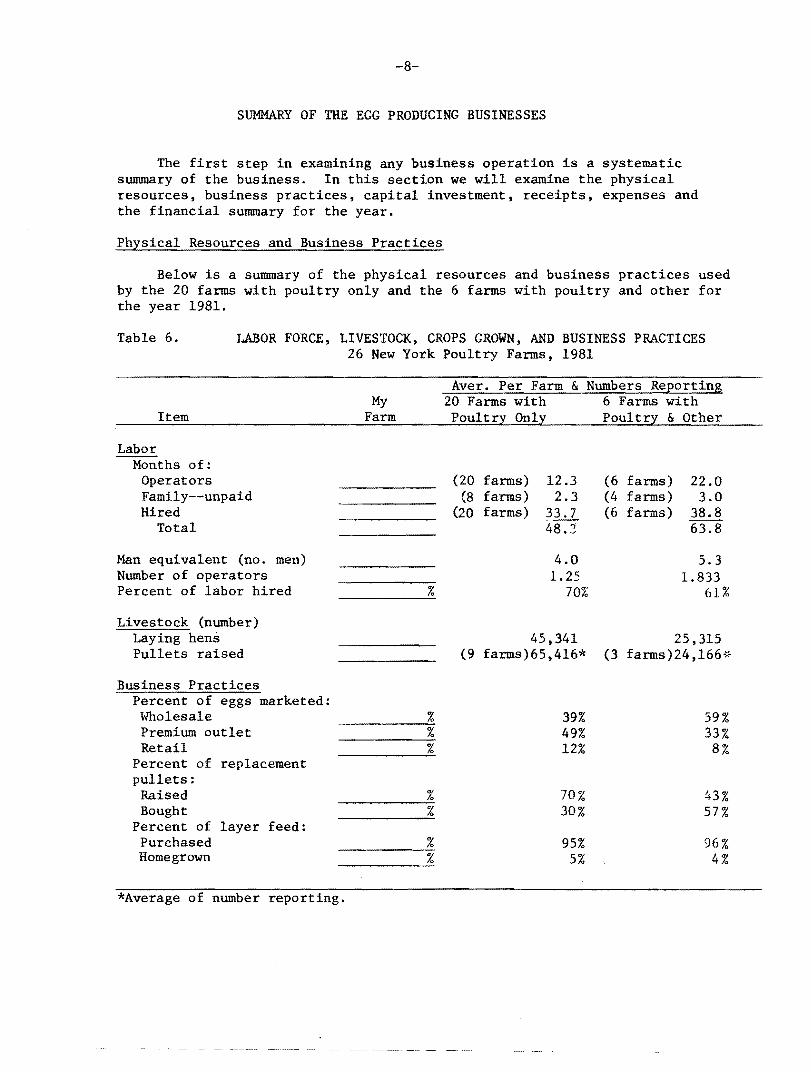
The first step in examining any business operation is a systematic summary of the business. In this section we will examine the physical resources, business practices, capital investment, receipts, expenses and the financial summary for the year.
Physical Resources and Business Practices
Below is a summary of the physical resources and business practices used by the 20 farms with poultry only and the 6 farms with poultry and other for the year 1981.
Table 6. LABOR FORCE, LIVESTOCK, CROPS GROWN, AND BUSINESS PRACTICES 26 New York Poultry Farms, 1981
Aver. Per Farm & Numbers Reporting My 20 Farms with 6 Farms with
Item Farm Poultry Only Poultry & Other
Labor Months of:
Operators (20 farms) 12.3 (6 farms) 22.0 Family--unpaid (S farms) 2.3 (4 farms) 3.0 Hired (20 farms) 33.7 (6 farms) 3S.S
Total 48.5 63.S
Man equivalent (no. men) 4.0 5.3 Number of operators 1.25 1.S33 Percent of labor hired % 70% 61%
Livestock (number) Laying hens 45,341 25,315 Pullets raised (9 farms)65,4l6* (3 farms) 24, 166 {~
Business Practices Percent of eggs marketed: Wholesale % 39% 59% Premium outlet % 49% 33% Retail % 12% S%
Percent of replacement pullets:
Raised % 70% 43% Bought % 30% 57%
Percent of layer feed: Purchased % 95% 96% Homegrown % 5% 4%
*Average of number reporting.
------
------
-9
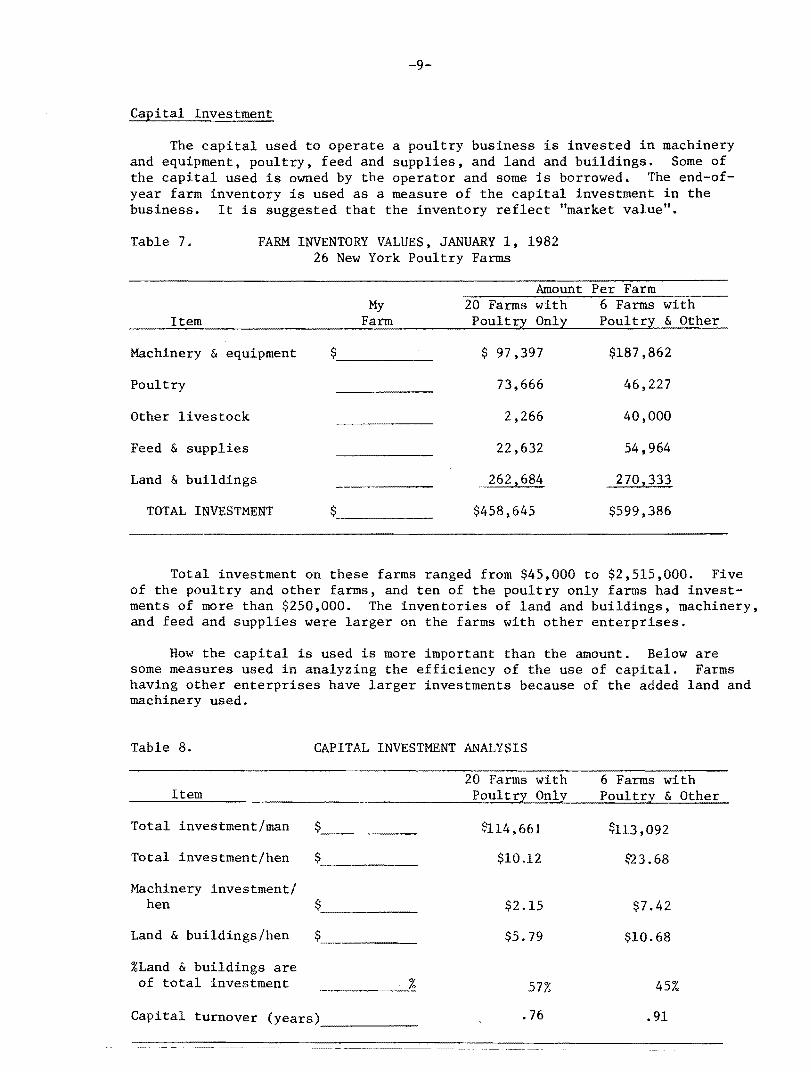
Capital Investment
The capital used to operate a poultry business is invested in machinery and equipment, poultry, feed and supplies, and land and buildings. Some of the capital used is owned by the operator and some is borrowed. The end-ofyear farm inventory is used as a measure of the capital investment in the business. It is suggested that the inventory reflect "market value".
Table 7. FARM INVENTORY VALUES, JANUARY 1, 1982 26 New York Poultry Farms
Amount Per Farm My 20 Farms with
Item Farm Poultry Only
Machinery £. equipment $ 97,397
Poultry 73,666
Other livestock 2,266
Feed £. supplies 22,632
Land £. buildings 262 2 684
6 Farms with Poultry £. Other
$187,862
46,227
40,000
54,964
270 2 333
TOTAL INVESTMENT $458,645 $599,386
Total investment on these farms ranged from $45,000 to $2,515,000. Five of the poultry and other farms, and ten of the poultry only farms had investments of more than $250,000. The inventories of land and buildings, machinery, and feed and supplies were larger on the farms with other enterprises.
How the capital is used is more important than the amount. Below are some measures used in analyzing the efficiency of the use of capital. Farms having other enterprises have larger investments because of the added land and machinery used.
Table 8. CAPITAL INVESTMENT ANALYSIS
Farms with 6 Farms with Item Poultry Only Poultry £. Other
Total investment/man $114,661 $113,092
Total investment/hen $ $10.12 $23.68
Machinery investment/ hen $2.15 $7.42
Land & buildings/hen $5.79 $10.68
%Land £. buildings are of total investment 57% 45%
Capital turnover (years .76 .91
-_...~.~-~
-10
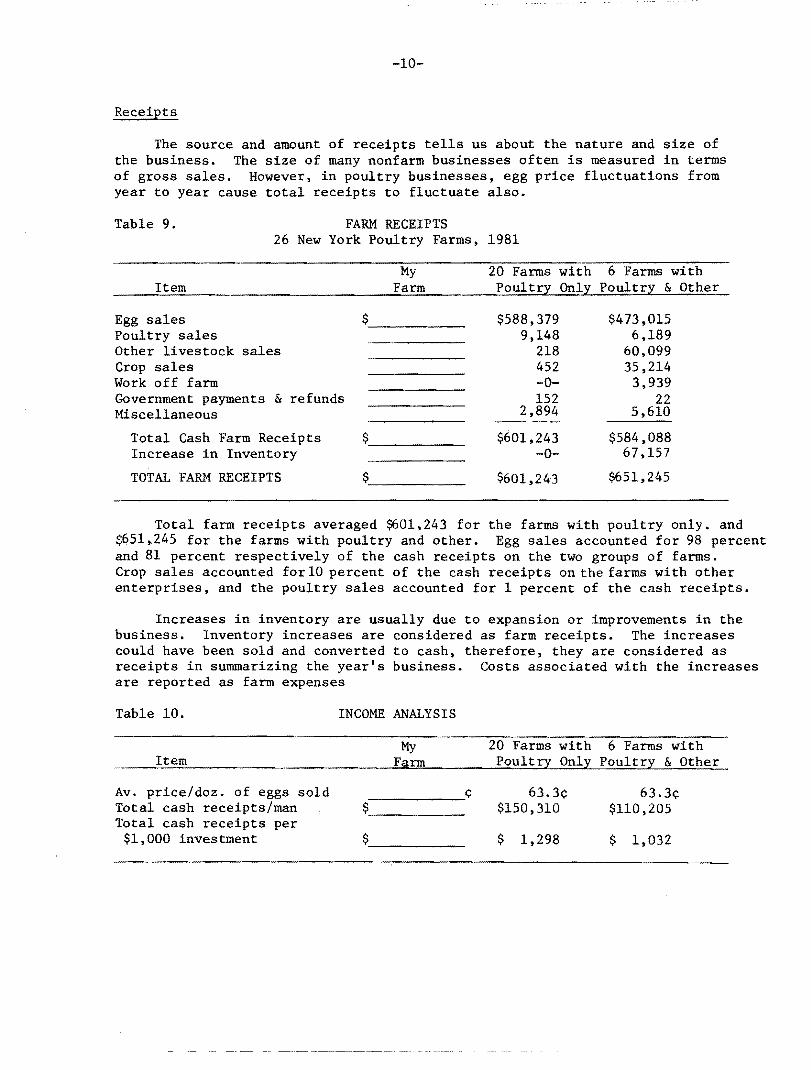
Receipts
The source and amount of receipts tells us about the nature and size of the business. The size of many nonfarm businesses often is measured in terms of gross sales. However, in poultry businesses, egg price fluctuations from year to year cause total receipts to fluctuate also.
Table 9. FARM RECEIPTS 26 New York Poultry Farms, 1981
My 20 Farms with 6 Farms with Item Farm Poult!X Onl~ Poultr~ & Other
Egg sales Poultry sales Other livestock sales Crop sales Work off farm Government payments & refunds Miscellaneous
$ $588,379 9,148
218 452 -0152
2,894
$473,015 6,189
60,099 35,214
3,939 22
5,610 ----~
Total Cash Farm Receipts Increase in Inventory
$ $601,243 -0
$584,088 67,157
TOTAL FARM RECEIPTS $ $601.243 $651.245
Total farm receipts averaged ~Ol.243 for the farms with poultry only. and $651~245 for the farms with poultry and other. Egg sales accounted for 98 percent and 81 percent respectively of the cash receipts on the two groups of farms. Crop sales accounted for 10 percent of the cash receipts on the farms with other enterprises, and the poultry sales accounted for 1 percent of the cash receipts.
Increases in inventory are usually due to expansion or improvements in the business. Inventory increases are considered as farm receipts. The increases could have been sold and converted to cash, therefore, they are considered as receipts in summarizing the year's business. Costs associated with the increases are reported as farm expenses
Table 10. INCOME ANALYSIS
My 20 Farms with 6 Farms with Item Farm Poultr~ Only Poultry & Other
Av. price/doz. of eggs sold 63.3<; 63.3<;------<;Total cash receipts/man $150,310 $110,205$_---Total cash receipts per
$1,000 investment $ 1,298 $ 1,032$_---
-11
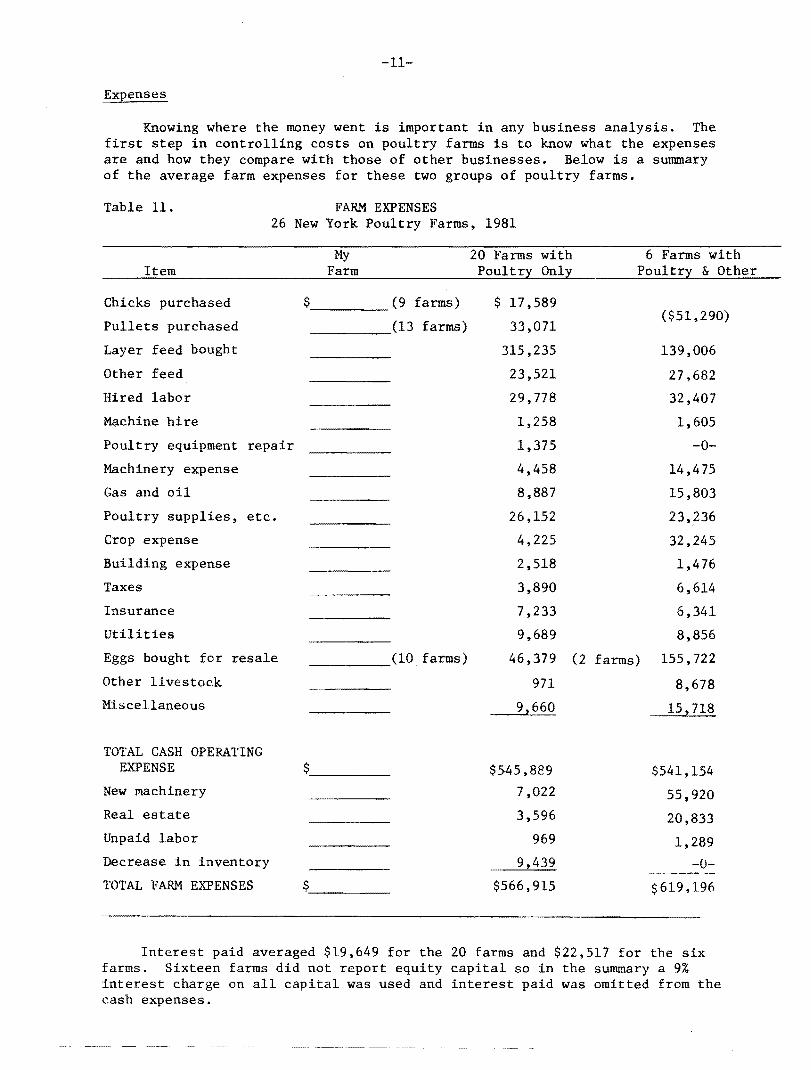
Expenses
Knowing where the money went is important in any business analysis. The first step in controlling costs on poultry farms is to know what the expenses are and how they compare with those of other businesses. Below is a summary of the average farm expenses for these two groups of poultry farms.
Table 11. FARM EXPENSES 26 New York Poultry Farms, 1981
My 20 Farms with 6 Farms with Item Farm Poultry Only Poultry & Other
Chicks purchased
Pullets purchased
Layer feed bought
Other feed
Hired labor
Machine hire
Poultry equipment repair
Machinery expense
Gas and oil
Poultry supplies, etc.
Crop expense
Building expense
Taxes
Insurance
Utilities
Eggs bought for resale
Other livestock
Miscellaneous
TOTAL CASH OPERATING EXPENSE
New machinery
Real estate
Unpaid labor
Decrease in inventory
TOTAL FARM EXPENSES
$_--- (9 farms)
(13 farms)
(10 farms)
$ 17,589
33,071
315,235
23,521
29,778
1,258
1,375
4,458
8,887
26,152
4,225
2,518
3,890
7,233
9,689
46,379
971
9!660
(2 farms)
($51,290)
139,006
27,682
32,407
1,605
-0
14,475
15,803
23,236
32,245
1,476
6,614
6,341
8,856
155,722
8,678
15,718
$5-45,889
7,022
3,596
969
9,439
$566,915
$541,154
55,920
20,833
1,289
-0-
$619,196
Interest paid averaged $19,649 for the 20 farms and $22,517 for the six farms. Sixteen farms did not report equity capital so in the summary a 9% interest charge on all capital was used and interest paid was omitted from the cash expenses.
---------------------------------------
-12
Financial Summary
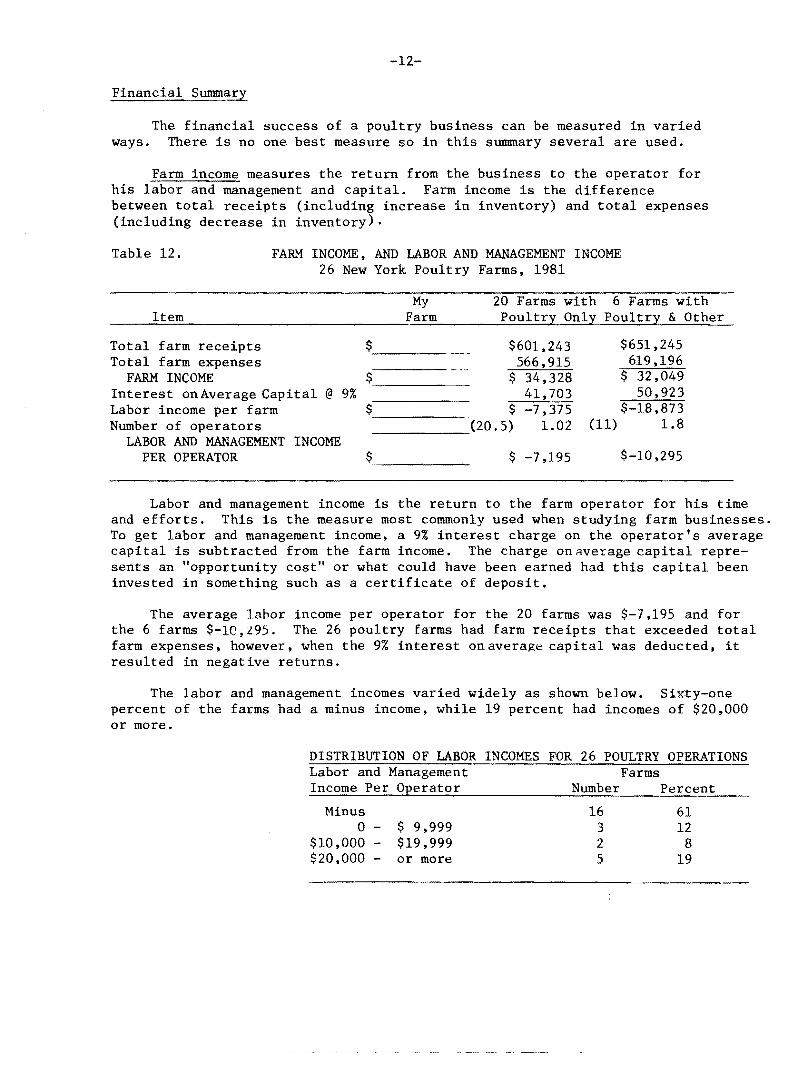
The financial success of a poultry business can be measured in varied ways. There is no one best measure so in this summary several are used.
Farm income measures the return from the business to the operator for his labor and management and capital. Farm income is the difference between total receipts (including increase in inventory) and total expenses (including decrease in inventory).
Table 12. FARM INCOME, AND LABOR AND MANAGEMENT INCOME 26 New York Poultry Farms, 1981
My 20 Farms with 6 Farms with Item Farm Poultry Only Poultry & Other
Total farm receipts $ $601,243 $651,245 Total farm expenses 566,915 619,196
FARM INCOME $ 34,328 $ 32.049 Interest onAverage Capital @ 9% 41,703 50,923 Labor income per farm $ $ -7,375 $-18.873 Number of operators ___________(20.5) 1.02 (11) 1.8
LABOR AND MANAGEMENT INCOME PER OPERATOR $ $ -7,195 $-10,295
Labor and management income is the return to the farm operator for his time and efforts. This is the measure most commonly used when studying farm businesses. To get labor and management income, a 9% interest charge on th~ operator's average capital is subtracted from the farm income. The charge on average capital represents an "opportunity cost" or what could have been earned had this capital been invested in something such as a certificate of deposit.
The average lahor income per operator for the 20 farms was $-7.195 and for the 6 farms $-10.l95. The 26 poultry farms had farm receipts that exceeded total farm expenses, however. when the 9% interest on average capital was deducted, it resulted in negative returns.
The labor and management incomes varied Widely as shown below. Sixty-one percent of the farms had a minus income, while 19 percent had incomes of $20,000 or more.
DISTRIBUTION OF LABOR INCOMES FOR 26 POULTRY OPERATIONS Labor and Management Farms Income Per Operator Number Percent
~Unus 16 61 o - $ 9,999 3 12
$10,000 - $19,999 2 8 $20.000 - or more 5 19
-13
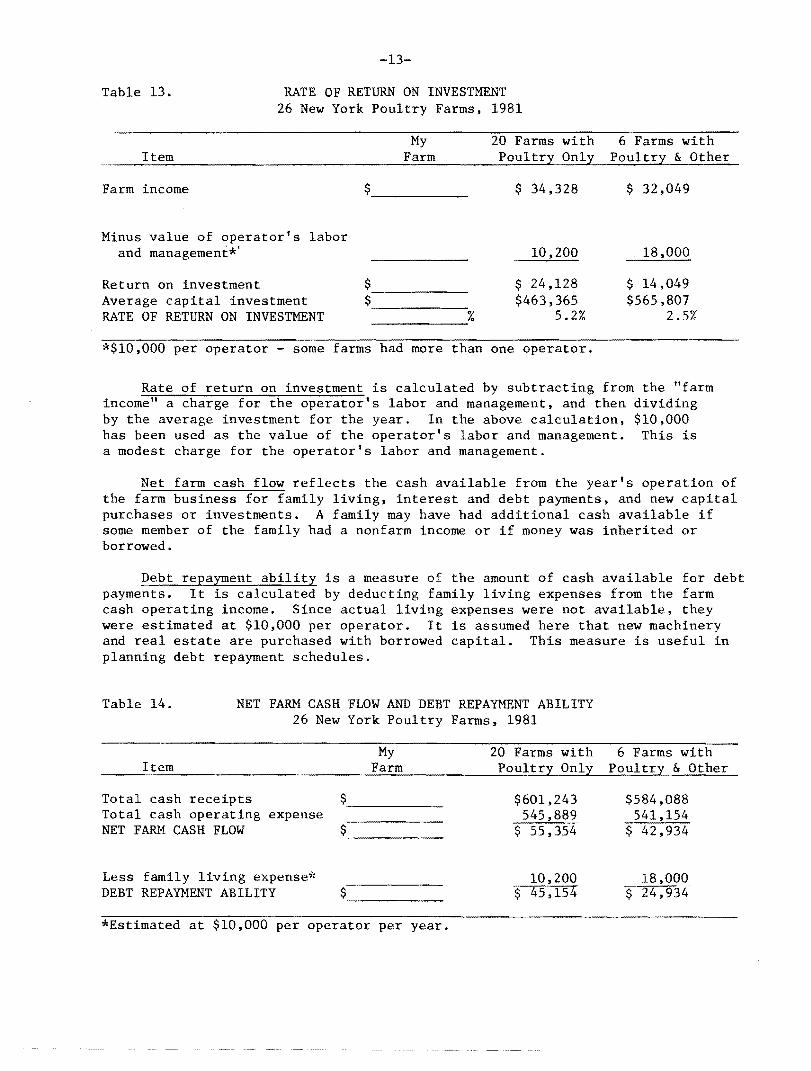
Table 13. RATE OF RETURN ON INVESTMENT 26 New York Poultry Farms, 1981
Item My
Farm 20 Farms with Poultry Only
6 Farms with Poultry & Other
Farm income $_--- $ 34,328 $ 32,049
Minus value of operator's labor and management*' 10,200 18,000
Return on investment Average capital investment RATE OF RETURN ON INVESTMENT
$ 24,128 $463,365
5.2%
$ 14,049 $565,807
2 . .'5%
*$10,000 per operator - some farms had more than one operator.
Rate of return on investment is calculated by subtracting from the "farm income" a charge for the operator's labor and management, and then dividing by the average investment for the year. In the above calculation, $10,000 has been used as the value of the operator's labor and management. This is a modest charge for the operator's labor and management.
Net farm cash flow reflects the cash available from the year's operation of the farm business for family living, interest and debt payments, and new capital purchases or investments. A family may have had additional cash available if some member of the family had a nonfarm income or if money was inherited or borrowed.
Debt repayment ability is a measure of the amount of cash available for debt payments. It is calculated by deducting family living expenses from the farm cash operating income. Since actual living expenses were not available, they were estimated at $10,000 per operator. It is assumed here that new machinery and real estate are purchased with borrowed capital. This measure is useful in planning debt repayment schedules.
Table 14. NET FARM CASH FLOW AND DEBT REPAYMENT ABILITY 26 New York Poultry Farms, 1981
Item My
Farm 20 Farms with Poultry Only
6 Farms with Poultry & Other
Total cash receipts Total cash operating expense NET FARM CASH FLOW
$_--- $601,243 545,889
$ 55,354
$584,088 541,154
$ 42,934
Less family living expense* DEBT REPAYMENT ABILITY
10,200 $ 45,154
18,000 $ 24,934
*Estimated at $10,000 per operator per year.
-14
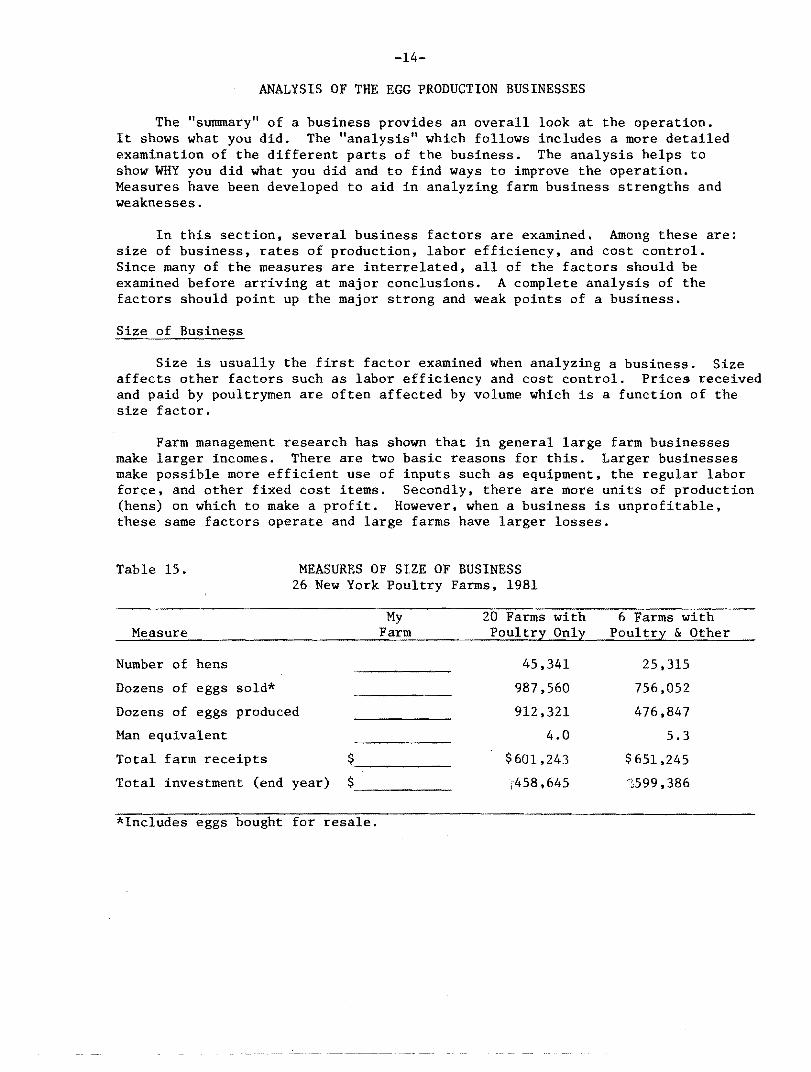
ANALYSIS OF THE EGG PRODUCTION BUSINESSES
The "summary" of a business provides an overall look at the operation. It shows what you did. The "analysis" which follows includes a more detailed examination of the different parts of the business. The analysis helps to show WHY you did what you did and to find ways to improve the operation. Measures have been developed to aid in analyzing farm business strengths and weaknesses.
In this section. several business factors are examined. Among these are: size of business. rates of production. labor efficiency, and cost control. Since many of the measures are interrelated, all of the factors should be examined before arriving at major conclusions. A complete analysis of the factors should point up the major strong and weak points of a business.
Size of Business
Size is usually the first factor examined when analyzing a business. Size affects other factors such as labor efficiency and cost control. Prices received and paid by poultrymen are often affected by volume which is a function of the size factor.
Farm management research has shown that in general large farm businesses make larger incomes. There are two basic reasons for this. Larger businesses make possible more efficient use of inputs such as equipment. the regular labor force. and other fixed cost items. Secondly, there are more units of production (hens) on which to make a profit. However, when a business is unprofitable. these same factors operate and large farms have larger losses.
Table 15. MEASURES OF SIZE OF BUSINESS 26 New York Poultry Farms, 1981
Measure My
Farm 20 Farms Poultry
with Only
6 Farms with Poultry & Other
Number of hens 45,341 25.315
Dozens of eggs sold* 987.560 756.052
Dozens of eggs produced
Man equivalent
912,321
4.0
476.847
5.3
Total farm receipts $ $601,243 $651,245
Total investment (end year) $ ,:458,645 'i599,386
*Includes eggs bought for resale.
-15
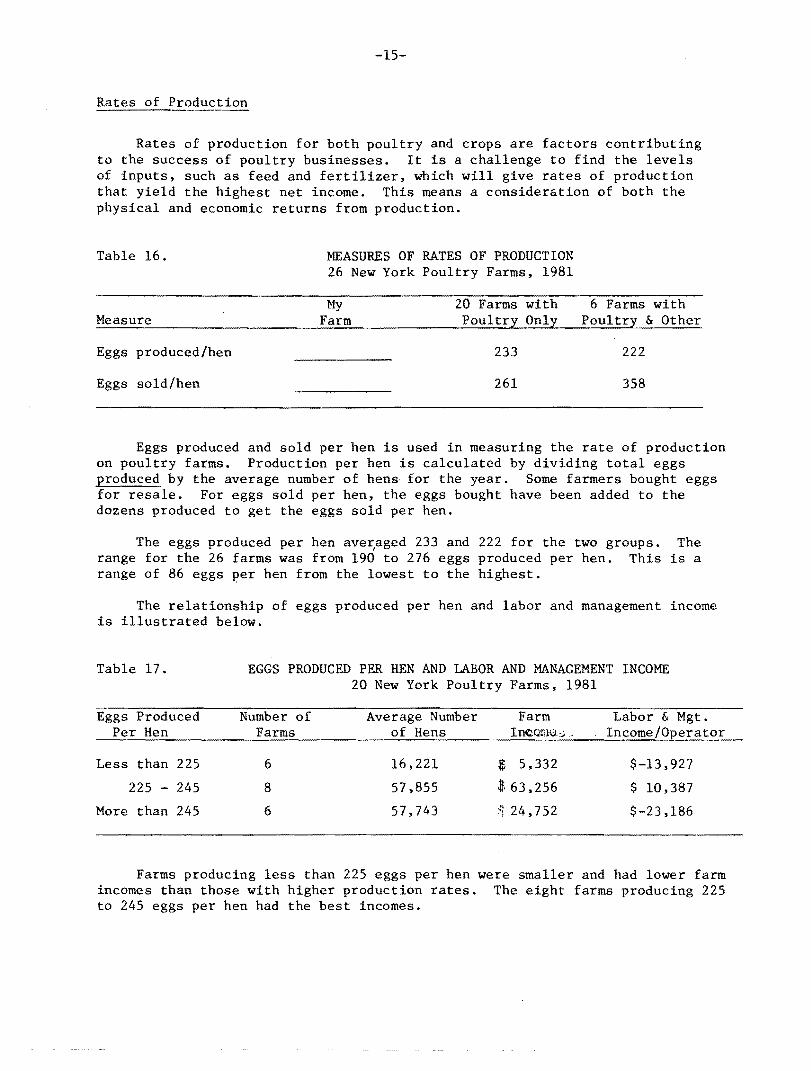
Rates of Production
Rates of production for both poultry and crops are factors contributing to the success of poultry businesses. It is a challenge to find the levels of inputs, such as feed and fertilizer, which will give rates of production that yield the highest net income. This means a consideration of both the physical and economic returns from production.
Table 16. MEASURES OF RATES OF PRODUCTION 26 New York Poultry Farms, 1981
My 20 Farms with 6 Farms with Measure Farm Poultry Only Poultry & Other
Eggs produced/hen 233 222
Eggs sold/hen 261 358
Eggs produced and sold per hen is used in measuring the rate of production on poultry farms. Production per hen is calculated by dividing total eggs produced by the average number of hens for the year. Some farmers bought eggs for resale. For eggs sold per hen, the eggs bought have been added to the dozens produced to get the eggs sold per hen.
The eggs produced per hen ave~aged 233 and 222 for the two groups. The range for the 26 farms was from 190 to 276 eggs produced per hen. This is a range of 86 eggs ~er hen from the lowest to the highest.
The relationship of eggs produced per hen and labor and management income is illustrated below.
Table 17. EGGS PRODUCED PER HEN AND LABOR AND MANAGEMENT INCOME 20 New York Poultry Farms, 1981
Eggs Produced Number of Average Number Farm Labor & Mgt. Per Hen Farms of Hens InC::Qm~.,;_ Income/Operator
Less than 225 6 16,221 $ 5,332 $-13,927
225 - 245 8 57,855 $63,256 $ 10,387
More than 245 6 57,743 ~t 24,752 $-23,186
Farms producing less than 225 eggs per hen were smaller and had lower farm incomes than those with higher production rates. The eight farms producing 225 to 245 eggs per hen had the best incomes.
-16
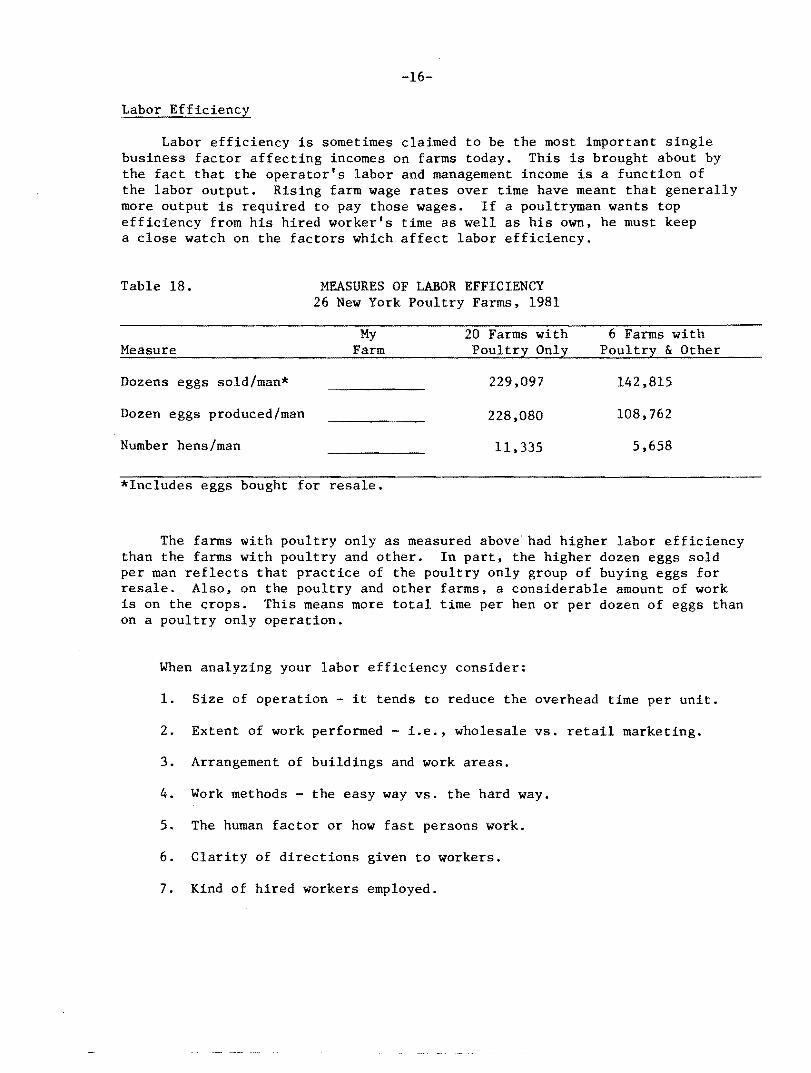
Labor Efficiency
Labor efficiency is sometimes claimed to be the most important single business factor affecting incomes on farms today. This is brought about by the fact that the operator's labor and management income is a function of the labor output. Rising farm wage rates over time have meant that generally more output is required to pay those wages. If a poultryman wants top efficiency from his hired worker's time as well as his own, he must keep a close watch on the factors which affect labor efficiency.
Table 18. MEASURES OF LABOR EFFICIENCY 26 New York Poultry Farms, 1981
Measure My
Farm 20 Farms with Poultry Only
6 Farms with Poultry & Other
Dozens eggs sold/man* 229,097 142,815
Dozen eggs produced/man
Number hens/man
228,080
11,335
108,762
5,658
*Includes eggs bought for resale.
The farms with poultry only as measured above had higher labor efficiency than the farms with poultry and other. In part, the higher dozen eggs sold per man reflects that practice of the poultry only group of buying eggs for resale. Also, on the poultry and other farms, a considerable amount of work is on the crops. This means more total time per hen or per dozen of eggs than on a poultry only operation.
When analyzing your labor efficiency consider:
1. Size of operation - it tends to reduce the overhead time per unit.
2. Extent of work performed - i.e., wholesale vs. retail marketing.
3. Arrangement of buildings and work areas.
4. Work methods - the easy way vs. the hard way.
5. The human factor or how fast persons work.
6. Clarity of directions given to workers.
7. Kind of hired workers employed.

-17
Cost Control
The 20 poultry farms expenses average $1,500 per day. With expenses of this amount, cost control is important. As more "input" items are purchased, cost control has a greater effect on incomes. Cost control is difficult to measure but an analysis of good records can provide some useful checks and point to possible areas of cutting costs.
Feed, labor, and machinery are big cost items on poultry farms, but it is important to watch the other costs too. Small leaks can build up into sizable losses. The next three pages are provided to help study your costs.
Table 19. COST CONTROL MEASURES 26 New York Poultry Farms, 1981
My 20 Farms with 6 Farms with Item Farm Poultry Only Poultry &. Other
Value of layer feed/hen
Layer feed/doz. eggs produced
Lbs. feed/doz. eggs produced
Total labor cost per hen*
Total labor cost per dozen eggs produced*
Building repairs per hen
Utilities per hen
Taxes per hen
Insurance per hen
Total farm production expenses/ hen (total less inventory increase and eggs bought)
Total expenses per $100 receipts
operator s
$
--_¢
$_---
----_¢
----_¢
----_¢
$ 7.04
35¢
4.3
$ 7.2b
37¢
4.4
;)O¢ 1.33
4.5¢ 10.8¢
5.6¢
2l.4¢
8.6¢
l6.0¢
5.8¢
35.0¢
26.l¢
25.0¢
$11.48
$ 94 .29
$15.65
$ 95 .08
For the above measurements, it must be kept in mind that the "poultry and other" farms had other enterprises which affect several cost control measures. The feed bought per hen is an example. Much of the crop expense on the poultry and other farms is an indirect feed cost on these operations. Also, the labor cost per dozen eggs on the poultry and other farms includes labor for the production of feed which on poultry only farms would have been purchased.
-18
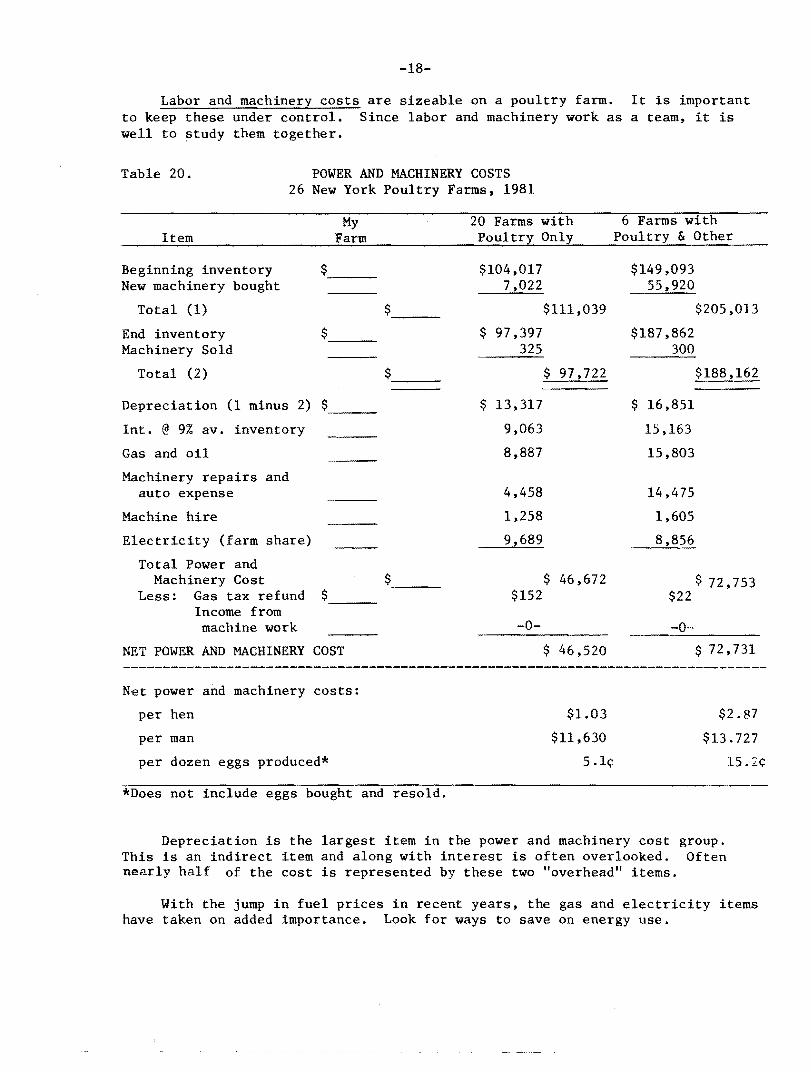
Labor and machinery costs are sizeable on a poultry farm. It is important to keep these under control. Since labor and machinery work as a team, it is well to study them together.
Table 20. POWER AND MACHINERY COSTS 26 New York Poultry Farms s 1981
My 20 Farms with 6 Farms with Item Farm Poultry Only Poultry & Other
Beginning inventory New machinery bought
$_- $104,017 7,022
$149,093 55 s 920
Total (1) $_- $111,039 $205,013
End inventory Machinery Sold
$_- $ 97,397 325
$187,862 300
Total (2) $ $ 97,722
Depreciation (1 minus 2) $-- $ 13,317 $ 16,851
Int. @ 9% avo inventory 9,063 1),163
Gas and oil 8 s 887 15,803
Machinery repairs and auto expense 4,458 14,475
Machine hire 1,258 1,605
Electricity (farm share) 9,689 8,856
Total Power and Machinery Cost $_- $ 46,672 $72,753
Less: Gas tax refund $-- $152 $22 Income from machine work -0
NET POWER AND MACHINERY COST $ 46,520 $72,731
Net power and machinery costs:
per hen $1.03 $2.87
per man $11 ,630 $13.727
per dozen eggs produced* 5.1(: 15.2(:
*Does not include eggs bought and resold.
Depreciation is the largest item in the power and machinery cost group. This is an indirect item and along with interest is often overlooked. Often nearly half of the cost is represented by these two "overhead" items.
With the jump in fuel prices in recent years, the gas and electricity items have taken on added importance. Look for ways to save on energy use.
-19
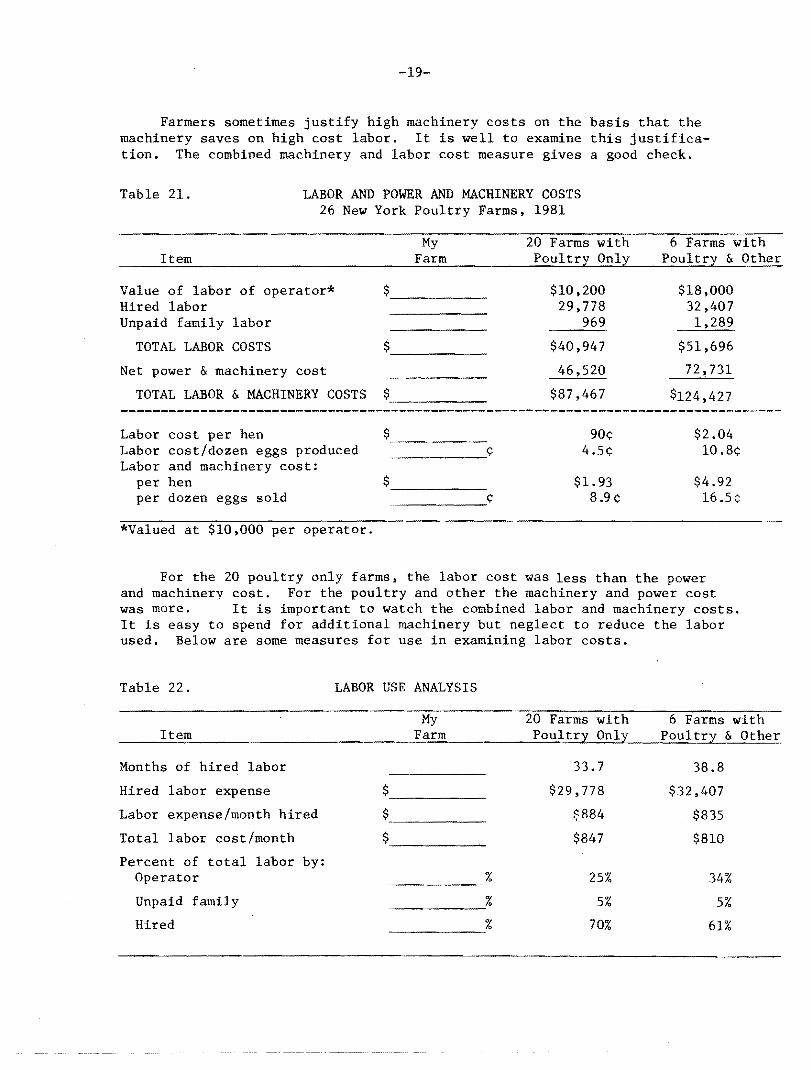
Farmers sometimes justify high machinery costs on the basis that the machinery saves on high cost labor. It is well to examine this justification. The combined machinery and labor cost measure gives a good check.
Table 21. LABOR AND POWER AND MACHINERY COSTS 26 New York Poultry Farms, 1981
My 20 Farms with 6 Farms with Item Farm Poultr;z:: Onll Poultr;z:: & Other
Value of labor of operator* Hired labor Unpaid family labor
$10,200 29,778
969
$18,000 32,407 1,289
TOTAL LABOR COSTS $ $40,947 $51,696
Net power & machinery cost 46,520 72,731
TOTAL LABOR & MACHINERY COSTS $ $87,467 $124,427
Labor cost per hen Labor cost/dozen eggs produced Labor and machinery cost:
per hen per dozen eggs sold
$
¢
¢
90¢ 4.5¢
$1.93 8.9 ¢
$2.04 10.8¢
$4.92 16.5 :;:
*Valued at $10,000 per operator.
For the 20 poultry only farms, the labor cost was less than the power and machinery cost. For the poultry and other the machinery and power cost was more. It is important to watch the combined labor and machinery costs. It is easy to spend for additional machinery but neglect to reduce the labor used. Below are some measures for use in examining labor costs.
Table 22. LABOR USE ANALYSIS
My 20 Farms with Item Farm Poultr;z:: Onl;z::
Months of hired labor
Hired labor expense
Labor expense/month hired
Total labor cost/month
Percent of total labor by: Operator
Unpaid family
Hired
33.7
$29.778
$884
$847
25%
% 5%
70%
6 Farms with Poultry & Other
38.8
$32,407
$835
$810
34%
5%
61%
-20
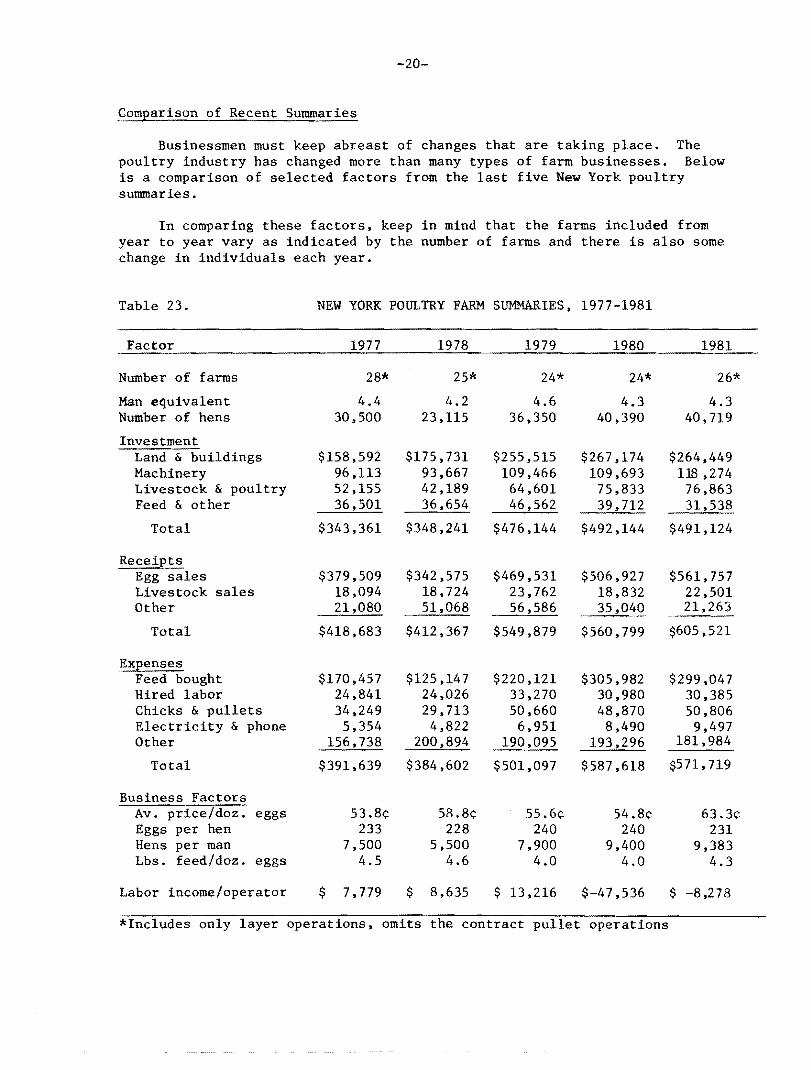
Comparison of Recent Summaries
Businessmen must keep abreast of changes that are taking place. The poultry industry has changed more than many types of farm businesses. Below is a comparison of selected factors from the last five New York poultry summaries.
In comparing these factors, keep in mind that the farms included from year to year vary as indicated by the number of farms and there is also some change in individuals each year.
Table 23. NEW YORK POULTRY FARM SUMMARIES, 1977-1981
Factor 1977 1978 1979 1980 1981
Number of farms 28* 25* 24* 24* 26*
Man equivalent 4.4 4.2 4.6 4.3 4.3 Number of hens 30,500 23.115 36,350 40,390 40,719
Investment Land & buildings $158,592 $175.731 $255,515 $267.174 $264,449 Machinery 96.113 93,667 109,466 109,693 118 .274 Livestock & poultry 52,155 42.189 64,601 75.833 76,863 Feed & other 36,501 36,654 46,562 39,712 31,538
Total $343,361 $348.241 $476,144 $492,144 $491,124
Receipts Egg sales $379.509 $342,575 $469,531 $506,927 $561,757 Livestock sales 18,094 18,724 23,762 18,832 22,501 Other 21,080 51,068 56,586 35,040 21,263
Total $418,683 $412.367 $549,879 $560,799 $605,521
Expenses Feed bought $170,457 $125,147 $220,121 $305,982 $299,047 Hired labor 24,841 24,026 33,270 30,980 30,385 Chicks & pullets 34,249 29,713 50,660 48,870 50,806 Electricity & phone 5,354 4,822 6,951 8,490 9,497 Other 156,738 200,894 190,095 193,296 181,984
Total $39l,639 $384,602 $501,097 $587,618 $571,719
Business Factors Av. price/doz. eggs 53.8(: 58.8(: 55.6(: 54.8(: 63.3(: Eggs per hen 233 228 240 240 231 Hens per man 7,500 5,500 7,900 9,400 9,383 Lbs. feed/doz. eggs 4.5 4.6 4.0 4.0 4.3
Labor income/operator $ 7,779 $ 8,635 $ 13,216 $-47,536 $ -8,278
*Inc1udes only layer operations, omits the contract pullet operations

-21
Cost of Producing Eggs
Table 24. AVERAGE FARM COST OF PRODUCING EGOS 20 New York Poultry Farms, 1981
My 20 Farms with Item Farm Poultry Only
Farm expenses
Interest on capital @ 9%
Operator's labor and Management*
$_--- $566,915
41,703
10,200
Total Cost
Total receipts
Less egg sales $_--- $601.243
588,379
$618,818
Other Income
Cost of Producing Eggs (Total Cost Less Other Income)
Dozen eggs sold
Cost per dozen eggs sold
Average price received ¢
12 2 864
$605,954
987,560
61.4¢
63.3¢
*Figured at $10,000 per operator.
By adding to the total farm expenses an estimate of the value of the operator's labor and management, and an interest charge on the capital used, the farm cost of producing eggs can be calculated. The value of the operator's labor and management was estimated at $10,000 per year. This was based on estimates made by dairymen. Receipts for items other than eggs are credited against the total cost on the assumption that these items were produced at cost.
Farm expenses include costs for eggs purchased for resale. This tends to impose some egg market values in the calculation of production costs.
This "farm unit" method of calculating the cost of producing eggs has limitations but it does give a general indication of the overall costs. This method was applied to the farms with poultry only.
-- -- -- ----
-22
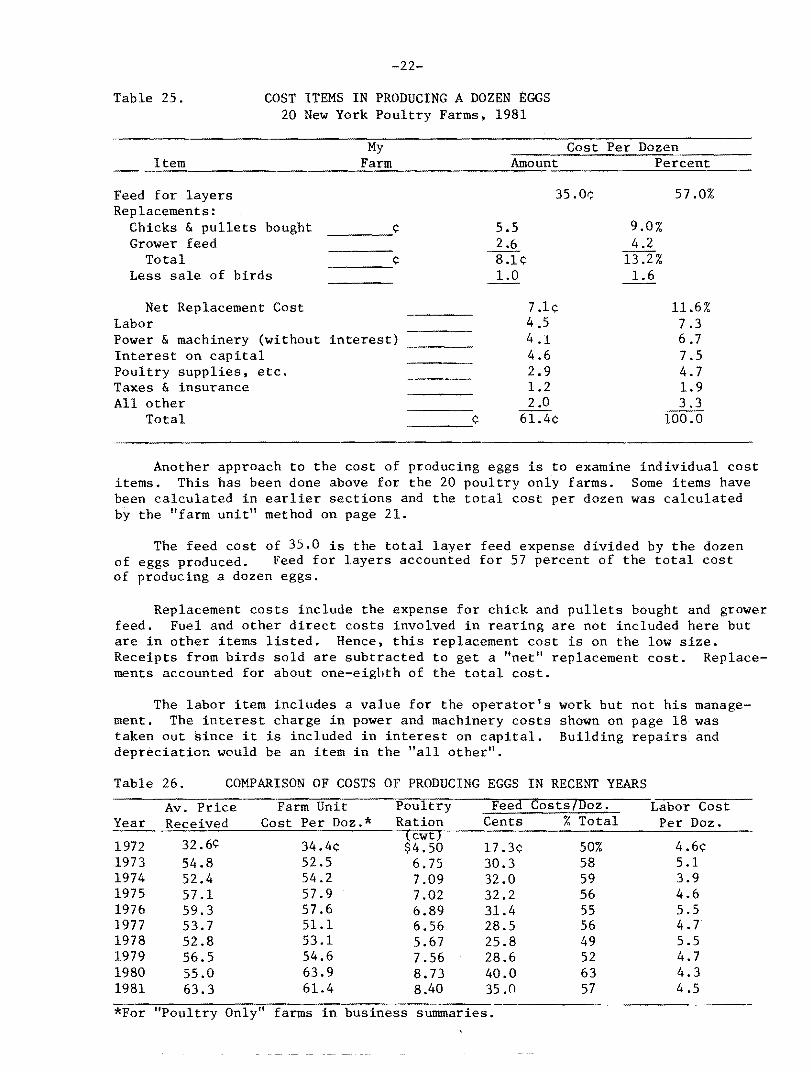
Table 25. COST ITEMS IN PRODUCING A DOZEN EGGS 20 New York Poultry Farms, 1981
My Cost Per Dozen Item Farm Amount Percent
Feed for layers 35.0¢ 57.0% Replacements:
Chicks & pullets bought 5.5 9.0% Grower feed 2.6 4.2
Total 8.1 ¢ 13.2% Less sale of birds 1.0 1.6
Net Replacement Cost 7.l¢ 11.6% Labor 4.5 7.3 Power & machinery (without interest) 4.1 6.7 Interest on capital 4.6 7.5 Poultry supplies, etc. 2.9 4.7 Taxes & insurance 1.2 1.9 All other 2.0 3.3
Total 61.4¢ 100.0---_¢
Another approach to the cost of producing eggs is to examine individual cost items. This has been done above for the 20 poultry only farms. Some items have been calculated in earlier sections and the total cost per dozen was calculated by the "farm unit" method on page 21.
The feed cost of 35.0 is the total layer feed expense divided by the dozen of eggs produced. Feed for layers accounted for 57 percent of the total cost of producing a dozen eggs.
Replacement costs include the expense for chick and pullets bought and grower feed. Fuel and other direct costs involved in rearing are not included here but are in other items listed. Hence, this replacement cost is on the low size. Receipts from birds sold are subtracted to get a "net" replacement cost. Replacements accounted for about one-eighth of the total cost.
The labor item includes a value for the operator's work but not his management. The interest charge in power and machinery costs shown on page 18 was taken out since it is included in interest on capital. Building repairs and depreciation would be an item in the "all other".
Table 26. COMPARISON OF COSTS OF PRODUCING EGGS IN RECENT YEARS
Av. Price Farm Unit Poultry Feeo Costs7Doz. Labor Cost Year Received Cost Per Doz.* Ration Cents % Total Per Doz.
1972 32.6¢ 34.4¢ (cwt)$4.50 l7.3¢ 50% 4.6¢
1973 54.8 52.5 6.75 30.3 58 5.1 1974 52.4 54.2 7.09 32.0 59 3.9 1975 57.1 57.9 7.02 32.2 56 4.6 1976 59.3 57.6 6.89 31.4 55 5.5 1977 53.7 51.1 6.56 28.5 56 4.7 1978 52.8 53.1 5.67 25.8 49 5.5 1979 56.5 54.6 7.56 28.6 52 4.7 1980 55.0 63.9 8.73 40.0 63 4.3 1981 63.3 61.4 8.40 35.n 57 4.5
*For "Poultry Only" farms in business sunnnaries.
452
-23
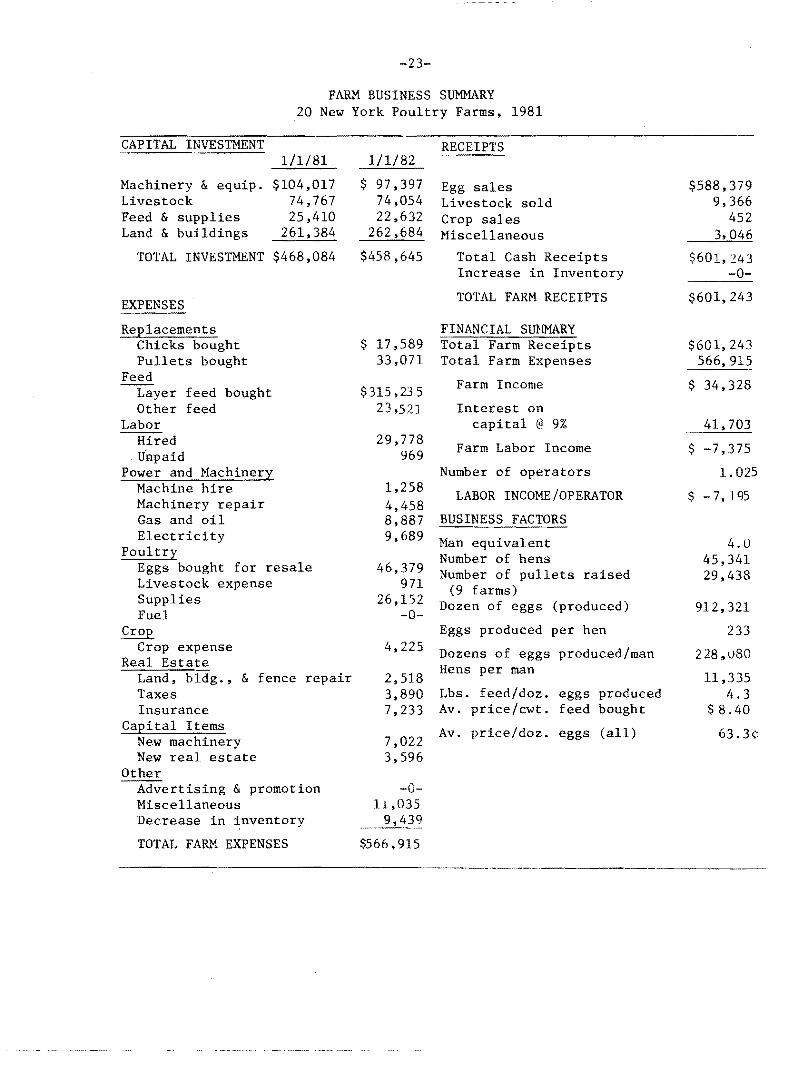
FARM BUSINESS SUMMARY 20 New York Poultry Farms, 1981
CAPITAL INVESTMENT 1/1/81
Machinery & equip. $104,017 Livestock 74,767 Feed & supplies 25,410 Land & buildings 261,384
TOTAL INVESTMENT $468,084
EXPENSES
Replacements Chicks bought Pullets bought
Feed Layer feed bought Other feed
Labor Hired Unpaid
Power and Machinery Machine hire Machinery repair Gas and oil Electricity
Poultry Eggs bought for resale Livestock expense Supplies Fuel
Crop Crop expense
Real Estate Land, bldg., & fence repair Taxes Insurance
Capital Items New machinery New real estate
Other Advertising & promotion Miscellaneous Decrease in inventory
TOTAL FARM EXPENSES
1/1/82
$ 97,397 74,054 22,632
262,684
$458,645
$ 17,589 33,071
$315,235 23,51..]
29,778 969
1,258 4,458 8,887 9,689
46,379 971
26,152 -0
4,225
2,518 3,890 7,233
7,022 3,596
-0ll,035
__9,;:.,..439
$566,915
RECEIPTS
Egg sales Livestock sold Crop sales Miscellaneous
Total Cash Receipts Increase in Inventory
TOTAL FARM RECEIPTS
FINANCIAL SUHMARY Total Farm Receipts Total Farm Expenses
Farm Income
Interest on capital @ 9%
Farm Labor Income
Number of operators
LABOR INCOME/OPERATOR
BUSINESS FACTORS
Man equivalent Number of hens Number of pullets raised
(9 farms) Dozen of eggs (produced)
Eggs produced per hen
Dozens of eggs produced/man Hens per man
Lbs. feed/doz. eggs produced Av. price/cwt. feed bought
Av. price/doz. eggs (all)
$588,379 9,366
3,046
$601,243 -0
$601,243
$601,243 566,915
$ 34,328
41,703
$ -7,375
1.025
$ - 7, 195
4.0 45,341 29,438
912,321
233
228~v80
11 ,335 4.3
$ 8.40
63.3<;:
-24
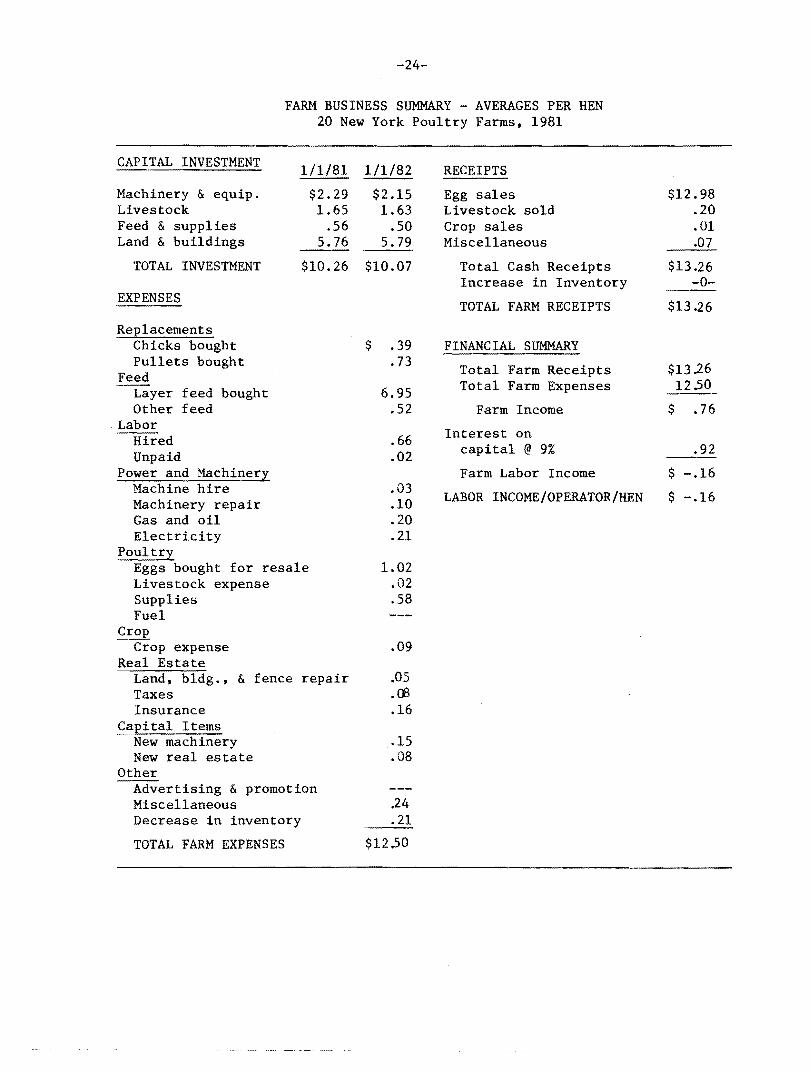
FARM BUSINESS SUMMARY - AVERAGES PER HEN 20 New York Poultry Farms, 1981
CAPITAL INVESTMENT 1/1/81 1/1/82 RECEIPTS
Machinery & equip. $2.29 $2.15 Egg sales $12.98 Livestock 1.65 1.63 Livestock sold .20 Feed & supplies .56 .50 Crop sales .01 Land & buildings 5.76 5.79 Miscellaneous .07
TOTAL INVESTMENT $10.26 $10.07 Total Cash Receipts $13.26 Increase in Inventory -0
EXPENSES TOTAL FARM RECEIPTS $13 .26
Replacements Chicks bought $ .39 FINANCIAL SUMMARY Pullets bought
Feed Layer feed bought
.73
6.95
Total Farm Receipts Total Farm Expenses
$1326 12.50
Other feed .52 Farm Income $ .76 Labor
Hired Unpaid
.66
.02
Interest on capital @ 9% .92
Power and Machinery Farm Labor Income $ -.16 Machine hire Machinery repair
.03
.10 LABOR INCOME/OPERATOR/HEN $ -.16
Gas and oil .20 Electricity .21
Poultry Eggs bought for resale 1.02 Livestock expense .02 Supplies .58 Fuel
Crop Crop expense .09
Real Estate Land, bldg., & fence repair .05 Taxes .re Insurance .16
Capital Items New machinery .. 15 New real estate .08
Other Advertising & promotion Miscellaneous .24 Decrease in inventory .21
TOTAL FARM EXPENSES $12.50
------
-25
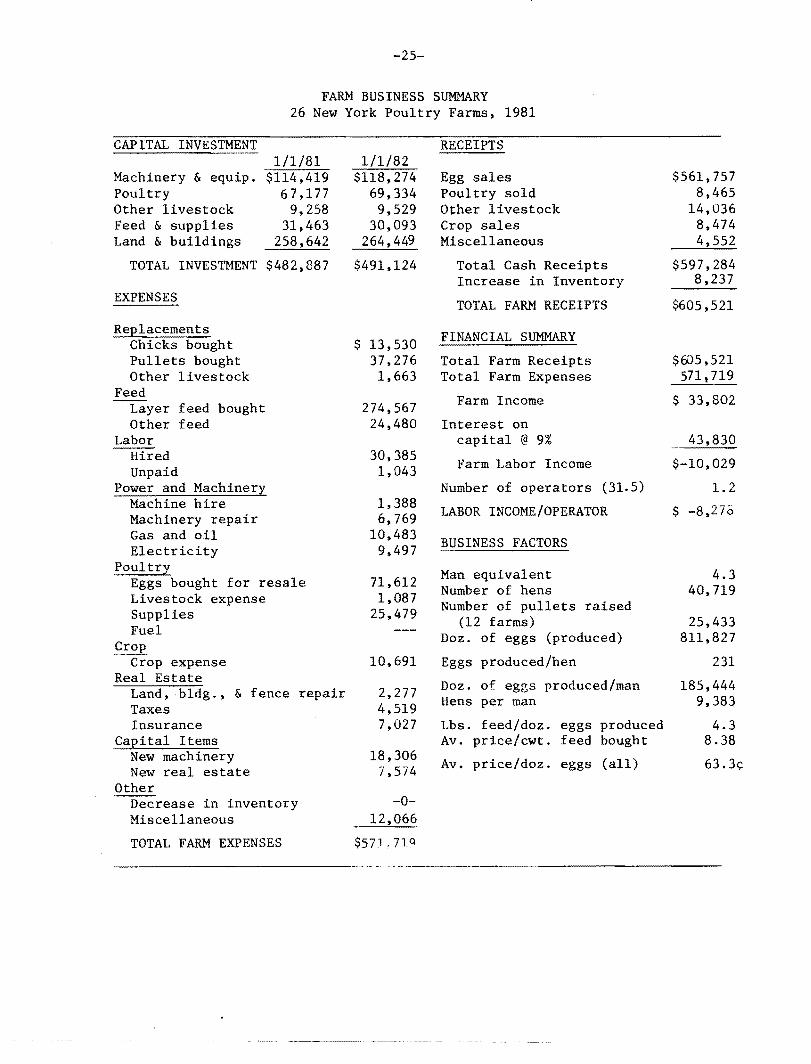
FARM BUSINESS SUMMARY 26 New York Poultry Farms, 1981
CAPITAL INVESTMENT
Machinery & equip. Poultry Other livestock Feed & supplies Land & buildings
1/1/81 $114,419
67,177 9,258
31,463 258,642
TOTAL INVESTMENT $482,887
EXPENSES
Replacements Chicks bought Pullets bought Other livestock
Feed Layer feed bought Other feed
Labor Hired Unpaid
Power and Machinery Machine hire Machinery repair Gas and oil Electricity
Poultry Eggs bought for resale Livestock expense Supplies Fuel
Crop Crop expense
Real Estate Land, bldg .• & fence repair Taxes Insurance
Capital Items New machinery New real estate
Other Decrease in inventory Miscellaneous
TOTAL FARM EXPENSES
-------------_.
1/1/82 $118,274
69,334 9,529
30,093 264,449
$491,124
$ 13,530 37,276 1,663
274,567 24,480
30,385 1,043
1,388 6,769
10.483 9.497
71.612 1,087
25,479
10,691
2.277 4.519 7.027
18.306 7,574
-012.066
$57) . no ...
RECEIPTS
Egg sales Poultry sold Ol:her livestock Crop sales Miscellaneous
Total Cash Receipts Increase in Inventory
TOTAL FARM RECEIPTS
FINANCIAL SUMHARY
Total Farm Receipts Total Farm Expenses
Farm Income
Interest on capital @ 9%
Farm Labor Income
Number of operators (31.5)
LABOR INCOME/OPERATOR
BUSINESS FACTORS
Man equivalent Number of hens Number of pullets raised
(12 farms) Doz. of eggs (produced)
Eggs produced/hen
Doz. of eggs produced/man Hens per man
Lbs. feed/doz. eggs produced Av. price/cwt. feed bought
Av. price/doz. eggs (all)
$561,757 8,465
14,036 8,474 4
$597,284 8,237
$605,521
$6J5.521 571 ~ 719_
$ 33.802
43.830
$-10.029
1.2
$ -8.27&
4.3 40.719
25,433 811,827
231
185,444 9.383
4.3 8.38
63.3¢
------
----
-26
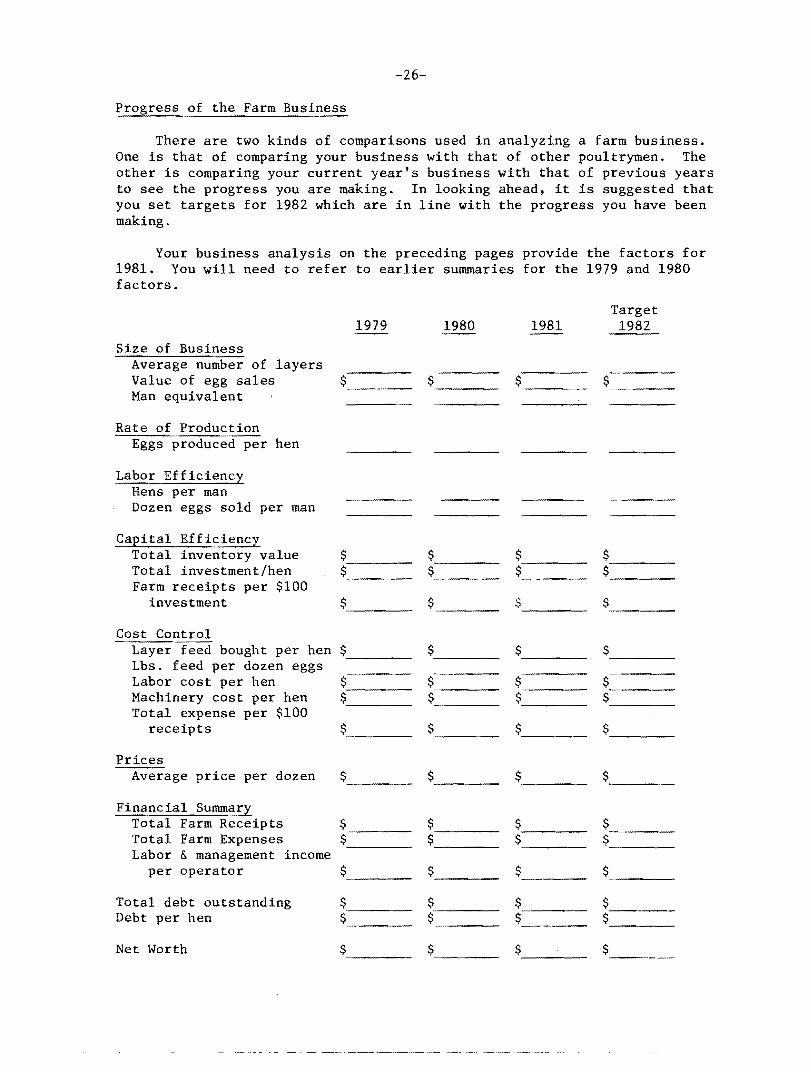
Progress of the Farm Business
There are two kinds of comparisons used in analyzing a farm business. One is that of comparing your business with that of other poultrymen. The other is comparing your current year's business with that of previous years to see the progress you are making. In looking ahead, it is suggested that you set targets for 1982 which are in line with the progress you have been making.
Your business analysis on the preceding pages 1981. You will need to refer to earlier summaries factors.
provide the factors for for the 1979 and 1980
1979 1980 1981 Target
1982
Size of Business Average number of layers Value of egg sales $---Man equivalent
Rate of Production Eggs produced per hen
Labor Efficiency Hens per man Dozen eggs sold per man
Capital Efficiency Total inventory value $_--Total investment/hen $_-Farm receipts per $100
investment $$_--- $_--
Cost Control Layer feed bought per hen $_---Lbs. feed per dozen eggs Labor cost per hen Machinery cost per hen Total expense per $100
receipts $______ $_-- $_-- $_-
Prices Average price per dozen
Financial Summary Total Farm Receipts $_-- $_--Total Farm Expenses $_-- $_-Labor & management income
per operator $ $_--- $_--
Total debt outstanding $_- $_-Debt per hen $_-- $_-
Net Worth $_--