potentials of community-based-ecotourism to improve human
TRANSCRIPT

Full Terms & Conditions of access and use can be found athttps://www.tandfonline.com/action/journalInformation?journalCode=tsdw20
International Journal of Sustainable Development &World Ecology
ISSN: (Print) (Online) Journal homepage: https://www.tandfonline.com/loi/tsdw20
Potentials of community-based-ecotourismto improve human wellbeing in Cambodia: anapplication of millennium ecosystem assessmentframework
Abu SMG Kibria, Alison Behie, Robert Costanza, Colin Groves & Tracy Farrell
To cite this article: Abu SMG Kibria, Alison Behie, Robert Costanza, Colin Groves & Tracy Farrell(2021) Potentials of community-based-ecotourism to improve human wellbeing in Cambodia: anapplication of millennium ecosystem assessment framework, International Journal of SustainableDevelopment & World Ecology, 28:5, 461-472, DOI: 10.1080/13504509.2020.1855606
To link to this article: https://doi.org/10.1080/13504509.2020.1855606
Published online: 08 Dec 2020. Submit your article to this journal
Article views: 88 View related articles
View Crossmark data Citing articles: 1 View citing articles

Potentials of community-based-ecotourism to improve human wellbeing in Cambodia: an application of millennium ecosystem assessment frameworkAbu SMG Kibriaa, Alison Behieb, Robert Costanzac, Colin Grovesb and Tracy Farrelld
aSchool of Natural Resources and the Environment, The University of Arizona, Tucson, AZ, USA; bSchool of Archaeology and Anthropology, The Australian National University, Australia; cCrawford School of Public Policy, The Australian National University, Australia; dConservation International, 2011 Crystal Drive, Arlington, VA, United States
ABSTRACTCommunity-based Ecotourism (CBE) has been promoted and widely adopted as an approach for funding conservation initiatives, while at the same time contributing to the wellbeing of the host communities. However, it often fails to live up to its promise and thereby lets the local people return to their old ways of doing things. The study is to explore the potentials of CBE on the indigenous human wellbeing by conducting a case study in the Veun Sai-Siem Pang National Park (VSSPNP). For this research work, tourists, indigenous households, key infor-mants, and local leaders were interviewed. We found that the participants received only 6% of the total revenue per year, despite 63% annual growth in number of tourists. The gibbons increased the recreational value of forest and significantly contributed to enhance tourist satisfaction. The program had significantly reduced their freedom for livelihood activities, and feeding condition of their families. On the contrary, it had significantly increased their groups and networks, and collective action and cooperation for conservation. But the well-being regarding basic materials and health conditions were not significantly changed by the ecotourism program. Therefore, without addressing the wellbeing of the participants, ecotour-ism programs would struggle in achieving sustainable outcomes.
ARTICLE HISTORY Received 19 October 2020 Accepted 21 November 2020
KEYWORDS National parks; indigenous people; wildlife; ecotourism; human wellbeing; Cambodia
1. Introduction
Community-based Ecotourism (CBE) is an increasingly popular approach for ecosystem conservation across the developing countries. It has been recognized for its potentials in becoming an effective method for addressing myriad socio-ecological issues and thereby ensuring greater sustainability in managing natural resources (Stronza and Gordillo 2008; Anup et al. 2015). The benefits associated with CBE for improving human wellbeing adequately justify the efforts to further CBE developments (Agyeman et al. 2019). It is estimated that every year ecotourism generates about US$29 billion in developing countries (Kirkby et al. 2011) indicating that ecotourism is a potential source of revenues for local people and for biodiversity con-servation. Among many other measures being intro-duced, ecotourism could be a measure to address the problems of natural resources depletion (Kirkby et al. 2011).
Nevertheless, in many parts of the world, CBE ben-efits are often low and periodic. Bookbinder et al. (1998) found that in Nepal’s Royal Chitwan National Park only 6% household of the studied villages earned income directly or indirectly from ecotourism program. Those who made financial profit from the tourism stated that it was an unstable source of income
subjected to seasonal fluctuations, economic and poli-tical events (Wood 1998). As a result, they are not able to effectively improve local residents’ wellbeing and their patterns of resource extraction (Kiss 2004). Consequently, the local people return to their previous ways of livelihoods immediately after the incentives for tourism development diminishes or become insuffi-cient (Wilkinson and Pratiwi 1995). For instance, in the Monarch butterfly reserve in Mexico, many local people resumed logging activities, since the project failed to generate the employment and income oppor-tunities that were initially promised (Barkin 2003).
In Cambodia, deforestation is a major issue since 1980s. The first election after Khamer Rouge brought Royal Government of Cambodia in power which insti-tuted ‘private concession’ to boost the struggling economy. More than two million hectares have been leased so far to the foreign and domestic companies. Within the concession, the deforestation rate is 29% to 105%; overwhelmingly higher than the land areas out-side concessions. Thus, Cambodia has rapidly reached one of the highest deforestation rate in the world (Davis et al. 2015). The country is of global conserva-tion importance because it contains the largest remaining examples of habitats that were previously found across much of Indochina and Thailand, and which still contain nearly intact species assemblages,
CONTACT Abu SMG Kibria [email protected] School of Natural Resources and the Environment, College of Agriculture and Life Sciences, The University of Arizona, ENR2 N418, 1064 E. Lowell St. Tucson, AZ 85721, United States, Phone: +1-520-621-1054.
INTERNATIONAL JOURNAL OF SUSTAINABLE DEVELOPMENT & WORLD ECOLOGY 2021, VOL. 28, NO. 5, 461–472 https://doi.org/10.1080/13504509.2020.1855606
© 2020 Informa UK Limited, trading as Taylor & Francis Group

albeit at heavily reduced densities (Loucks et al. 2009). Protecting the wildlife and their habitats from over exploitation is a major challenge for the conservation-ists. Without engaging local forest users properly and providing them alternative income options, no conser-vation effort would attain sustainability (Safa 2004; Ameha et al. 2014).
Over the last decades, establishing ecotourism to conserve the national forest in Cambodia has received significant attention. The initiatives intended to develop a mutually beneficial socio-ecological system and promote sustainable development (Reimer and Walter 2013). Human wellbeing in socio-ecological sys-tem emerges and is sustained through the complex relationships between ecosystem services and depen-dent communities (Power 2010; Domptail et al. 2013). Ecotourism has been promoted worldwide for conser-ving the nature as well as generating incentives for local people (Xiang et al. 2011). There is a growing trend in flagship species-based tourism as it can poten-tially increase the number of tourists and underpin long-term sustainability (Sharpley 2007; Xiang et al. 2011). However, deforestation has been one of the biggest challenges in establishing successful CBE.
The inherent complex relationships between the forest and the people put restrictions in broadening the research focus to reveal the impacts of forest eco-system on different dimensions of human wellbeing. While the research has explored the contributions of the CBE on employment and income, little or no atten-tion has been given on the other dimensions of human wellbeing (Babulo et al. 2008; Adam et al. 2013; Angelsen et al. 2014). Income is not necessarily the
only determinant of human wellbeing, instead various factors influence an individual’s ability to live well including inequality, poverty, malnutrition, political instability, and access to resources (Ashton and Jones 2013). While acknowledging the conservation and human wellbeing achievements is difficult, there is still little understanding of wellbeing both in theory and practice in the complex set of social and ecological aspects (Domptail et al. 2013; Akinsete et al. 2019). Limited studies exist that take an integrative approach to capture the diverse implications of ecotourism on wellbeing of the communities. In addition, the linkages between ecotourism and the wellbeing dimensions are under-researched (Chirenje 2017). The objective of our research is to understand the importance of CBE in conservation and its potential to improve the well-being of the dependent communities. Exploring the contribution of ecotourism program on human well-being would assist the authority to better manage the park and generate valuable scholarship for improving community-based ecosystem conservation approach elsewhere in Asia.
2. Methodology
2.1. Study site
VSSPNP has been purposively selected for this study. The park is located in the Veun Sai District of Ratanakiri Province and Siem Pang District of Stung Treng Province (Figure 1). Veun Sai-Siem Pang National Park in North-eastern Cambodia has been listed as a Key Biodiversity Area in the World Biodiversity Database
Figure 1. The Veun Sai-Siem Pang Conservation Forest (red boundary); Source:Ramachandra et al. (2012).
462 A. S. KIBRIA ET AL.

and is also part of the Virachey Important Bird Area (Chan et al. 2004). Ecologically, the area is located within the Indo-Burma hotspot (Myers et al. 2000), and is a part of the 200 globally most important ecor-egions, the Eastern Indo–China Dry and Monsoon Forest (Olson and Dinerstein 1998) and Critical Ecosystem Partnership Fund’s (CEPF) Cambodia-Lao PDR-Vietnam Tri-border Forests priority corridor (Critical Ecosystem Partnership Fund 2012).
In Veun Sai-Siem Pang National Park 255 animal species have been recorded of which four are classified as Critically Endangered, 12 as Endangered, and 19 as Vulnerable on the IUCN Red List of Threatened Species (Ramachandra et al. 2012). Primates of this area are of special conservation concern. The population of gib-bons at the site is considered globally significant (Rawson and Bach 2011) as it is believed to be the biggest population of the species Nomascus annamen-sis in existence. Due to chronic poverty, illegal logging and poaching activities are threatening the site’s eco-logical integrity (Figure 2) which when paired with other human-induced ecosystem changes and general impacts of climate change, may result in catastrophic consequences (POH-KAO 2012).
2.2. Data collection and bootstrapping
Data about the ecotourism program and its growth trend were collected from the official records of the park, and conducting in-person-interview with the tourists and the CBE participants. To collect household data, families were visited by the lead author and the household head was interviewed from each family. We also interviewed the key informants and conducted group discussion with other elderly villagers. By the household interview we collected data on four general wellbeing dimensions adopted from the Millennium Ecosystem Assessment Framework that includes basic materials of good life, health and sanitation, freedom
of choice, and social relations (MEA 2005). Respondents were asked to identify the wellbeing dimensions and relevant indicators, and how each indicator affects human wellbeing using in 0–5 Likert scales. The dimensions, indicators and scores were subsequently crosschecked with follow-up discussions with elderly villagers, members of local NGOs and government officials.
For this study, in total 71 persons were interviewed (Tourist: 36, Household head: 35) by the lead author. Each tourist was interviewed when he/she arrived at the CBE base-camp and after the visit of the gibbons inside the forest. Extracting resources from the forest was the only livelihood activity for the families around the forest; hence, it was difficult to find a person to interview. Many of them declined to be interviewed as they were reluctant to give information perhaps because of the involvement in illegal logging and haunting. Most of them also used their own language and barely able to understand Khamer (national lan-guage of Cambodia). The area was very remote and foreigners were not safe in all areas; therefore, our sampling and data collection faced constant chal-lenges during the interview. However, in order to per-form statistical analysis we used bootstrap method to increase the total number of sample to m = 1000. When the dataset size is not large one, then it may suffer from bias of this estimate and the accuracy of the confidence interval based on the normality assumption. Therefore, we extracted random and with replacement m ¼ 1000 samples of size from the original dataset. These resamples are called bootstrap samples which create dataset similar to normal distri-bution. The bootstrap idea (Efron 1979) is to mimic the sampling distribution of the statistic of interest through the use of many resamples with replacement of the original sample.
An (independent) bootstrap sample is a simple ran-dom sampling of size n taken with replacement from
Figure 2. (a) Large patches of the forest has been converted to agricultural land, (b) Fire is used to prepare the converted land for paddy cultivation.
INTERNATIONAL JOURNAL OF SUSTAINABLE DEVELOPMENT & WORLD ECOLOGY 463

the data x1; x2; . . . ; xn. We denote a bootstrap sample as x�1; x�2; . . . ; x�m which consists of members of the original data set x1; x2; . . . ; xn with some members appearing zero times, some appearing only once, some appearing
twice, and so on. Let θ̂ be a statistic calculated from a sample of n observations. In the ordinary nonpara-metric bootstrap, we drew observations with replace-ment from the original data to create a bootstrap
sample or resample, and calculated the statistic θ̂� for this sample. Therefore, we extracted random and with replacement m ¼ 1000 samples from the original data-set. The bootstrap statistics comprise the bootstrap dis-tribution. We use each distribution to estimate standard error, biases, and t-distribution as follows (Efron and Tibshirani 1993; Manly 2007):
The bootstrap standard error is the sample standard deviation of the bootstrap distribution (Equation (1)):
SE� ¼
ffiffiffiffiffiffiffiffiffiffiffiffiffiffiffiffiffiffiffiffiffiffiffiffiffiffiffiffiffiffiffiffiffiffiffiffiffiffiffiffiffiffiffi1
m � 1
Xm
i
θ̂�i � θ̂�
� �2s
(1)
The joint distribution of �X and s (sample standard deviation), and distributions of statistics are dependent
on both θ̂ and θ. To estimate the sampling distribution
of θ̂ � θ, we use the bootstrap distribution of θ̂� � θ̂.
The bootstrap bias estimate is E θ̂�� θ̂
� �, an estimate
of E θ̂ � θ� �
. To estimate the sampling distribution of
a t-statistic we used the Equation (2):
t ¼θ̂ � θ� �
SE(2)
Where SE is a standard error calculated from the origi-nal sample. The bootstrap counterpart of such a function in Equation (2) is expressed as in Equation (3):
T ¼θ̂�� θ̂
� �
SE�(3)
The function denotes the 100s-th bootstrap percentile of T by bs(bootstrap replications) and considers the statement: T lies within b:005; b:995½ �. After the substitu-
tion t ¼ θ̂ � θ� �
=SE, the above statement translates to
θ lies within θ̂ � SE�b:995; θ̂ � SE�b:005
� �. This range for
θ is called bootstrap-t based confidence interval for θ at coverage level 99%. Such an interval is known to achieve higher accuracy which is referred to ‘second- order accuracy’. Efron proposed correction to the rudi-mentary percentile method to bring in extra accuracy. These corrections are known as Efron’s ‘bias-correction’ and ‘accelerated bias-correction’. The bootstrap-t auto-matically takes care of such corrections (Efron and Tibshirani 1993).
2.3. Data analysis
The data obtained by interviewing tourists were used to explore the demography, choice ranks about the ecotourism elements, and the economic benefit distri-bution. These data were collected, as the program was intended to increase the income of the CBE partici-pants and thereby improve their wellbeing. In order to understand the CBE effects on their wellbeing, we used criteria of five constituents of human wellbeing – basic materials, health and sanitation, social relation, security, and freedom of choice (Narayan et al. 2000; MA 2005; OECD 2013). We adopted this multi- dimensional conceptualization of human wellbeing because it incorporates a wide array of both objective and subjective wellbeing indicators (Costanza et al. 2007). Based on interviews and group discussions the effect of each criterion on the wellbeing was measured through the use of scores varying from large to small impacts (Table 1). The differences of composite well-being scores of two groups – Before and After the ecotourism program introduction were tested by per-forming paired sample t-test with SPSS V22.0 software.
3. Results
3.1. Attractions and rankings
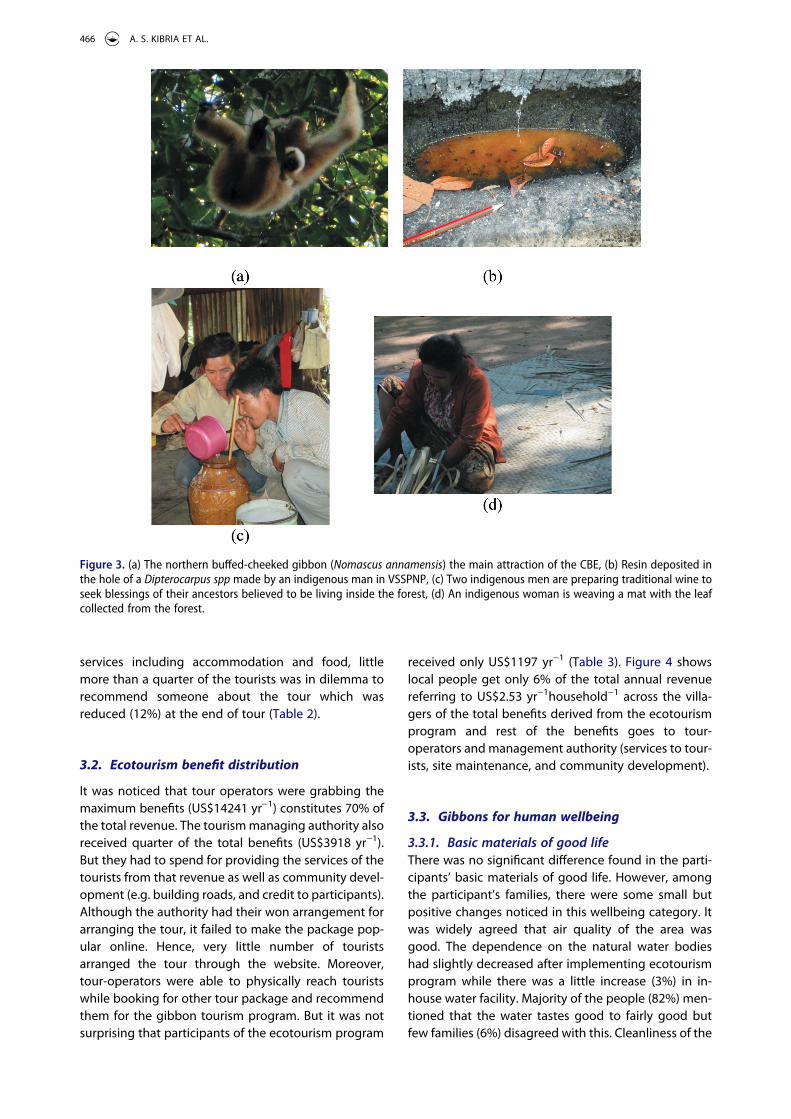
Gibbons in the wild (Figure 3(a)) were the first priority (86%) to visit the tourism site which was further increased after observing gibbons (91%). Although some tourists put it in second choice, after watching gibbons all of them changed their mind. But the tourists (3%) who put gibbons in third place was found increased even after coming back (6%) from the gibbon watching site. It was surprising that few tourists put gibbons on the fourth position (2.9%), even though they came for ‘gib-bon tour’ and none of them changed mind even after seeing gibbons. Some tourists (9%) did not put gibbons on first place after visiting the site because they could not see the gibbons as they (gibbons) did not call in the morning (Table 2).
Forest of the park was primarily second choice (59%), but after seeing the forest, many tourists updated forest from third position to second most enjoyable part of the tourism (81%). Nevertheless, all of the tourists showed concerns over the deforestation had been occurring in/around the park (Figure 2). The highest rank for birds was given two by the tourists (21%) which was reduced (17%) on returning from the site. Majority of the tourists (43%) marked birds as third choice of enjoyment, but after the tour, this was reduced (33%). After returning from the tour birds were ranked fourth by half of the tourists, while fifth preference was not found. The highest number of tourists (46%) kept indigenous people in the fourth choice which was significantly reduced (20%) after returning from the forest. Some tourists marked
464 A. S. KIBRIA ET AL.

enjoying indigenous people in second position which also came down to 7%. The enjoyment rank of first and fifth was found increased after the tour finishes from 4 to 8% to 13% (Table 2). There was no spate arrange-ment for tourists from enjoying the indigenous tradi-tions and culture. However, they mentioned that they enjoyed some of the traditional customs and cultures of indigenous communities while they were in the tour especially resin collection (Figure 3(b)), rituals for ancestors (Figure 3(c)), and woman’s expertise in mat weaving (Figure 3(d)). Tourists expressed their interests in observing the indigenous traditions and cultures. Tourists informed that they enjoyed the hospitality, food and cooking technique of indigenous people.
There was a significant change in high level of satisfaction from before (17%) to after visiting the site (77%). Those who had moderately high (40%), and moderately low level of satisfaction (14%) were signifi-cantly reduced after the tour (9% and 0% respectively). Few tourists (3%) expressed the tour as a very bad experience, though before the tour they were not in such kind of situation may be because of being unfor-tunate to see gibbons. Moreover, some tourists com-plained about the services were not value for the money. Irrespective of satisfaction level majority of the tourists (71%) were willing to recommend their family and friends which was higher after the tour (82%). Due to the lack of proper transport and other
Table 1. Codes and weights of the variables of human wellbeing of the study area.Criteria Determinants Variables Codes and weights
Basic materials Water a) Distance of water source b) Source of water c) Availability d) Taste e) Cleanliness* f) Health risks
a) <0.5 km = VHW, 0.5 km to1km = NHNL, >1 m = VLW b) Own well = VHW, Others well = HW, River/Stream = LW c) Sufficient = VHW, Moderate amount = NHNL, 2–3 months short = HW d) Good = HW, Fair = NHNL, Bad = LW e) 1 to 5 scale where 1 = VLW and 5 = VHW f) High risk = VLW, Don’t know = LW, Minor = HW, Not at all = VHW
Food availability a) Purchased b) Chronic shortage c) Sudden shortage d) food enough*
a) All = VLW, Major amount = LW, Moderate amount = NHNL, Little supplement = HW, Not all = VHW.
b) High = LW, Moderate = NHNL, Low = HW c) >3 month = VLW, 3 months = LW, >2 to <3 months = NHNL, 1 to
2 months = HW, <1 month = VHW d) 1 to 5 scale where 1 = VLW and 5 = VHW
Health & sanitation
Good physical health a) Physical weakness* b) Disease per year of family
me c) Chronic diseases of family
members
a) 1 to 5 scale where 1 = VLW and 5 = VHW b) >15 = VLW, 10–15 = LW, 5–10 = NHNL, 3–5 = HW, 1–3 = VHW c) The more severe disease, the less wellbeing
Good mental health a) Happiness* b) Self-esteem* c) Stress* d) Anger*
a) 1 to 5 scale where 1 = VLW and 5 = VHW b) Codes are as (a) c) Codes are as (a) d) Codes are as (a)
Freedom of choice
Social Freedom a) Free to do what is preferred*
b) Villagers respect each other’s preferences*
c) Other restrict him/her* d) Impartial justice exist e) React against threat
a) 1 to 5 scale where 1 = VLW and 5 = VHW b) Codes are as (a) c) Codes are as (a) d) Yes = VHW, No = VLW e) Flee = VLW, Bribe = LW, Apologize = VHW, No need to react = HW
Economic freedom a) Open market b) Produce freely
a) Free market = VHW, Restricted market = VLW b) Yes = VHW, No = VLW
Social relation Trust and solidarity relations
a) Most of the people can be trusted *
b) Most of the people are willing non-financial help*
c) Most of the people are willing to help financially*
a) 1 to 5 scale where 1 = VLW and 5 = VHW b) Codes are as (a) c) Codes are as (a)
Collective action and cooperation
a) How likely people work to protect ESS*
b) How many people work in protecting forest
a) 1 to 5 scale where 1 = VLW and 5 = VHW b) Most of the villagers = VHW, Half of the villagers = HW, Several/
Ecotourism Program member = NHNL, Few = LW, Nobody = VLW
Groups and network a) No. of group membership b) No. of close friends/
families
a) 0 = VLW, 1 = LW, 2 = NHNL, 3 = HW, ≥4 = VHW b) <5 = VLW, 5to <10 = LW, 10 = Nether nor, >10 to 15 = HW, >15 = VHW
Social cohesion Togetherness* 1 to 5 scale where 1 = VLW and 5 = VHWSecurity Personal security How much security is for
personal assets*1 to 5 scale where 1 = VLW and 5 = VHW
Institutional protection Institutions defend Him only, NGOs, Public office = LWCertainty of ecosystem
services availabilityHow much certain is to find
and collect ESS*1 to 5 scale where 1 = VLW and 5 = VHW
Difficulty with emergency money
Easiness to receive The easier to get loan from a person/organization, the higher wellbeing
Health or life insurance Having an insurance Yes = HW, No = LW
* data were collected on the scale of 1-strongly agree, 2-agree, 3- NHNL, 4-disagree, 5-strongly disagree. But for wellbeing the data were reversely coded i.e. 1→5 (VHW), 2→4 (HW), 3→3 (nether nor), 4→2 (LW), 5→1 (VLW). ESS= Ecosystem services. Note: Due to lack of sufficient data, „Security„ wellbeing was not separately measured, instead avaialbe data of relevant determinants were used to measure the wellbeing of „Freedom of choice„.
INTERNATIONAL JOURNAL OF SUSTAINABLE DEVELOPMENT & WORLD ECOLOGY 465
services including accommodation and food, little more than a quarter of the tourists was in dilemma to recommend someone about the tour which was reduced (12%) at the end of tour (Table 2).
3.2. Ecotourism benefit distribution
It was noticed that tour operators were grabbing the maximum benefits (US$14241 yr−1) constitutes 70% of the total revenue. The tourism managing authority also received quarter of the total benefits (US$3918 yr−1). But they had to spend for providing the services of the tourists from that revenue as well as community devel-opment (e.g. building roads, and credit to participants). Although the authority had their won arrangement for arranging the tour, it failed to make the package pop-ular online. Hence, very little number of tourists arranged the tour through the website. Moreover, tour-operators were able to physically reach tourists while booking for other tour package and recommend them for the gibbon tourism program. But it was not surprising that participants of the ecotourism program
received only US$1197 yr−1 (Table 3). Figure 4 shows local people get only 6% of the total annual revenue referring to US$2.53 yr−1household−1 across the villa-gers of the total benefits derived from the ecotourism program and rest of the benefits goes to tour- operators and management authority (services to tour-ists, site maintenance, and community development).
3.3. Gibbons for human wellbeing
3.3.1. Basic materials of good lifeThere was no significant difference found in the parti-cipants’ basic materials of good life. However, among the participant’s families, there were some small but positive changes noticed in this wellbeing category. It was widely agreed that air quality of the area was good. The dependence on the natural water bodies had slightly decreased after implementing ecotourism program while there was a little increase (3%) in in- house water facility. Majority of the people (82%) men-tioned that the water tastes good to fairly good but few families (6%) disagreed with this. Cleanliness of the
Figure 3. (a) The northern buffed-cheeked gibbon (Nomascus annamensis) the main attraction of the CBE, (b) Resin deposited in the hole of a Dipterocarpus spp made by an indigenous man in VSSPNP, (c) Two indigenous men are preparing traditional wine to seek blessings of their ancestors believed to be living inside the forest, (d) An indigenous woman is weaving a mat with the leaf collected from the forest.
466 A. S. KIBRIA ET AL.

water was not improved; instead, there was a strong agreement among some villagers (3%) that the water was cleaner before ecotourism program. Some families (12%) could afford to buy water from the market but
most of the villagers (88%) relied on the free sources of water. More than half of the population (62%) informed that they did not suffer from any health problem due to water. A large number of villagers (30%) was completely unaware of any water-born health issues (Table 4).
Food sufficiency of the families in general was somewhat enough, but it was little lower after the ecotourism program period (2.35). Their dependence on the market for food was also slightly reduced. Despite the higher availability of some food items, there was no difference in the level of food shortage. They commonly experienced about three months of food shortage and there was a persistent chronic shortage of the food (Table 4).
3.3.2. Health and sanitationThere was no change observed in physical strength of the collectors. Frequency of seasonal diseases of the family members also remained unchanged. There was a little increase in chronic health problems. Gastro-pain was increased by 4% while hypertension and tooth gum pain was 0.3%, respectively, across the male members. There was a wide level of ignorance regard-ing health and sanitation across the society. None of the families in the village found using sanitary toilet other than the forest. Although there was a little increase in awareness after ecotourism, many of them still had little or no knowledge about health and sani-tation. Mental health including sense of happiness, stress, self-esteem and anger levels were identical in before and after ecotourism program period (Table 4).
3.3.3. Freedom of choiceIndigenous people reported that they had nobody but them to protect their livelihood. But after ecotourism program there was higher number of people (12%) started to believe that the NGO (Conservation International) came to defend their livelihood. Before the implementation of ecotourism program 94% of villagers experienced zero restriction in collecting eco-system services but after ecotourism program this per-centage was significantly dropped (65%) due to significantly higher restraint to illegal collectors (24%) as a result of combined effort by the NGO and Forestry Administration rangers. Across the society there was a great level of respect to each other and it was increased by 3% after introducing ecotourism pro-gram. Before ecotourism program 62% collectors did not even require any reaction for any restrictions but after the conservation program this percentage was significantly reduced (41%). Eventually, on the spot negotiation for money was increased significantly (before: 38%, after: 18%) but other parameters of the criteria showed no significant change as a result of ecotourism program. This clearly entails that the
Table 2. Comparing gibbon’s potentials in improving percep-tion of the CBE program (at random and with replacement m ¼ 1000 samples from the original dataset).
Gibbon’s value
% of tourists
Sig. (2-tailed)
Before visiting site
After visiting site
Enjoyment priorityFirstGibbons 86.1 88.9 .599Forest 11.1 2.82 .150Birds - - -Indigenous people 2.82 5.62 .109SecondGibbons 8.3 - .150Forest 58.3 72.2 .113Birds 16.7 8.33 .190Indigenous people 8.32 2.81 .020***ThirdForest 25 11.1 .135Gibbons 2.8 5.6 .109Birds 33.3 16.7 .049***Indigenous people 19.4 19.4 -FourthForest 2.82 2.82 -Gibbons 2.82 2.82 -Birds 25 25Indigenous people 30.6 8.3 .007***FifthBirds 2.82 - .112Indigenous people 5.61 5.61 -Level of satisfaction5 3.61 4.58 .001***Will you suggest
othersYes 71.4 82.9 .104No 2.91 5.72 .128May be 25.7 11.4 .069
Superscript values represent the scales of measurement. ***Significant at α = 0.01 level.
Table 3. Benefit distribution of the CBE in the VSSPNP.
BeneficiariesTotal annual revenue
(US$)% of total revenue
Tour operator booking 14241 69.81Ecotourism program
booking3918 24.32
English Guide 1044 5.12Local peopleCleaner 140 0.69Transporter 1040 5.10Porter 17 0.08Total 20400
94.13%
5.87%
Others Local people
Figure 4. Financial benefit composition of local people and other stakeholders from the ecotourism program.
INTERNATIONAL JOURNAL OF SUSTAINABLE DEVELOPMENT & WORLD ECOLOGY 467

program has a lot to do to improve their freedom of choice (Table 5).
3.3.4. Social relationAfter ecotourism program there was a slight decrease in trust and solidarity relations among the villagers. Across the villages the overall intention of collectively conser-ving forest was significantly reduced. But the number of people in collective action to protect the forest was increased. It was mentioned that during starting the project many indigenous people stood against the initiative from the fear of stopping their livelihood activ-ities in the forest. But gradually they started to realize the project is beneficial for their livelihood. Before the ecotourism program, none of the villagers was active in protecting the forest but this program had changed
their mind. Significantly higher number of indigenous people supported the conservation activities while before ecotourism program project only few (3%) indi-genous people had intention to collect sustainably. There was significant improvement in willingness to protect the forest after ecotourism program (before: 97%, after: zero percentage) (Table 5).
Within the indigenous community, there were some informal social groups for collecting ecosystem ser-vices. It was found that before ecotourism program each household head was a member of at least one group but after the ecotourism program some of them became ecotourism program member which was sig-nificantly increased their group membership (1.6). There was also a significant increase in number of close members or friends (before: 4.76, after: 5.85)
Table 4. Comparison between the basic materials of life, and health & sanitation between before and after CBE (at random and with replacement m ¼ 1000 samples from the original dataset).
Wellbeing dimension Elements Before ecotourism program After ecotourism program Sig. (2-tailed)
Basic materials Air is clean5 2.35 2.44Water for drinking/cookingDistance from source of water (% of HH)Very close 38.2 41.2 .12830–50 m 14.7 11.7 1.0050–100 m 47.1 47.1Source of water (% of HH)Own well 38.2 41.2 .112River/stream 47.1 44.1 .112Others’ well 14.7 14.7 -Availability3 1.20 1.20 -Taste of water 3 1.29 1.29 -Cleanliness 5 1.97 2.02 .119Need to pay (% of HH)Yes 11.8 11.8 -No 88.2 88.2 -Health risk of the water4 3.20 3.20 -FoodFood is enough to feed family5 2.47 2.35 .624Purchasing food5 2.14 2.02 .060Chronic food shortage5 2.00 2.00Sudden shortage (% of HH)Not at all 17.6 17.6 -<3 months 67.7 67.7 -3–5 months 2.91 2.91 ->5 months 12.7 12.7 -
Health & sanitation Physical healthPhysically feels weak5 2.08 2.08Diseases (Frequency per year)Male 3.76 3.82 .555Female 5.28 5.28Children 4.36 4.43 .136Chronic diseases/health issuesMale (% of HH)Gastro pain 3.43 6.72 .133Hypertension 3.43 3.31 -Tooth gum pain 3.43 3.31 -Female (% of HH)Gastro pain 3.4 3.4 -Migraine 17.2 17.2 -Asthma 3.42 3.42 -Children (% of HH) - -Health awareness (% of HH)Sanitary Toilet - - -Unsanitary toilet 100 100 -Knowledge of health5 3.67 3.70 .102Mental healthGenerally feels happy5 1.91 1.91 -Self-esteem is high5 2.47 2.47 -Regularly stressed5 2.17 2.14 .136
Superscript values represent the scales of measurement. HH = Household.
468 A. S. KIBRIA ET AL.

which was a direct effect of participation in the eco-tourism program. However, the improvements are yet too small to consider as substantial success (Table 5).
3.4.5. Composite wellbeing scoreAfter introducing ecotourism program the social freedom of choice of the households was signifi-cantly reduced. Participants explained that ecotour-ism program gave them alternative income sources and opportunities to work in groups but the effect was too small to improve the ever-changing society. Respect across the villages was reduced than before and increased effort in forest conservation restricted their livelihood activities in the forest which required more negotiations with the authorities. Moreover, merchants in the Chinese Village adjacent to the forest supplied all the money and chainsaw to many villagers to continue cutting trees which allowed them to bribe some officials to avoid con-fiscation. Wellbeing regarding food and nutrition was reduced significantly after the ecotourism
program. This is mainly because the ecotourism pro-ject did not have any proper plan to improve the food situation of the households. Moreover, over exploitation of the resources made food items scarce in the forest. Ecotourism program was successful in significantly increasing collective action and coop-eration (Table 6). Ecotourism program authority formed groups by including the participants to sup-port the transportation, guiding, catering the tourists and patrolling the forest which enhanced the coop-eration among them.
4. Discussion
Ecotourism program in VSSPNP has gained attention within a short period and attracted a growing number of tourists mostly because of the increased awareness of among the people regarding sustainable develop-ment and conservation (Chand et al. 2015). Tourists reported that gibbons increased the value of Forest of Veun Sai but failed to enhance the appeal of birds
Table 5. Results from bootstrap resampling tests comparing freedom of choice, and social relations between before and after CBE (at random and with replacement m ¼ 1000 samples from the original dataset).
Wellbeing dimension Elements
Before ecotourism program
After ecotourism program
Sig. (2-tailed)
Freedom of choice Institutions for freedom of choice (% of HH)Organization/person to defend rightHim only 97.1 85.3 .065NGOs - 11.8 .065Villagers 2.92 2.92 -Impartial judiciary exists 94.1 94.1 -Organization to restrain the rightNobody 94.1 64.7 .044***NGO and Government authorities 5.91 23.5 .044***Social freedomFree to do what is preferred5 1.00 1.00 -Members respect each other’s preferences5 1.44 1.47 .134Others restrict my livelihood5 3.08 3.08 -Punishment for damaging others’ rights (% of HH)Yes 97.1 100 .109No 2.92 - .109React against any threat (% of HH)Money 17.6 38.2 .013***Flee 11.8 14.7 .062Apologize 8.81 5.91 .134No need to react 61.8 41.2 .023***Economic freedom (% of HH)Open markets for everyone 100 100 -Can produce free whatever wants to 100 100 -Can sell the forest resources freely 83.3 76.7 .056
Social relations Trust and solidarity relations (% of HH)Most of the people can be trusted 1.35 1.50 .454Many people are willing to financial help 2.64 2.85 .144Most of the people willing for non-financial help 1.44 1.61 .107Collective action and cooperationHow likely people work for protecting forest5 4.00 3.29 .008***How many people work together in protecting forest (% of
HH)Several/Ecotourism Program member - 23.5 .004***Few 2.9 76.5 .001***Nobody 97.1 - .002***Groups and network (No.)Group membership 1 1.60 .001***Close friend/members 4.76 5.85 .028***Social cohesion (% of HH)Togetherness 2.00 2.14 .513Families sharing ecosystem services (No.) 1.85 1.97 .292
Superscript values represent the scale of measurement. HH = Household. ***Significant at α = 0.01 level.
INTERNATIONAL JOURNAL OF SUSTAINABLE DEVELOPMENT & WORLD ECOLOGY 469

and indigenous people because of fewer activities for bird watch and knowing indigenous cultures. There was a significant improvement in the level of tourist satisfaction after visiting the site. Total enjoyment exceeded the initial discontentment with the lack of proper transport and other services including accom-modation and food. Diversifying the experiences in tourism sites could potentially assist in achieving sus-tainable outcomes (Akbulak and Cengiz 2014). Despite the growing interests, the program generated too little revenue to significantly uplift the economic conditions of the surrounding villagers. Even if CBE generates large income in some areas, many scholars argued that little or no ecotourism revenue of ecotourism reaches local people (Cobbinah et al. 2017; Regmi and Walter 2017).
There was no significant difference observed in the parameters of basic materials of wellbeing including air, water, and food. But after combining the criteria the composite food-wellbeing scores of feeding con-dition was found significantly lower even after eco-tourism program. Due to ecotourism program, there was a slight shift in dependency from forest to the market for food items reportedly because of decreased forest productivity and increased affordability. However, there was still a widespread and chronic shortage of the food in the families which were also observed in many other forest-dependent commu-nities worldwide (Neelakantan et al. 2020).
After ecotourism program institutional supports were not significantly increased in offering assistance to maintain their rights to collect forest provisioning services. Although significantly higher restrictions by conservation interventions significantly decreased the composite wellbeing score of social freedom, villagers were able to continue their preferred livelihood activ-ities without any major confrontation. Often they were
not restrained but if they were caught by the authority, negotiations were made with bribe. This clearly entails that the efforts to restrict illegal extractions were sig-nificantly higher than the management without eco-tourism program, but those were too little to stop people for engaging illegal activities. Yolamalinda and Febriamansyah (2017) also stated that despite the protection measures people find their way to con-tinue both legal and illegal extraction of forest resources. In order to avoid any conflict and ensure success of the conservation program, it is required to ensure alternative livelihood for them, or at least create some opportunities by offering training as well as access to credit (Anup et al. 2015).
There was no change in physical and mental health except little increase in chronic health issues among adult members of the families. There was an absolute ignorance regarding health and sanitation across the society except for some knowledge on malaria. McDonald et al. (2010) also found that remote indi-genous people are highly vulnerable to diseases due to the lack of education and health care service. Due to ecotourism program, people’s intention for collec-tive action and cooperation for conservation of the forest was significantly increased. After engaging in the conservation of the forest groups and network in the village significantly contributed to the greater cooperation among the villagers. Creating different social groups by the management authority of eco-tourism program to run the activities of the program has enhanced collaboration among them. Sterling et al. (2017) also argued that formal and informal institutions benefit the participants and lead strong collective action.
Current program has not robustly addressed the human wellbeing, instead, the premise was the eco-tourism would attract tourists, and income generated from ecotourism program would be an incentive for conservation and economic alternative to destructive livelihood activities in the forest; thereby, increased income will eventually enhance wellbeing of the parti-cipants. This idea is widely dismissed in many studies, as ecotourism programs often fail to generate ade-quate financial revenue for the people, and more importantly it is subjected to long-term investment commitment which is often not the case (Shoo 2020). Moreover, ecotourism may have negative impacts on the biodiversity that is intended to conserve (Shi et al. 2015; Salemi et al. 2019). Our study also suggests that designing a project by depending on the economic return from ecotourism program to achieve human wellbeing would not lead to the desired success. Perhaps, this is the reason ecotourism program had little effect on the participants around VSSPNP. There are different components of wellbeing which could be achieved by the existing program activities and with minimum investment.
Table 6. Comparing composite wellbeing score of before and after CBE (at random and with replacement m ¼ 1000 sam-ples from the original dataset).
Wellbeing criteria
Before ecotourism program
After ecotourism program Sig.
(2-tailed)Min. Max. Mean Min. Max. Mean
Social Freedom 3.60 5 4.31 3.40 5 4.25 .013***Economic freedom 5 5 5.00 5 5 5.00 -Institutional
protection3 3 3.00 3 3 3.00 -
Water for domestic use
3.17 4.83 4.13 3.17 4.83 4.14 .794
Food availability 2.33 4.67 3.60 2.00 4.33 3.09 .008***Good physical
health2.40 5.00 4.47 2.40 5.00 4.48 .531
Good mental health
2.00 4.75 3.52 2.00 4.75 3.53 .113
Trust and solidarity relations
3.00 5.00 4.19 1.33 5.00 4.01 .128
Collective action and cooperation
1.00 2.50 1.51 1.50 3.50 2.47 .001***
Social cohesion 1.00 5.00 4.00 1.00 5.00 3.85 .504
***Significant at α = 0.01 level.
470 A. S. KIBRIA ET AL.

5. Conclusion
Gibbons trousim was able to attract big number of tourists and very potential to greatly increase the value of the forest. However, the participants of the ecotourism program received only 6% of the total annual revenue generated from the tours. They had to accept significant reduction in the livelihood free-dom; but, access level to the forest for subsistance remained unchaged. It might cause a significant reduc-tion in feeding condition of the families. On the con-trary, institutional support, and collective action and cooperation for their wellbeing and conservation had significantly increased. But other wellbieng criteria showed no significant change after ecotourism pro-gram. Our research suggests that ecotourism program has major shortcomings in achieving sustainability. Therefore, the project required to be revised with proper emphasize on all the aspects of human well-being to ensure active participation of the lcoal people.
Acknowledgments
We are very grateful to the Rufford Foundation for funding the research, and to the Australian National University for neces-sary support from the very beginning of the project. We also express our gratitude to CI, Cambodia, for assisting us during data collection in this incredibly remote place. Indigenous people delivered incredible support to learn their cultures in detail, history of the area. Their kind assistance made the whole field visit high enough to collect good quality data.
Funding
We are very grateful to the Rufford Foundation for funding the research and to the Australian National University for necessary support from the very beginning of the project.
Conflicts of interest/Competing interests
The authors have no conflict of interests/competing interest in the subject matter discussed in the manuscript.
Ethics approval
We confirm that the study was approved by the Human Research Ethics Committee of The Australian National University, Australia. The details are created by: Abu SMG Kibria (u5429511); Record number: 6780; Protocol type: Expedited Ethical Review (E2); Protocol number: 2014/444.
References
Adam YO, Pretzsch J, Pettenella D. 2013. Contribution of non-timber forest products livelihood strategies to rural development in drylands of Sudan: potentials and failures. Agric Syst. 117:90–97. doi:10.1016/j.agsy.2012.12.008.
Agyeman YB, Yeboah AO, Ashie E. 2019. Protected areas and poverty reduction: the role of ecotourism livelihood in
local communities in Ghana. Community Dev. 50 (1):73–91. doi:10.1080/15575330.2019.1572635.
Akbulak C, Cengiz T. 2014. Determining ecotourism strate-gies using A’WOT hybrid method: case study of Troia Historical National Park, Çanakkale, Turkey. Int J Sustainable Dev World Ecol. 21:380–388.
Akinsete E, Apostolaki S, Chatzistamoulou N, Koundouri P, Tsani S. 2019. The link between ecosystem services and human wellbeing in the implementation of the European Water Framework Directive: assessing four river basins in Europe. Water. 11(3):508. doi:10.3390/w11030508.
Ameha A, Nielsen OJ, Larsen HO. 2014. Impacts of access and benefit sharing on livelihoods and forest: case of partici-patory forest management in Ethiopia. Ecol Econ. 97:162–171. doi:10.1016/j.ecolecon.2013.11.011.
Angelsen A, Jagger P, Babigumira R, Belcher B, Hogarth NJ, Bauch S, Börner J, Smith-Hall C, Wunder S. 2014. Environmental income and rural livelihoods: a global-comparative analysis. World Dev. 64:S12–S28. doi:10.1016/j.worlddev.2014.03.006.
Anup KC, Kedar R, Prasad SR. 2015. Role of ecotourism in environmental conservation and socioeconomic develop-ment in Annapurna conservation area, Nepal. Int J Sustainable Dev World Ecol. 22(3):251–258. doi:10.1080/13504509.2015.1005721.
Ashton K, Jones C. 2013. Geographis of human wellbeing. Geography Teachers’ Association of Victoria Inc. Australia; 48pp.
Babulo B, Muys B, Nega F, Tollens E, Nyssen J, Deckers J, Mathijs E. 2008. Household livelihood strategies and forest dependence in the highlands of Tigray, Northern Ethiopia. Agric Syst. 98(2):147–155. doi:10.1016/j.agsy.2008.06.001.
Barkin D. 2003. Alleviating poverty through ecotourism: pro-mises and reality in the monarch butterfly reserve of Mexico. Environ Dev Sustainability. 5(3/4):371–382. doi:10.1023/A:1025725012903.
Bookbinder MP, Dinerstein E, Rijal A, Cauley H, Rajouria A. 1998. Ecotourism’s support of biodiversity conservation. Conserv Biol. 12:1399–1404.
Chan S, Crosby MJ, Islam MZ, Tordoff AW. 2004. Important bird areas in Asia: key sites for conservation. BirdLife International.Cambridge, UK; 297pp
Chand S, Singh S, Parappurathu S, Roy SD, Kumar A. 2015. Explaining the status and scope of ecotourism develop-ment for livelihood security: andaman and Nicobar Islands, India. Int J Sustainable Dev World Ecol. 22(4):335–345. doi:10.1080/13504509.2015.1050478.
Chirenje LI. 2017. Contribution of ecotourism to poverty alleviation in Nyanga, Zimbabwe. Chin J Popul Resour Environ. 15(2):87–92. doi:10.1080/ 10042857.2017.1319172.
Cobbinah PB, Amenuvor D, Black R, Peprah C. 2017. Ecotourism in the Kakum Conservation Area, Ghana: local politics, practice and outcome. J Outdoor Recreation Tourism. 20:34–44. doi:10.1016/j.jort.2017.09.003.
Costanza R, Fisher B, Ali S, Beer C, Bond L, Boumans R, Danigelis NL, Dickinson J, Elliott C, Farley J, et al. 2007. Quality of life: an approach integrating opportunities, human needs, and subjective well-being. Ecol Econ. 61 (2–3):267–276. doi:10.1016/j.ecolecon.2006.02.023.
Critical Ecosystem Partnership Fund. 2012. Ecosystem profile: Indo-Burma biodiversity hotspot 2011 update. Critical Ecosystem Partnership Fund. Washington, DC; 381 pp.
Davis KF, Yu K, Rulli MC, Pichdara L, D’Odorico P. 2015. Accelerated deforestation driven by large-scale land acquisitions in Cambodia. Nature Geoscience. 8 (10):772–775. doi:10.1038/ngeo2540.
INTERNATIONAL JOURNAL OF SUSTAINABLE DEVELOPMENT & WORLD ECOLOGY 471

Domptail S, Easdale MH, Yuerlita Y. 2013. Managing socio-ecological systems to achieve sustainability: a study of resilience and robustness. Environ Policy Governance. 23(1):30–45. doi:10.1002/eet.1604.
Efron B. 1979. Bootstrap methods: another look at the Jackknife. The Annals of Statistics. 7(1):1–26. doi:10.1214/ aos/1176344552.
Efron B, Tibshirani RJ. 1993. An introduction to the bootstrap. Florida, USA: Chapman and Hall/CRC press.
Kirkby CA, Giudice R, Day B, Turner K, Soares-Filho BS, Oliveira-Rodrigues H, Yu DW. 2011. Closing the ecotourism-conservation loop in the Peruvian Amazon. Environ Conserv. 38:6–17.
Kiss A. 2004. Is community-based ecotourism a good use of biodiversity conservation funds? Trends Ecol Evol. 19:232–237.
Loucks C, Mascia MB, Maxwell A, Huy K, Duong K, Chea N, Long B, Cox N, Seng T. 2009. Wildlife decline in Cambodia, 1953-2005: exploring the legacy of armed conflict. Conserv Lett. 2:82–92.
MA. 2005. Ecosystems and human well-being: sythesis. Washington (DC): Island Press.
Manly BFJ. 2007. Randomization, bootstrap and Monte Carlo methods in biology. Florida, USA: Chapman and Hall/CRC press.
McDonald E, Bailie R, Grace J, Brewster D. 2010. An ecological approach to health promotion in remote Australian Aboriginal communities. Health Promot Int. 25:42–53.
MEA. 2005. Ecosystems and human well-being: sythesis. Washington (DC): Island Press.
Myers N, Mittermeier RA, Mittermeier CG, Da Fonseca GA, Kent J. 2000. Biodiversity hotspots for conservation priorities. Nature. 403:853–858.
Narayan D, Chambers R, Shah MK, Petesch P. 2000. Voices of the poor: crying out for change. 0195216024. Washington DC: World Bank.
Neelakantan A, DeFries R, Sterling E, Naeem S. 2020. Contributions of financial, social and natural capital to food security around Kanha National Park in central India. Reg Environ Change. 20:26.
OECD. 2013. Measuring well-being and progress. OECD Statistics Directorate. Paris.
Olson DM, Dinerstein E. 1998. The Global 200: a representation approach to conserving the Earth’s most biologically valu-able ecoregions. Conserv Biol. 12:502–515.
POH-KAO. 2012. Project ending report July 2009-June 2012. POH KAO des Tibers et des Hommes.
Power AG. 2010. Ecosystem services and agriculture: trade-offs and synergies. Philos Trans R Soc B: Biol Sci. 365:2959–2971.
Ramachandra A, Uraguchi A, Rawson BM. 2012. Veun Sai-Siem Pang Conservation Area: REDD + Pre-feasibility study. Conservation International. Phnom Penh (Cambodia).
Rawson BM, Bach LT. 2011. Preliminary observations of geo-phagy amongst Cambodia’s Colobinae. Vietnamese J Primatol. 5:41–46.
Regmi KD, Walter P. 2017. Modernisation theory, ecotourism policy, and sustainable development for poor countries of the global South: perspectives from Nepal. Int J Sustainable Dev World Ecol. 24:1–14.
Reimer JK, Walter PJTM. 2013. How do you know it when you see it? Community-based Ecotourism Cardamom Mountains Southwestern Cambodia. 34:122–132.
Safa M. 2004. The effect of participatory forest management on the livelihood and poverty of settlers in a rehabilitation program of degraded forest in Bangladesh. Small-scale for Econ Manage Policy. 3:223–238.
Salemi M, Jozi SA, Malmasi S, Rezaian S. 2019. Conceptual framework for evaluation of ecotourism carrying capacity for sustainable development of Karkheh protected area, Iran. Int J Sustainable Dev World Ecol. 26:354–366.
Sharpley R. 2007. Flagship attractions and sustainable rural tourism development: the case of the Alnwick Garden, England. J Sustainable Tourism. 15:125–143.
Shi L, Zhao H, Li Y, Ma H, Yang S, Wang H. 2015. Evaluation of Shangri-La County’s tourism resources and ecotourism carrying capacity. Int J Sustainable Dev World Ecol. 22:103–109.
Shoo RA. 2020. Ecotourism potential and challenges at Lake Natron Ramsar Site, Tanzania. Springer; p. 75–90. In Durrant JO, Martin EH, Melubo K, Jensen RR, Hadfield LA, Hardin PJ, and Weisle L, editors. Protected Areas in Northern Tanzania. Springer Nature Switzerland; p. 75–90.
Sterling EJ, Betley E, Sigouin A, Gomez A, Toomey A, Cullman G, Malone C, Pekor A, Arengo F, Blair M, et al. 2017. Assessing the evidence for stakeholder engagement in biodiversity conservation. Biol Conserv. 209:159–171.
Stronza A, Gordillo J. 2008. Community views of ecotourism. Ann Tourism Res. 35:448–468.
Wilkinson PF, Pratiwi W. 1995. Gender and tourism in an Indonesian village. Ann Tourism Res. 22:283–299.
Wood ME. 1998. Meeting the global challenge of community participation in ecotourism: case studies and lessons from Ecuador. Latin America and Caribbean Division, Nature Conservancy.
Xiang Z, Yu Y, Yang M, Yang J, Niao M, Li M. 2011. Does flagship species tourism benefit conservation? A case study of the golden snub-nosed monkey in Shennongjia National Nature Reserve. Chin Sci Bull. 56:2553–2558.
Yolamalinda SK, Febriamansyah R. 2017. Chapter 10 - Forest management and illegal logging in West Sumatra: the case of Sangir, South Solok. In: Febriamansyah R, Ullah YR, Shivakoti GP, editors. Redefining diversity & dynamics of natural resources management in Asia. Vol. 4. Netherlands: Elsevier; p. 129–137.
472 A. S. KIBRIA ET AL.