potentiality of clay raw materials from northern...
TRANSCRIPT

Journal of Minerals and Materials Characterization and Engineering, 2014, 2, 145-159 Published Online May 2014 in SciRes. http://www.scirp.org/journal/jmmce http://dx.doi.org/10.4236/jmmce.2014.23019
How to cite this paper: El Ouahabi, M., et al. (2014) Potentiality of Clay Raw Materials from Northern Morocco in Ceramic Industry: Tetouan and Meknes Areas. Journal of Minerals and Materials Characterization and Engineering, 2, 145-159. http://dx.doi.org/10.4236/jmmce.2014.23019
Potentiality of Clay Raw Materials from Northern Morocco in Ceramic Industry: Tetouan and Meknes Areas M. El Ouahabi1*, L. Daoudi2, F. De Vleeschouwer3,4, R. Bindler5, N. Fagel1 1UR Argile, Géochimie et Environnement Sédimentaires (AGEs), Département de Géologie, Université de Liège, Liége, Belgium 2Département de Géologie, Faculté des Sciences et Techniques, Marrakech, Maroc 3Université de Toulouse; INP, UPS; EcoLab (Laboratoire Ecologie Fonctionnelle et Environnement); ENSAT, Castanet Tolosan, France 4CNRS; EcoLab; Castanet Tolosan, France 5Department of Ecology and Environmental Sciences, Umeå University, Umeå, Sweden Email: *[email protected]
Received 13 February 2014; revised 17 March 2014; accepted 26 March 2014
Copyright © 2014 by authors and Scientific Research Publishing Inc. This work is licensed under the Creative Commons Attribution International License (CC BY). http://creativecommons.org/licenses/by/4.0/
Abstract This study aims at evaluating the potential suitability of Tetouan and Meknes (central Morocco) clay material as raw materials in various ceramic applications by investigating their textural, chemical, thermal and firing characteristics. Textural properties were identified by specific sur-face area, cation exchange capacity (CEC) and bulk density (ρs). Chemical and thermal properties were assessed using XRF and TG/DTA techniques, respectively. Firing characteristics at tempera-tures from 800˚C to 1100˚C were determined by linear firing shrinkage, loss on weight and water absorption capacity. The Meknes clays are characterised by medium cation exchange capacity (CEC) and specific surface area (SSA) values due to their moderate smectite content. The Tetouan clays have medium to low CEC and medium SSA values. The main oxides in the clayey samples are SiO2 (35 - 54.3 wt%), Al2O3 (20.6 - 43.9 wt%), and Fe2O3 (9.7 - 22.4 wt%). The amount of CaO in Meknes clays ranges from 8 to 12 wt%, whereas CaO is only present in some Tetouan clay (TE4, TE7, TN4 and TN5). A significant densification of ceramic behaviour could be noticed for most of Tetouan clays at firing temperatures above 1000˚C. Meknes clays show earlier densification from 800˚C. The chemical, textural and ceramic properties of Tetouan and Meknes clays indicate their suitability as raw materials for the production of structural ceramics. The high amount of Fe2O3 in all clays makes them inappropriate in fine ceramics.
*Corresponding author.

M. El Ouahabi et al.
146
Keywords Clay Materials, Ceramic Properties, Ceramic Suitability, Morocco
1. Introduction Throughout the world, clays are the main raw materials exploited in the fabrication of various ceramic products for building construction. Due to inherently complex physical, chemical and mineralogical characteristics, clays have unique properties related to their own natural genesis [1]-[4]. In most cases, for economic reasons, the ce- ramics industry relies on clays from nearby deposits. As a consequence, the clay characterization is important for the technical performance of local products [5] [6].
Pure clays do not occur in nature, they contain mixtures of different clay and associated minerals [7]-[9]. At present, many ceramic tiles are manufactured from mixtures of mineral raw materials, composed essentially of clays and materials such as quartz, feldspar and carbonates. In the fabrication process, the raw materials are mixed in variable proportions taking into account the influence of each component on the properties of the final products [10] [11]. The components that play fundamental roles for optimum processing, and hence perfor- mance of the final products, are clay fraction (<2 µm) for plasticity, feldspar for fluxing and silica as filler ma- terial [12]-[14]. The selection of the appropriate raw materials is based on specific criteria, which are related ei- ther to the behaviour during the different stages of manufacturing or to the overall chemical composition. The microstructure and properties of any ceramic depends on the characteristics of the raw materials and processing parameters [15] to assure the quality of ceramic products.
Morocco is among the world top 20 producers and consumers of clayey building materials (http://www.lematin.ma/reader-2007/files/lematin/2011/01/30). The industry of ceramic tiles and bricks is most frequent in northern Morocco. Natural clayey materials are abundant in this region. They play an important economic role with a national production of about 45% for building materials (bricks, ceramic tiles and refracto- ries). However, national ceramic production is still insufficient, and to fill this deficit the Moroccan government has to import ceramic products mainly from Spain, Italy and Egypt.
The Tetouan and Meknes area have large construction and development projects to meet the population growth in particular for social and luxury housing construction, which is experiencing a significant economic and tourism development. Meknes and Tetouan clays are currently used for the traditional production of small- scale ceramic factories. Meknes clays are used in small traditional pottery factories using local clays. Artisanal and semi-industrial exploitation of these clays, without any prior study, causes various problems during the manufacturing process, such as deformations and breakage of products.
The aim of this study is to evaluate the viability of the Tetouan and Meknes clay deposits as an industrial mineral resource by comparing their textural, chemical and thermal properties as well as drying and firing be- haviours.
2. Material The studied clayey raw materials were collected in the Tetouan and Meknes areas. The Tetouan clay deposit is located in north-western Morocco a few kilometres from the town of Tetouan, in the external Rif domain [16] [17] (Figure 1). A total of nineteen clay samples were collected in this area. There are two categories of samples: 10 clay samples collected from the exploited quarries labelled (TE) and 9 clays sampled from clay deposits, which are not yet exploited, labelled (TN). The Meknes clay deposit is located in north-central Morocco, about 15 km east of the town of Meknes, in the Saїss Basin zone situated in the Pre-Rif domain (Figure 1). Six Mio-cene yellow sandy clay samples [18] were collected from the quarries of pottery and artisanal ceramic.
A preliminary characterization of those clay materials was done in a previous study [19]. Tetouan clays are characterized by diversified mineralogical assemblages (in particular a variable proportion of clay, quartz and calcite) in contrast with to Meknes clays (high clay content, quartz and calcite). The clay fraction of Tetouan is dominated by illite and kaolinite with variable contributions of chlorite. Meknes clays are illite and kaolinite, associated with smectite. The studied clay materials consist generally of fine particles with medium to high plas- ticity and low organic matter content [19].

M. El Ouahabi et al.
147
Figure 1. Structural sketch map of the northern occidental part of the Rif Chain and the Northern central of Morocco (modified after [45]). 1—Foreland basement, 2—Meseta and Atlas cover series; 3—Foredeep basins; 4—Detached Atlasic cover at Prerif front; 5—Prerif; 6—Alpujarrides-Sebtide nappes; 7—Intrarif, Mesorif, Rif nappes; 8—Sud-Betic Zone; 9—Mag- hrebian Flyschs; 10—Dorsale calcaire units, 11—Malaguide- Ghomaride nappes.
3. Analytical Methods 3.1. Textural Properties The specific surface area of the samples was characterized by the analysis of nitrogen adsorption-desorption isotherms, performed at 77˚K. The measurements were performed using a sorptomatic Carlo Erba 1900, con- trolled by a computer (Industrial Chemistry, Department of Chemistry, ULg). The analysis of the isotherms was performed according to the methodology of Vallée, Keller [20], which provided specific surface area (SBET), mi-cropore volume calculated by the Dubinin-Radushkevich equation (VDUB), and total pore volume calculated from the adsorbed volume at saturation (Vp). The bulk density (ρs) was obtained by helium pycnometry on the powdered sample, using Micromeritics Accupyc 1330. Textural analyses were done at the laboratory of Indus- trial Chemistry (Department of Chemistry, ULg).
Cation Exchange Capacity (CEC) was measured by the Schollenberger method [21]. The samples were first saturated by ammonium acetate (1 N), and then the ammonium ions in the supernatant were deprotonated into ammonia with sodium hydroxide solution (0.1 N). The ammonia content was then determined by distillation into a known amount of acid and back-titrated by the Kjeldahl method [22].
3.2. Chemical and Thermal Properties The chemical composition of selected elements (Si, Al, Fe, Ca, Mn, Mg, Na, K, Ti, P and S) was measured as oxides on 2 g of dried and homogenized powder of clayey samples using a Bruker S8 Tiger wavelength-disper- sive X-Ray Fluorescence (WD-XRF) spectrometer equipped with a Rh anticathode (Department of Ecology and Environmental Sciences, Umeå University). Calibration was made using 35 commercially available certified reference materials of similar matrix (sedimentary rocks, river, lake and marine sediments, sands and soils). The accuracy ranges from 3% to 7% except for S (25%) and P (20%). Reproducibilites are above 99% except for S
100 km
Tetouan
Meknes
Gharb Basin
Meseta
Middle Atlas
Strait of Gibraltar
Atlant
ic Oce
an
Mediterranean Sea
1
3
5
9
11
2
76
10
4
8
M. El Ouahabi et al.
148
(89%) and P (97%). More details about the method and the calibration can be found in [23]. The same powdered samples were heated to 1000˚C for 2 h to determine the Loss On Ignition (L.O.I).
Differential scanning calorimetry (DSC) and thermogravimetry (TG) were conducted simultaneously using a NETZSCH STA 409 PC instrument (Industrial Chemistry, Department of Chemistry, ULg). Samples were heated from room temperature to 800˚C at 10˚C min−1 under atmospheric air [24].
3.3. Ceramic Properties Industrial tests were carried out as part of the ceramic evaluation process. Clay samples were dried at 105˚C for 24 hr and ground to a fine powder and then sieved using a mesh-size of 100 µm. Each clay sample was wetted in order to achieve the proper plasticity for modeling. The samples obtained with these shaping techniques were 4 cm long, 2 cm wide and 2 cm thick. The drying was done in a shaded and ventilated room. For different drying times, the mass and the value of the length were measured to calculate the linear shrinkage. The dried samples (24 h at shaded room plus 12 h at 105˚C in oven) were kiln-fired at different temperatures (800˚C, 850˚C, 900˚C, 950˚C, 1000˚C, 1050˚C and 1100˚C) over 1 h. The fired samples were tested for loss on ignition, shrinkage and water absorption capacity after firing. The linear shrinkage (LS) was determined following the conventional techniques. The water absorption capacity (WAC) was determined according to standard procedure UNE 67-027 [25], in fired clay pieces after each cooking cycle [26]. After preliminary measurements at the end of firing and cooling, the specimens of each batch were kept dry in an oven until their submission to water absorption. Each dry and cool specimen was weighed (P1) and the three were then immersed into clean water at 25˚C for 24 h. The specimens were removed from the water, their surfaces were wiped off and the weight (P2) of each was measured immediately. The water absorption capacity (WAC) was calculated as WAC = (P2 − P1)/P1 × 100%.
4. Results and Discussion 4.1. Textural Properties Specific surface area (SBET), pore volume (Vp), micropore volume (VDUB) and cation exchange capacity (CEC) of the samples are listed in Table 1. The surface area of the Meknes samples ranges from 33.3 to 37.9 m2∙g−1. Sample M1 has the highest specific surface area and M3 the lowest. According to these specific surface area values, M1 has less illite and smectite content, knowing that the specific surface area of kaolinite is usually smaller (10 - 20 m2∙g−1) with respect to that of illite (80 - 100 m2∙g−1) [27], but similar values for smectite (19 m2∙g−1) [28]. The Tetouan clays have specific surface area (SBET) values ranging between 17 and 36 m2∙g−1. Among them TE1, TE3 and TN9 display the highest SSA values due to their illite, kaolinite and interstratified clay contents [29].
The CEC values of the Meknes samples (9.0 - 20.6 meq∙100−1g) are higher than the Teouan clays (7.1 - 18.5 meq∙100−1g). The high CEC values of the Meknes samples may be explained by their smetite content [19], a mineral characterized by higher CEC value ranging between 80 and 150 meq∙100−1g [7].
The highest SBET and CEC of Meknes and some Tetouan clays (TN and TE) reflect their fine grain size, which is represented by the high amount of clay fraction. The highest SBET and CEC of those clays could cause a diffi- culty to dry and lead to the development of cracks in the drying process. The bulk density (ρs) of all clay sam- ples are almost similar, ranging from 2.7 to 3.2 g∙cm−3.
4.2. Chemical and Thermal Properties The most abundant oxides in the studied samples are SiO2, Al2O3, CaO and Fe2O3 (Table 2). According to the major element abundances, the samples are divided into two groups (Figure 2). The first group is characterized by very low CaO (<1.9%), slightly high Fe2O3 (from 12% to 22%) and high Al2O3 (from 29% to 44%) in com- parison to the second group. On the basis of their low CaO content, the first group is qualified as a non-cal- careous clay group, which is mainly represented by the Tetouan clays (TE and TN). The second group displays higher CaO (12% - 22%), slightly lower Al2O3 (20% - 25%) and lower Fe2O3 (8% - 12%) concentrations and is labelled as a moderate calcareous group. Group 2 consists of all the Meknes samples and TE4, TE7 from the ex- ploited Tetouan samples and TN4 and TN5 from unexploited Tetouan clays. The higher contents of Fe2O3 (>5%) in the samples give the reddish color of the clay-based products after firing. The L.O.I at 1000˚C (Table 2) ranges from 6% to 24%, which is associated with the presence of clay minerals, hydroxides and organic matter

M. El Ouahabi et al.
149
Table 1. Textural properties of the clay samples. SBET: specific surface area; Vp: pore volume; VDUB: mi-cropore volume; CEC: specific surface area; ρs: bulk density.
Samples SBET (m2∙g−1) Vp (cm3∙g−1) VDUB (cm3∙g−1) CEC (meq 100−1∙g) ρs (g∙cm−3)
±5 ±0.05 ±0.01 Meknes
M1 37.9 0.055 0.015 12.9 2.7
M2 36.3 0.055 0.015 9.1 2.7
M3 33.3 0.053 0.015 9.7 2.7
M4 36.3 0.053 0.015 10.1 2.7
M5 34.7 0.049 0.015 20.6 2.7
M6 35.2 0.094 0.015 12.5 2.7
Unexploitable Tetouan clays TN1 32.4 0.069 0.015 18.5 2.7
TN2 32.9 0.072 0.015 17.1 2.8
TN3 31.0 0.072 0.015 17.2 2.8
TN4 34.6 0.08 0.02 8.5 2.8
TN5 26.2 0.061 0.014 10.0 2.8
TN6 27.9 0.064 0.015 18.3 2.7
TN7 26.2 0.086 0.012 13.1 2.8
TN8 30.2 0.091 0.012 9.3 2.8
TN9 36.4 0.101 0.015 17.9 2.8
Exploitable Tetouan clays TE1 35.5 0.077 0.015 13.8 2.8
TE2 34.5 0.075 0.015 14.6 2.8
TE3 36.4 0.078 0.015 10.3 2.8
TE4 31.0 0.068 0.014 10.7 2.9
TE5 26.0 0.069 0.011 7.6 2.9
TE6 17.7 0.047 0.008 12.0 2.8
TE7 18.1 0.048 0.01 7.1 2.8
TE8 21.3 0.056 0.01 13.7 3.0
TE9 18.2 0.048 0.008 18.1 3.2
TE10 27.0 0.062 0.015 17.6 2.8
[7] [30]. These material losses are confirmed by the thermal analysis and organic matter content as indicated in Figure 3 and Table 2.
The DSC/TG (Figure 3(a) and Figure 3(b)) show at least 4 peaks. The first endothermic peak is observed at 90˚C - 150˚C for Tetouan samples and between 96˚C and 113˚C for Meknes samples. Such peaks can be attrib- uted to the removal of adsorbed and interlayered water. The associated mass lost ranges from 0.4% to 0.8% for Meknes clays and between 0.4% and 1.3% for Tetouan clays. A large exothermic peak is observed between 200˚C - 450˚C. Due to organic matter decomposition [31], it was observed in all studied clays, but was espe- cially well marked at 450˚C for M6. A broad endothermic band, sintered at 520˚C to 550˚C for Meknes samples

M. El Ouahabi et al.
150
Table 2. Chemical composition of the clay samples.
SiO2 Al2O3 Fe2O3 CaO MnO MgO Na2O K2O TiO2 P2O5 SO2 Loss On Ignition
Meknes
M1 44.9 24.83 14.20 11.38 0.06 2.69 0.81 4.12 0.75 0.28 0.22 17.85
M2 42.7 24.83 12.16 12.67 0.05 2.34 0.78 4.07 0.75 0.25 0.08 17.37
M3 41.3 21.05 15.63 8.15 0.04 2.67 0.84 3.37 0.65 0.24 0.42 18.77
M4 43.1 22.67 13.18 9.95 0.05 2.42 0.84 3.71 0.70 0.24 0.08 17.61
M5 41.0 23.84 14.83 11.70 0.07 1.82 0.67 3.61 0.73 0.22 0.02 18.29
M6 43.1 24.15 12.40 10.47 0.05 2.55 0.92 3.83 0.72 0.26 0.52 16.77
Unexploitable Tetouan clays
TN1 45.5 30.53 15.84 0.69 0.08 2.06 0.94 3.57 0.90 0.13 0.10 9.90
TN2 47.7 34.58 18.96 0.39 0.03 2.44 0.92 3.49 1.05 0.13 0.00 9.24
TN3 47.1 35.48 22.39 0.25 0.05 2.59 1.16 3.30 1.03 0.14 0.02 8.93
TN4 35.9 20.63 9.75 20.94 0.14 2.14 1.05 3.54 0.53 0.17 0.84 23.90
TN5 35.9 20.90 9.86 22.16 0.15 2.24 1.05 3.52 0.52 0.15 0.68 24.41
TN6 47.6 32.69 14.53 0.48 0.06 1.94 0.86 3.08 0.97 0.12 0.00 8.87
TN7 54.3 30.95 13.38 0.73 0.04 1.94 1.16 2.84 0.90 0.11 0.02 7.48
TN8 51.1 30.46 12.24 1.90 0.03 1.72 1.29 2.89 0.93 0.13 0.10 7.94
TN9 44.2 29.66 15.07 4.55 0.10 1.63 0.89 2.89 1.05 0.27 0.02 11.65
Exploitable Tetouan clays
TE1 48.6 32.39 17.01 0.45 0.03 1.68 1.78 4.36 0.97 0.18 0.00 7.20
TE2 52.7 31.44 18.01 0.45 0.05 2.36 1.35 2.91 0.83 0.22 0.08 6.82
TE3 54.3 31.48 11.49 0.42 0.03 1.76 1.73 3.95 0.85 0.16 0.02 7.05
TE4 36.7 25.39 9.92 11.84 0.10 6.00 0.94 5.13 0.67 0.10 0.02 19.52
TE5 51.9 33.97 18.10 0.45 0.03 1.89 1.91 4.43 1.00 0.19 0.00 8.72
TE6 51.5 33.78 17.47 0.49 0.03 1.76 1.91 4.41 1.00 0.18 0.06 6.57
TE7 35.0 20.63 8.61 17.67 0.18 5.36 0.81 3.88 0.55 0.11 0.02 21.35
TE8 44.3 43.95 19.87 0.38 0.03 1.19 0.84 6.91 0.78 0.08 0.02 11.13
TE9 48.3 42.40 16.64 0.31 0.02 0.85 1.13 6.07 0.72 0.05 0.02 8.95
TE10 47.6 34.46 20.87 0.41 0.05 2.40 1.11 3.32 1.02 0.14 0.02 8.96
and at 523˚C to 568˚C for Tetouan area samples, is due to clay mineral dehydroxylation and α quartz → β quartz transformation [25]. A substantial loss of weight (5% - 7%) is associated with this endothermic peak for Tetouan samples. As an exception, some Tetouan samples (TN4, TN5, TE7 and TE4) lost less than 3% weight. Meknes samples lost about 4%, demonstrated by elevated clay and quartz content in this area. Small additional endo- thermic peaks occurred in all samples at 700˚C, which are due to carbonate decomposition [32].
4.3. Ceramic Properties 4.3.1. Drying Behaviour Bigot’s curves (Figure 4) were used as preliminary indicators in the choice of raw materials [33] for the ce- ramic industry. The drying is accompanied by shrinkage of the clay materials, due to porewater loss. The Bigot’s curves exhibit the two characteristic phases of the drying process: an initial weight loss with shrinkage and successive weight loss with no further shrinkage. The behaviour of all Meknes clay samples was somewhat

M. El Ouahabi et al.
151
Figure 2. Ternary plot of: (a) Al2O3-CaO-Na2O + K2O; and (b) Al2O3-CaO-Fe2O3 (all in wt%) for studied clay samples.
similar (Figure 4), although there were some small differences in shrinkage, ranging from 12% to 17%, accom- panied by a loss of weight from 19% to 22%. Tetouan clay samples showed a low drying shrinkage (2% - 6%), in contrast to the Meknes clay samples. Tetouan clays showed a greater increase of the loss on weight (20% - 23%). The highest linear shrinkage of Meknes clays can be explained by its smectite content and its high PI value [34]. Consequently Meknes clays have more problematic drying behaviour. By contrast, Tetouan (TN and TE clays) showed a low drying shrinkage, and they have more suitable behaviour.
4.3.2. Firing behaviour The results for linear firing shrinkage, loss on mass and water absorption of the fired clays are displayed in Ta-ble 3 and Figure 5, respectively. Linear firing shrinkage and water absorption have been frequently used as quality and process control parameters in the development and manufacturing stages of the production of struc- tural ceramics such as floor and wall tiles [35] [36]. The linear firing shrinkage could be used as a direct meas- ure of the extent of densification [37]. The linear firing shrinkage increased gradually from 1000˚C to 1110˚C for most of the Tetouan clays (TN and TE). This evolution reflects densification of the fired clays. As an excep- tion, some fired clays (TE5, TE7 and TE8) do not show any shrinkage. At 800˚C, Meknes clays shrank from 17% to 29% and their shrinkage increased again gradually from 850˚C to 1110˚C. Meknes clays are characterized by an early densification from 800˚C. This is due to the formation of a glassy phase, because they contain large amounts of fluxing agents (Na2O, K2O and MgO) (Table 2). Loss on weight stability is indicated from 1000˚C for most of the sintered clay bodies (Table 3). It can be seen that an increase in the shrinkage with a decrease in water absorption are associated with an increase in firing temperature. This trend is found especially above 1000˚C. Shrinkage is related to the formation of high temperature crystalline phases, and the rates of shrinkage

M. El Ouahabi et al.
152
(a)
(b)
Figure 3. (a) Schematic representation of the thermal analysis (ATD/TG) of the clay samples; (b) Some examples of TG/ DSC curves.

M. El Ouahabi et al.
153
Figure 4. Bigot’s diagram of the examined clay samples.
are directly related to the development of glassy material. Formation of gases during vitrification can also have a significant effect on the net dimensions of fired clay minerals. The greatest shrinkage above 1000˚C is due to a more significant liquid phase formation. During liquid phase formation, the liquid surface tension and capillarity help to bring particles close together and reduce porosity [38].
A significant decrease of the water absorption is observed for Tetouan clays (TE and TN) from 1000˚C (Fig- ure 5). As an exception, TE4 and TN4 present the highest water absorption capacity (about 18%). The Meknes clays have high water absorption capacity, ranging from 9% to 21%. At 1100˚C, the water absorption of Te- touan clays decreased to 0.4% and 2.6% for TE6 and TN8, respectively, indicating the total vitrification of those clays. For Meknes clays, the water absorption decreased from 6% to 13%, with the exception of M1, which had 20% (Figure 5).
4.4. Suitability for Ceramics Applications The suitability of raw clay for their use in the manufacture of ceramic products is determined by mineralogy,

M. El Ouahabi et al.
154
Table 3. Linear shrinkage (%) of the studied clays during firing process.
800˚C 850˚C 900˚C 950˚C 1000˚C 1050˚C 1100˚C
Meknes clays
M1 29.8 23.9 21.7 21.5 21.6 21.4 20.3
M2 19.3 15.3 10.2 9.7 10.2 9.6 8.8
M3 21.8 16.0 14.4 13.9 14.2 14.1 13.8
M4 18.6 13.7 9.3 9.0 9.1 9.0 7.4
M5 18.2 14.2 9.2 8.5 8.8 8.0 7.2
M6 17.4 12.9 9.1 8.8 9.2 8.6 6.7
Unexploitable Tetouan clays
TN1 0 0 0 0 3.2 3.2 3.2
TN2 0 0 3.1 3.1 3.1 3.1 6.3
TN3 0 0 3.1 3.1 3.1 3.1 3.1
TN4 0 0 2.9 2.9 2.9 2.9 2.9
TN5 0 0 0 0 3.1 3.1 3.1
TN6 0 0 0 0 0 0 3.2
TN7 0 0 0 0 0 3.1 3.1
TN8 0 0 0 0 3.2 3.2 3.2
TN9 0 0 3 3 3 6.1 6.1
Exploitable Tetouan clays
TE1 0 0 3.1 3.1 3.1 3.1 6.3
TE2 0 0 3.3 3.3 3.3 3.3 3.3
TE3 0 0 3.1 3.1 3.1 3.1 6.3
TE4 0 0 3.3 3.3 3.3 3.3 3.3
TE5 0 0 0 0 0 0 0
TE6 0 0 3.1 3.1 3.1 6.3 6.3
TE7 0 0 0 0 0 0 0
TE8 0 0 0 0 0 0 0
TE9 0 0 0 0 3.1 3.1 6.3
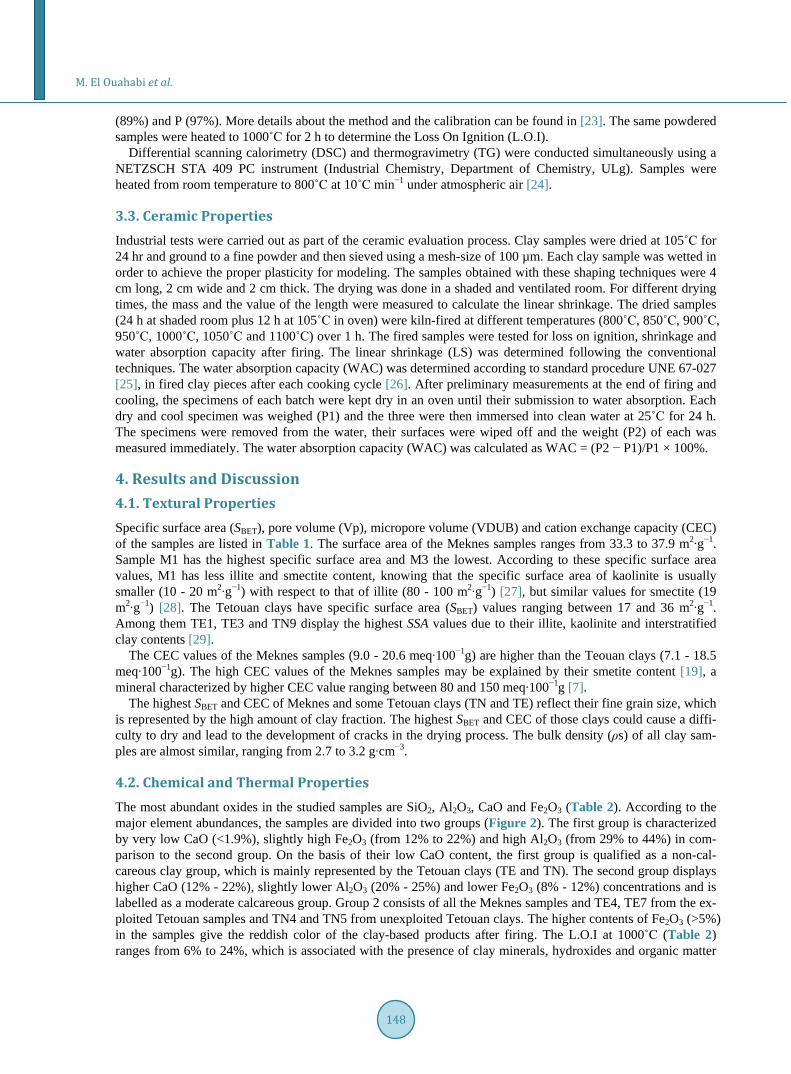
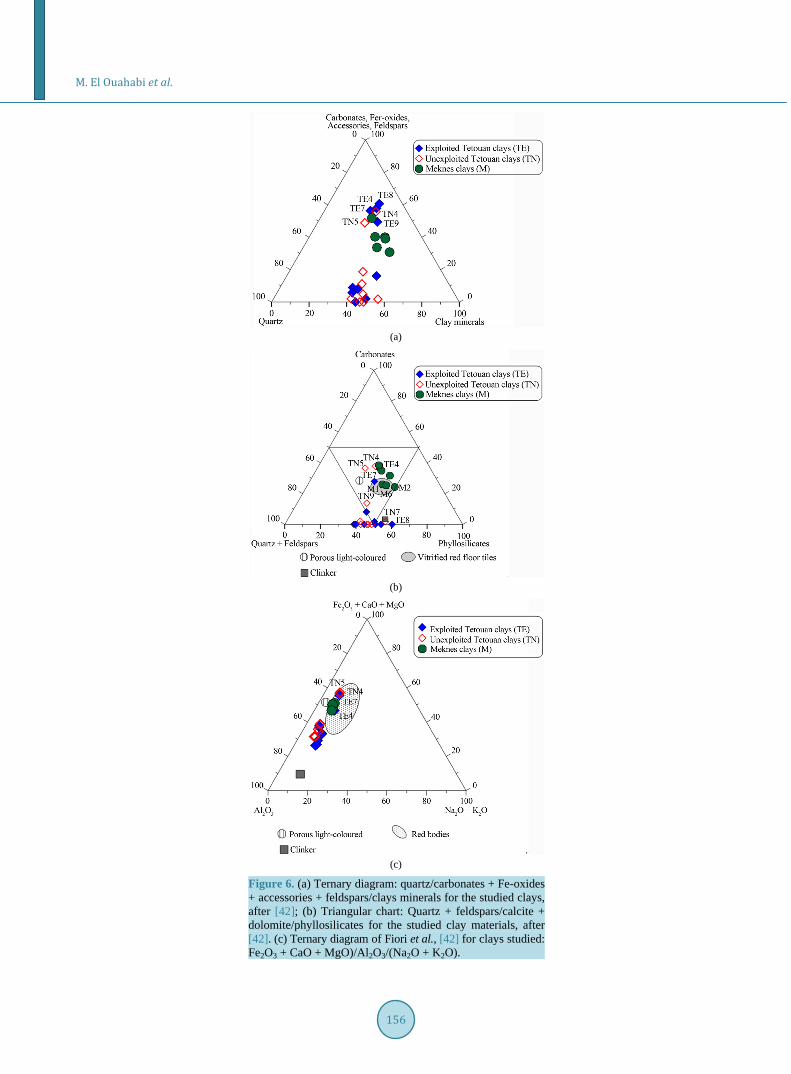
chemistry and physical properties of the material. These factors will determine the behaviour of the clay during forming, drying and firing with direct influence on the final product [39]. In order to evaluate the suitability of the studied clays for different ceramic products, a ternary diagram from [40] based on XRD results [19] is shown in Figure 6(a). Two groups can be identified: those with high quartz contents and those that are rich in oxides, carbonates and feldspars. The mineralogical data for the samples (Figure 6(b)) also suggest that most of the Meknes clays can be used for vitrified red floor tile making. However Tetouan clays can be used for differ- ent ceramic applications due to their high quartz amount and their low amount of iron oxide. TN7 and TE9 may be used for making clinker products and TE7 for vitrified red floor tiles (Figure 6(c)). Some Tetouan samples (TN5, TN9 and TE7) are located close to the porous light-coloured field; they can therefore be used for porous light-coloured wall tile product.
The ternary diagram (Fe2O3 + CaO + MgO)/Al2O3/(Na2O + K2O) (Figure 6(c)) is used to classify raw clay

M. El Ouahabi et al.
155
Figure 5. Influence of firing temperature on the variation of linear shrinkage and loss on weight.
materials and industrial ceramic bodies [40]. All Meknes clays plot in the field of red ceramics, close to the field for porous light-coloured ceramics. Most of the Tetouan clays were located outside of the red ceramics field, with the exception of TE4, TE7, TN4 and TN5, which are close to the field for porous light-coloured ceramics. The ideal composition for an optimum white body product (SiO2 = 72 wt%, Al2O3 and total oxides = 8 wt%)
M. El Ouahabi et al.
156
(a)
(b)
(c)
Figure 6. (a) Ternary diagram: quartz/carbonates + Fe-oxides + accessories + feldspars/clays minerals for the studied clays, after [42]; (b) Triangular chart: Quartz + feldspars/calcite + dolomite/phyllosilicates for the studied clay materials, after [42]. (c) Ternary diagram of Fiori et al., [42] for clays studied: Fe2O3 + CaO + MgO)/Al2O3/(Na2O + K2O).

M. El Ouahabi et al.
157
was estimated by Fiori et al., [40], Wilson [41] and Baccour et al., [42], who stated that clays containing 8% or more of Fe2O3 are red-firing clays. In this context, none of the Meknes and Tetouan clays can be used for the production of fine ceramics, due to their high Fe2O3 amount (>8%). Such application would require processing to reduce this iron oxide content. However, Tetouan clays could be considered as raw materials for structural ceramic products.
The high firing shrinkage for M1 and M3 from Meknes area (>10%) make them inappropriate to make ce- ramics, due to the risk of dimensional defects. Water absorption can restrict the use of ceramics as building ma- terial [37] [44]. Ceramics used as flooring should have a water absorption <1%, roofing tiles <20%. Some Te- touan (TE1, TE2, TE3, TE6, TE9 and TN8) clays can also be used as flooring. Meknes clays and most of unex- ploited Tetouan clays show adequate water absorption for a use as roofing tiles.
5. Conclusions Tetouan and Meknes clay materials are composed mainly of SiO2, Al2O3, and Fe2O3. Meknes clays are charac- terized by a higher CaO content.
The ceramic behaviours of Tetouan and Meknes clays were interpreted by drying shrinkage, linear firing shrinkage, loss on weight and water absorption. Meknes clays are characterized by a high drying shrinkage, and therefore there will be more difficulty to dry the samples. To solve this problem, sand could be added to reduce their plasticity. Tetouan clays show optimal drying shrinkage. All the fired ceramic properties show moderate changes from 800˚C to 1000˚C. However, significant changes are observed above 1000˚C. An increase in the firing shrinkage and associated with a decrease in the water absorption are especially observed from 1100˚C.
Meknes clays and most of Tetouan clays (TE1, TE2, TE3, TE6, TE9 and TN8) can be used on flooring pro- duction. In addition some exploited Tetouan clays and currently unexploited Tetouan clays are also suitable for making roofing tiles. Meknes clays and most of the Tetouan clays can be used for different ceramic applications due to their high quartz amount and their small iron oxide amount. Only TN7 and TE9 are being used for mak- ing clinker products.
This study demonstrates that exploited Tetouan and Meknes raw clay are suitable for the manufacture of structural ceramic products, with or without additives depending on the ceramic type. New clay outcrops such as unexploited Tetouan clays are also suitable. They constitute a potential ceramic raw material for growing Mo- roccan ceramic tile industry, and are thus not limited to artisanal production.
Acknowledgements The WD-XRF data acquisition was made possible at Umeå University through a research grant from the Kempe Foundation to Richard Bindler. The authors would like to thank René Pirard (Laboratoire de Génie Chimique, Université de Liège, Belgium) for the Calorimetry (ATD-TG) and specific surface area (SSA) analyses. We would like to thank Anne Iserentant (Université catholique de Louvain) for the CEC analysis. Finally, our thanks go to Dekayir (Université de Marrakech, Morocco) for his help on the field.
References [1] Bauluz, B., Mayayo, M.J., Fernández-Nieto, C., Cultrone, G. and González López, J.M. (2003) Assessment of Tech-
nological Properties of Calcareous and Non-Calcareous Clays Used for the Brick-Making Industry of Zaragoza (Spain). Applied Clay Science, 24, 121-126. http://dx.doi.org/10.1016/S0169-1317(03)00152-2
[2] Gomes, C. (1989) Argilas. O que sãoe para que servem. Fundação Calouste Gulbenkian, Lisboa. [3] Hajjaji, M., Kacim, S. and Boulmane, M. (2002) Mineralogy and Firing Characteristics of a Clay from the Valley of
Ourika (Morocco). Applied Clay Science, 21, 203-212. http://dx.doi.org/10.1016/S0169-1317(01)00101-6 [4] Verduch, A.G. (1995) Características de las Arcillas Empleadas en la Fabricación de Ladrillos. Técnica Cerámica, 232,
214-228. [5] Fabbri, B. (1994) Quality Assurance of Ceramic Clays—A Deeper Understanding. Schmid, Freiburg, Allemagne. [6] Sánchez, E., Ginés, F., Agramunt, J. and Monzó, M. (1998) Control de calidad de las arcillas empleadas en la
fabricación de los soportes de baldosas cerámicas. Proceedings Qualicer, 98, 97-112. [7] Grim, R.E. (1968) Clay Mineralogy. McGraw-Hill, New York. [8] Moore, D.M. and Reynolds, R.C. (1997) X-Ray Diffraction and the Identification and Analysis of Clay Minerals.

M. El Ouahabi et al.
158
Oxford University Press, Oxford, New York. [9] Bergaya, F. and Lagaly, G. (2006) Chapter 1. General Introduction: Clays, Clay Minerals, and Clay Science. In: Faïza
Bergaya, B.K.G.T. and Gerhard, L., Eds., Developments in Clay Science, 1-18. [10] Sousa, S.J.G. and Holanda, J.N.F. (2005) Development of Red Wall Tiles by the Dry Process Using Brazilian Raw
Materials. Ceramics International, 31, 215-222. http://dx.doi.org/10.1016/j.ceramint.2004.05.003 [11] Sousa, S. and Holanda, J. (2007) Thermal Transformations of Red Wall Tile Pastes. Journal of Thermal Analysis and
Calorimetry, 87, 423-428. http://dx.doi.org/10.1007/s10973-006-7030-7 [12] Kamseu, E., Leonelli, C., Boccaccini, D.N., Veronesi, P., Miselli, P., Pellacani, G. and Melo, U.C. (2007) Characteri-
sation of Porcelain Compositions Using Two China Clays from Cameroon. Ceramics International, 33, 851-857. http://dx.doi.org/10.1016/j.ceramint.2006.01.025
[13] Alcântara, A.C.S., Beltrão, M.S.S., Oliveira, H.A., Gimenez, I.F. and Barreto, L.S. (2008) Characterization of Ceramic Tiles Prepared from Two Clays from Sergipe-Brazil. Applied Clay Science, 39, 160-165. http://dx.doi.org/10.1016/j.clay.2007.05.004
[14] Celik, H. (2010) Technological Characterization and Industrial Application of Two Turkish Clays for the Ceramic In- dustry. Applied Clay Science, 50, 245-254. http://dx.doi.org/10.1016/j.clay.2010.08.005
[15] Kingery, W., Bowen, H. and Uhlmann, D. (1976) Introduction to Ceramics. John Wiley & Sons, New York. [16] Durand Delga, M., Hottinger, L., Marcáis, J., Mattauer, M., Lilliard, Y. and Suter, G. (1960-1962) Livre à la mémoire
du Professeur Paul Fallot consacré à l’évolution paléogéographique et structurale des domaines méditerranéens et alpins d’Europe. Vol. 1, Société géologique de France, Paris, 399-422.
[17] Wildi, W. (1983) La chaîne tello-rifaine (Algérie, Maroc, Tunisie): Structure, stratigraphie et évolution du Trias au Miocène. Revue de Géologie Dynamique et Géographie Physique, 24, 201-297.
[18] Aït Brahim, L. (1991) Tectonique cassante et états de contraintes récentes au nord du Maroc. Thèse de doctorat de l’Université Mohamed, 360.
[19] El Ouahabi, M., Daoudi, L. and Fagel, N. (2014) Preliminary Mineralogical and Geotechnical Characterization of Clays from Morocco: Application to Ceramic Industry. Clay Minerals, 49, 1-17.
[20] Lecloux, A.J. (1981) Texture of Catalysts. In: Anderson, J.R. and Boudart, M., Eds., Catalysis, Science and Techno- logy, Vol. 2, Springer, Berlin, 171-230.
[21] Schollenberger, C.J. and Simon, R.H. (1945) Determination of Exchange Capacity and Exchangeable Bases in Soil- Ammonium Acetate Method. Soil Science, 59, 13-24. http://dx.doi.org/10.1097/00010694-194501000-00004
[22] Mackenzie, R.C. (1952) A Micromethod for Determination of Cation Exchange Capacity of Clay. Clay Minerals Bulletin, 1, 203-204. http://dx.doi.org/10.1180/claymin.1952.001.7.03
[23] Vleeschouwer, F.D., Renson, V., Claeys, P., Nys, K. And Bindler, R. (2011) Quantitative WD-XRF Calibration for Small Ceramic Samples and Their Source Material. Geoarchaeology, 26, 440-450. http://dx.doi.org/10.1002/gea.20353
[24] Abajo, M. (2000) Manual sobre Fabricación de Baldosas. Tejas y Ladrillos. In: Beralmar, S.A., Ed., Barcelona. [25] U. 67-027-84 (1984) Determinacion de la absorcion de agua de ladrillos de arcilla. Instituto Espanol de Normalizacion,
AENOR. [26] I. 10545-3 (1995) International Standard for Ceramic Tiles—Part 3. Determination of Water Absorption, Apparent
Porosity, Apparent Relative Density and Bulk Density. International Organization for Standardization. [27] Ferrari, S. and Gualtieri, A.F. (2006) The Use of Illitic Clays in the Production of Stoneware Tile Ceramics. Applied
Clay Science, 32, 73-81. http://dx.doi.org/10.1016/j.clay.2005.10.001 [28] Ravichandran, J. and Sivasankar, B. (1997) Properties and Catalytic Activity of Acid-Modified Montmorillonite and
Vermiculite. Clays and Clay Minerals, 45, 854-858. http://dx.doi.org/10.1346/CCMN.1997.0450609 [29] Omotoso, O., Mikula, R.J. and Stephens, P.W. (2002) Surface Area of Interstratified Phyllosilicates in Athabasca oil
Sands from Synchrotron XRD. Advances in X-Ray Analysis, 45, 363-391. [30] Milheiro, F.A.C., Freire, M.N., Silva, A.G.P. and Holanda, J.N.F. (2005) Densification Behaviour of a Red Firing
Brazilian Kaolinitic Clay. Ceramics International, 31, 757-763. http://dx.doi.org/10.1016/j.ceramint.2004.08.010 [31] Baccour, H., Medhioub, M., Jamoussi, F. and Mhiri, T. (2009) Influence of Firing Temperature on the Ceramic
Properties of Triassic Clays from Tunisia. Journal of Materials Processing Technology, 209, 2812-2817. http://dx.doi.org/10.1016/j.jmatprotec.2008.06.055
[32] Yariv, S. (2004) The Role of Charcoal on DTA Curves of Organo-Clay Complexes: An Overview. Applied Clay Science, 24, 225-236. http://dx.doi.org/10.1016/j.clay.2003.04.002
[33] Štubna, I., Chmelík, F., Trník, A. and Šín, P. (2012) Acoustic Emission Study of Quartz Porcelain during Heating up to 1500˚C. Ceramics International, 38, 6919-6922. http://dx.doi.org/10.1016/j.ceramint.2012.05.021

M. El Ouahabi et al.
159
[34] Maitra, S., Choudhury, A., Das, H.S. and Pramanik, M. (2005) Effect of Compaction on the Kinetics of Thermal Decomposition of Dolomite under Non-Isothermal Condition. Journal of Materials Science, 40, 4749-4751. http://dx.doi.org/10.1007/s10853-005-0843-0
[35] Dondi, M., Fabbri, B. and Guarini, G. (1998) Grain-Size Distribution of Italian Raw Materials for Building Clay Products: A Reappraisal of the Winkler Diagram. Clay Minerals, 33, 435-442. http://dx.doi.org/10.1180/000985598545732
[36] Manning, D.A.C. (1995) Introduction to Industrial Minerals. Chapman & Hall, London. http://dx.doi.org/10.1007/978-94-011-1242-0
[37] Correia, S.L., Curto, K.A.S., Hotza, D. and Segadães, A.M. (2004) Using Statistical Techniques to Model the Flexural Strength of Dried Triaxial Ceramic Bodies. Journal of the European Ceramic Society, 24, 2813-2818. http://dx.doi.org/10.1016/j.jeurceramsoc.2003.09.009
[38] Correia, S.L., Hotza, D. and Segadães, A.M. (2004) Simultaneous Optimization of Linear Firing Shrinkage and Water Absorption of Triaxial Ceramic Bodies Using Experiments Design. Ceramics International, 30, 917-922. http://dx.doi.org/10.1016/j.ceramint.2003.10.013
[39] Shepard, F.P. (1954) Nomenclature Based on Sand-Silt-Clay Ratios. Journal of Sedimentary Petrology, 24, 151-158. [40] Monteiro, S.N. and Vieira, C.M.F. (2004) Influence of Firing Temperature on the Ceramic Properties of Clays from
Campos dos Goytacazes, Brazil. Applied Clay Science, 27, 229-234. http://dx.doi.org/10.1016/j.clay.2004.03.002 [41] Mardare, C.C., Mardare, A.I., Fernandes, J.R.F., Joanni, E., Pina, S.C.A., Fernandes, M.H.V. and Correia, R.N. (2003)
Deposition of Bioactive Glass-Ceramic Thin-Films by RF Magnetron Sputtering. Journal of the European Ceramic Society, 23, 1027-1030. http://dx.doi.org/10.1016/S0955-2219(02)00278-9
[42] Fiori, C., Fabbri, B., Donati, G. and Venturi, I. (1989) Mineralogical Composition of the Clay Bodies Used in the Italian Tile Industry. Applied Clay Science, 4, 461-473. http://dx.doi.org/10.1016/0169-1317(89)90023-9
[43] Murray, H.H. (2007) Applied Clay Mineralogy, Vol. 2, Developments in Clay Science. Elsevier B.V., Amsterdam. [44] Machado, A.T., Valenzuela-Diaz, F.R., de Souza, C.A.C. and de Andrade Lima, L.R.P. (2011) Structural Ceramics
Made with Clay and Steel Dust Pollutants. Applied Clay Science, 51, 503-506. http://dx.doi.org/10.1016/j.clay.2011.01.004
[45] Saadi, M., Hilali, E.A. and Boudda, A. (1980) Carte Géologique de la chaîne Rifaine—Echelle 1:500.000. Ministere de l’Energie et des Mines, Direction de Géologie, Service de Géologie du Maroc. Notes et Mémoires, No. 245.